Pak1 kinase controls cell shape through ribonucleoprotein granules
- Department of Biochemistry and Cell Biology, The Geisel School of Medicine at Dartmouth, United States
Figures
Figure 1 with 2 supplements
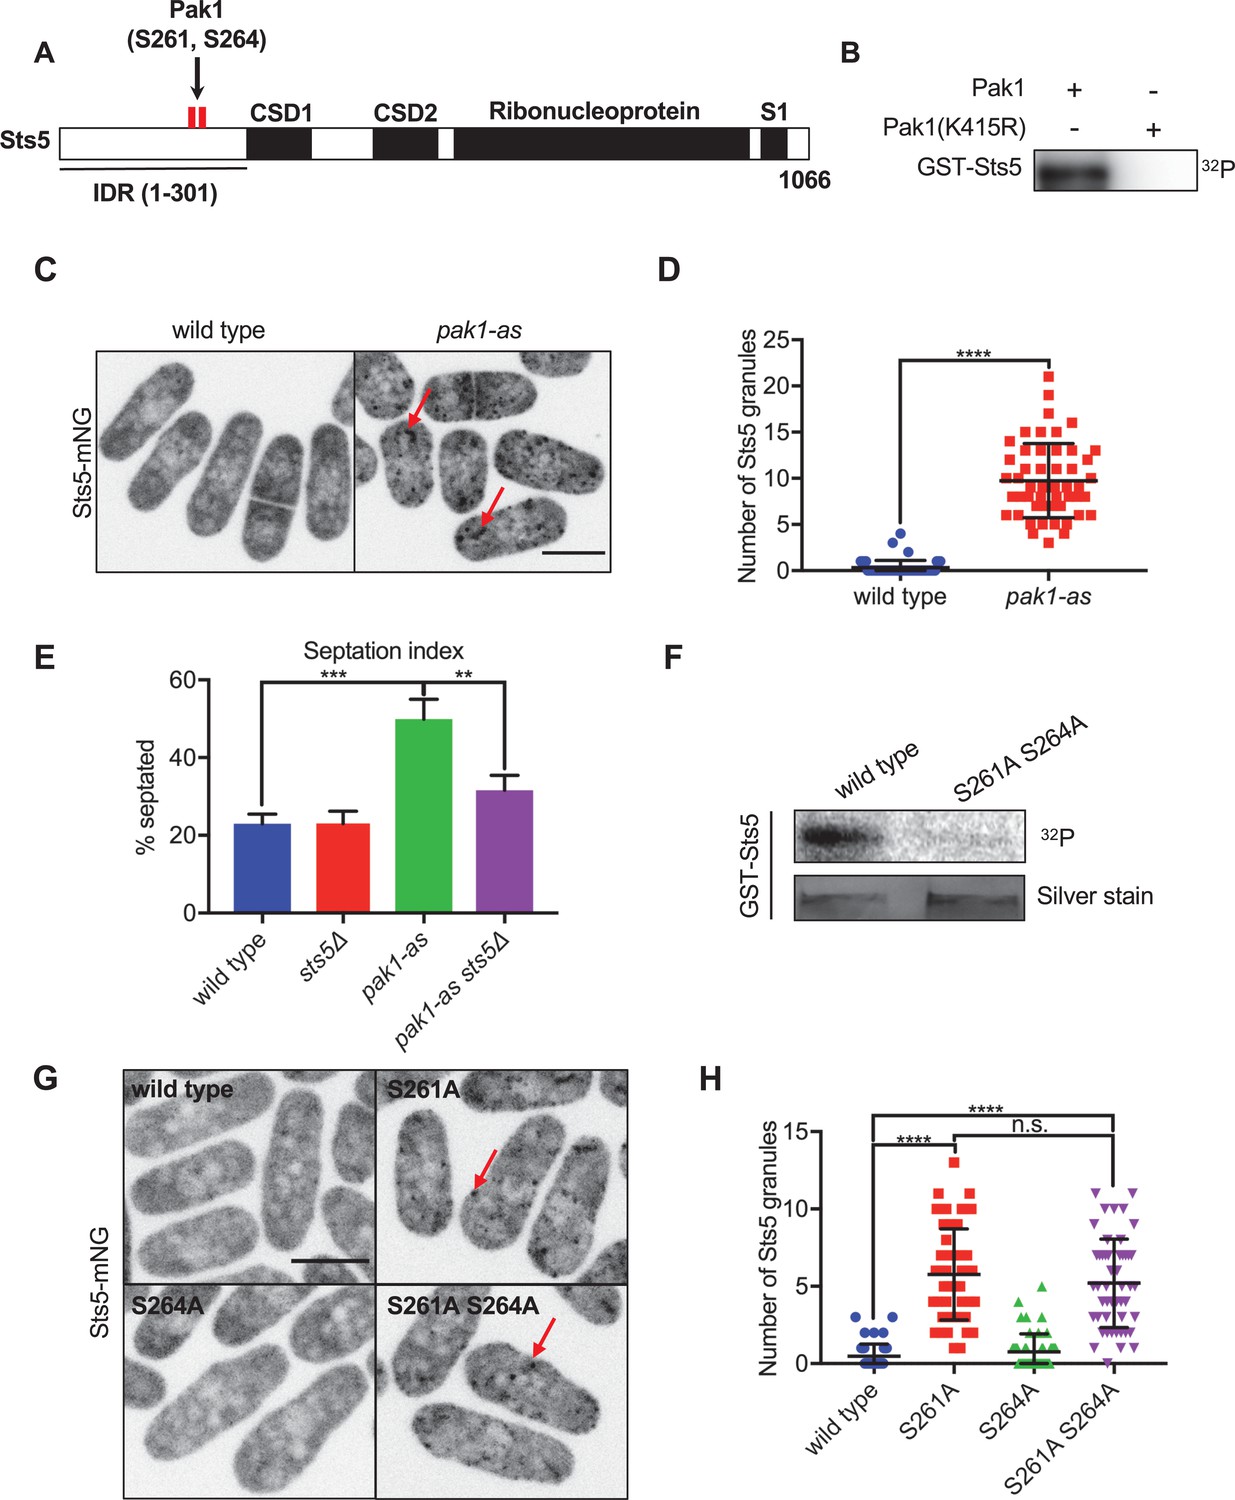
Pak1 directly phosphorylates RNA-binding protein Sts5 to control its localization.
(A) Schematic of Sts5 domain layout. Pak1-dependent phosphorylation sites are indicated by red lines. IDR: intrinsically disordered region; CSD: cold shock domain. (B) In vitro kinase assay with purified proteins and γ-32P-ATP. (C) Sts5-mNG localization in wildtype versus pak1-as cells. (D) Quantification of the number of Sts5-mNG granules per cell. Values are mean ± SD (n = 50 cells per strain). ****p<0.0001. (E) Quantification of septation index of indicated strains. Values are mean ± SD from three biological replicates (n > 150 cells each). ***p<0.001; **p<0.01. (F) In vitro kinase assay with purified proteins and γ-32P-ATP. GST-Sts5 protein loading was assessed by SDS-PAGE followed by silver staining. (G) Sts5-mNG localization in indicated strains. (H) Quantification of Sts5-mNG granule number per cell. Values are mean ± SD (n = 50 cells per strain). ****p<0.0001. n.s.: not significant. Images in (C) and (G) are maximum intensity projections from spinning disc confocal microscopy. Scale bars, 5 μm.
-
Figure 1—source data 1
Raw values shown on graphs in Figure 1D,E and H.
- https://cdn.elifesciences.org/articles/67648/elife-67648-fig1-data1-v2.xlsx
-
Figure 1—source data 2
Original files of the full raw unedited gels in Figure 1.
- https://cdn.elifesciences.org/articles/67648/elife-67648-fig1-data2-v2.tif
-
Figure 1—source data 3
Original files of the full raw unedited gels in Figure 1.
- https://cdn.elifesciences.org/articles/67648/elife-67648-fig1-data3-v2.tif
-
Figure 1—source data 4
Original files of the full raw unedited gels in Figure 1.
- https://cdn.elifesciences.org/articles/67648/elife-67648-fig1-data4-v2.tif
Figure 1—figure supplement 1
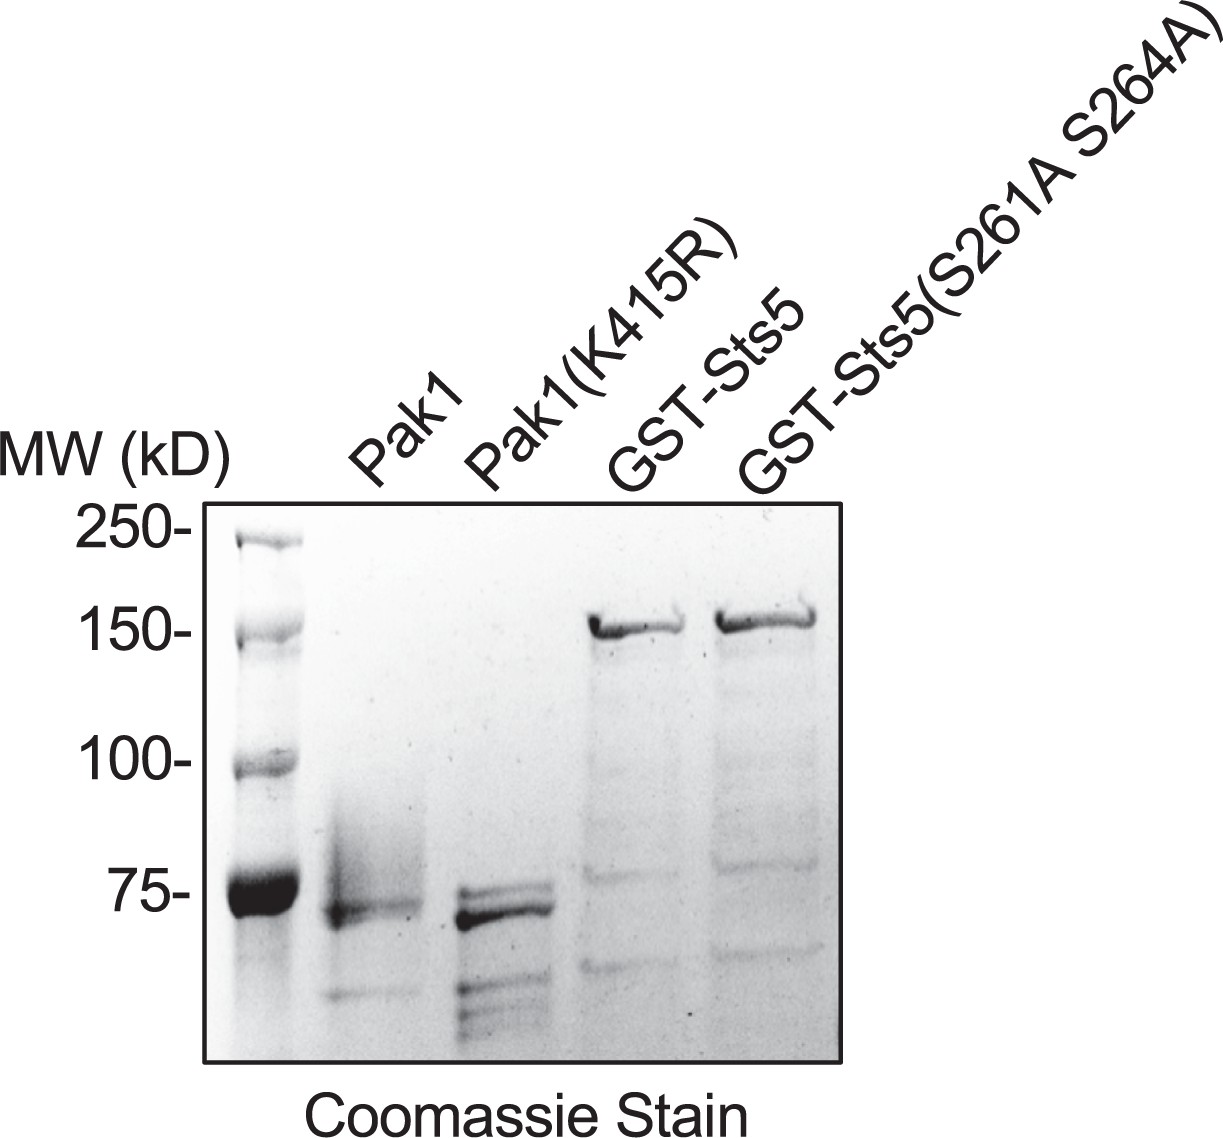
Purified proteins for in vitro kinase assays.
Purified proteins were separated by SDS-PAGE and visualized by Coomassie stain.
Figure 1—figure supplement 2
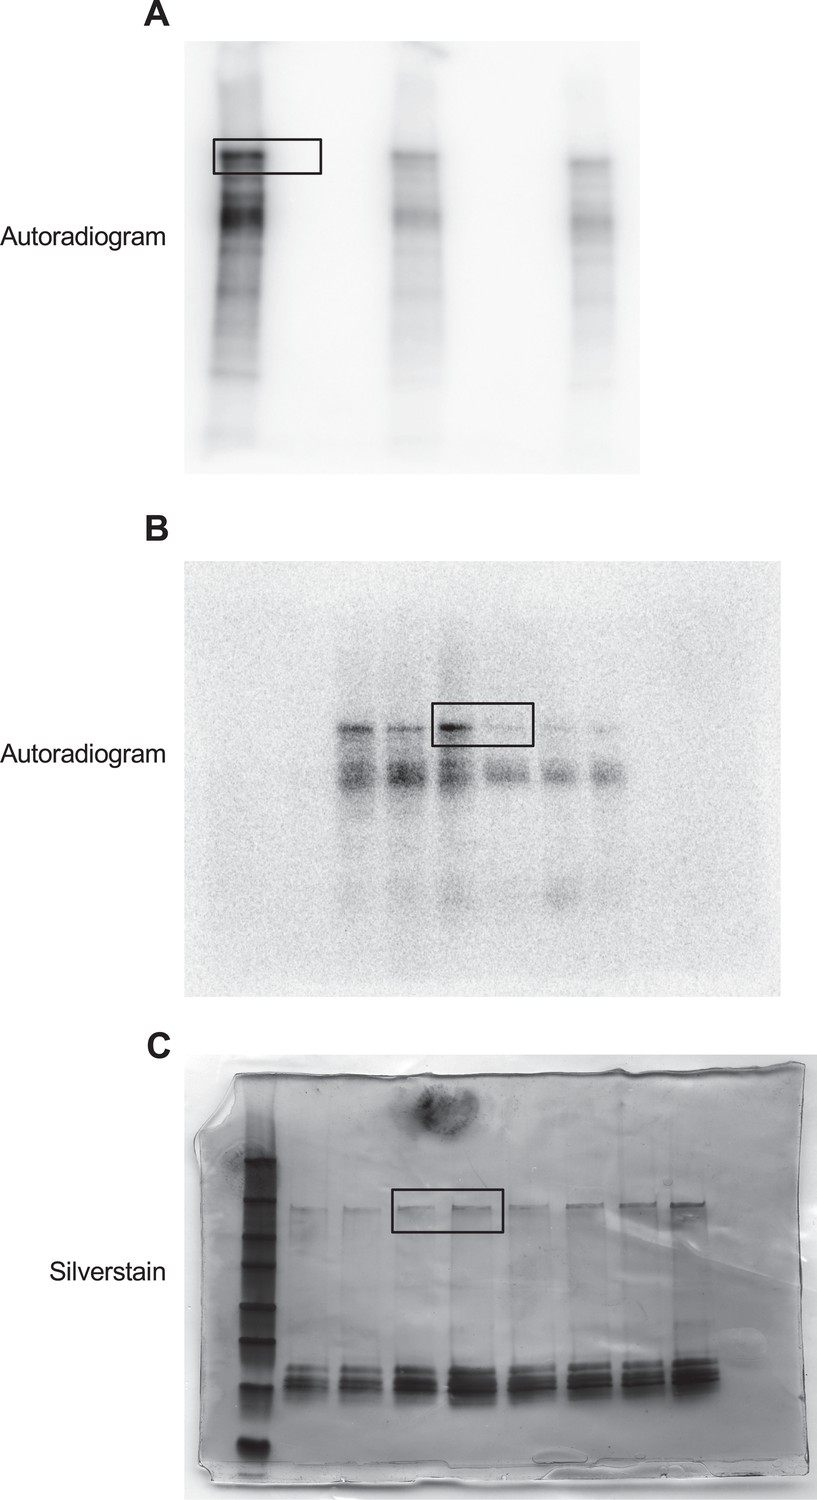
Uncropped versions of gel images in Figure 1.
(A) Uncropped autoradiogram of Pak1-Sts5 in vitro kinase assay. Cropped gel shown in Figure 1B is highlighted in boxed region. (B) Uncropped autoradiogram of Pak1-Sts5 in vitro kinase assay. Cropped gel shown in Figure 1F is highlighted in boxed region. (C) Uncropped silverstain gel of Sts5 loading for in vitro kinase assay. Cropped gel shown in Figure 1F is highlighted in boxed region.
Figure 2 with 4 supplements
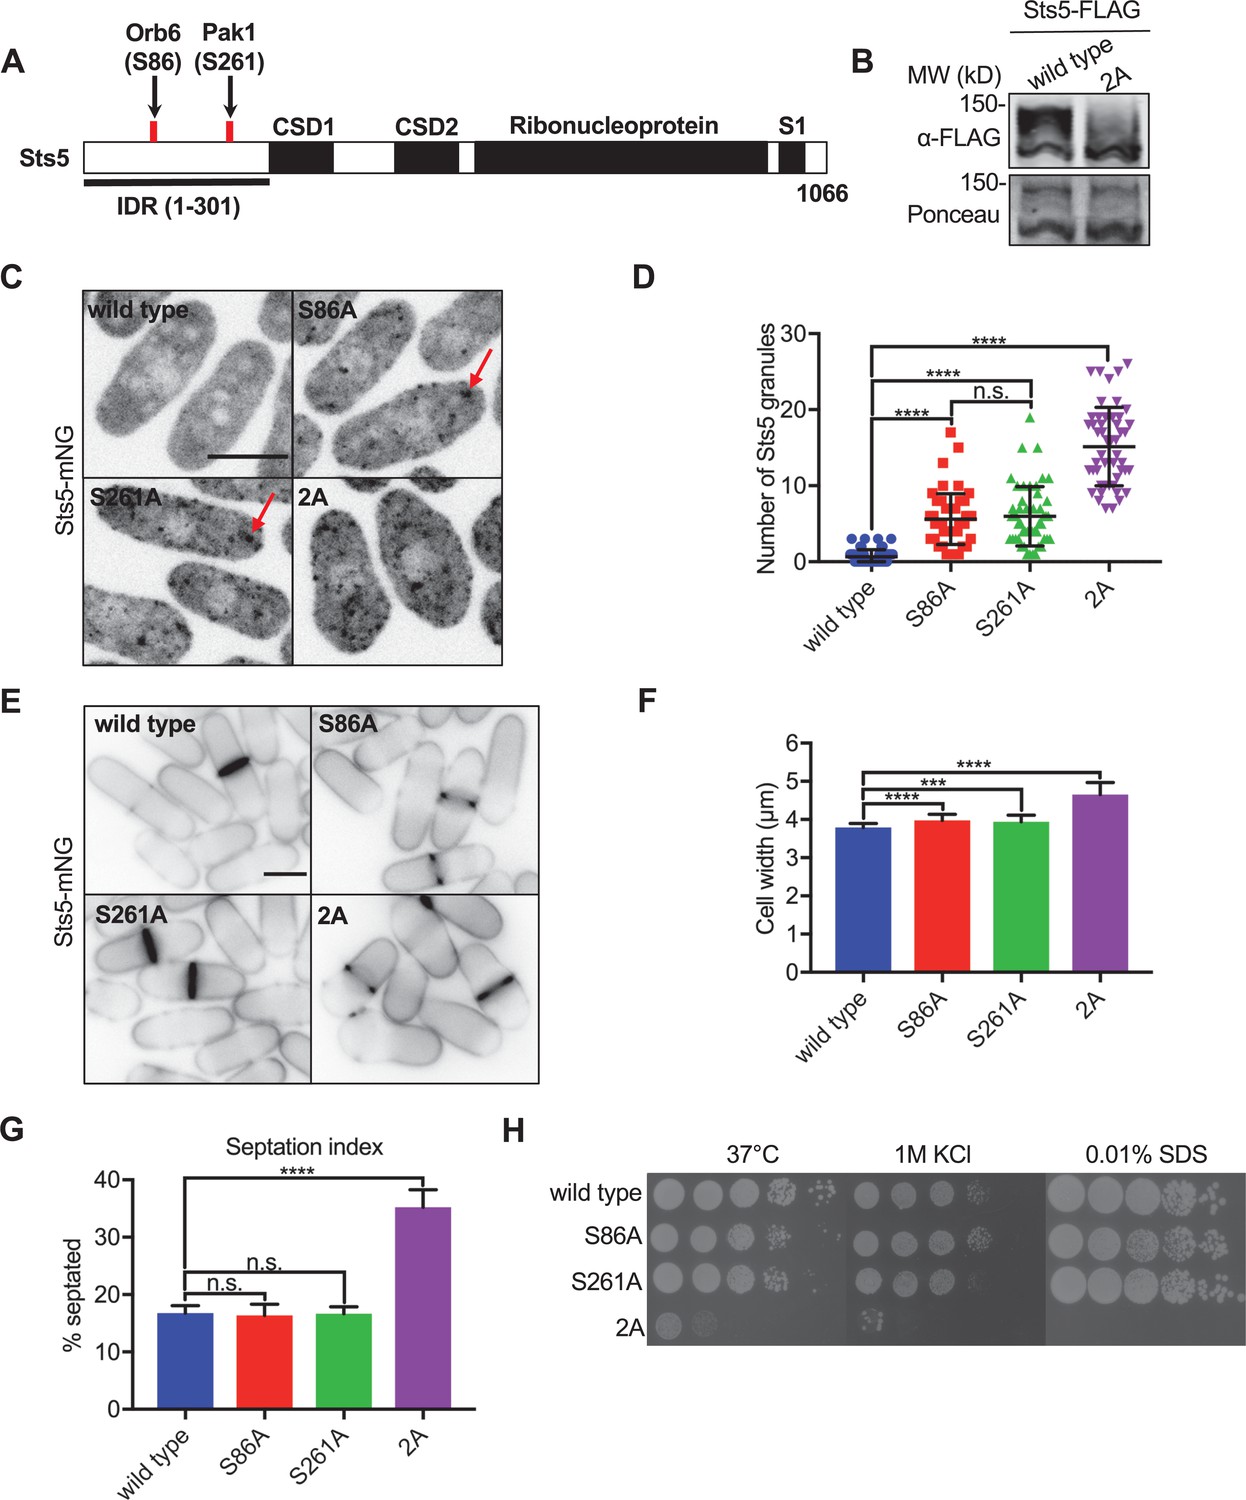
Pak1 and Orb6 kinases phosphorylate distinct residues in the Sts5 intrinsically disordered region (IDR) for cell morphology.
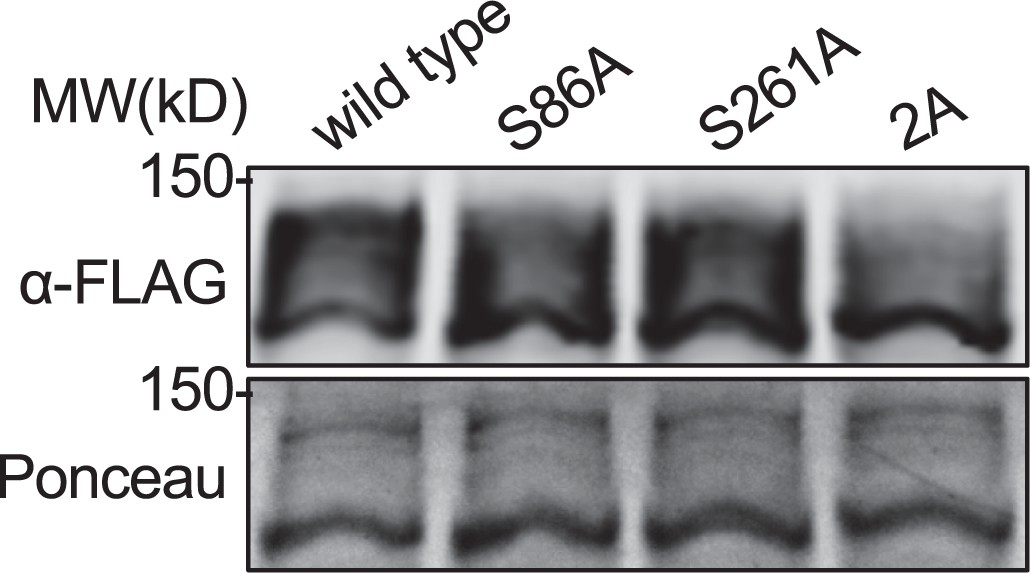
(A) Schematic of Sts5 domain layout. Pak1 and Orb6 phosphorylation sites are indicated by red lines. CSD: cold shock domain. (B) Western blot of whole-cell extracts from the indicated strains separated by SDS-PAGE containing Phosbind. Note loss of Sts5 phosphorylation in the 2A mutant, which contains both S86A and S261A mutations. Ponceau stain included for loading. (C) Spinning disc confocal images of Sts5-mNG localization. Images are maximum intensity projections. (D) Quantification of Sts5-mNG granule number per cell. Values are mean ± SD (n = 50 cells per strain). ****p<0.0001. n.s.: not significant. (E) Images of Sts5-mNG cells stained with Blankophor. (F) Quantification of cell width in Sts5-mNG strains. Values are mean ± SD (n ≥ 50 cells per strain). ****p<0.0001; ***p<0.001. (G) Quantification of septation index of indicated strains. Values are mean ± SD from three biological replicates (n > 150 cells each). ****p<0.0001. n.s.: not significant. (H) Serial-dilution growth assays for each indicated strain. Strains were spotted onto indicated media and grown for 3–5 days at either 32°C or 37°C. Scale bars, 5 μm.
-
Figure 2—source data 1
Raw values shown on graphs in Figure 2D, F and G.
- https://cdn.elifesciences.org/articles/67648/elife-67648-fig2-data1-v2.xlsx
-
Figure 2—source data 2
Original files of the full raw unedited gels in Figure 2.
- https://cdn.elifesciences.org/articles/67648/elife-67648-fig2-data2-v2.zip
-
Figure 2—source data 3
Original files of the full raw unedited gels in Figure 2.
- https://cdn.elifesciences.org/articles/67648/elife-67648-fig2-data3-v2.tif
Figure 2—figure supplement 1
Phosbind western blot of all Sts5 phosphomutants.
Western blot of whole-cell extracts from the indicated sts5-FLAG strains strains separated by SDS-PAGE containing Phosbind. Ponceau stain included for loading.
Figure 2—figure supplement 2
Sts5 phosphomutants display defects in cell polarity.
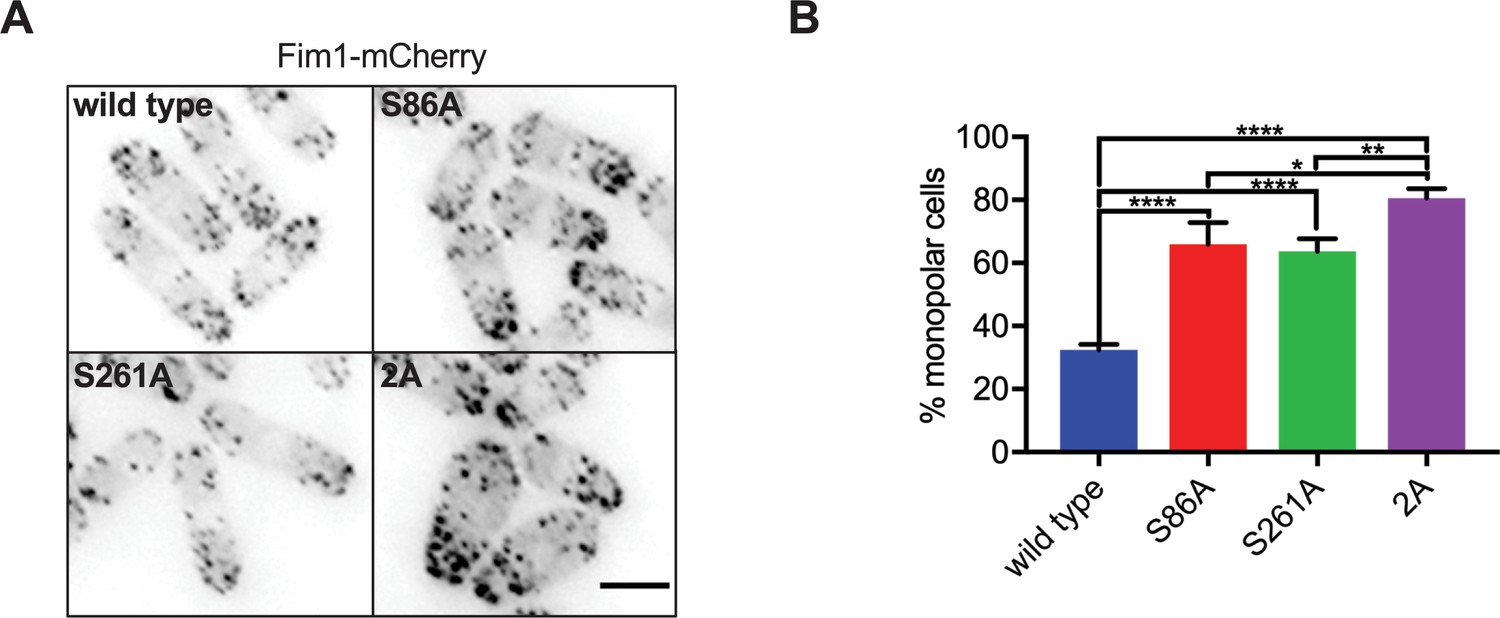
(A) Representative images of Fim1-mCherry to monitor enrichment of actin patches at one cell end (monopolar) or both cell ends (bipolar) in indicated strains. Images are sum projections. Scale bar, 5 μm. (B) Percentage of monopolar cells in the indicated strains. Values are mean ± SD from three biological replicates (n ≥ 100 cells each). ****p<0.0001; **p<0.01; *p<0.05.
-
Figure 2—figure supplement 2—source data 1
Raw values shown on graph in Figure 2—figure supplement 2B.
- https://cdn.elifesciences.org/articles/67648/elife-67648-fig2-figsupp2-data1-v2.xlsx
Figure 2—figure supplement 3
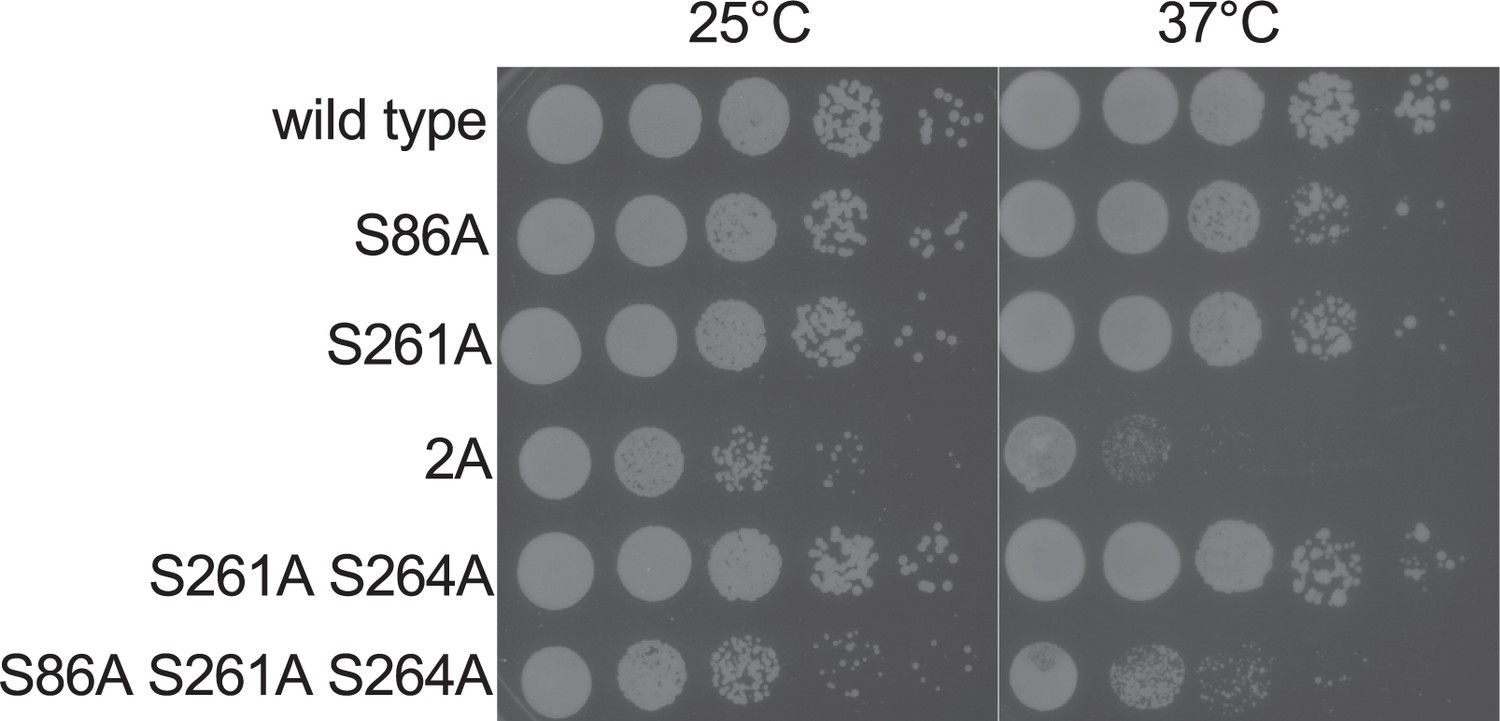
Mutation of Sts5 residue S264 does not impact cell growth.
Serial-dilution growth assays for the indicated strains, which were spotted onto rich media plates (YE4S) and grown for 3–5 days at either 25°C or 37°C. Note that S264A does not decrease cell viability when combined with S261A or with both S86A and S261A.
Figure 2—figure supplement 4
Uncropped versions of gel images from Figure 2.
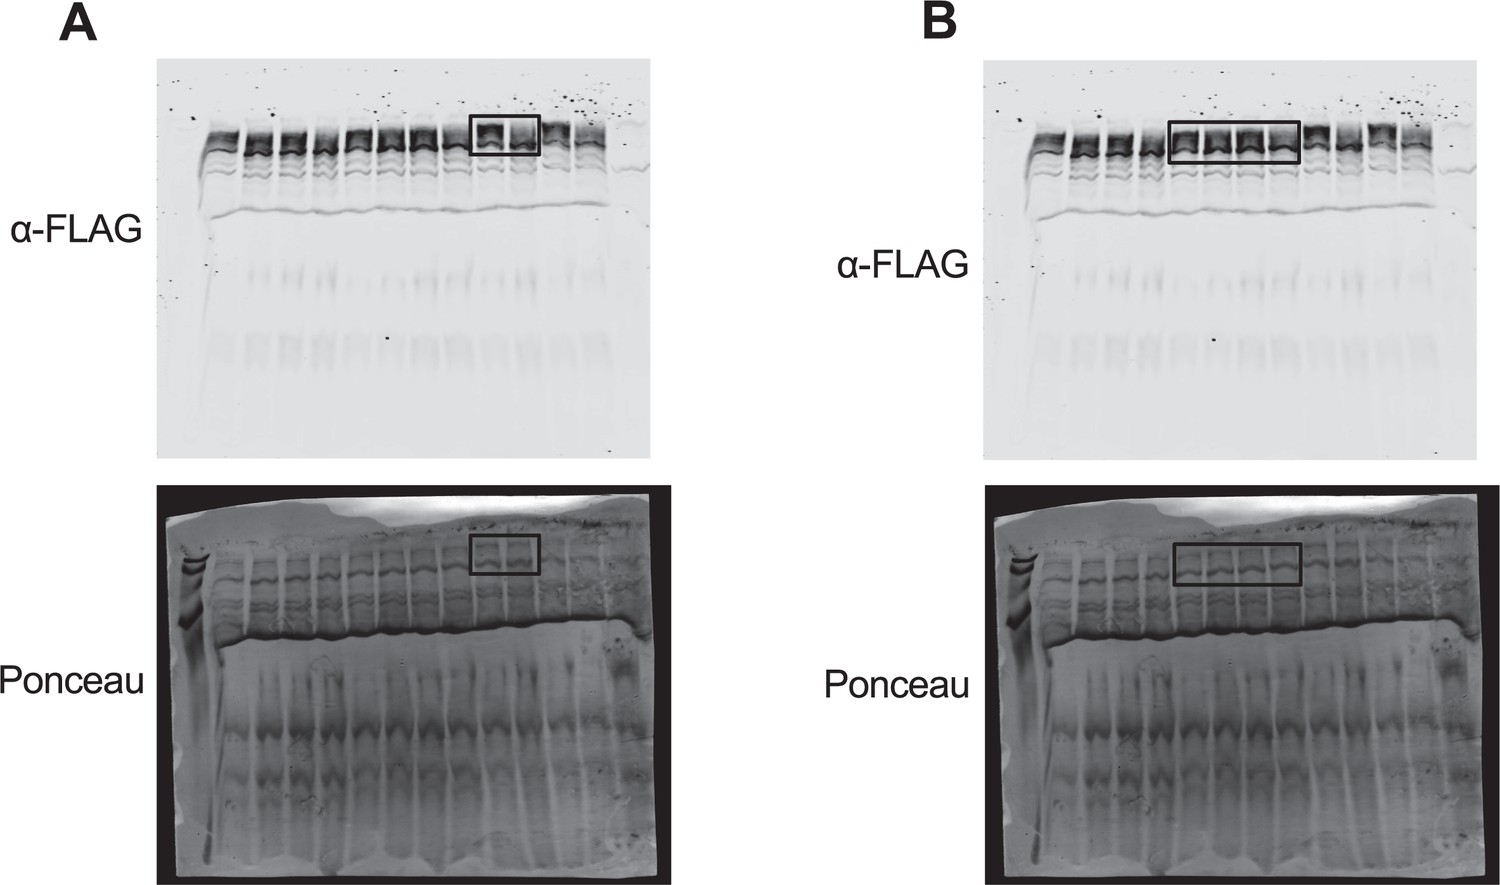
(A) Uncropped western blot and Ponceau stain for Sts5-FLAG Phosbind gel. Cropped gel shown in Figure 2B is highlighted in boxed region. (B) Uncropped western blot and Ponceau stain for Sts5-FLAG Phosbind gel. Cropped gels shown in Figure 2—figure supplement 1 are highlighted in boxed regions.
Figure 3 with 2 supplements
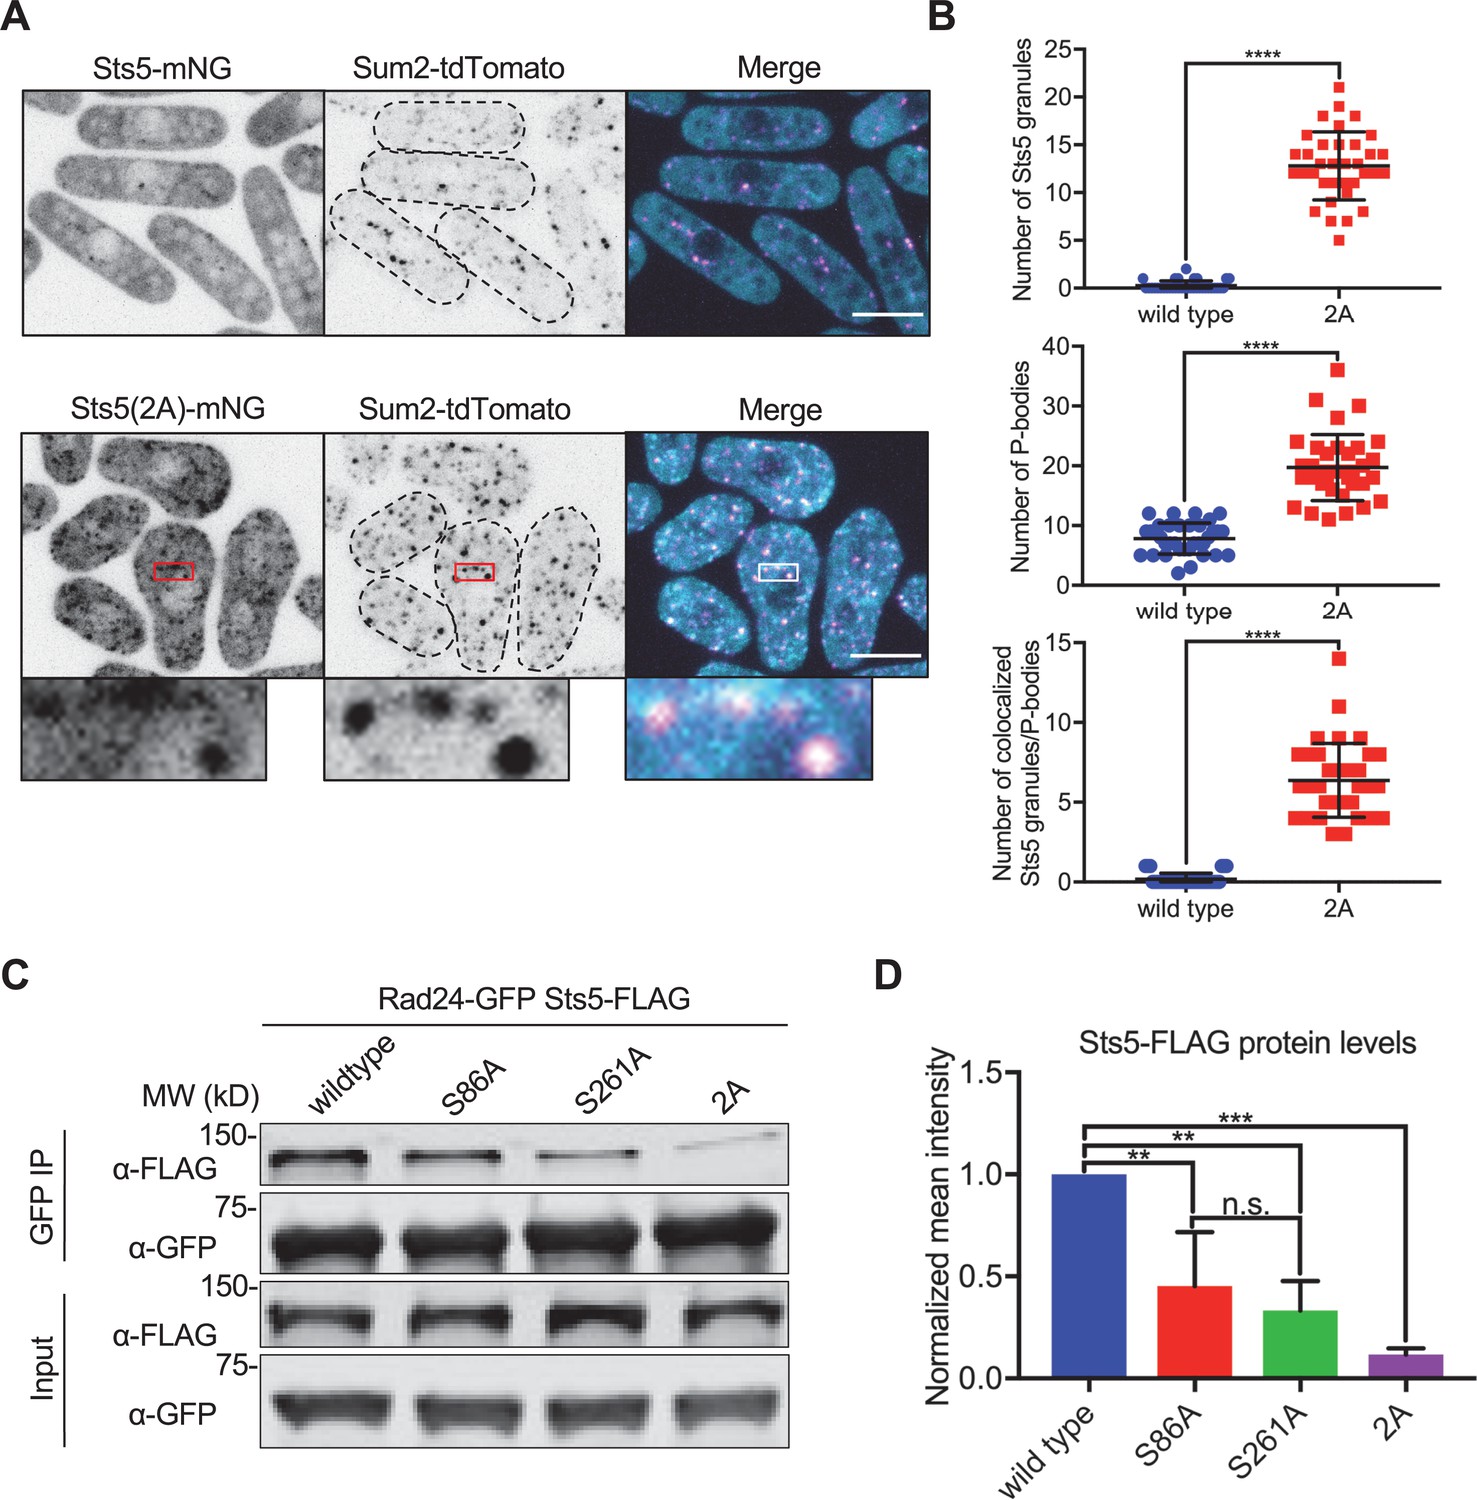
Sts5 granules associate with P bodies in a 14-3-3 protein Rad24-dependent manner.
(A) Localization of Sts5 and Sum2. (B) Quantification of Sts5 granule number per cell (top), P body number per cell (middle), and number of colocalized Sts5 granules and P bodies (bottom). Values are mean ± SD (n = 35 cells per strain). ****p<0.0001. (C) Representative co-immunoprecipitation of Rad24-GFP and indicated Sts5-FLAG strains. (D) Quantification of immunoprecipitated Sts5-FLAG protein levels from western blotting. Values are mean ± SD from three biological replicates. ***p<0.001; **p<0.01. n.s.: not significant. Images in (A) and (B) are spinning disc confocal maximum intensity projections of the top half of cells. Insets are enlarged views of boxed regions. Dotted lines show cell outlines. Scale bars, 5 μm.
-
Figure 3—source data 1
Raw values shown on graphs in Figure 3B and D.
- https://cdn.elifesciences.org/articles/67648/elife-67648-fig3-data1-v2.xlsx
-
Figure 3—source data 2
Original files of the full raw unedited gels in Figure 3.
- https://cdn.elifesciences.org/articles/67648/elife-67648-fig3-data2-v2.zip
-
Figure 3—source data 3
Original files of the full raw unedited gels in Figure 3.
- https://cdn.elifesciences.org/articles/67648/elife-67648-fig3-data3-v2.zip
Figure 3—figure supplement 1
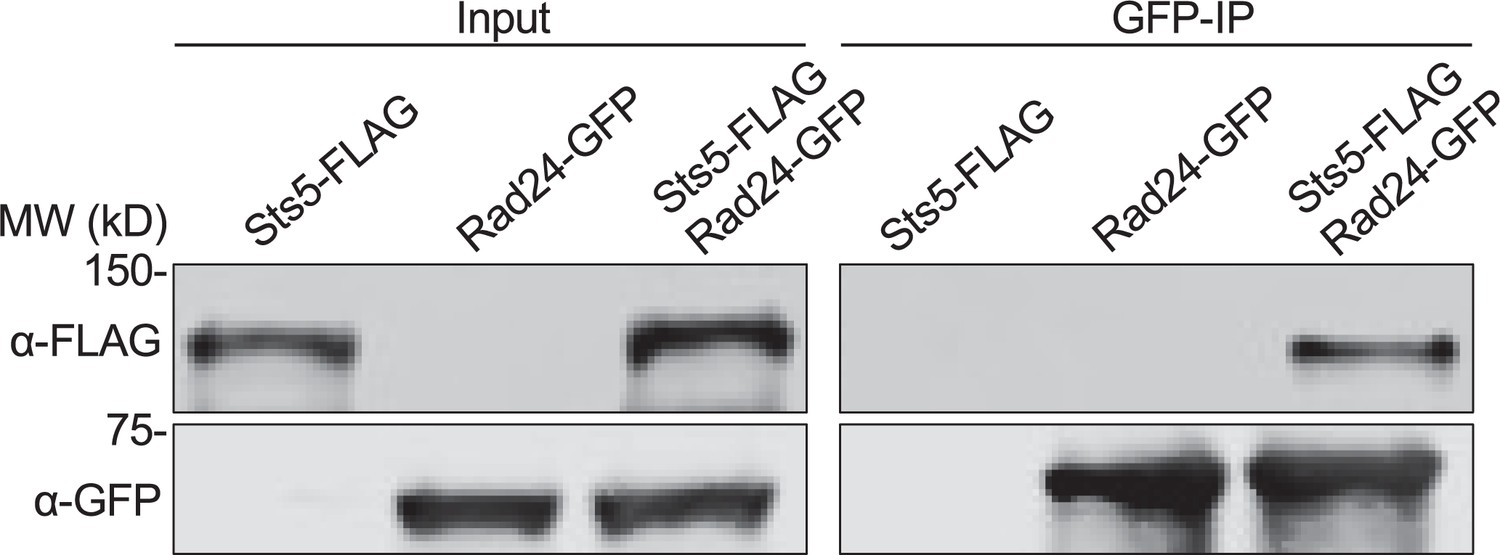
Physical association of Rad24 and Sts5.
Representative co-immunoprecipitation of Rad24-GFP and Sts5-FLAG from the indicated strains.
Figure 3—figure supplement 2
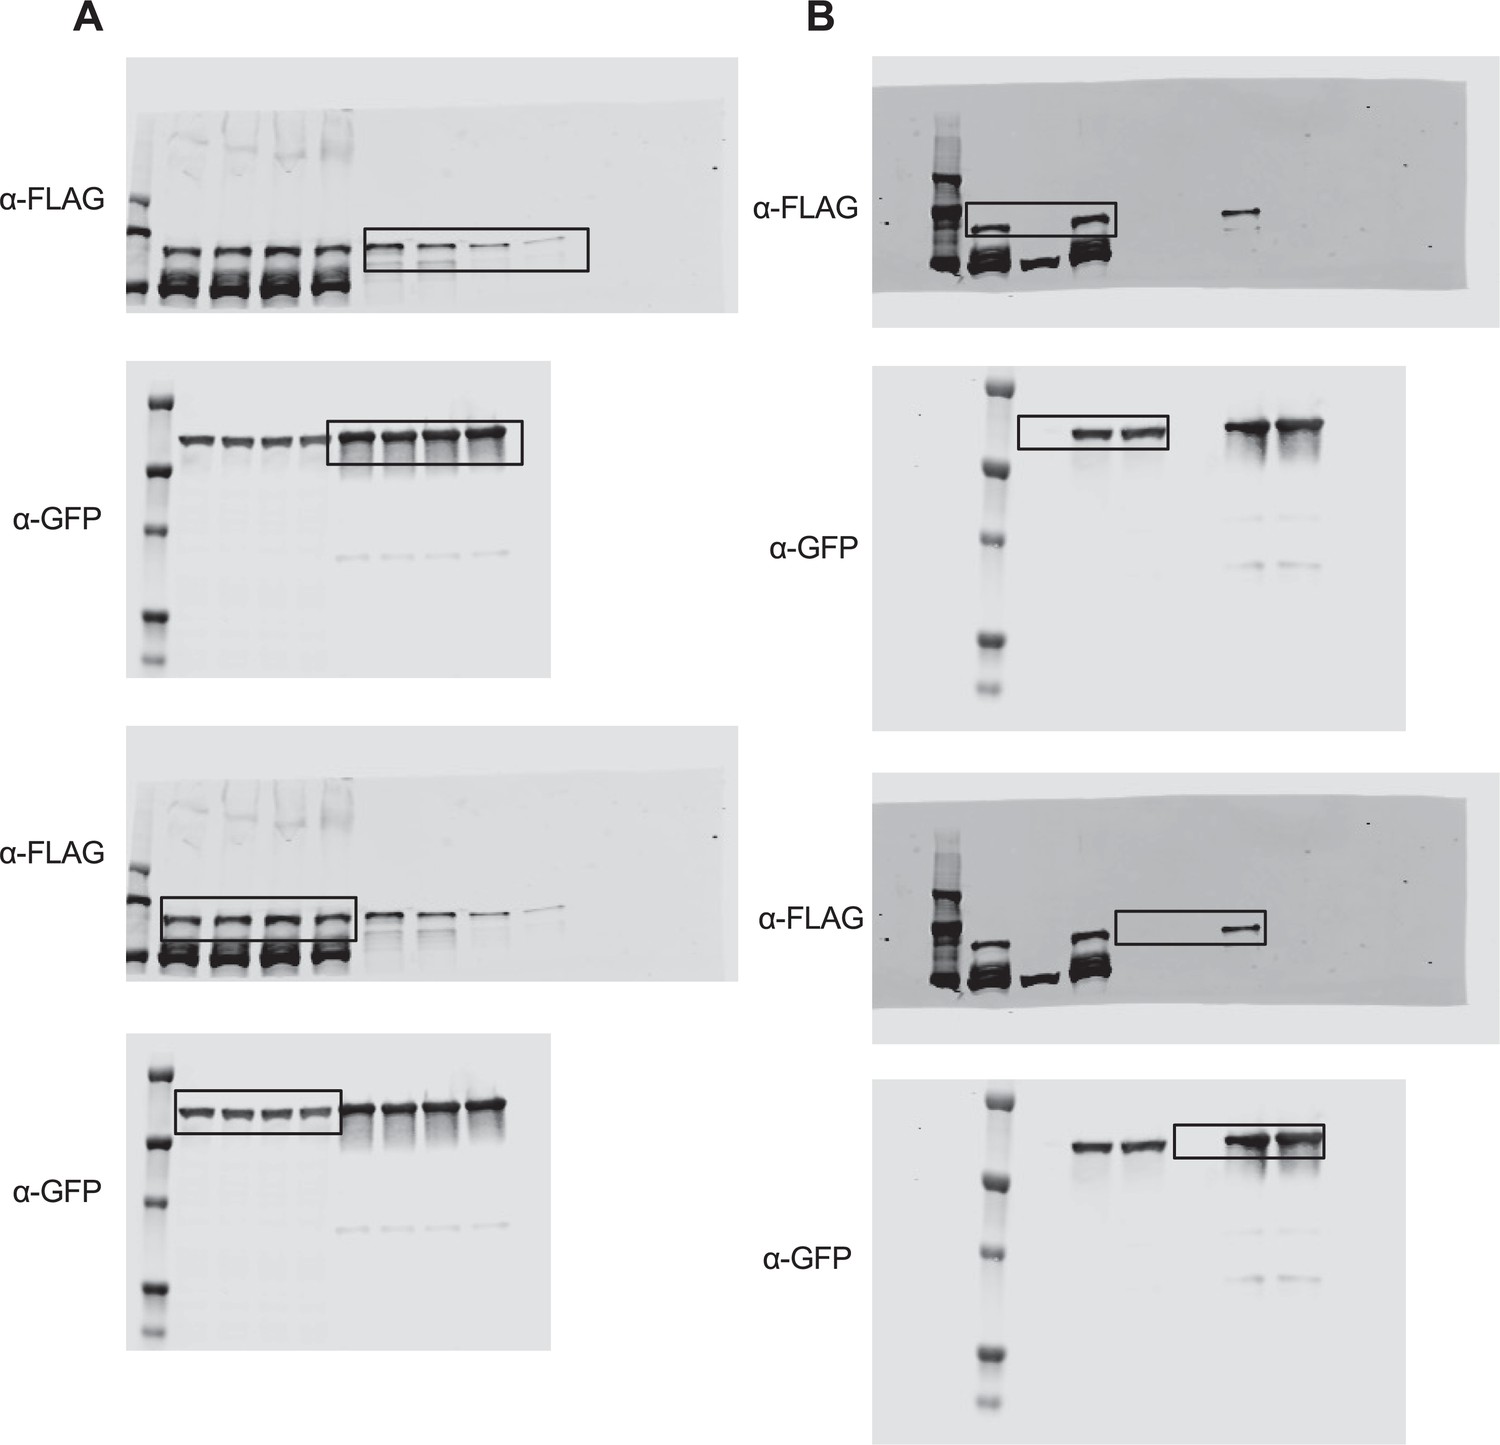
Uncropped versions of gel images from Figure 3.
(A) Uncropped western blots for either Sts5-FLAG or Rad24-GFP. Cropped gels shown in Figure 3C are highlighted in boxed regions. (B) Uncropped western blots for either Sts5-FLAG or Rad24-GFP. Cropped gels shown in Figure 3—figure supplement 1 are highlighted in boxed regions.
Figure 4 with 2 supplements
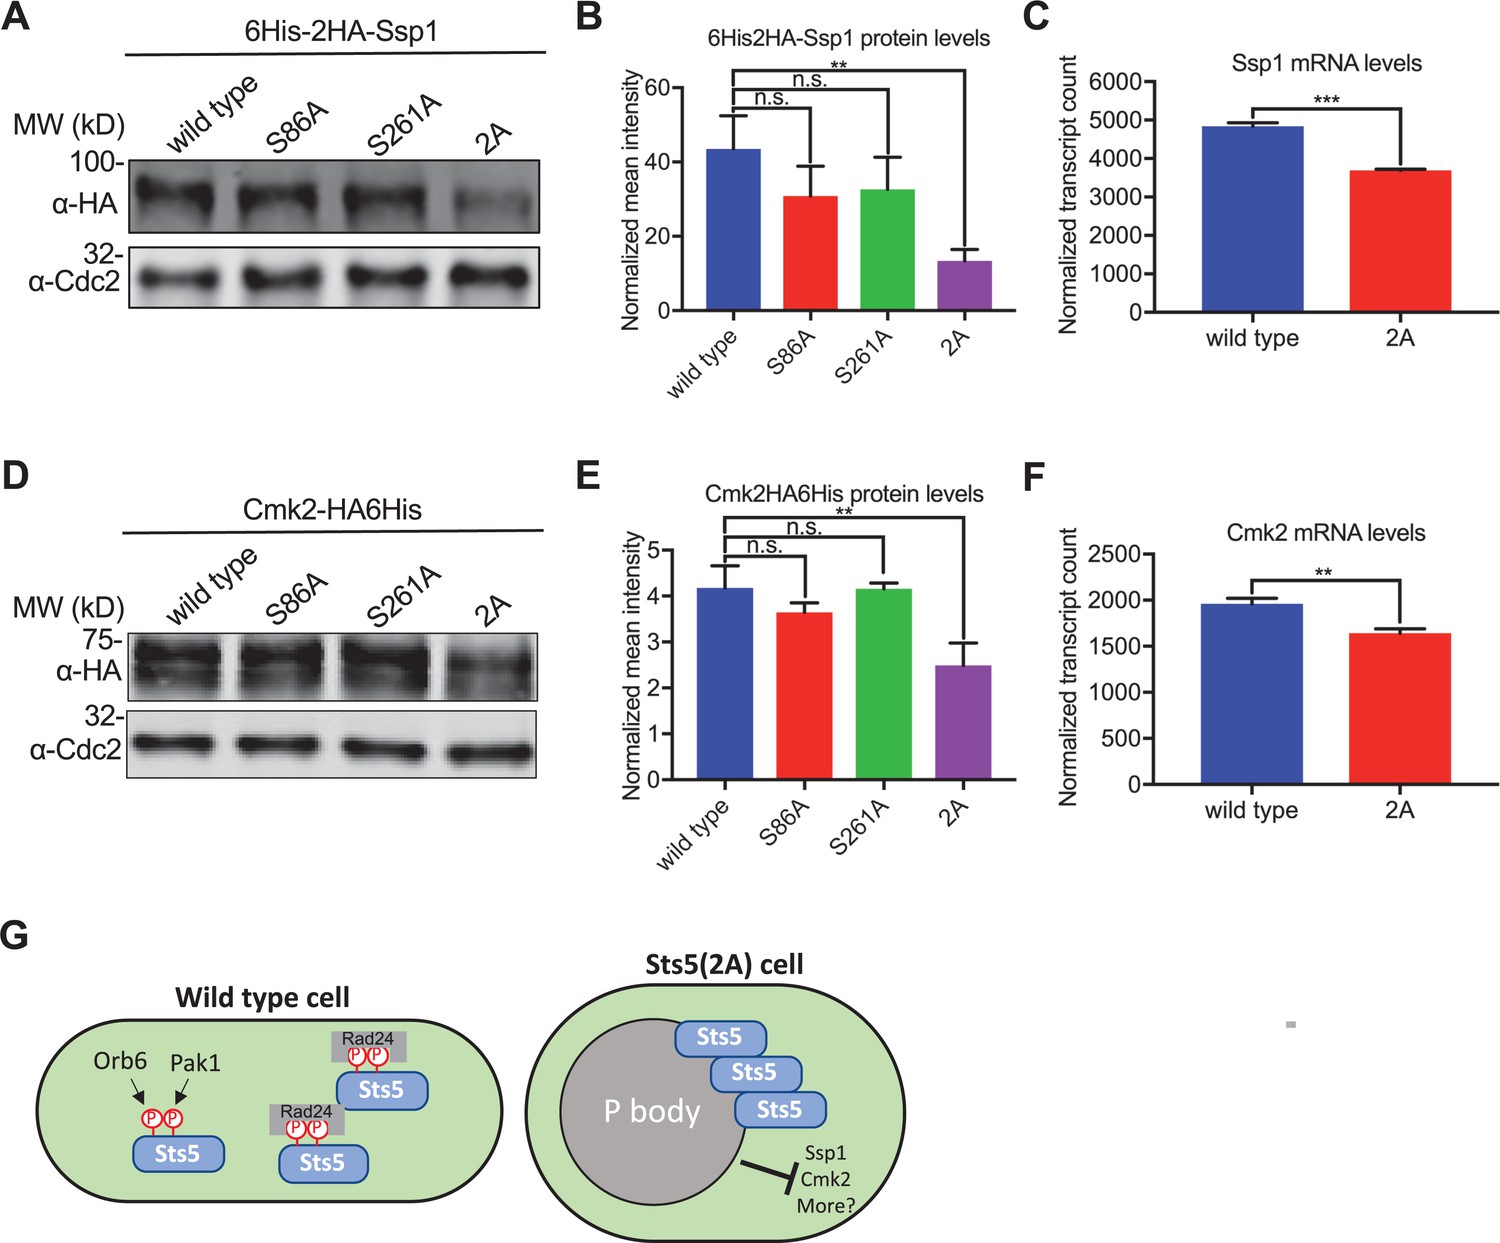
Formation of Sts5 granules reduces mRNA and protein levels of Ssp1 and Cmk2.
(A) Representative western blot showing Ssp1 protein levels in the indicated strains. α-Cdc2 blot shown as loading control. (B) Quantification of Ssp1 protein levels from western blotting. Values are mean ± SD from three biological replicates. **p<0.01. n.s.: not significant. (C) Normalized counts for Ssp1 transcripts from the indicated strains using NanoString gene expression assays. Values are mean ± SD from three biological replicates. ***p<0.001. (D) Representative western blot showing Cmk2 protein levels in the indicated strains. α-Cdc2 blot shown as loading control. (E) Quantification of Cmk2 protein levels from western blotting. Values are mean ± SD from three biological replicates. **p<0.01. n.s.: not significant. (F) Normalized counts for Cmk2 transcripts from the indicated strains using NanoString gene expression assays. Values are mean ± SD from three biological replicates. **p<0.01. (G) Model for Sts5 phosphorylation by Pak1 and Orb6 to control both P body formation and cell shape.
-
Figure 4—source data 1
Raw values shown on graphs in Figure 4B, C, E and F.
- https://cdn.elifesciences.org/articles/67648/elife-67648-fig4-data1-v2.xlsx
-
Figure 4—source data 2
Original files of the full raw unedited gels in Figure 4.
- https://cdn.elifesciences.org/articles/67648/elife-67648-fig4-data2-v2.zip
-
Figure 4—source data 3
Original files of the full raw unedited gels in Figure 4.
- https://cdn.elifesciences.org/articles/67648/elife-67648-fig4-data3-v2.zip
-
Figure 4—source data 4
Original files of the full raw unedited gels in Figure 4.
- https://cdn.elifesciences.org/articles/67648/elife-67648-fig4-data4-v2.zip
-
Figure 4—source data 5
Original files of the full raw unedited gels in Figure 4.
- https://cdn.elifesciences.org/articles/67648/elife-67648-fig4-data5-v2.zip
Figure 4—figure supplement 1
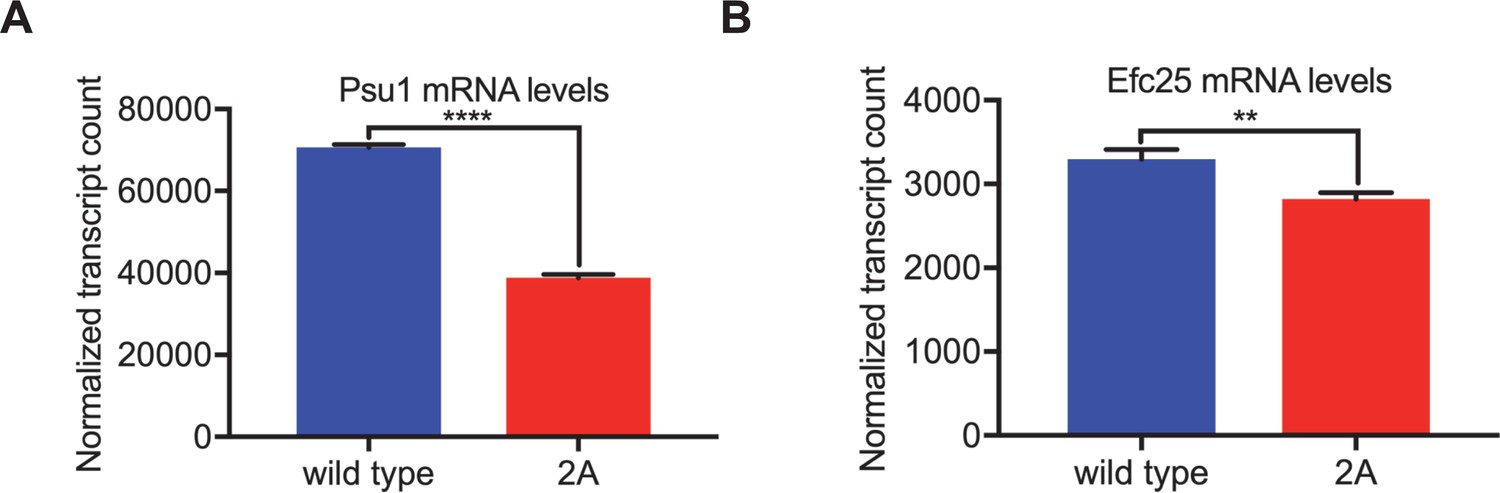
Sts5 granules result in decreased Psu1 and Efc25 mRNA levels.
(A) Normalized counts for Psu1 transcripts from the indicated strains using NanoString gene expression assays. Values are mean ± SD from three biological replicates. ****p<0.01. (B) Normalized counts for Efc25 transcripts from the indicated strains using NanoString gene expression assays. Values are mean ± SD from three biological replicates. **p< 0.01.
Figure 4—figure supplement 2
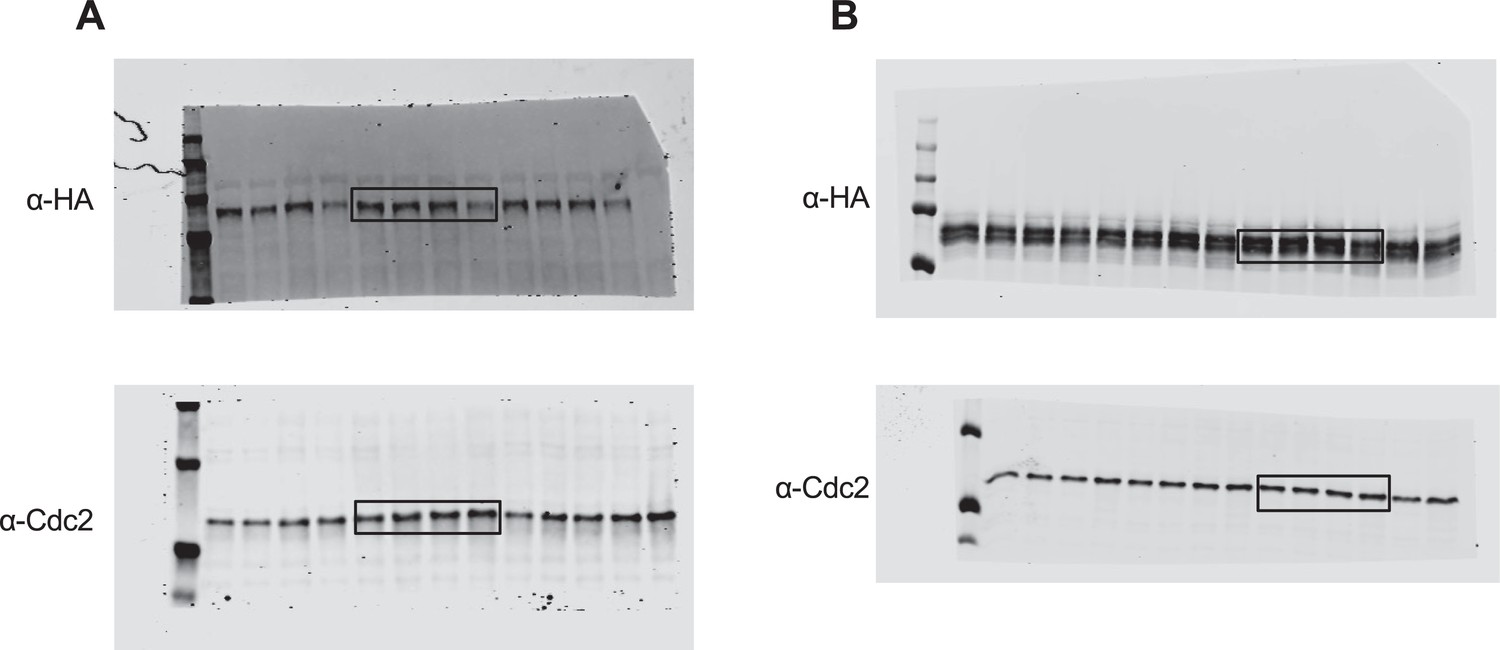
Uncropped versions of gel images from Figure 4.
Figure 5 with 3 supplements
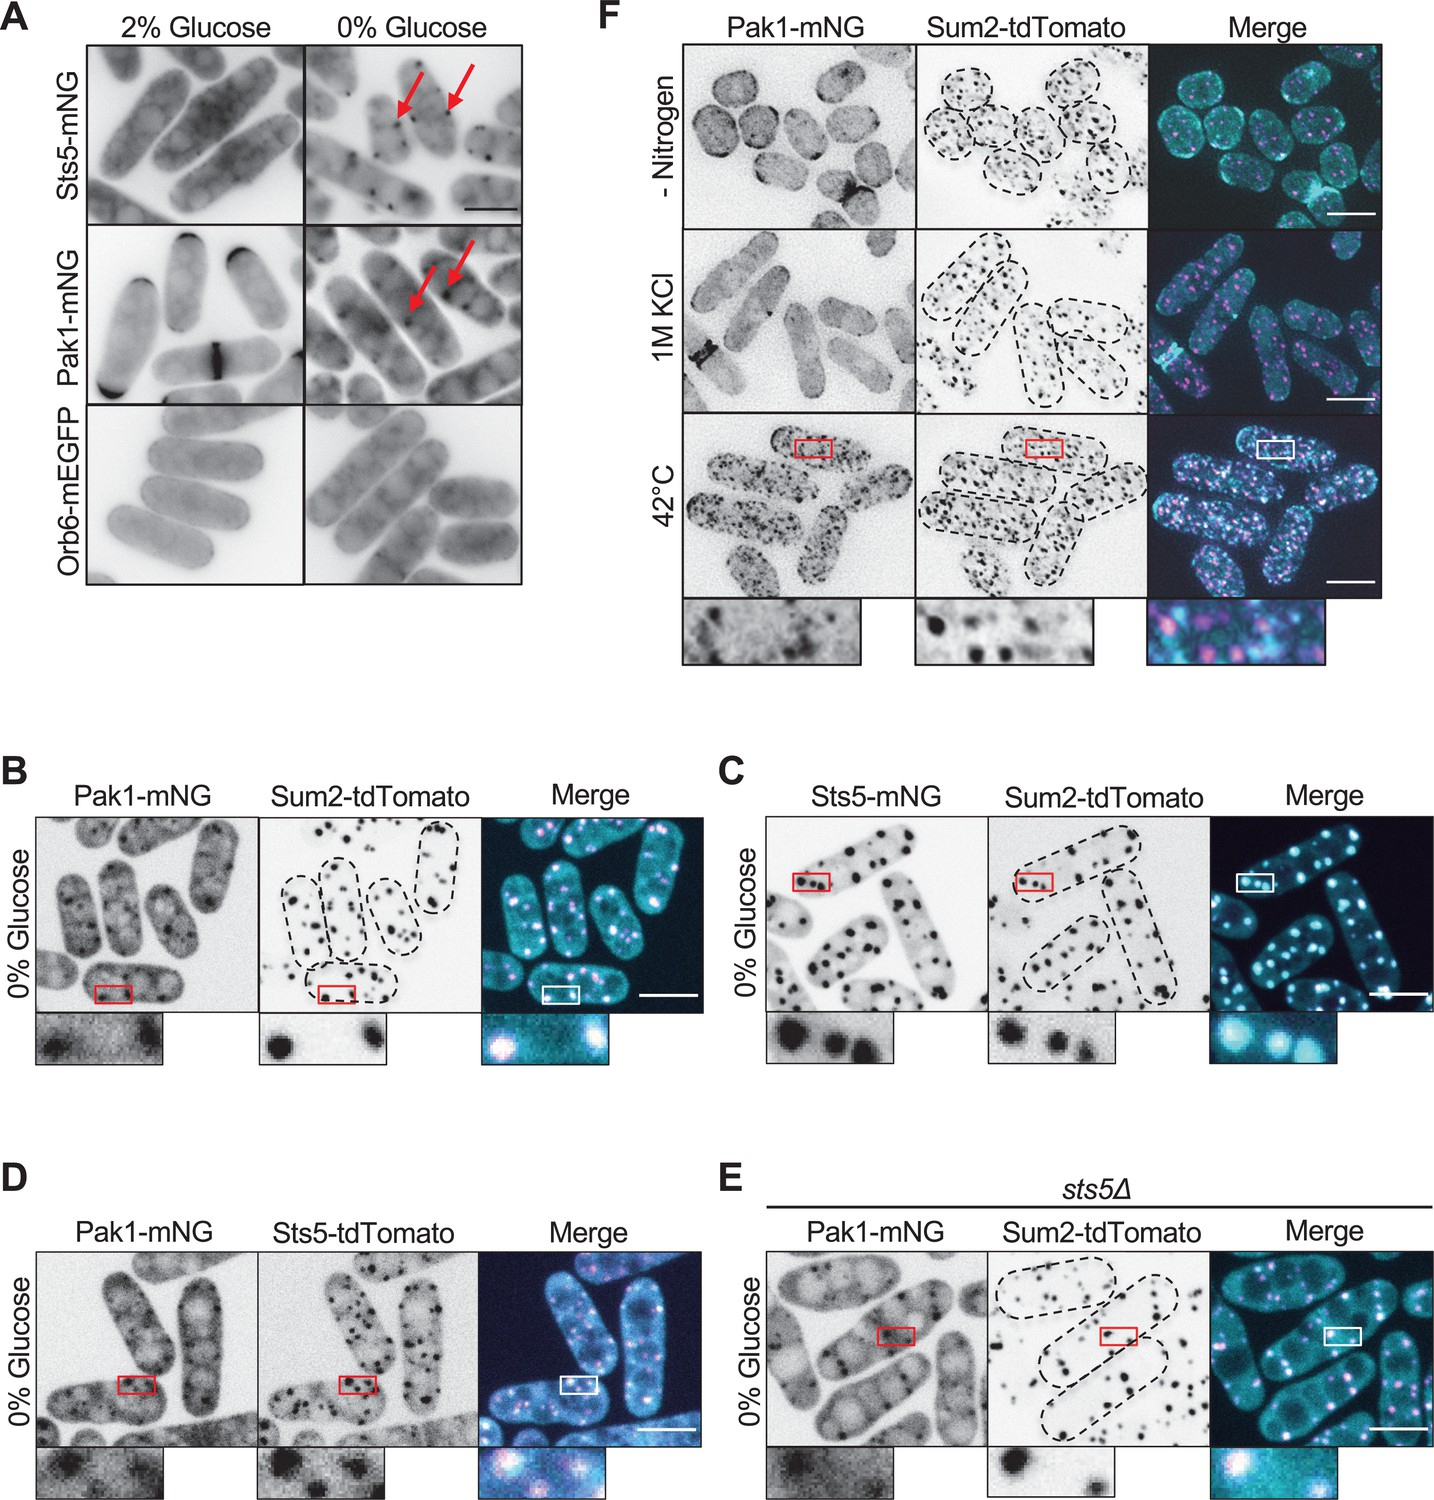
Pak1 localizes to stress granules with Sts5 during glucose starvation.
(A) Localization of the indicated protein kinases in the presence or absence of glucose. Images are single medial focal planes. Arrows point to granule localization of either Sts5 or Pak1. (B) Localization of Pak1 and Sum2 during glucose starvation. (C) Localization of Sts5 and Sum2 during glucose starvation. (D) Localization of Pak1 and Sts5 during glucose starvation. (E) Localization of Pak1 and Sum2 in glucose-starved sts5∆ cells. Images in (B–E) are spinning disc confocal maximum intensity projections. (F) Localization of Pak1 and Sum2 under different stress conditions. Images are maximum intensity projections. Insets are enlarged views of boxed regions. Dotted lines show cell outlines. Scale bars, 5 μm.
Figure 5—figure supplement 1

Localization of Pak1 and Orb6 in the presence and absence of glucose.
(A) Localization of Orb6 and Sum2. (B) Localization of Pak1 and Sum2 in wildtype or sts5Δ cells. (C) Localization of Pak1 and Sum2 in sts5-FLAG or sts5(2A)-FLAG cells. 2A mutation denotes nonphosphorylatable S86A and S261A mutations in Sts5. Images in (A–C) are spinning disc confocal maximum intensity projections. Insets are enlarged views of boxed regions. Dotted lines show cell outlines. (D) Localization of Pak1 and stress granule marker Pabp after heat shock. White circle indicates granule with strong colocalization, and yellow circles indicate granules with weak colocalization. Images are maximum intensity projections. Insets are enlarged views of boxed regions. Scale bars, 5 μm.
Figure 5—figure supplement 2
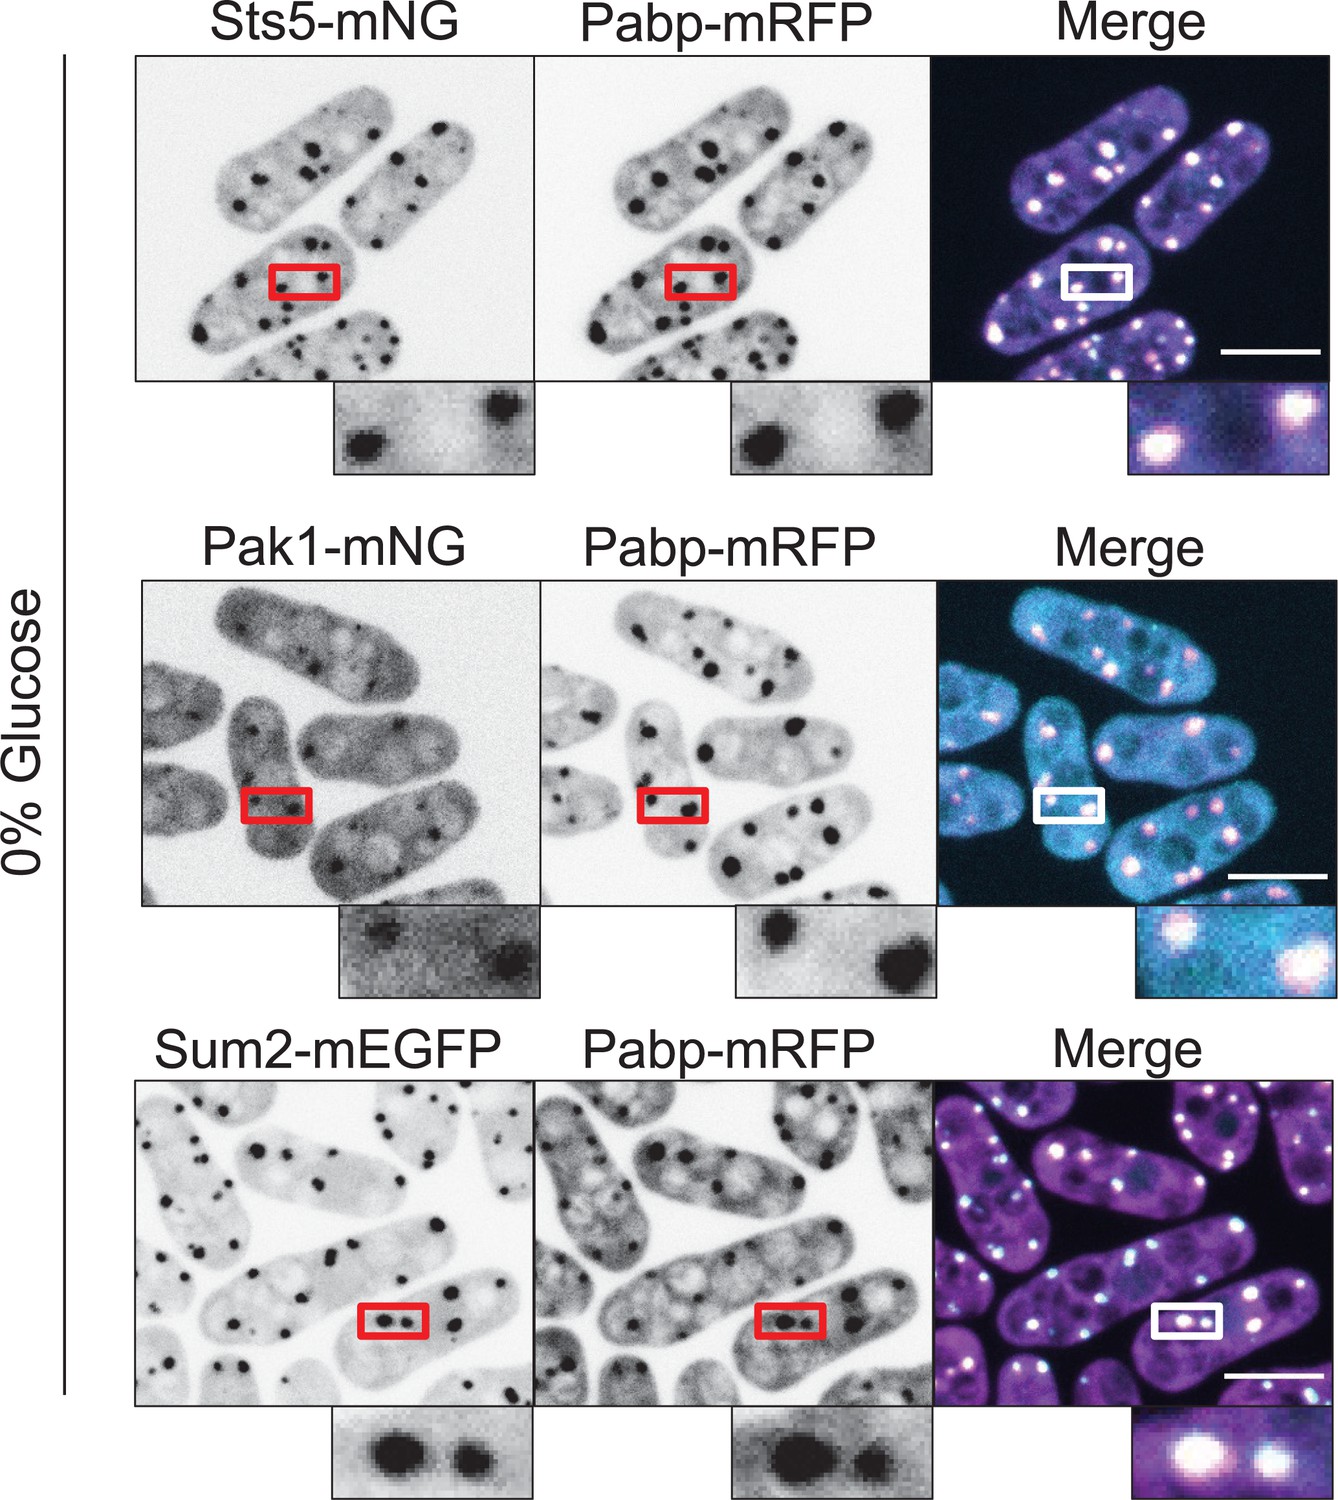
Sts5, Pak1, and Sum2 colocalize with the stress granule marker Pabp during glucose starvation.
Localization of Sts5, Pak1, and Sum2 with Pabp during glucose starvation. Images are spinning disc confocal maximum intensity projections. Insets are enlarged views of boxed regions. Scale bars, 5 μm.
Figure 5—figure supplement 3
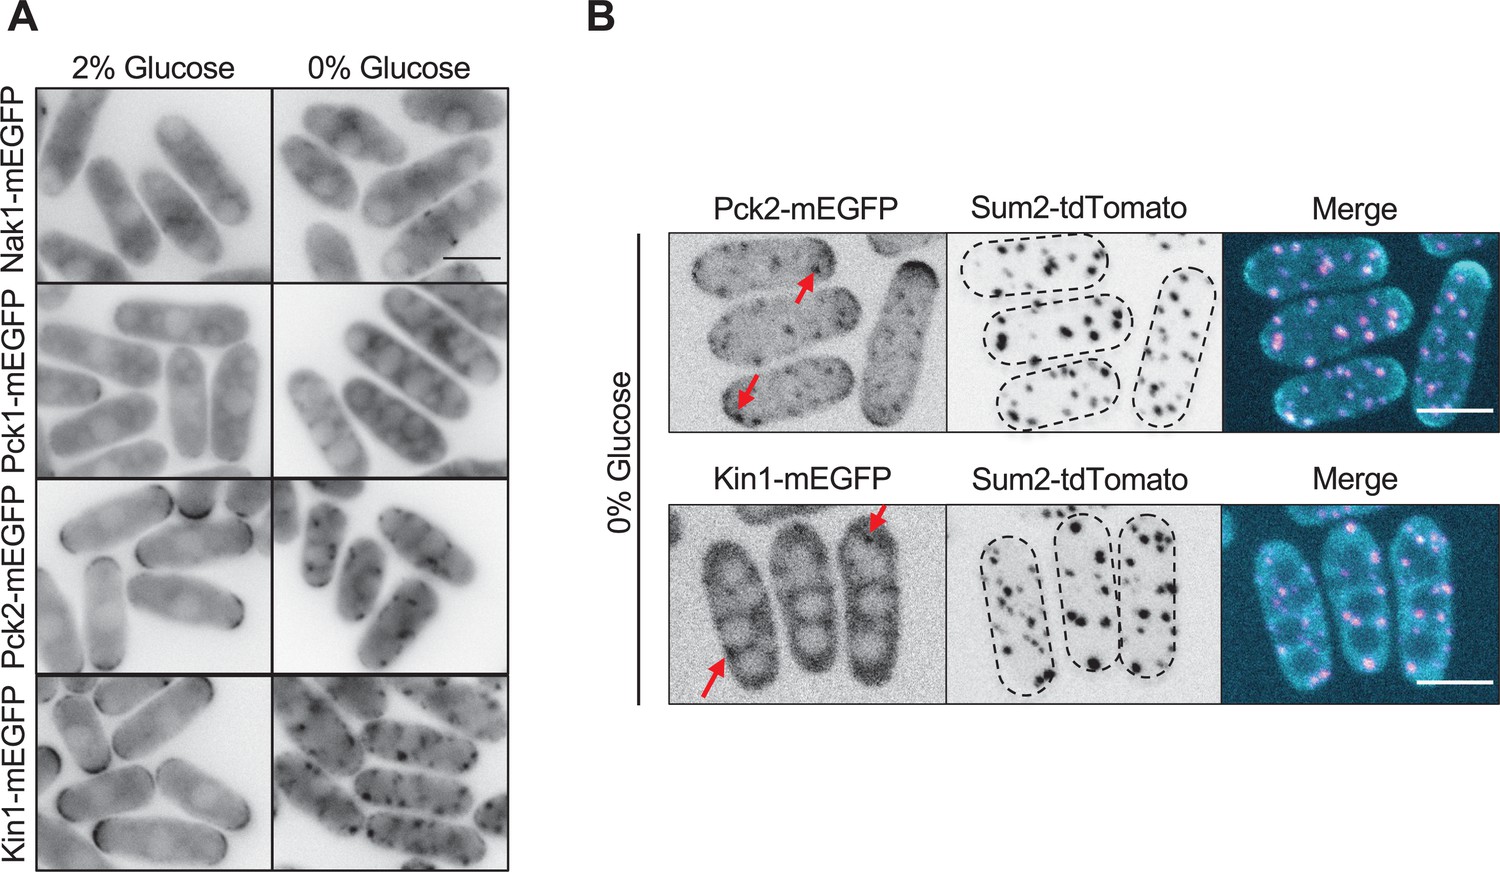
Localization of other polarity kinases during glucose starvation.
(A) Localization of Nak1, Pck1, Pck2, and Kin1. Single focal planes in the cell middle are shown. Scale bar, 5 μm. (B) Images of Pck2 and Kin1 with Sum2. Images are maximum intensity projections. Red arrows indicate clustered localization of Pck2 or Kin1. Dotted lines show cell outlines. Scale bars, 5 μm.
Figure 6
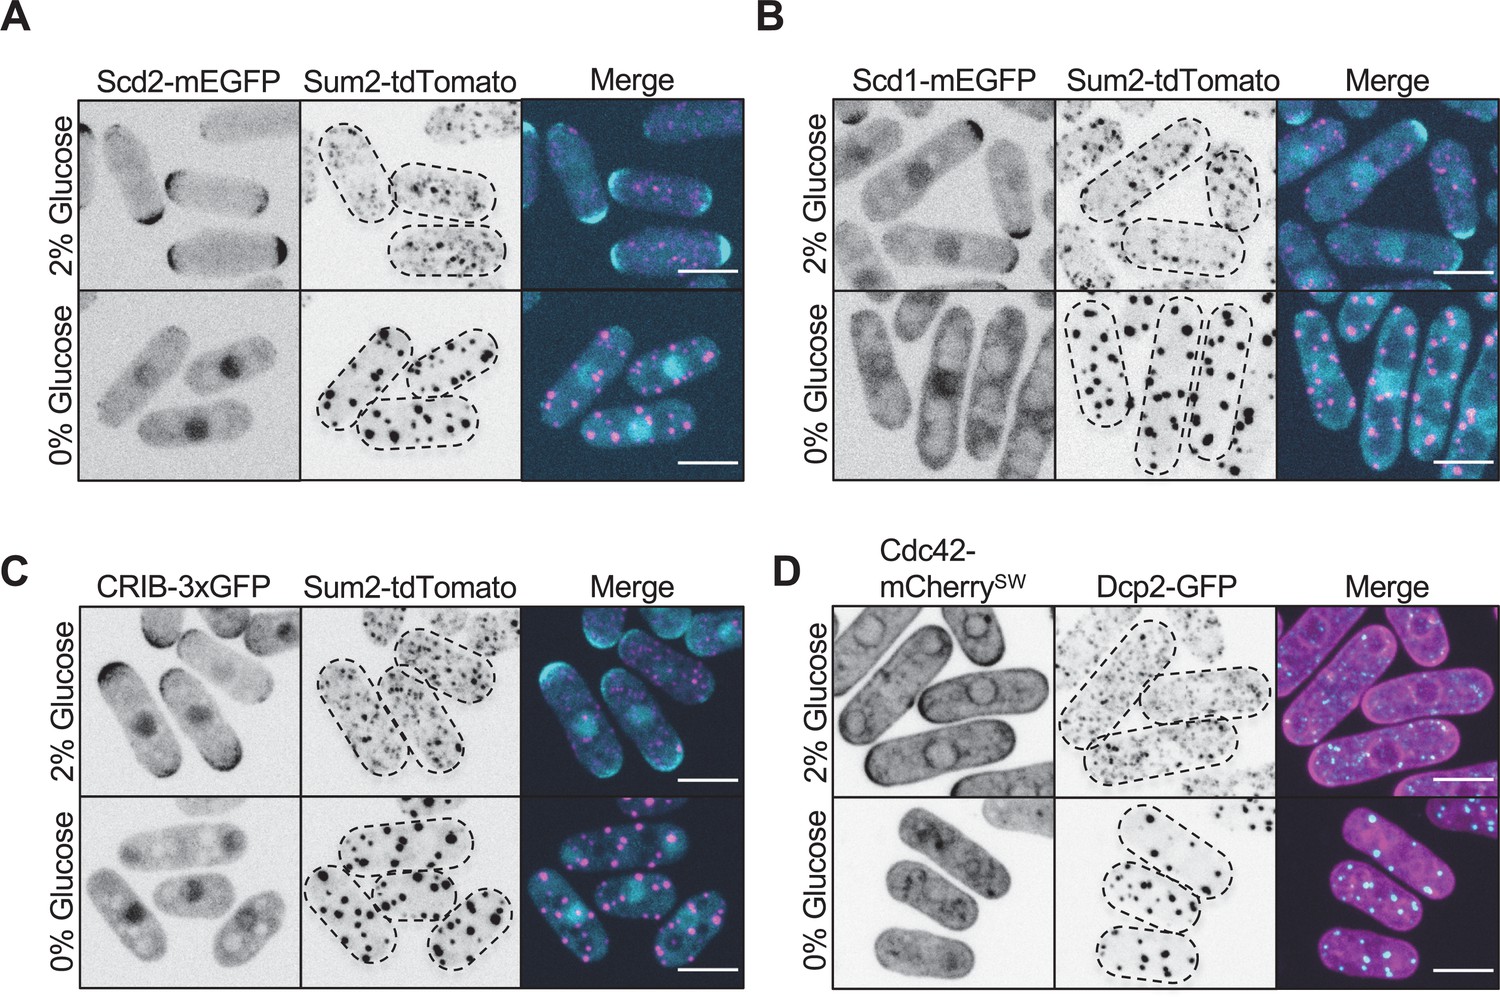
Pak1 ligands in Cdc42 regulatory pathway do not localize to stress granules.
(A) Localization of Scd2 and Sum2. (B) Localization of Scd1 and Sum2. (C) Localization of the activated Cdc42 biosensor CRIB-3xGFP and Sum2. (D) Localization of Cdc42 and Dcp2. Images are spinning disc confocal maximum intensity projections. Dotted lines show cell outlines. Scale bars, 5 μm.
Figure 7
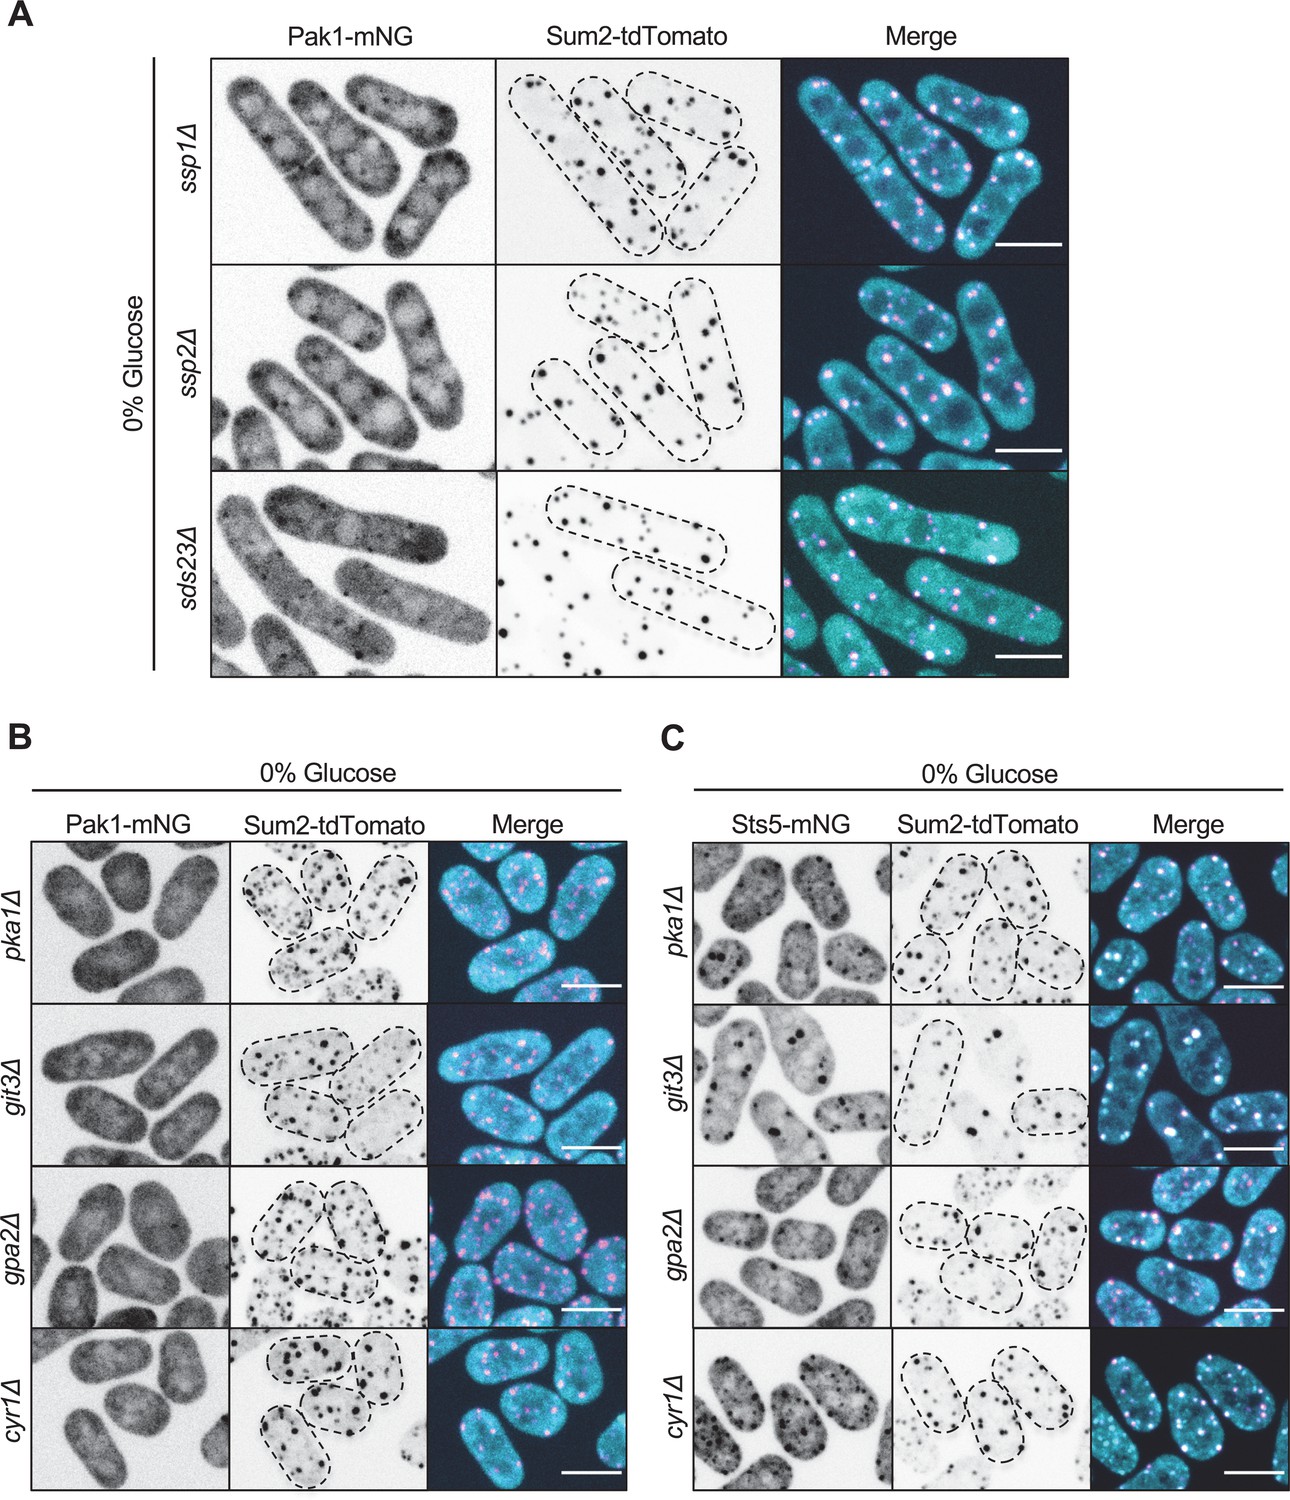
PKA signaling mediates Pak1 recruitment to stress granules during glucose starvation.
(A) Localization of Pak1 and Sum2 for indicated strains in 0% glucose. (B) Localization of Pak1 and Sum2 for indicated strains in 0% glucose. Note the loss of Pak1 localization to stress granules in the mutant strains. (C) Localization of Sts5 and Sum2 for indicated strains in 0% glucose. Images are spinning disc confocal maximum intensity projections. Dotted lines show cell outlines. Scale bars, 5 μm.
Figure 8 with 1 supplement
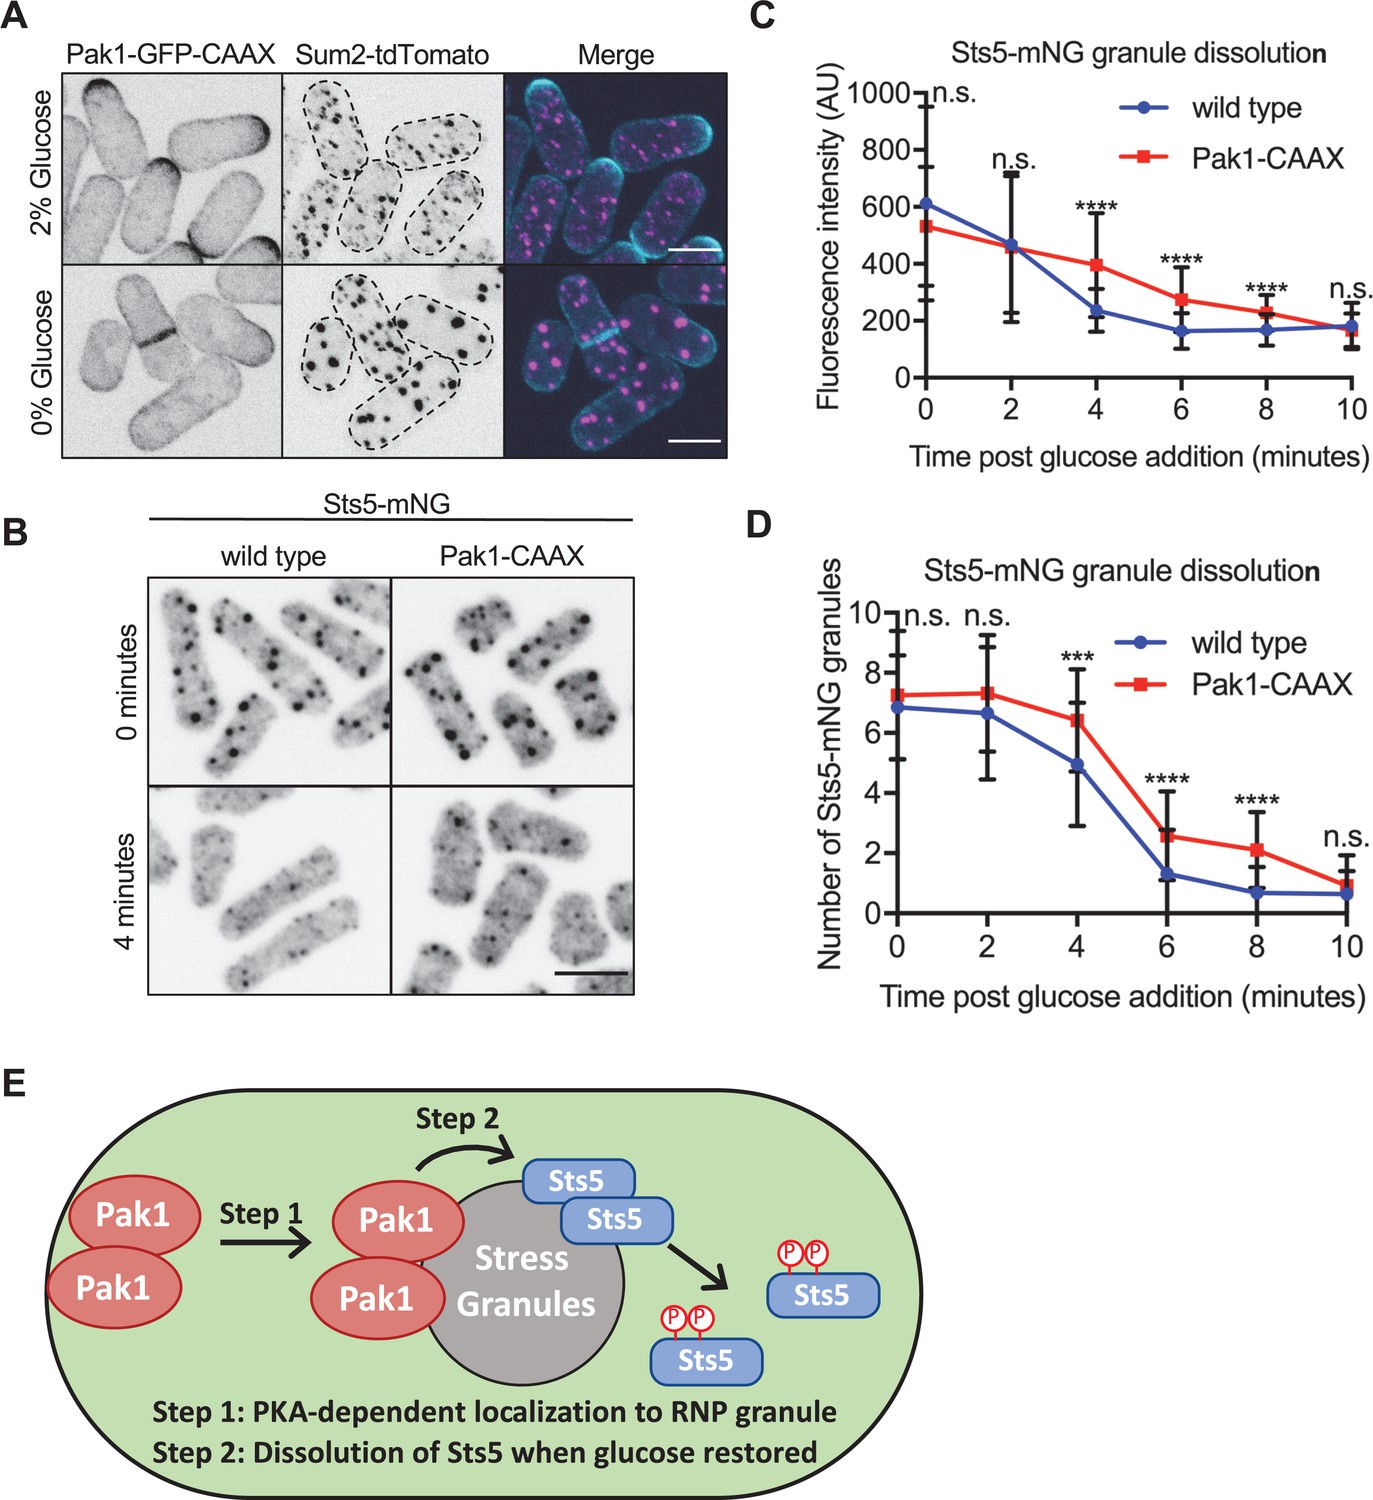
Pak1 promotes rapid Sts5 dissolution from stress granules upon glucose addition.
(A) Localization of Pak1-CAAX and Sum2. Images are spinning disc confocal maximum intensity projections. Dotted lines show cell outlines. (B) Localization of Sts5 in indicated strains. Images are spinning disc confocal sum projections. (C) Quantification of Sts5-mNG fluorescence intensity per stress granule following glucose refeed for indicated strains. Values are means ± SD (n = 50 granules per timepoint). ****p<0.0001. n.s.: not significant. Scale bars, 5 μm. (D) Quantification of number of Sts5-mNG granules per cell following glucose refeed for indicated strains. Values are means ± SD (n = 50 cells per timepoint). ****p<0.0001; ***p<0.001. n.s.: not significant. Scale bars, 5 μm. (E) Model showing PKA-dependent Pak1 localization to stress granules to promote rapid Sts5 dissolution during glucose refeed.
-
Figure 8—source data 1
Raw values shown on graphs in Figure 8C and D.
- https://cdn.elifesciences.org/articles/67648/elife-67648-fig8-data1-v2.xlsx
Figure 8—figure supplement 1
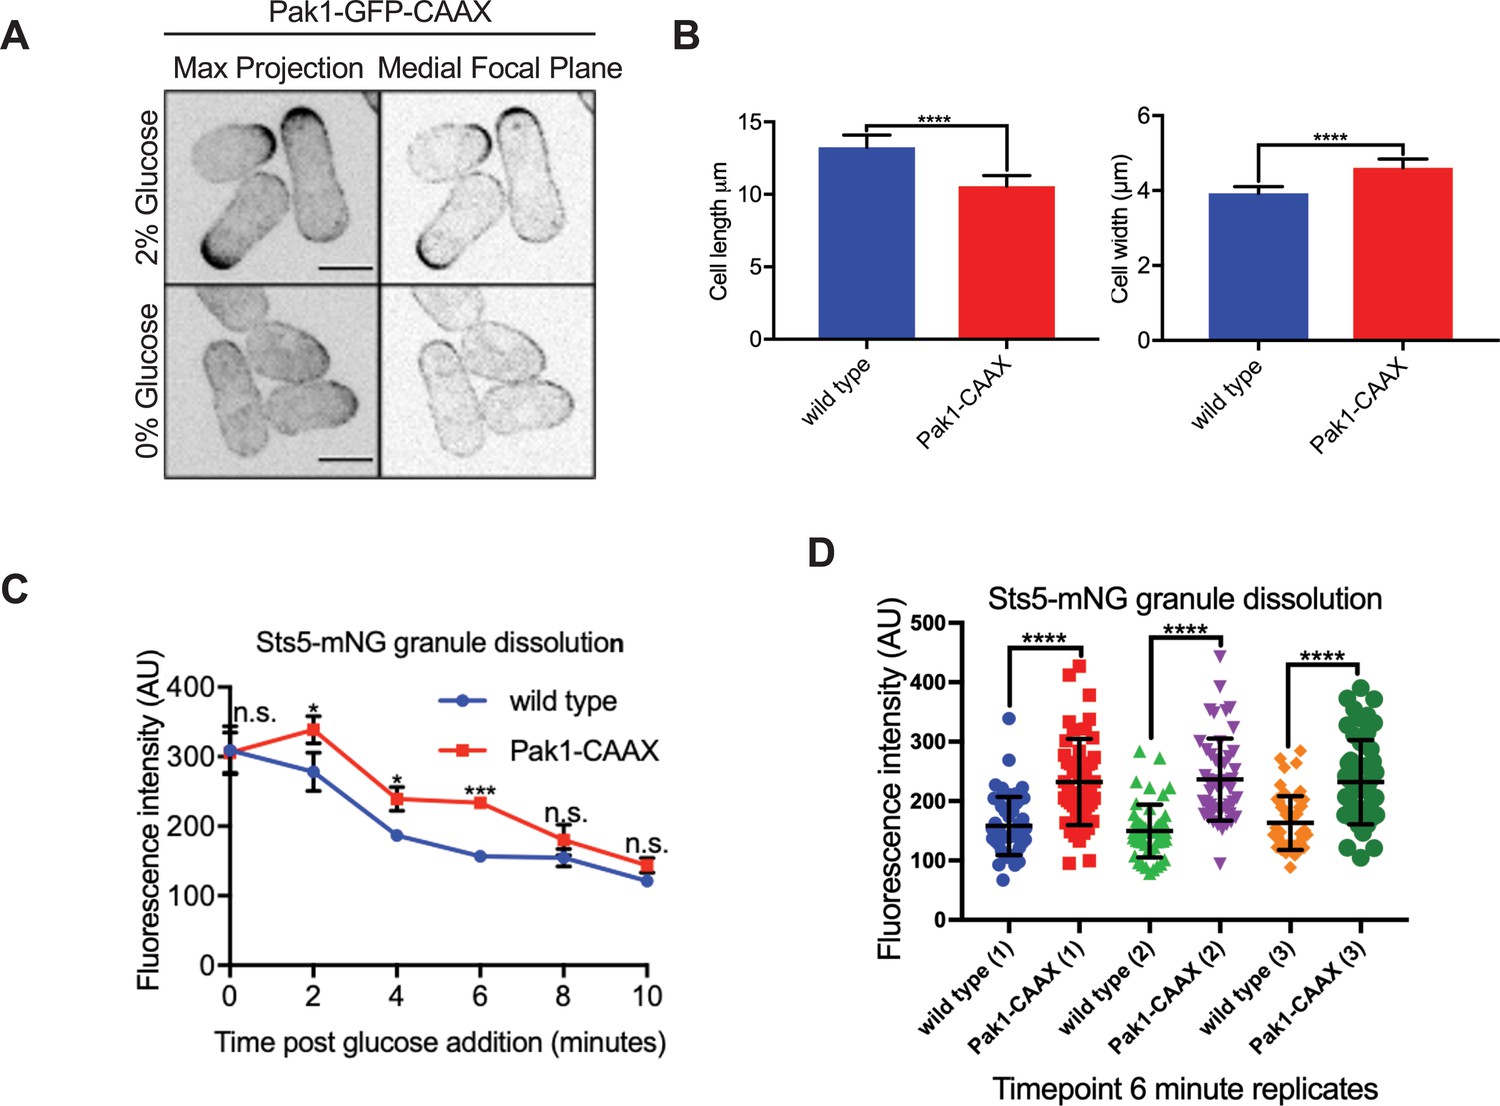
Pak1 functions at stress granules to promote Sts5 dissolution.
(A) Images of Pak1-CAAX by spinning disc confocal microscopy. Scale bars, 5 μm. (B) Quantification of cell length and width for the indicated strains. Values are mean ± SD (n ≥ 50 cells per strain). ****p<0.0001. (C) Quantification of stress granule dissolution from multiple experiments after glucose refeed for indicated strains. Values in this graph are means ± SD from three biological replicates (n = 50 granules per timepoint). One of these replicates is shown in Figure 8C. ***p<0.001; *p<0.05. n.s.: not significant. (D) Quantification of Sts5-mNG granule levels at 6 min timepoint from panel (C). Values are means ± SD of the three biological replicates (n = 50 granules per timepoint). ****p< 0.0001.
-
Figure 8—figure supplement 1—source data 1
Raw values shown on graphs in Figure 8—figure supplement 1B, C and D.
- https://cdn.elifesciences.org/articles/67648/elife-67648-fig8-figsupp1-data1-v2.xlsx
Additional files
-
Supplementary file 1
Table of yeast strains and plasmids used in this study.
- https://cdn.elifesciences.org/articles/67648/elife-67648-supp1-v2.xlsx
-
Supplementary file 2
Table of NanoString probe names and sequences.
- https://cdn.elifesciences.org/articles/67648/elife-67648-supp2-v2.xlsx
-
Supplementary file 3
Table of data from NanoString gene expression analysis.
- https://cdn.elifesciences.org/articles/67648/elife-67648-supp3-v2.xlsx
-
Transparent reporting form
- https://cdn.elifesciences.org/articles/67648/elife-67648-transrepform1-v2.docx
Download links
A two-part list of links to download the article, or parts of the article, in various formats.
Downloads (link to download the article as PDF)
Open citations (links to open the citations from this article in various online reference manager services)
Cite this article (links to download the citations from this article in formats compatible with various reference manager tools)
Pak1 kinase controls cell shape through ribonucleoprotein granules
eLife 10:e67648.
https://doi.org/10.7554/eLife.67648


