Strong confinement of active microalgae leads to inversion of vortex flow and enhanced mixing
- Department of Physics, Indian Institute of Science, India
- Centre for Condensed Matter Theory, Department of Physics, Indian Institute of Science, India
Figures
Figure 1
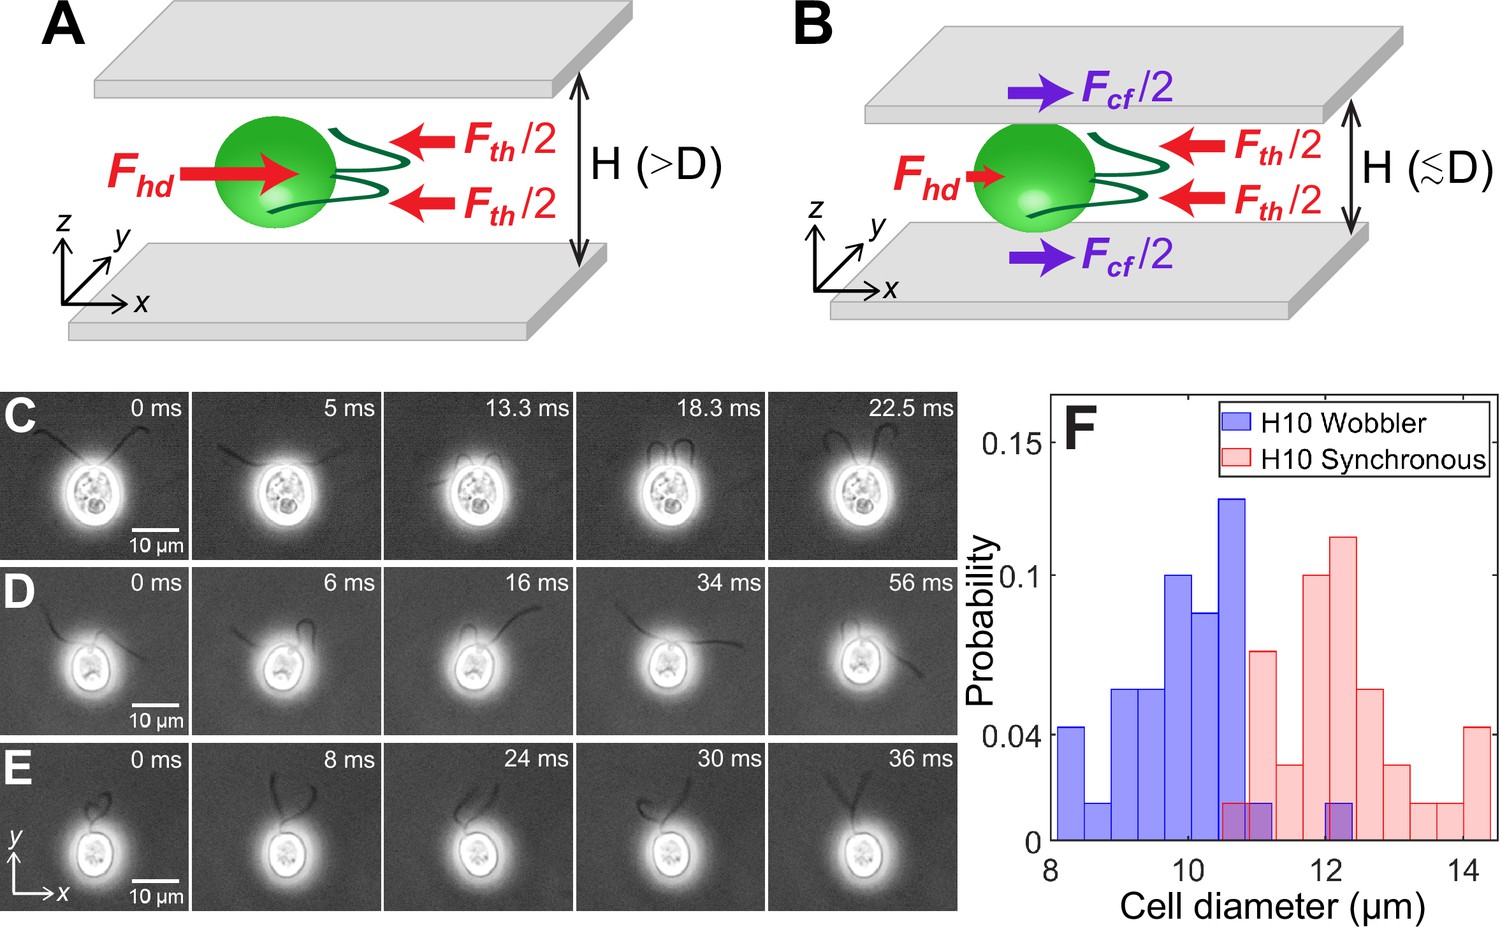
Cell size affects forces acting on confined microswimmers.
Schematics of the forces exerted by a Chlamydomonas cell (green) swimming along the x-axis in between two glass plates separated by height, under (A) weak confinement where the cell’s body diameter, , and (B) strong confinement where . Solid arrows represent local forces exerted by the cell on the surrounding medium. Fth and Fhd are the propulsive thrust distributed equally between the two flagella and hydrodynamic drag due to the cell body, respectively. Fcf is the contact friction with the strongly confining walls (B). Time lapse images of CR cells swimming in a quasi-2D chamber of height with (C) synchronously beating flagella with (); (D) asynchronously beating flagella (); and (E) paddler type flagellar beat (). The cell bodies in (D) and (E) wobble due to their irregular flagellar beat pattern and are called ‘Wobblers’. (F) Histogram of cell body diameter in the chamber of (number of cells, ). Synchronously beating cells () typically have larger diameter than Wobblers () and thus the H10 Synchronous cells with are strongly confined. Raw data is available in Figure 1—source data 1.
-
Figure 1—source data 1
Source data for Figure 1F.
- https://cdn.elifesciences.org/articles/67663/elife-67663-fig1-data1-v3.xlsx
Figure 2
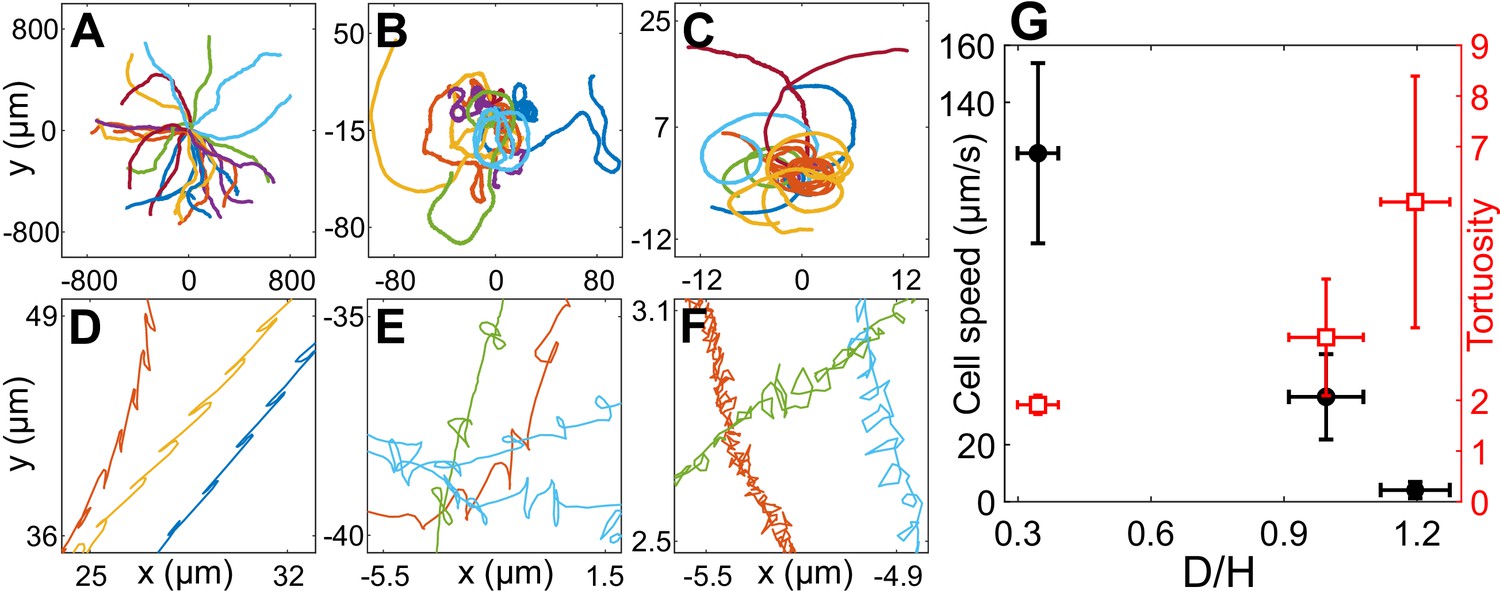
Cell motility in confinement.
Representative trajectories of Chlamydomonas reinhardtii (CR) cells in (A) (), (B) , Wobblers (); (C) , Synchronous cells (). All of these trajectories lasted for 8.2 s and their initial positions are shifted to origin. (D), (E) and (F) are the zoomed in trajectories of (A), (B) and (C), respectively. (G) Cell speed (circles) and tortuosity of trajectories (squares) as a function of the degree of confinement, ( for H30, H10 Wobbler and H10 Synchronous, respectively). The error bars in the plot correspond to standard deviation in diameter (x-axis), cell speed and tortuosity (y-axes) due to the heterogeneous population of cells. Raw data are available in Figure 2—source data 1–4.
-
Figure 2—source data 1
Source data for Figure 2A.
- https://cdn.elifesciences.org/articles/67663/elife-67663-fig2-data1-v3.xlsx
-
Figure 2—source data 2
Source data for Figure 2B.
- https://cdn.elifesciences.org/articles/67663/elife-67663-fig2-data2-v3.xlsx
-
Figure 2—source data 3
Source data for Figure 2C.
- https://cdn.elifesciences.org/articles/67663/elife-67663-fig2-data3-v3.xlsx
-
Figure 2—source data 4
Source data for Figure 2G.
- https://cdn.elifesciences.org/articles/67663/elife-67663-fig2-data4-v3.xlsx
Figure 3 with 1 supplement
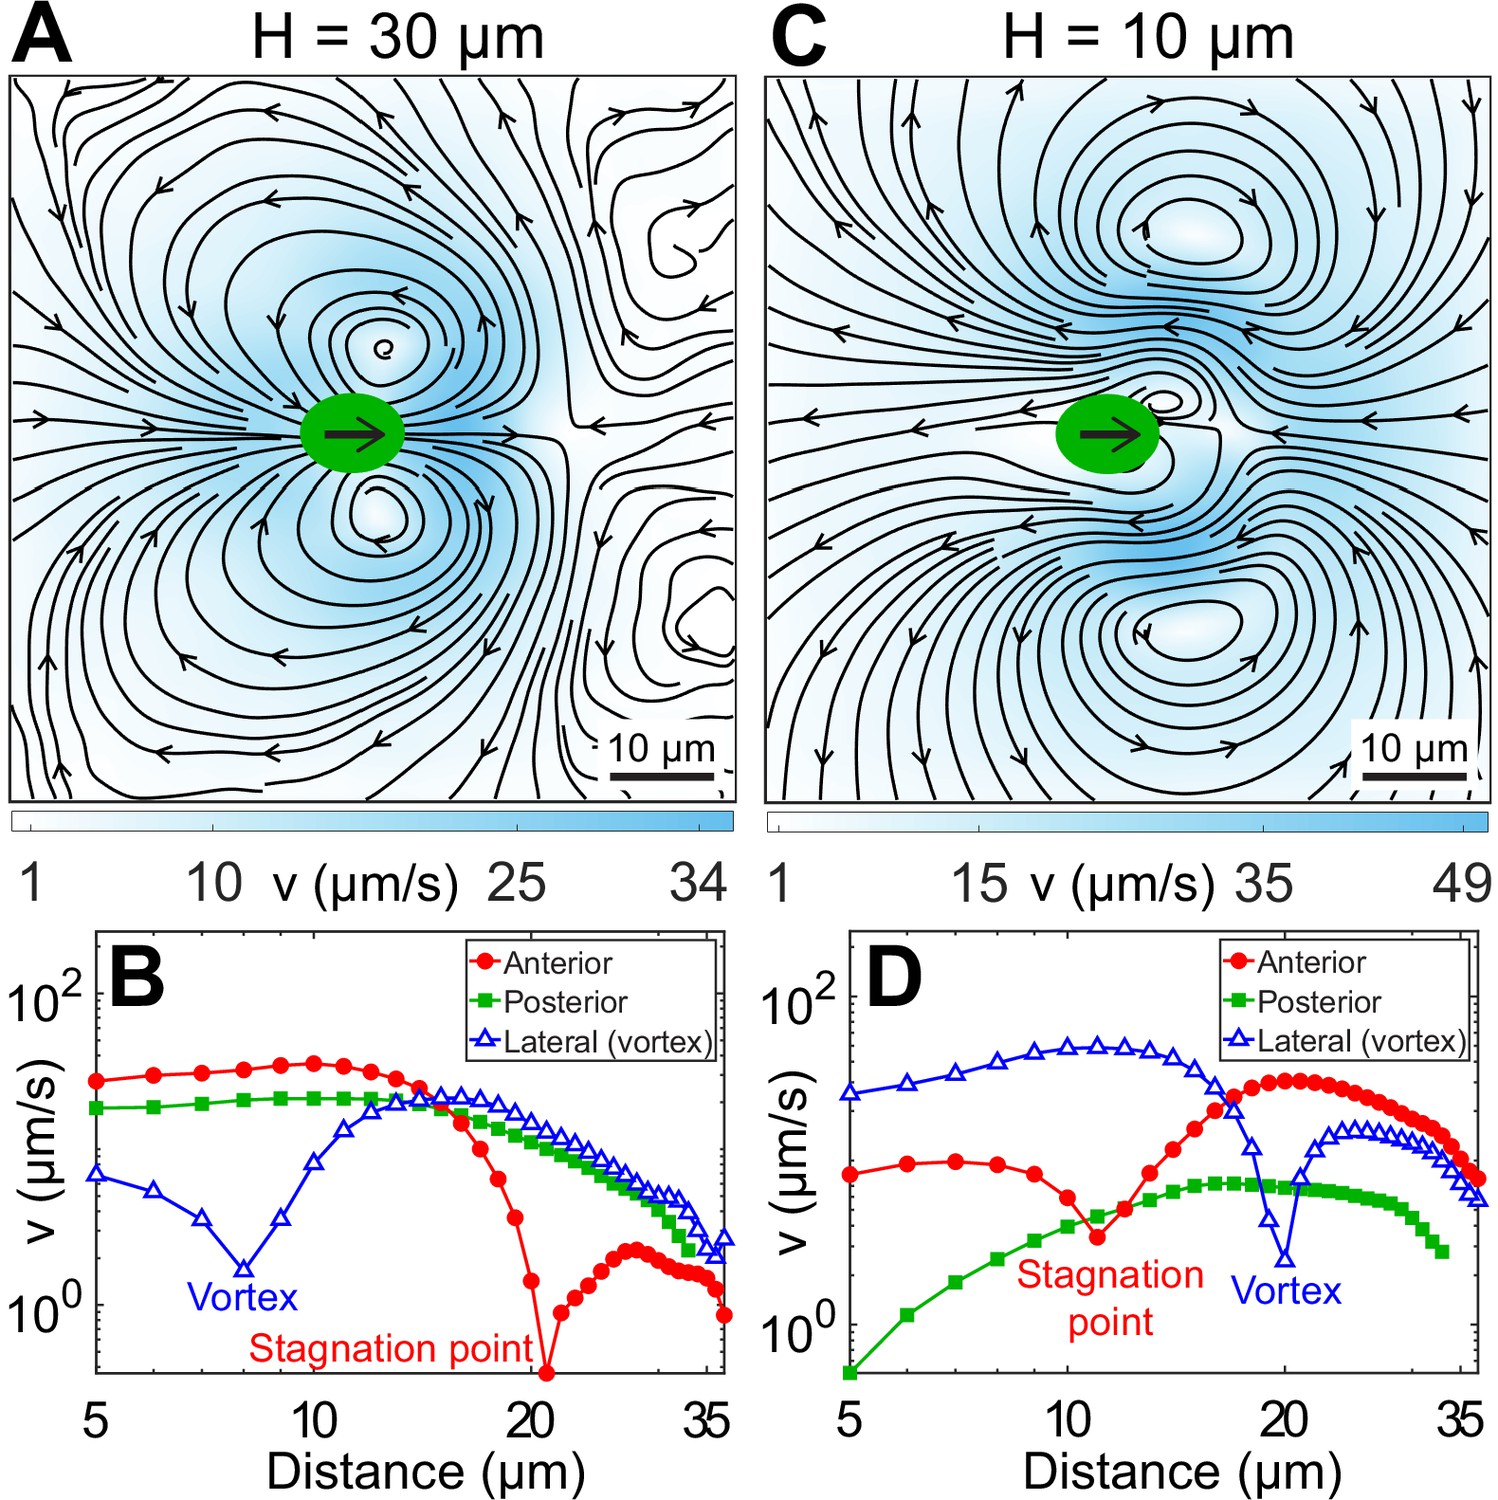
Experimental flow fields of Chlamydomonas reinhardtii (CR) cells in weak and strong confinement.
Experimentally measured, beat-averaged flow fields in the x–y plane of synchronously beating CR cells swimming in (A) , and (C) . Black arrows on the cell body indicate that the cells are swimming to the right. Solid black lines indicate the streamlines of the flow in lab frame. The colourbars represent flow magnitude, v. (B and D) denote the speed variation in (A and C), respectively, along anterior, posterior, and lateral to the cell (where the vortices are present). Distances along anterior and posterior are measured along horizontal lines from the cell centre (0, 0); whereas the lateral (vortex) distances are measured along the vertical line passing through (x, y) = (2, 0) for (B) and (8, 0) for (D), respectively. Raw data are available in Figure 3—source data 1 and Figure 3—source data 2.
-
Figure 3—source data 1
Source data for Figure 3A.
- https://cdn.elifesciences.org/articles/67663/elife-67663-fig3-data1-v3.xlsx
-
Figure 3—source data 2
Source data for Figure 3C.
- https://cdn.elifesciences.org/articles/67663/elife-67663-fig3-data2-v3.xlsx
Figure 3—figure supplement 1
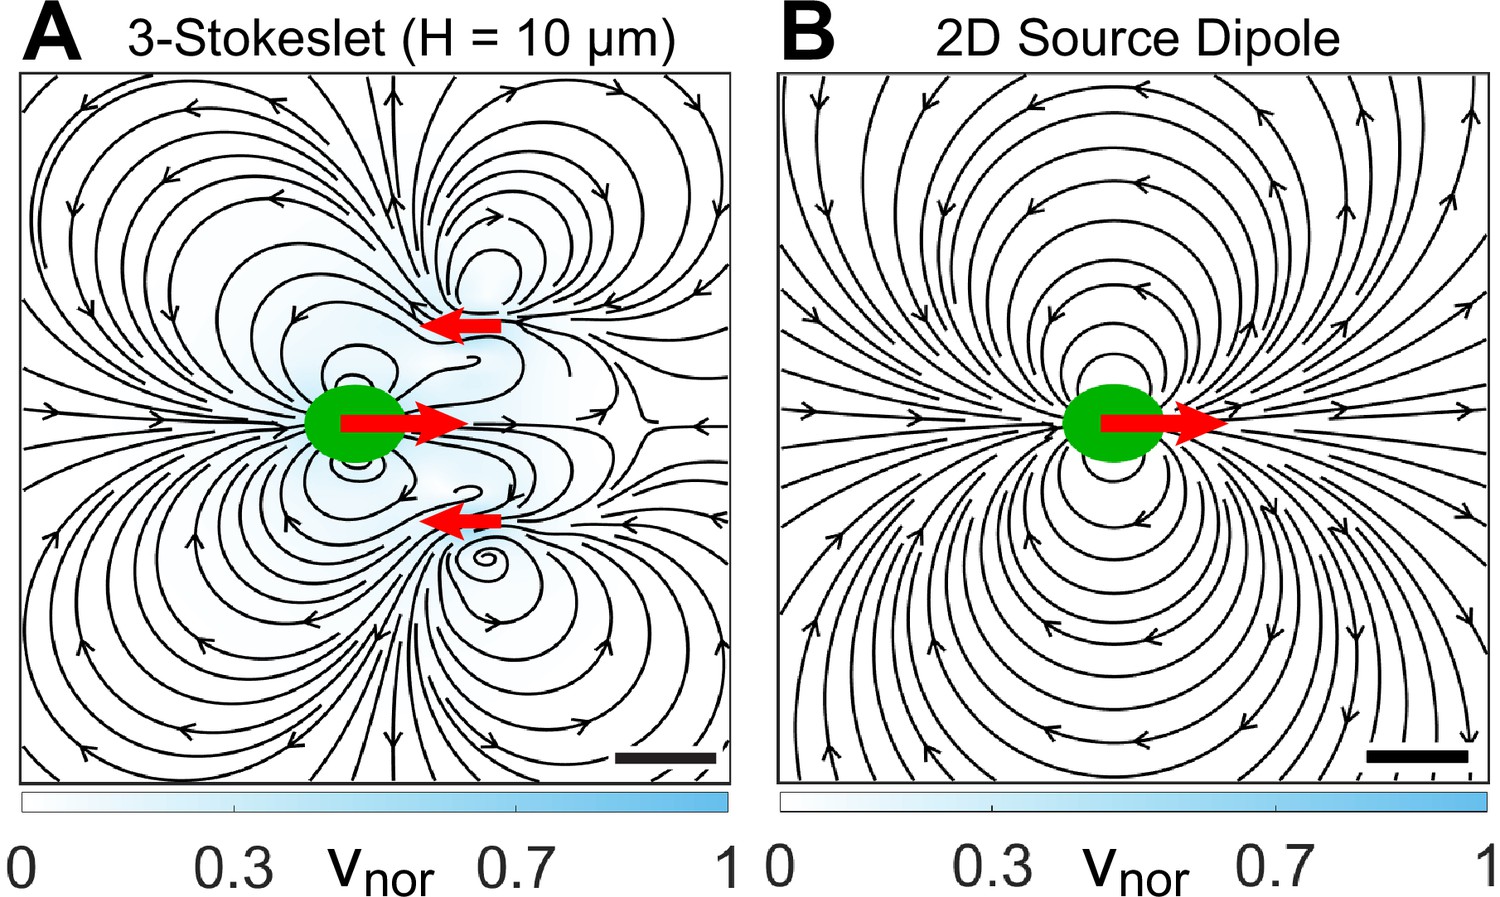
Expected flow fields of a strongly confined Chlamydomonas reinhardtii (CR) using conventional theoretical approaches.
(A) Theoretically computed near-field flow characteristics as expected from the screened version of the bulk flow field, that is, from the three-Stokeslet model in . The three Stokeslets denoted by red arrows represent the cell drag of strength +1 at (0, 0) and flagellar thrust of strength -1/2 each at (12,±10) μm. This flow field is calculated using the quasi-2D Brinkman equation, which is introduced later in this article. (B) Theoretically predicted far-field flow of a microswimmer in confinement (but under the influence of hydrodynamic stresses only) which is that of a 2D source dipole oriented along the propulsion direction (denoted by red arrow) (Brotto et al., 2013; Mathijssen et al., 2016). The colourbars represent flow magnitudes normalized by their maximum, vnor. Scale bars, 10 μm.
Figure 4 with 3 supplements
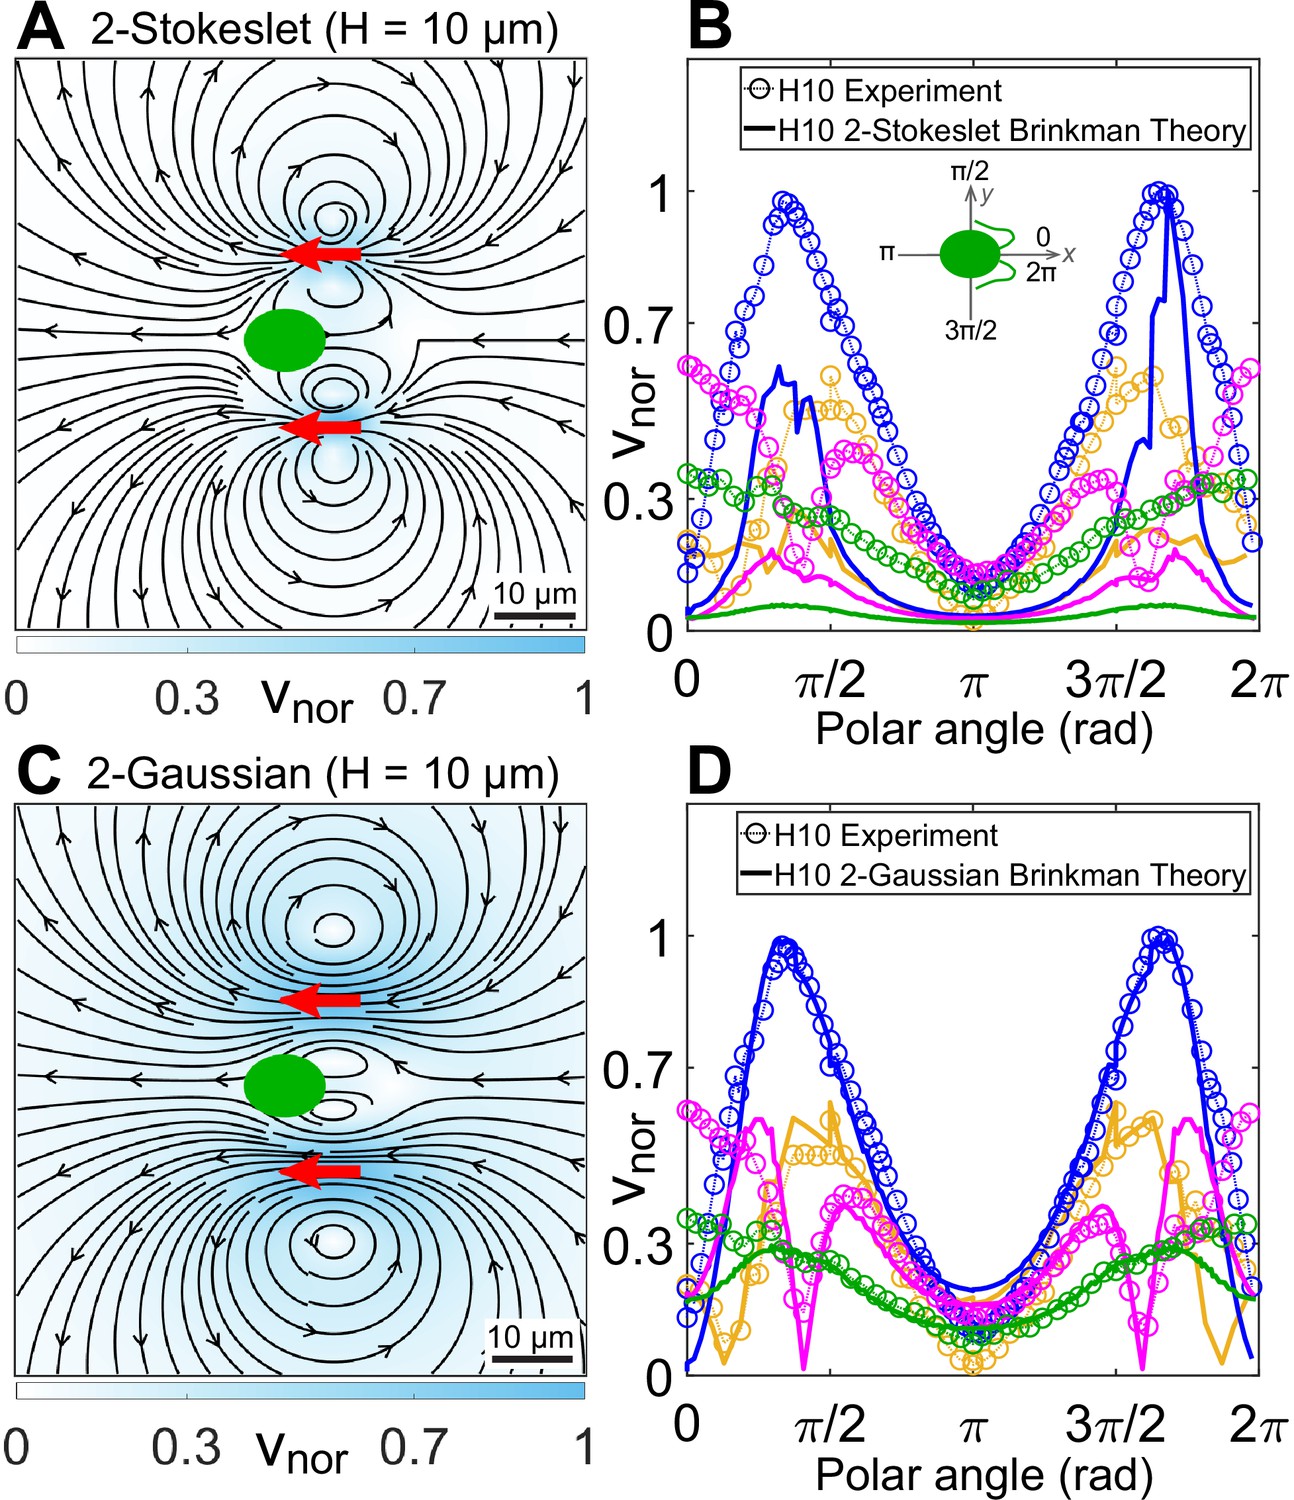
Theoretical flow fields in strong confinement.
Theoretically computed flow fields for (A) two Stokeslets and (C) two Gaussian forces, both positioned at (red arrows) using the quasi-2D Brinkman equation for at the plane. The colourbars represent flow magnitudes normalized by their maximum, . (B, D) Comparison of normalized experimental flow of the Chlamydomonas reinhardtii (CR) in (Figure 3C) with theoretical flow fields (A) and (C), respectively, along representative radial distances, r, from the cell centre as a function of polar angle. Inset of (B) shows the convention used for polar angle. Plots for each r denote the flow magnitudes for those grid points which lie in the radial gap (r, r + 1) μm; r (μm) = 7 (yellow), 13 (blue), 20 (magenta), and 30 (green). Raw data are available in Figure 4—source data 1 and Figure 4—source data 2.
-
Figure 4—source data 1
Source data for Figure 4A.
- https://cdn.elifesciences.org/articles/67663/elife-67663-fig4-data1-v3.xlsx
-
Figure 4—source data 2
Source data for Figure 4C.
- https://cdn.elifesciences.org/articles/67663/elife-67663-fig4-data2-v3.xlsx
Figure 4—figure supplement 1
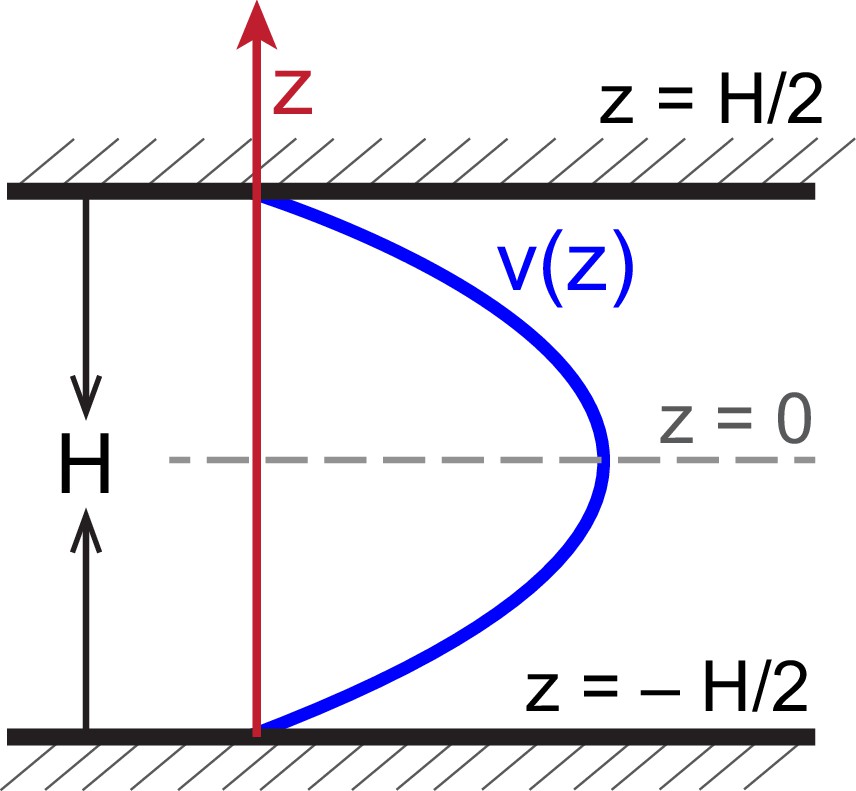
Schematic of velocity profile along the confining direction.
Schematic of flow profile along -direction, , in a chamber of height bounded by two solid walls.
Figure 4—figure supplement 2
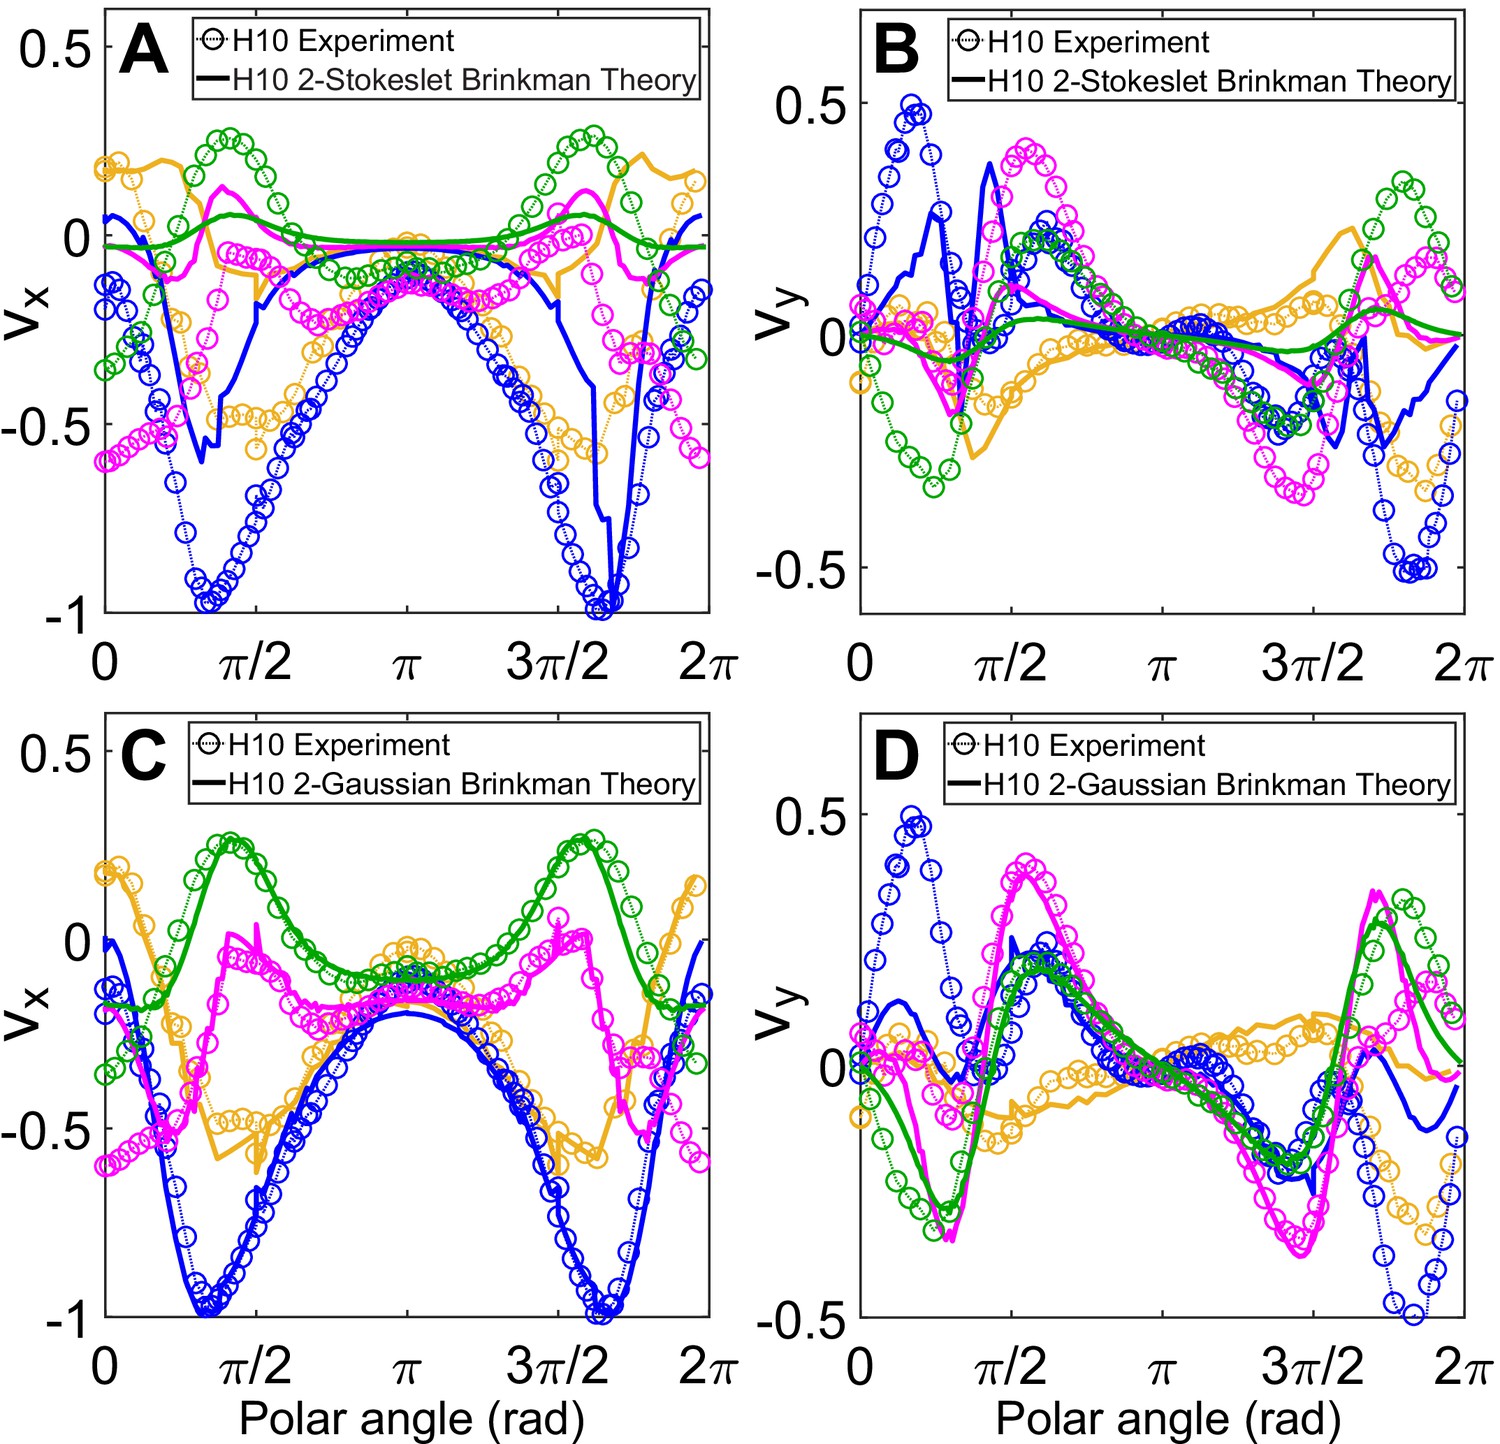
Comparison in the direction of flow fields between experiment and theory.
Comparison of (A, C) vx and (B, D) vy between normalized experimental flow of the Chlamydomonas reinhardtii (CR) in H = 10 μm (Figure 3C) with theoretical flow fields (Figure 4A, C), respectively, along representative radial distances, r, from the cell centre as a function of polar angle. Plots for each r denote the flow components for those grid points which lie in the radial gap (r, r + 1) μm; r (μm) = 7 (yellow), 13 (blue), 20 (magenta), and 30 (green).
Figure 4—figure supplement 3
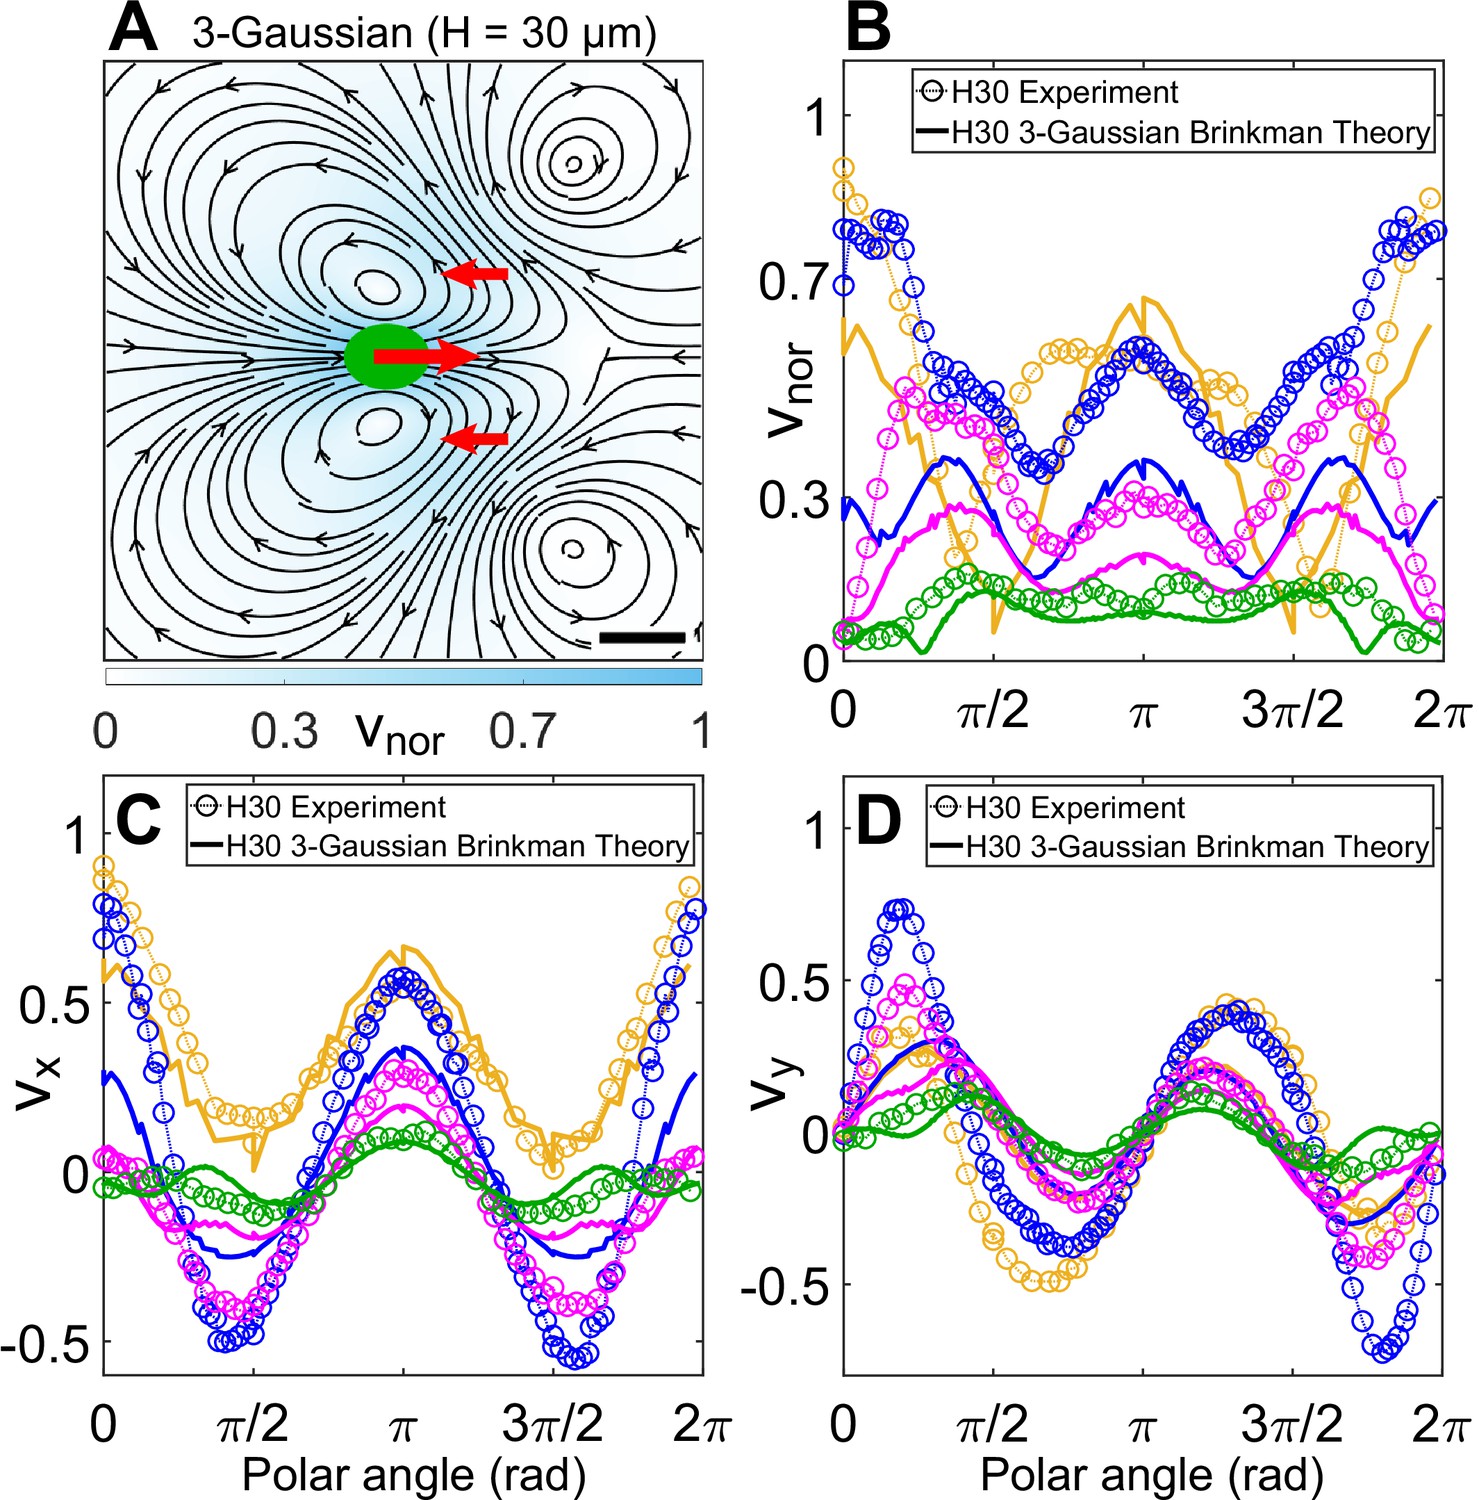
Theoretical flow field in weak confinement.
(A) Theoretically computed flow field from three-Gaussian forces (cell drag of strength +1 at (0,0), flagellar thrust of strength −1∕2 each at (12, ±10) μm; all denoted by red arrows) using the quasi-2D Brinkman equation for H = 30 μm at the z = 0 plane. The Gaussian standard deviation, σ for cell and flagellum are 3 and 5 μm, respectively. The colourbar represents flow magnitude normalized by its maximum, vnor. Scale bar, 10 μm. Comparison of (B) |v|, (C) vx, and (D) vy between normalized experimental (Figure 3A) and theoretical flow field (A) of a cell swimming in H = 30 μm along representative radial distances, r, from the cell centre as a function of polar angle. The convention used for polar angle is same as in Figure 4B, D. Plots for each r denote the flow magnitudes for those grid points which lie in the radial gap (r, r + 1) μm; r (μm) = 7 (yellow), 13 (blue), 20 (magenta), and 30 (green).
Figure 5 with 1 supplement
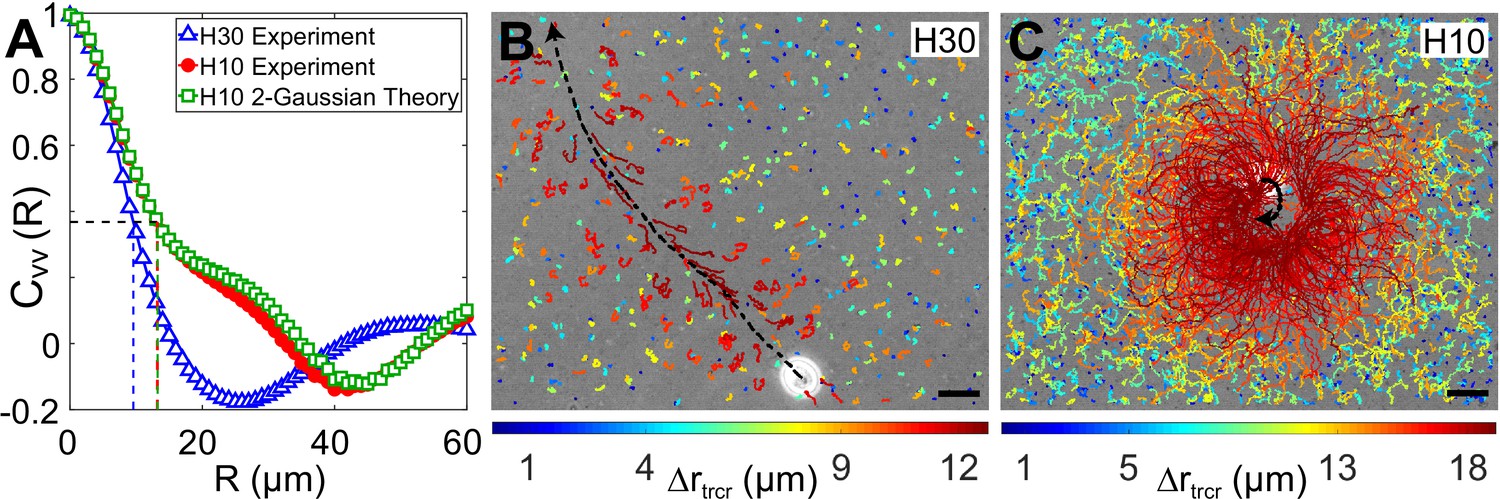
Correlation in fluid flow and tracer displacements.
(A) Normalized radial velocity–velocity correlation function, , of flow fields in Figures 3A, C, 4C. The dashed vertical lines denote the correlation length scales for the flows, (H30) and 13.2 μm (H10, both experiment and theory), where the correlation function decays to 1/e (horizontal dashed line). (B and C) Snapshots showing passive tracer trajectories (coloured) due to a Chlamydomonas reinhardtii (CR) cell (white) swimming along the black dashed arrow in and , respectively. The H30 swimmer () passes through the field of view within 1.3 s whereas the H10 cell () traces a semicircular trajectory staying in the field of view for the recording time of 8.2 s. The tracer trajectories are colour coded, according to the colourbar below, based on their maximum displacement, , during a fixed lag time of (∼10 flagellar beat cycles). Scale bars, 15 μm. Raw data is available in Figure 5—source data 1.
-
Figure 5—source data 1
Source data for Figure 5A.
- https://cdn.elifesciences.org/articles/67663/elife-67663-fig5-data1-v3.xlsx
Figure 5—figure supplement 1

Mean-squared displacement (MSD) of tracers.
MSD of tracers, , due to a representative Chlamydomonas reinhardtii (CR) cell swimming through the field of view in (A) and (B) . Semi-transparent lines represent the MSD of ∼500 tracers for each video where a single swimmer is passing through the field of view and the solid line with symbols denotes the average tracer MSD from six such videos. Black dashed lines indicate linear fit to the log–log data of average MSD vs lag-time () where denotes the MSD exponent, .
Appendix 1—figure 1
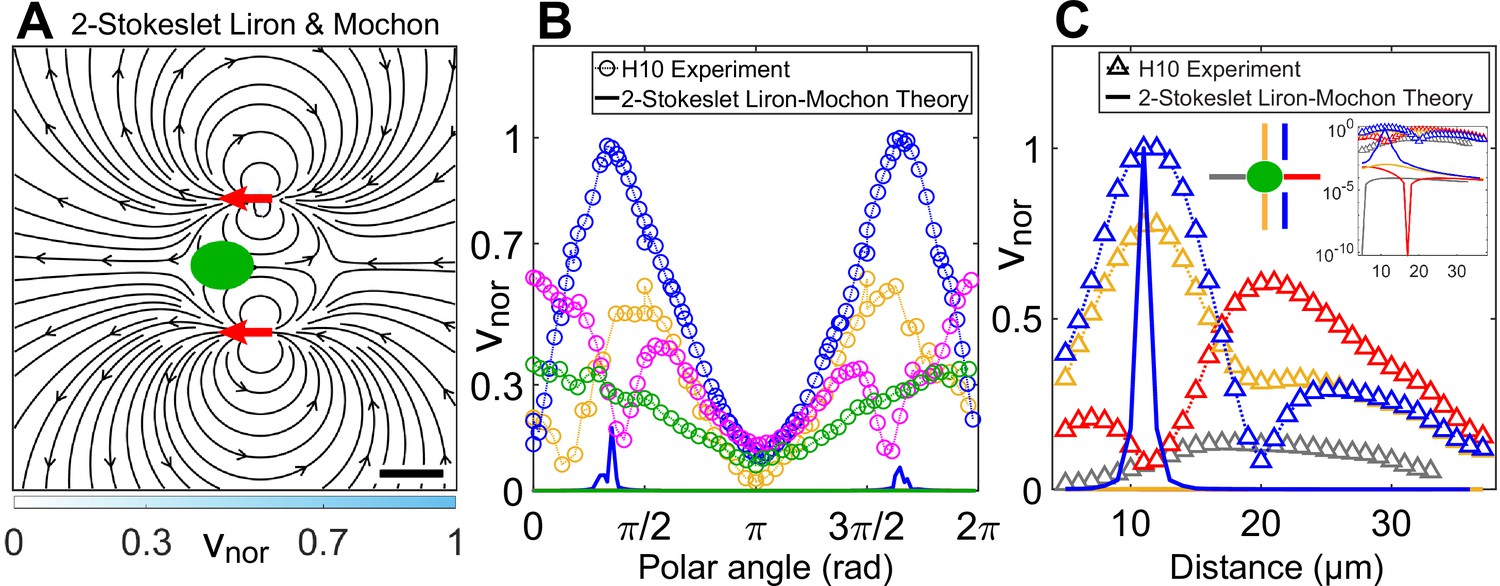
Theoretically computed flow field in confinement from Liron and Mochon’s formula.
(A) Theoretically computed flow field using Liron and Mochon’s solution for two-Stokeslet model in 2D. The red arrows at (6, ±11) μm denote the position of the Stokeslets. The colourbar represents flow magnitude normalized by its maximum, . Scale bar, 10 μm. (B) Comparison between normalized experimental flow of a cell swimming in (Figure 3C) and Liron and Mochon’s theoretical flow field (A) along representative radial distances, from the cell centre as a function of polar angle; (yellow), 13 (blue), 20 (magenta), and 30 (green). (C) Flow magnitude variation along four directions as indicated by separate colours in the middle inset (lateral to vortex [blue], lateral to cell centre [yellow], anterior [red], posterior [grey]) for the normalized experimental (symbols) and theoretical (solid lines) velocity fields in Figure 3C and (A), respectively. Except for the theoretical speed along the vortex direction (blue), others are negligible compared to the experiment as shown in the rightmost inset, which is a semilog plot of (C) in the y-axis.
Appendix 1—figure 2
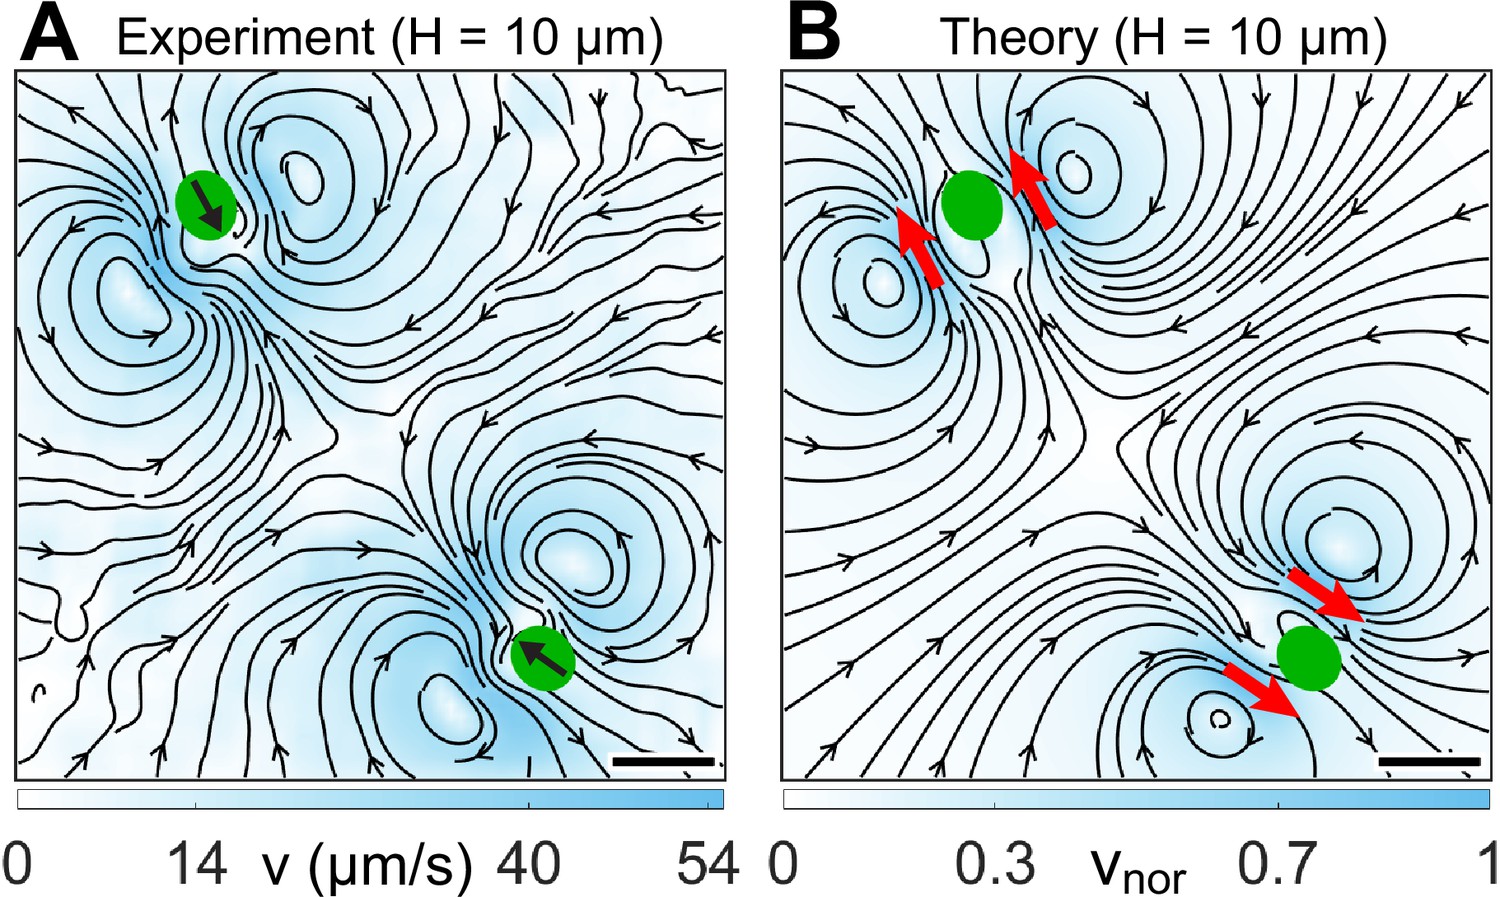
Flow fields due to two strongly confined H10 cells.
(A) Experimentally measured flow field for two synchronous cells swimming in . This flow is averaged over ∼30 beat cycles for each cell during which the cells move merely 0.05 times their respective body diameters (). The centre-to-centre distance between the swimmers is 8.75D. Black arrows on the cell bodies indicate their swimming direction. Solid black lines indicate the streamlines of the flow in lab frame. The colourbar represents flow magnitude, . (B) Theoretically computed flow field by linearly superposing two two-Gaussian Brinkman flow, one for each cell. The positions of the pair of two-Gaussian forces at approximate flagellar positions are denoted by red arrows. The streamlines, vortex flows, and stagnation point at the centre of the grid match qualitatively with the experimental one (A). The colourbar represents flow magnitudes normalized by its maximum, . Scale bars, 20 μm.
Videos
Video 1
Video of a strongly confined Chlamydomonas cell swimming with synchronous beat in the presence of tracers.
High-speed video microscopy of a strongly confined swimmer (synchronously beating Chlamydomonas cell in H = 10 μm chamber) in the presence of tracer particles at 500 frames/s. This phase-contrast video clearly shows the synchronous breaststroke and planar beating of flagella with intermittent phase slips. This is the representative cell whose flow field is shown in Figure 3C. The direction of vortex flow is evident from the tracers’ motion.
Video 2
Video of wobbling Chlamydomonas cells with asynchronous or paddling flagellar beat.
Flagellar waveform of Chlamydomonas cells in H = 10 μm chamber with wobbling cell body, that is, H10 Wobblers. The video is divided into three parts. The first part shows the asynchronous and planar flagellar beat of a cell which leads to a wobbling motion of the cell body. The second part shows the distinctive paddling flagellar beat of a cell, anterior to the cell body. Here, the flagellar beat plane is perpendicular to the imaging x–y plane and one of the flagella is mostly out of focus. In both these cases, the cell bodies wobble due to their irregular flagellar beat pattern. The third part shows a representative H10 Wobbler which switches from paddling beat to an asynchronous one.
Video 3
Video of a weakly confined Chlamydomonas cell swimming in the presence of tracers.
High-speed video microscopy of a weakly confined Chlamydomonas cell swimming in H = 30 μm chamber in the presence of tracer particles at 500 frames/s. This video shows the natural motility of cells in bulk where they spin about their body axis. The video starts with the cell and its flagella beating in the image plane. At ∼90–180 ms, the flagellar beat of the cell is out of the image plane, when the cell body is rotating about its axis. The flow field is calculated only when the flagellar beat of the H30 cell is in the image plane, that is, for 0–90 and 180–252 ms for this particular video.
Tables
Appendix 1—table 1
Flow-based Péclet number calculation from the flow fields.
| Vortical flow speed, (Figure 3A, C) | 30 | 45 (also frontal flow) |
| Vortical diameter, 2 × vortex point distance (Figure 3B, D) | 2 × 8.5 = 17 | 2 × 20 = 40 |
| (s) | 0.57 | 0.8 |
| (s) | 0.3 | 1.6 |
| 0.5 | 2 |
Additional files
-
Transparent reporting form
- https://cdn.elifesciences.org/articles/67663/elife-67663-transrepform1-v3.docx
-
Source code 1
Custom-written MATLAB source codes.
- https://cdn.elifesciences.org/articles/67663/elife-67663-supp1-v3.zip
Download links
A two-part list of links to download the article, or parts of the article, in various formats.
Downloads (link to download the article as PDF)
Open citations (links to open the citations from this article in various online reference manager services)
Cite this article (links to download the citations from this article in formats compatible with various reference manager tools)
Strong confinement of active microalgae leads to inversion of vortex flow and enhanced mixing
eLife 10:e67663.
https://doi.org/10.7554/eLife.67663


