Behavioral control by depolarized and hyperpolarized states of an integrating neuron
- Lulu and Anthony Wang Laboratory of Neural Circuits and Behavior, The Rockefeller University, United States
- Chan Zuckerberg Initiative, United States
Figures
Figure 1 with 1 supplement
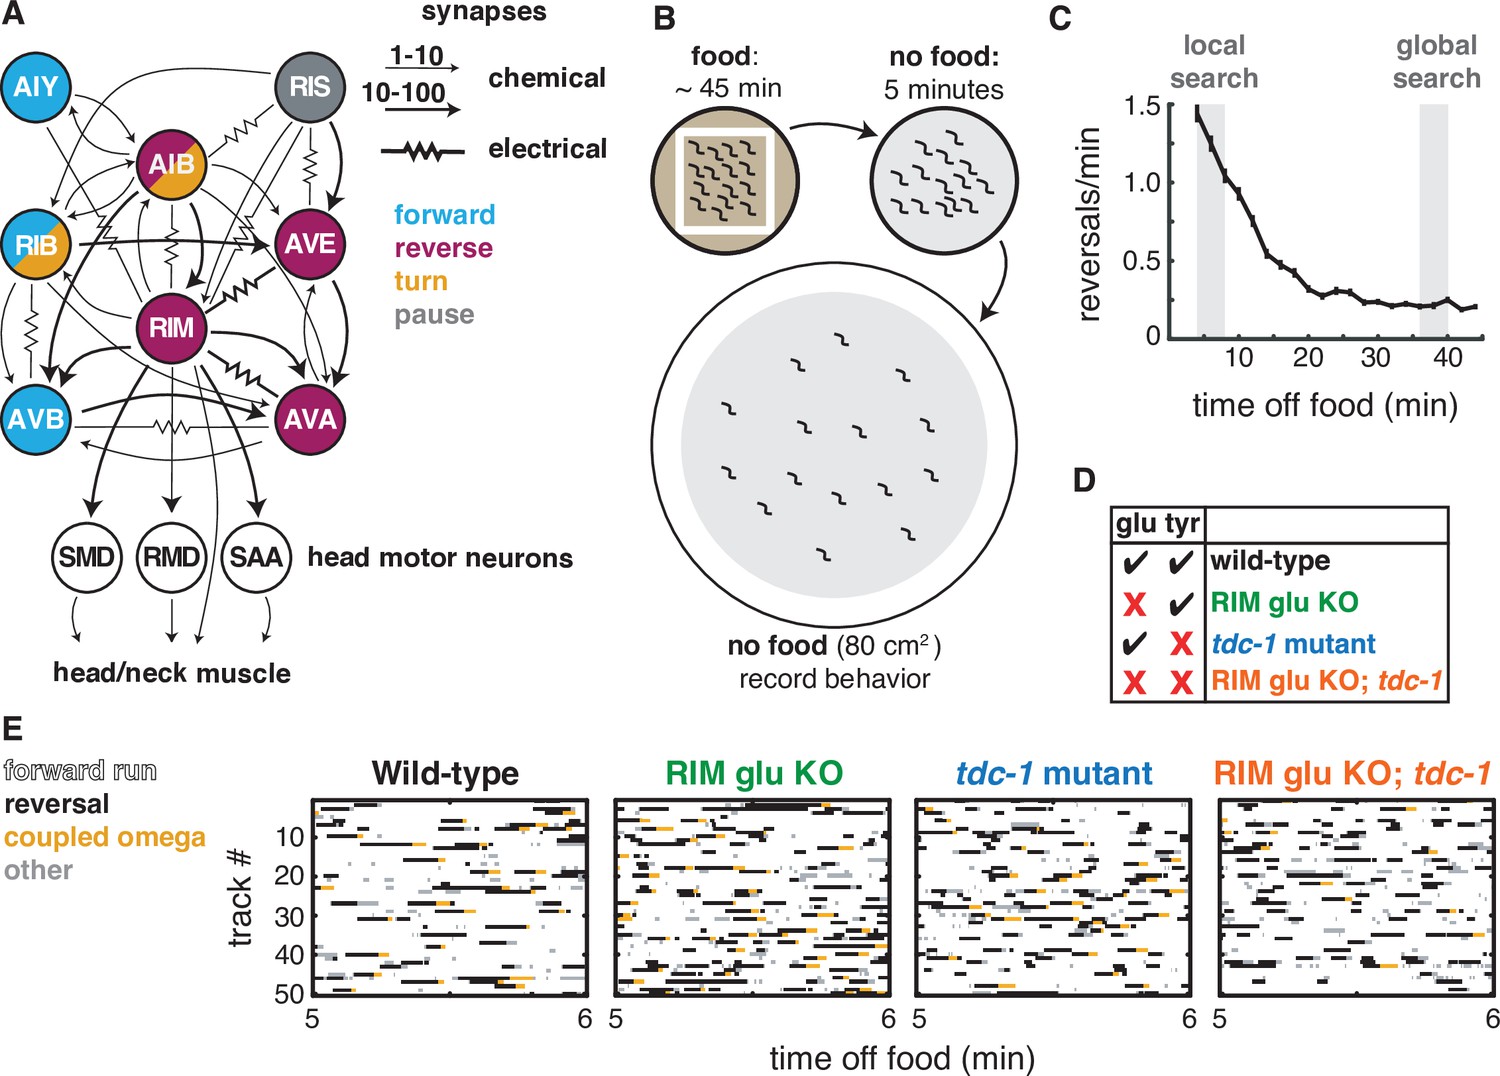
Two RIM neurotransmitters affect spontaneous locomotion.
(A) RIM synapses with interneurons, motor neurons, and muscle implicated in spontaneous foraging behavior (Cook et al., 2019; White et al., 1986). Colors of neurons indicate associated locomotor states based on neural manipulations and functional calcium imaging (Alkema et al., 2005; Gray et al., 2005; Kato et al., 2015; Li et al., 2014; Pokala et al., 2014; Steuer Costa et al., 2019; Wang et al., 2020; Zheng et al., 1999). (B) Off-food foraging assay. (C) Mean reversals per minute of wild-type animals in foraging assays. Vertical lines indicate standard error of the mean. Gray shaded boxes indicate local search (4–8 min off food) and global search (36–40 min off food) intervals analyzed in subsequent figures. n = 324. (D) RIM neurotransmitter mutants. RIM glu KO: RIM-specific knockout of the vesicular glutamate transporter EAT-4 (Figure 1—figure supplement 1). tdc-1, tyrosine decarboxylase mutant, which lacks tyramine in RIM and octopamine in RIC. (E) Ethograms of 50 randomly chosen tracks per genotype during minute 5–6 of local search. Color code: white, forward runs; black, reversals; yellow, omega turns coupled to a reversal; gray, pauses, shallow turns, and omega turns that were not preceded by a reversal.
Figure 1—figure supplement 1
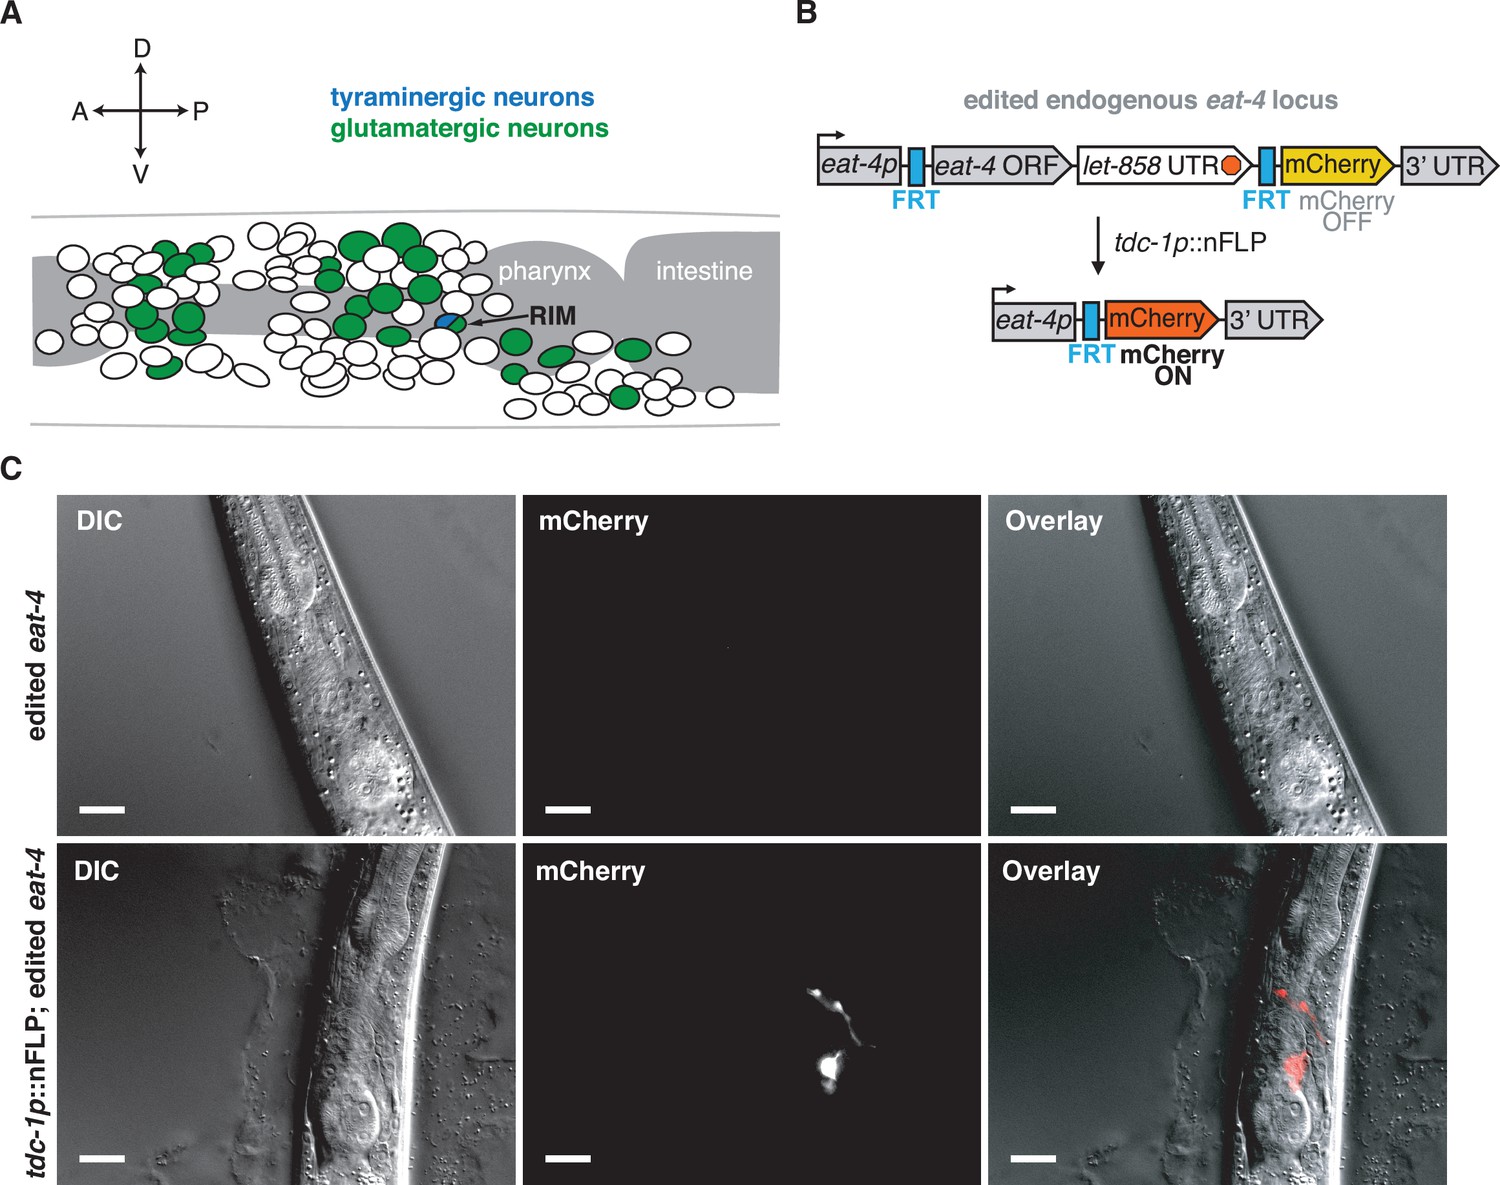
CRISPR-Cas9-generated alleles enable RIM-specific glutamate transporter knockout.
(A) Schematic of the sources of glutamate and tyramine in the C. elegans nervous system. Adapted from Pereira et al., 2015. (B) Schematic of cell-specific glutamate transporter knockout genetic strategy. Using CRISPR-Cas9, an FRT site was inserted immediately before the start codon of eat-4 (VGLUT) and let-858 3′-UTR::FRT::mCherry immediately after the stop codon of eat-4. let-858 3′-UTR stops transcription so mCherry is not expressed. To knock out glutamate release in this edited strain, nuclear-localized flippase (nFLP) was expressed under a tdc-1 promoter. The intersection of tdc-1 and eat-4 expression is limited to RIM, leading to excision of the eat-4 ORF in RIM, confirmed by mCherry expression in the targeted cells. (C) Validation of CRISPR-Cas9 recombination. Top panel: differential interference contrast (DIC) (left), mCherry fluorescence (middle), and merged (right) images of animals with edited endogenous eat-4 (VGLUT) locus. In the edited strain, there is no mCherry expression, confirming that the let-858 3′-UTR stops transcription. Bottom: DIC (left), mCherry (middle), and merged (right) images for edited eat-4 strain following RIM-specific nFLP expression (tdc-1p::nFLP). mCherry is expressed only in RIM neurons, the intersection of eat-4 and tdc-1 expression. mCherry specificity for RIM was confirmed by screening 30 animals. Scale bar is 20 μM.
Figure 2 with 2 supplements

RIM glutamate and tyramine suppress spontaneous reversals and increase reversal length.
(A) Mean reversals per minute in foraging assays for genotypes analyzed in Figures 2–3. Vertical dashes indicate standard error of the mean. n = 296–332. All strains bear tdc-1p::nFLP and the elt-2p::nGFP marker (Figure 2—figure supplement 1, Supplementary file 1, Table 3: Reversals and forward runs, n values). (B) Mean frequency of all reversals during local search (4–8 min off food, left) and global search (36–40 min off food, right). (C) Normalized probability distribution of wild-type reversal lengths during local search. Short reversals cover less than 0.5 body lengths. (D) Mean frequency of long reversals (>0.5 body lengths, left) and short reversals (<0.5 body lengths, right) during local search. (E) Normalized probability distribution of mutant reversal lengths during local search, plotted with WT distributions. (F) A forward-moving animal (0) initiates a reversal (1–2) that is coupled to an omega turn (3) and terminates in forward movement (4) (reversal-omega, left). A forward-moving animal (0) initiates a reversal (1) that terminates in forward movement (2) (pure reversal, right). Yellow dot indicates nose. (G) Fraction of all reversals during local search that terminate in an omega turn (left) or forward movement (right) for each genotype. (H) Absolute change in direction after a reversal-turn maneuver (including omega and shallower turns) for each genotype. (B, D, G, H) Each gray dot is the mean for 12–15 animals on a single assay plate (Source data 1), with 22–24 plates per genotype. Boxes indicate median and interquartile range for all assays. Asterisks indicate statistical significance compared to WT using a Kruskal–Wallis test with Dunn’s multiple comparisons test (**p-value<0.01, ***p-value<0.001, ns = p-value≥0.05). (C, E) n = 1443–2760 events per genotype. The reversal defects in (RIM) tyramine- and (RIC) octopamine-deficient tdc-1 mutants are not shared by octopamine-deficient tbh-1 mutants (Figure 2—figure supplement 2).
Figure 2—figure supplement 1
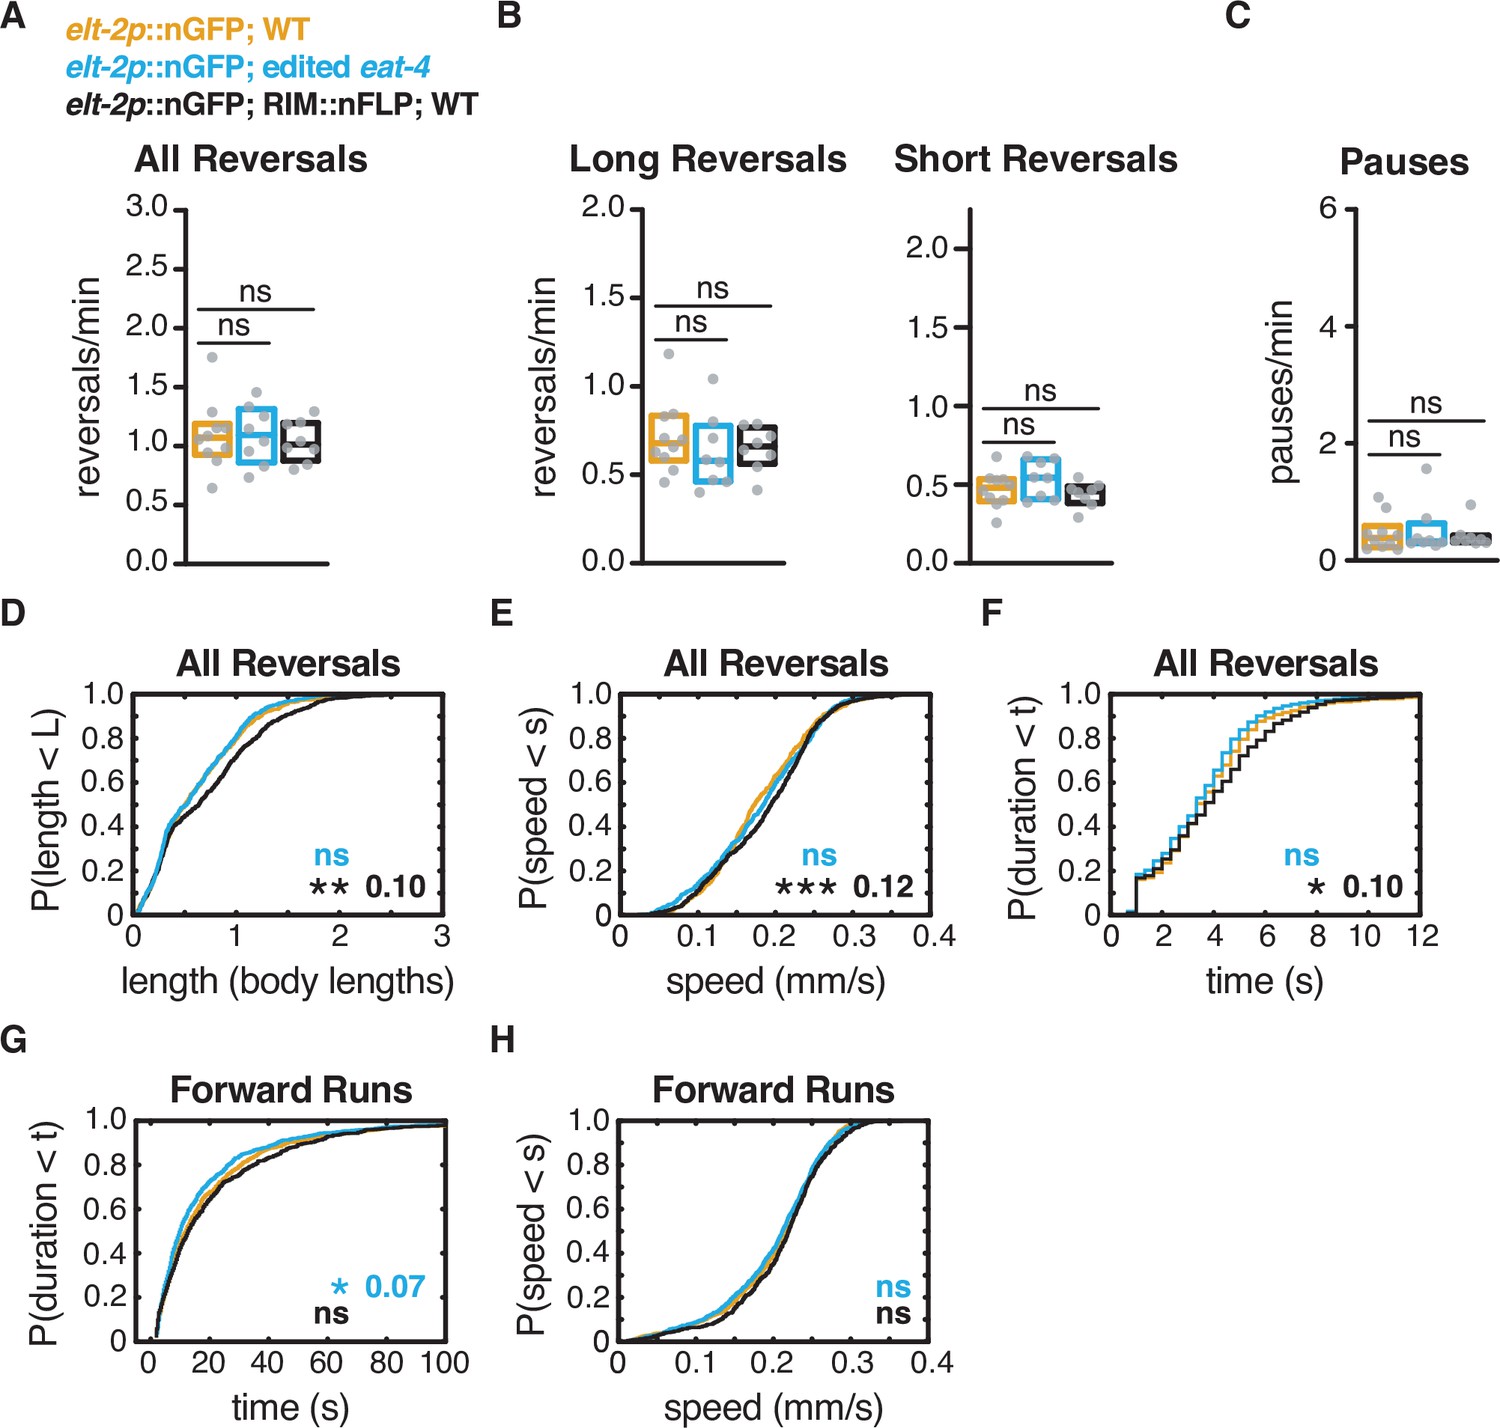
RIM::nFLP and edited eat-4 do not account for RIM glu KO phenotype.
(A) Mean frequency of all reversals during local search (4–8 min off food). (B) Mean frequency of long reversals (>0.5 body lengths, left) and short reversals (<0.5 body lengths, right) during local search. (C) Mean frequency of pauses during local search. (D–F) For all reversals during local search, empirical cumulative distributions of reversal length (D), reversal speed (E), and reversal duration (F). (G, H) For all forward runs ≥2 s in duration during local search, empirical cumulative distributions of run duration (G) and run speed (H). (A–C) Each gray dot is the mean for 12–15 animals on a single assay plate (Source data 1), with 22–24 plates per genotype. Boxes indicate median and interquartile range for all assays. Asterisks indicate statistical significance compared to elt-2p::nGFP; WT using a Mann–Whitney test (ns = p-value≥0.05). (D–H) Asterisks indicate statistical significance compared to WT using a two-sample Kolmogorov–Smirnov test (*p-value<0.05, ***p-value<0.0001, ns = p-value≥0.05). Numbers in figures indicate effect size (see Materials and methods). n = 584–913 events per genotype from 8 to 10 assays, 12–15 animals per assay (Supplementary file 1, Table 3: Reversals and forward runs, n values).
Figure 2—figure supplement 2
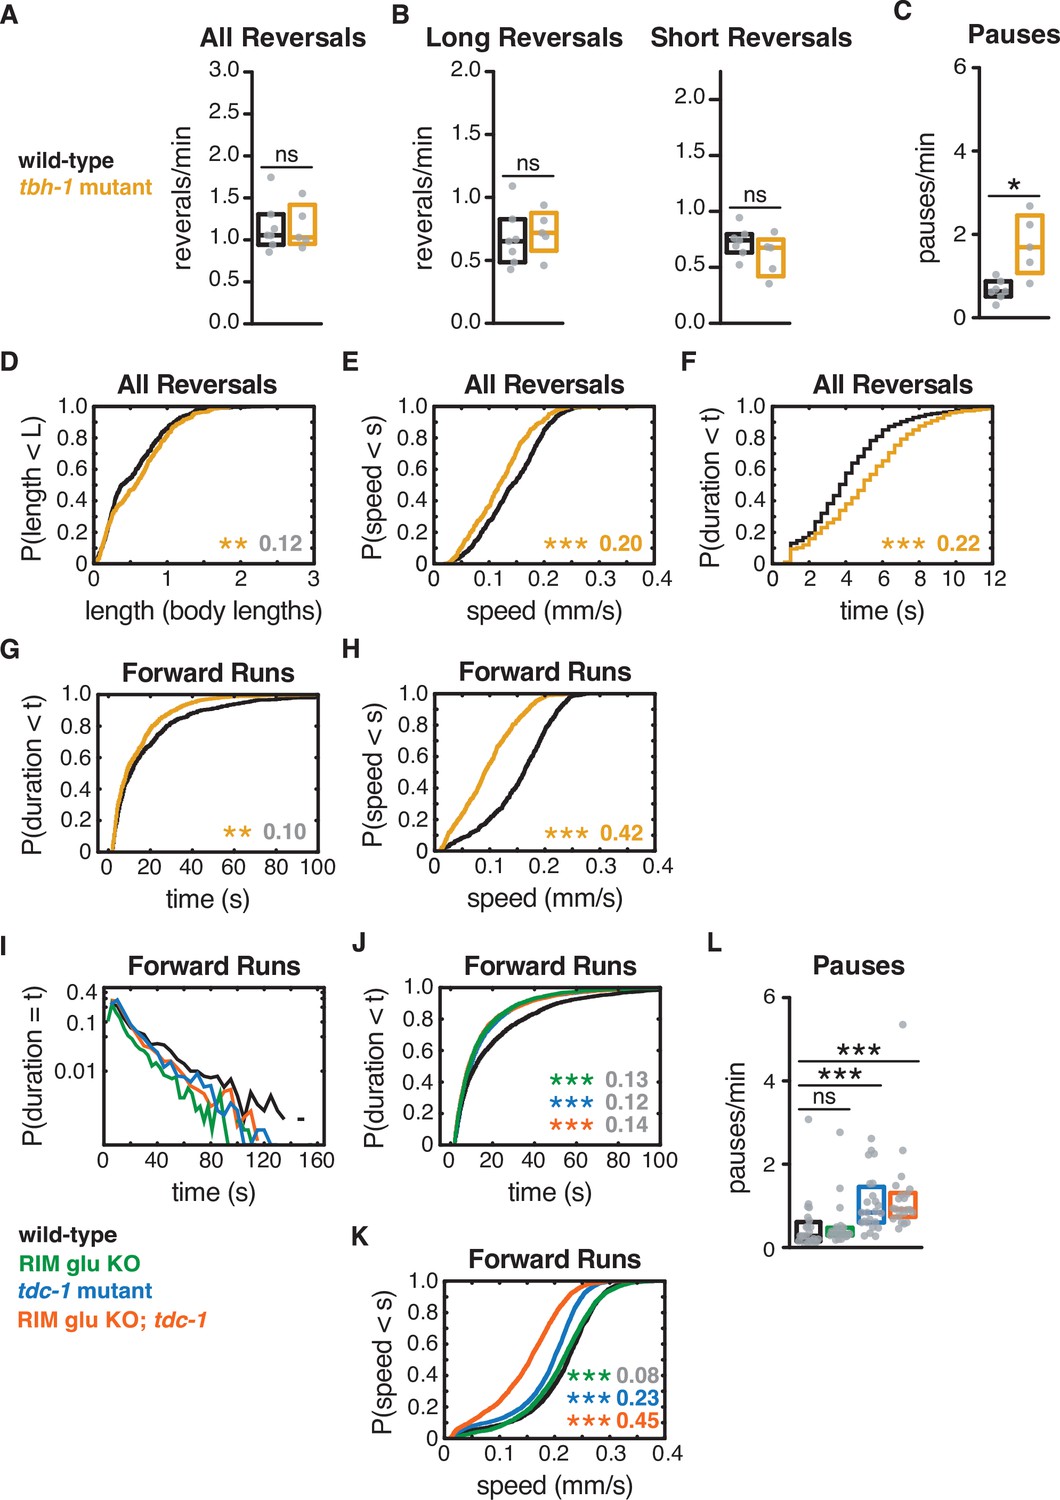
Octopamine affects forward and reversal speed, but not reversal length or frequency.
(A–H) tbh-1 mutants, which are deficient in the synthesis of octopamine, were deficient in reversal speed to a lesser extent than tdc-1 mutants, without decreasing reversal length. Comparing these two mutants, we conclude that tyramine increases reversal length and speed. tbh-1 mutants had a large reduction in forward speed, comparable to that of tdc-1 mutants, and decreased forward run duration. (A) Mean frequency of all reversals during local search (4–8 min off food). (B) Mean frequency of long reversals (>0.5 body lengths, left) and short reversals (<0.5 body lengths, right) during local search. (C) Mean frequency of pauses during local search. (D–F) For all reversals during local search, empirical cumulative distributions of reversal length (D), reversal speed (E), and reversal duration (F). (G,H) For all forward runs ≥2 s in duration during local search, empirical cumulative distributions of run duration (G) and run speed (H). (I) Forward run durations for genotypes in Figures 1—3 follow an exponential distribution. Y-axis set at a log10 scale. (J, K) For all forward runs ≥2 s in duration during local search for genotypes in Figures 1—3, empirical cumulative distributions of run duration (J) and run speed (K). (L) Mean frequency of pauses during local search for genotypes in Figures 1—3. (A–C, L) Each gray dot is the mean for 12–15 animals on a single assay plate (Source data 1), with 5–7 (A–C) or 22–24 (L) plates per genotype. Boxes indicate median and interquartile range for all assays. Asterisks indicate statistical significance compared to WT using a Mann–Whitney (A–C) or Kruskal–Wallis test with Dunn’s multiple comparisons test (L) (*p-value<0.05, ***p-value<0.0001, ns = p-value≥0.05). (D–H, J, K) Asterisks indicate statistical significance compared to WT using a two-sample Kolmogorov–Smirnov test with (J, K) or without (D–H) a Bonferroni correction. (*p-value<0.05, ***p-value<0.0001, ns = p-value≥0.05). Numbers in figures indicate effect size (see Materials and methods). Although statistically significant, the effect sizes indicated in gray in (D, G, J, K) fell below the 0.15 cutoff for discussion established by observing control strains. The tbh-1 mutant (G, H) accounts for the effect of tdc-1 (J, K) on forward speed and forward run duration. n = 384–636 events per genotype from 5 to 7 assays (D–H), n = 1898–3132 events per genotype from 22 to 24 assays (J, K), 12–15 animals per assay (Supplementary file 1, Table 3: Reversals and forward runs, n values).
Figure 3
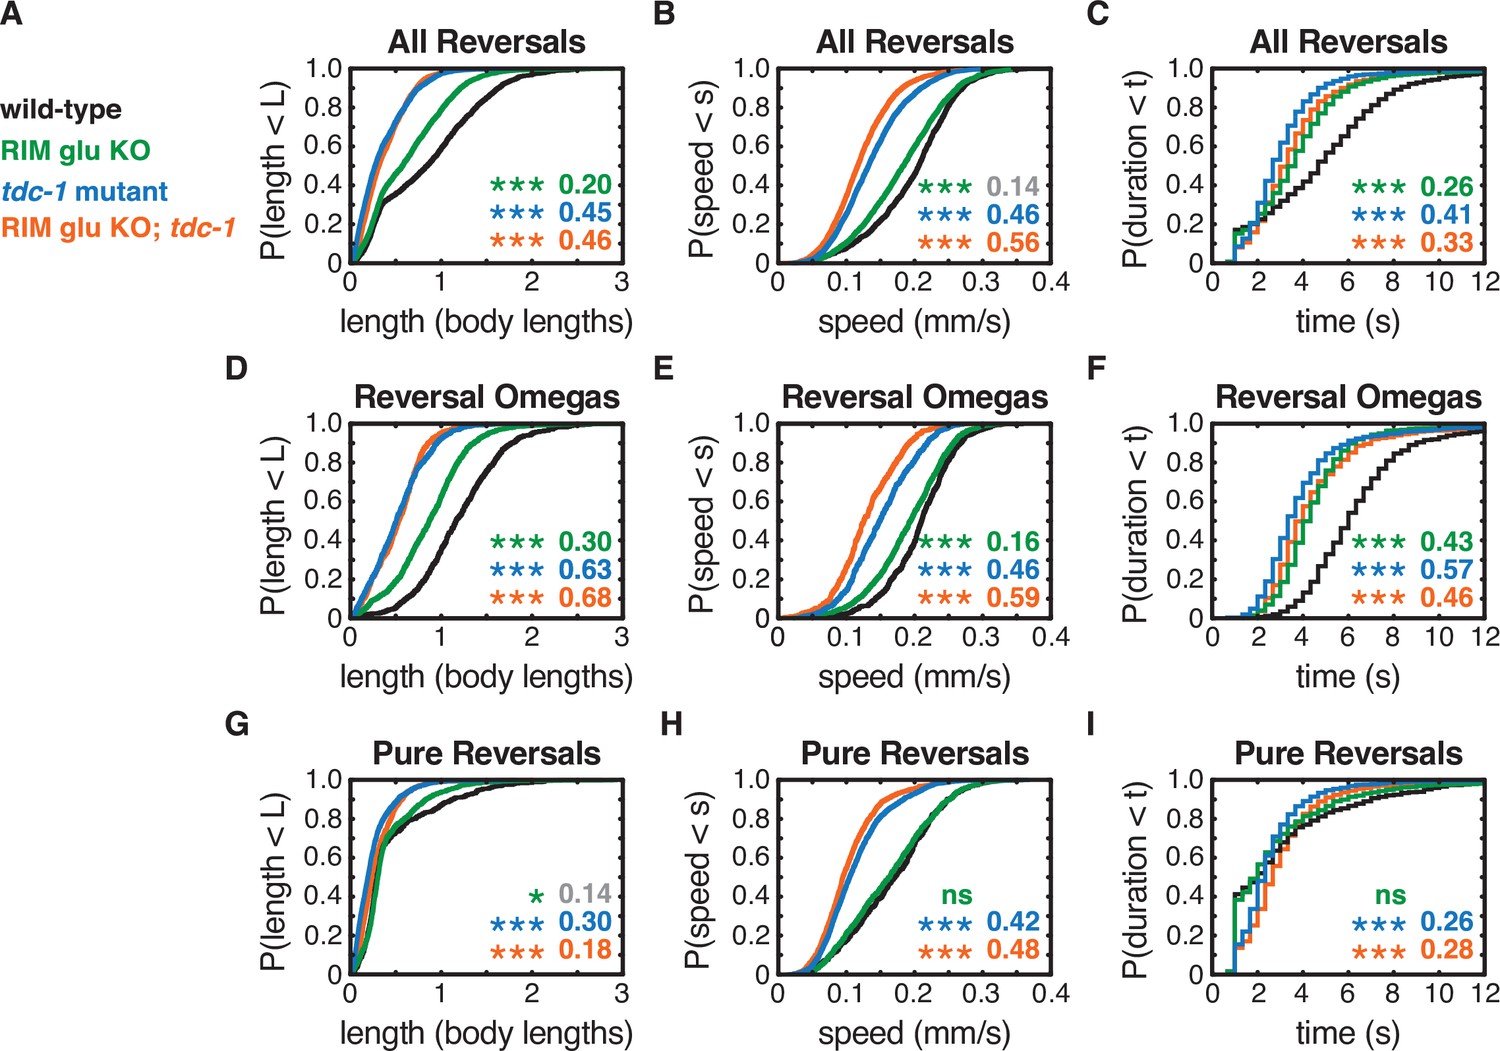
RIM neurotransmitters differently affect pure reversal and reversal-omega behaviors.
(A–C) For all reversals during local search, empirical cumulative distributions of reversal length (A), reversal speed (B), and reversal duration (C). (D–F) For reversal-omega maneuvers during local search, empirical cumulative distributions of reversal length (D), reversal speed (E), and reversal duration (F). (G–I) For pure reversals during local search, empirical cumulative distributions of reversal length (G), reversal speed (H), and reversal duration (I). Asterisks indicate statistical significance compared to WT using a two-sample Kolmogorov–Smirnov test, with a Bonferroni correction (*p-value<0.05, ***p-value<0.0001, ns = p-value≥0.05). Numbers in figures indicate effect size (see Materials and methods). Although statistically significant, the smaller effect sizes indicated in gray are similar to values from control strains (e.g., Figure 2—figure supplement 1) and fall under the 0.15 cutoff for discussion established from those controls. n = 500–3132 events from 22 to 24 assays, 12–15 animals per assay (Supplementary file 1, Table 3: Reversals and forward runs, n values). The strong reversal defects in (RIM) tyramine- and (RIC) octopamine-deficient tdc-1 mutants are not shared by octopamine-deficient tbh-1 mutants, which do affect forward locomotion (Figure 2—figure supplement 2).
Figure 4 with 2 supplements
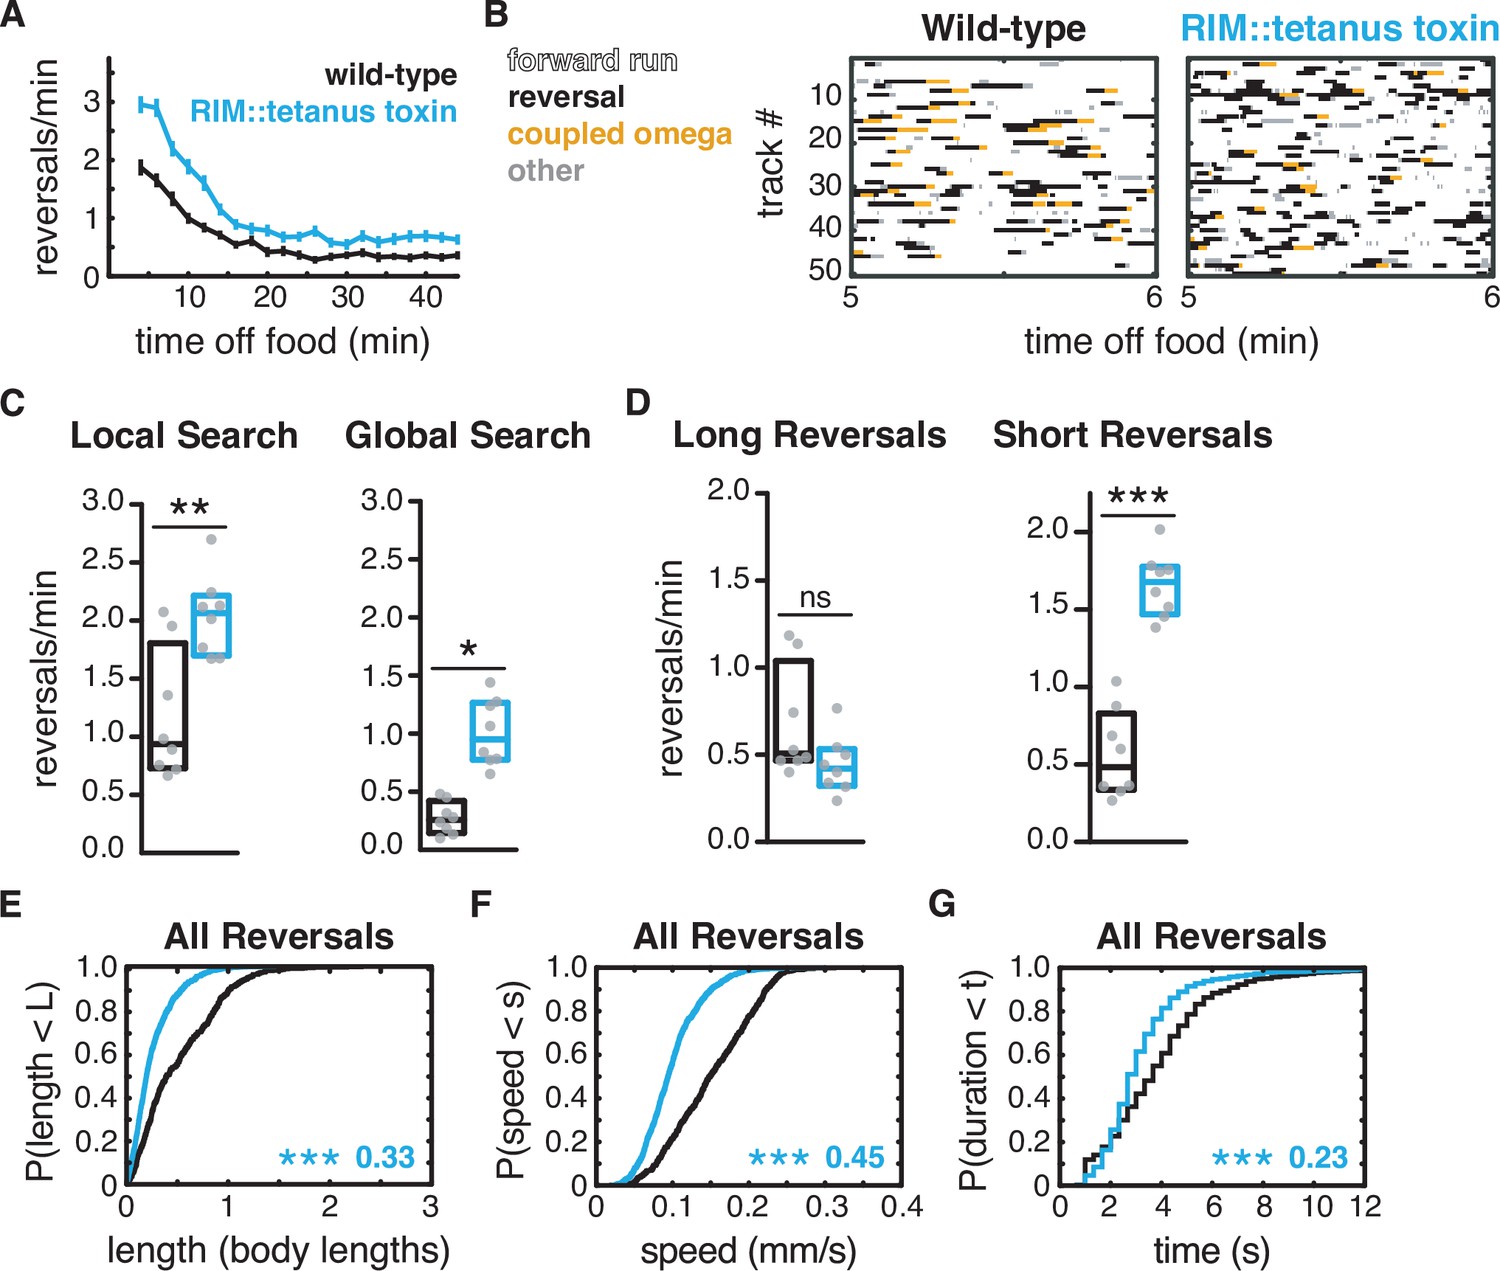
Additional RIM transmitters contribute to global search dynamics.
(A) Mean reversals per minute in animals expressing tetanus toxin light chain under the RIM- and RIC-specific tdc-1 promoter. Reversal defects are milder or absent when tetanus toxin is expressed under the RIC-specific tbh-1 promoter (Figure 4—figure supplement 1). Vertical dashes indicate standard error of the mean. n = 103–111. (B) Ethograms of 50 randomly chosen tracks per genotype during minute 5–6 of local search. Color code: white, forward runs; black, reversals; yellow, omega turns coupled to a reversal; gray, pauses, shallow turns, and omega turns that were not preceded by a reversal. (C) Mean frequency of all reversals during local search (4–8 min off food, left) and global search (36–40 min off food, right). (D) Mean frequency of long reversals (>0.5 body lengths, left) and short reversals (<0.5 body lengths, right) during local search. (E–G) For all reversals during local search, empirical cumulative distributions of reversal length (E), reversal speed (F), and reversal duration (G). (C, D) Each gray dot is the mean for 12–15 animals on a single assay plate (Source data 1), with eight plates per genotype. Boxes indicate median and interquartile range for all assays. Asterisks indicate statistical significance compared to WT using a Mann–Whitney test (*p-value<0.05, **p-value<0.01, ***p-value<0.001, ns = p-value≥0.05). (E–G) Asterisks indicate statistical significance compared to WT using a two-sample Kolmogorov–Smirnov test (***p-value<0.0001). Numbers indicate effect size. n = 595–1066 events from eight assays, 12–15 animals per assay (Supplementary file 1, Table 3: Reversals and forward runs, n values).
Figure 4—figure supplement 1
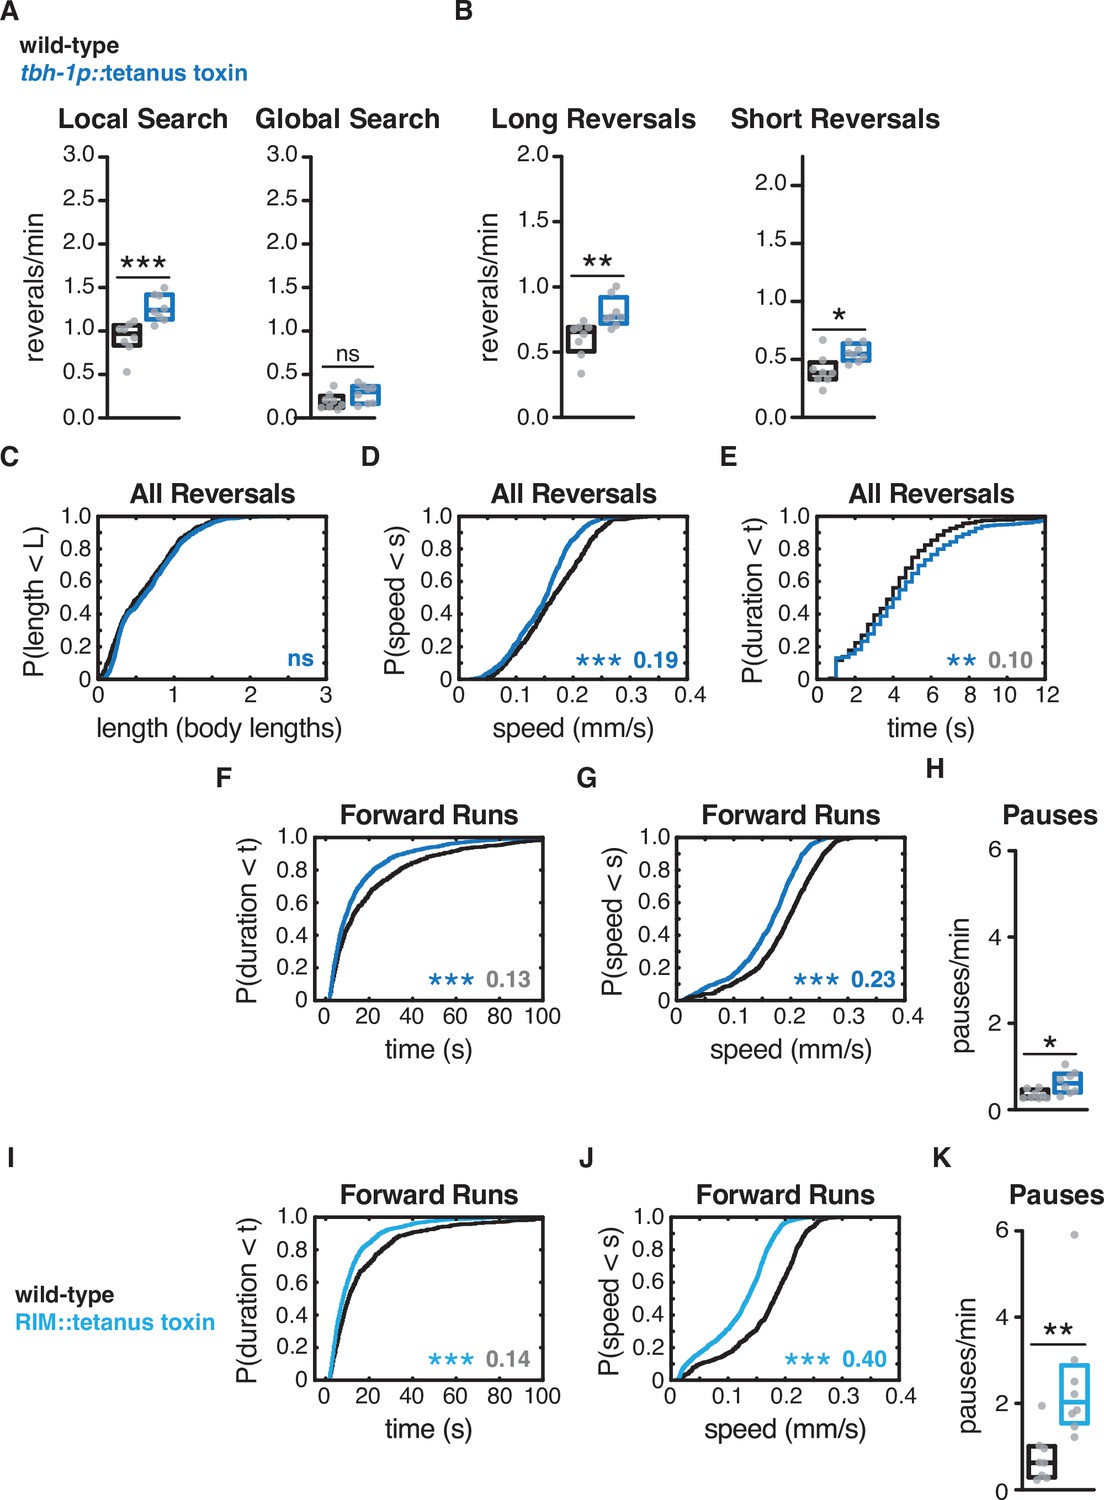
Expression of tetanus toxin in RIC affects forward and reversal speed, with small effects on reversal frequency.
Expressing tetanus toxin in RIC caused a small increase in both long and short reversals during local search and had small effects on reversal parameters. The small effects on reversal parameters suggest that RIC is not the critical site of tetanus toxin action in Figure 4, or the source of tyramine in Figure 3. RIC tetanus toxin had effects similar to tbh-1 mutants on forward and reversal speed (D, F, G). We conclude that RIM tetanus toxin (I–K and Figure 4) has significant effects on reversal frequency, length, speed, and duration, in local and global search. (A) Mean frequency of all reversals during local search (4–8 min off food, left) and global search (36–40 min off food, right). (B) Mean frequency of long reversals (>0.5 body lengths, left) and short reversals (<0.5 body lengths, right) during local search. (C–E) For all reversals during local search, empirical cumulative distributions of reversal length (C), reversal speed (D), and reversal duration (E). n = 504–733 events per genotype from eight assays, 12–15 animals per assay (Supplementary file 1, Table 3: Reversals and forward runs, n values). (F, G, I, J) For all forward runs ≥2 s in duration during local search, empirical cumulative distributions of run duration (F, I) and run speed (G, J) in animals expressing tetanus toxin in RIC (F, G) or RIM + RIC (I, J). (H, K) Mean frequency of pauses during local search in animals expressing tetanus toxin in RIC (H) or RIM + RIC (K). (A–C, H, K) Each gray dot is the mean for 12–15 animals on a single assay plate (Source data 1), with eight plates per genotype. Boxes indicate median and interquartile range for all assays. Asterisks indicate statistical significance compared to WT using a Mann–Whitney test (*p-value<0.05, **p-value<0.01, ***p-value<0.001, ns = p-value≥0.05). (C–G, I, J) Asterisks indicate statistical significance compared to WT using a two-sample Kolmogorov–Smirnov test. (**p-value<0.01, ***p-value<0.0001, ns = p-value≥0.05). Numbers in figures indicate effect size. Although statistically significant, the effect sizes indicated in gray in (E, F, I) fell below the 0.15 cutoff for discussion established using control strains. n = 504–1041 events per genotype from eight assays (C–G), n = 657–1301 events per genotype from eight assays (I, J), 12–15 animals per assay (Supplementary file 1, Table 3: Reversals and forward runs, n values).
Figure 4—figure supplement 2
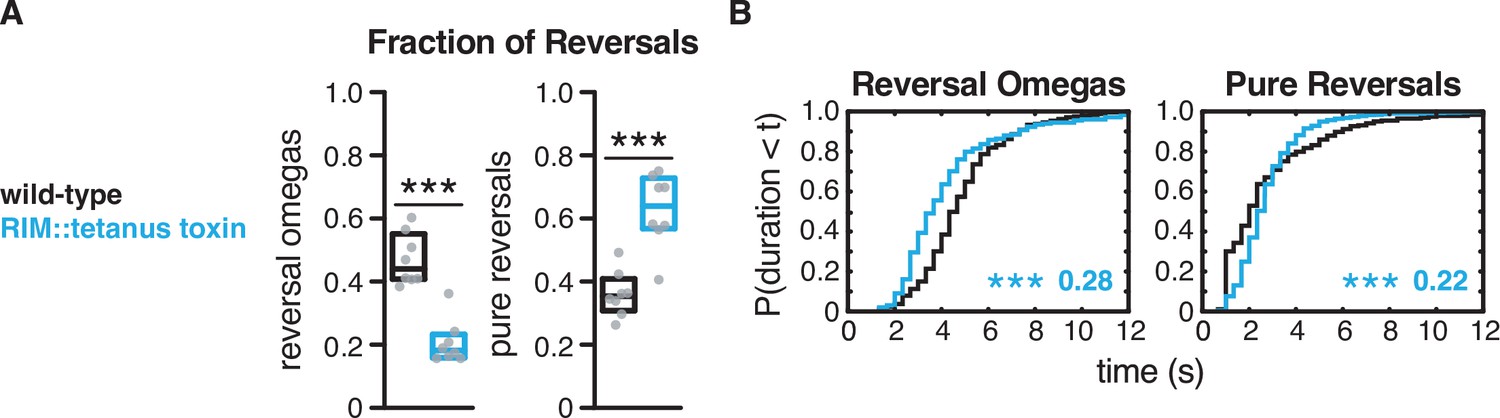
Expression of tetanus toxin in RIM decreases reversal-omega coupling and alters reversal-omega and pure reversal duration.
(A) Fraction of reversals that terminate in an omega turn (left) and fraction of pure reversals (right) for each genotype (see Figure 2F and G). Each gray dot is the mean for 12–15 animals on a single assay plate (Source data 1), with eight plates per genotype. Boxes indicate median and interquartile range for all assays. Asterisks indicate statistical significance compared to WT using a Mann–Whitney test (***p-value<0.001). (B) For reversal-omega maneuvers (left) and pure reversals (right) during local search, empirical cumulative distributions of reversal durations. Asterisks indicate statistical significance compared to WT using a two-sample Kolmogorov–Smirnov test (***p-value<0.0001). Numbers in figures indicate effect size. n = 185–647 events per genotype from eight assays, 12–15 animals per assay (Supplementary file 1, Table 3: Reversals and forward runs, n values).
Figure 5 with 3 supplements

Artificial hyperpolarization of RIM extends forward runs and suppresses reversals.
(A–E) Acute hyperpolarization of RIM::HisCl with histamine. (F–H) Chronic hyperpolarization of RIM::HisCl with histamine (48 hr). (A) Mean reversals per minute in animals expressing HisCl in RIM, with (+his) or without (–his) acute histamine treatment. Vertical dashes indicate standard error of the mean. n = 93–109. (B) Ethograms of 50 randomly chosen tracks per genotype during minute 5–6 of local search. Color code: white, forward runs; black, reversals; yellow, omega turns coupled to a reversal; gray, pauses, shallow turns, and omega turns that were not preceded by a reversal. (C, F) Mean frequency of all reversals during local search, with or without histamine, in RIM::HisCl animals. Each gray dot is the mean for 12–15 animals on a single assay plate (Source data 1), with 14–16 plates per genotype. Boxes indicate median and interquartile range for all assays. Asterisks indicate statistical significance compared to untreated controls using a Mann–Whitney test (***p-value<0.001). (D, G) Durations of forward runs during local search with and without histamine, in RIM::HisCl animals; empirical cumulative distributions include all runs ≥ 2 s. (E, H) For all reversals during local search, empirical cumulative distributions of reversal length, reversal speed, and reversal duration, with (solid lines) and without (dashed lines) histamine, in RIM::HIsCl animals. (D, E, G, H) Asterisks indicate statistical significance compared to untreated controls using a two-sample Kolmogorov–Smirnov test (**p-value<0.01, ***p-value<0.0001). Numbers indicate effect size. Although statistically significant, the smaller effect size indicated in gray is similar to values from control strains (e.g., Figure 2—figure supplement 1). n = 394–1071 events per genotype from 14 to 17 assays (D, E), n = 156–487 events per genotype from eight assays (G, H), 12–15 animals per assay (Supplementary file 1, Table 3: Reversals and forward runs, n values).
Figure 5—figure supplement 1
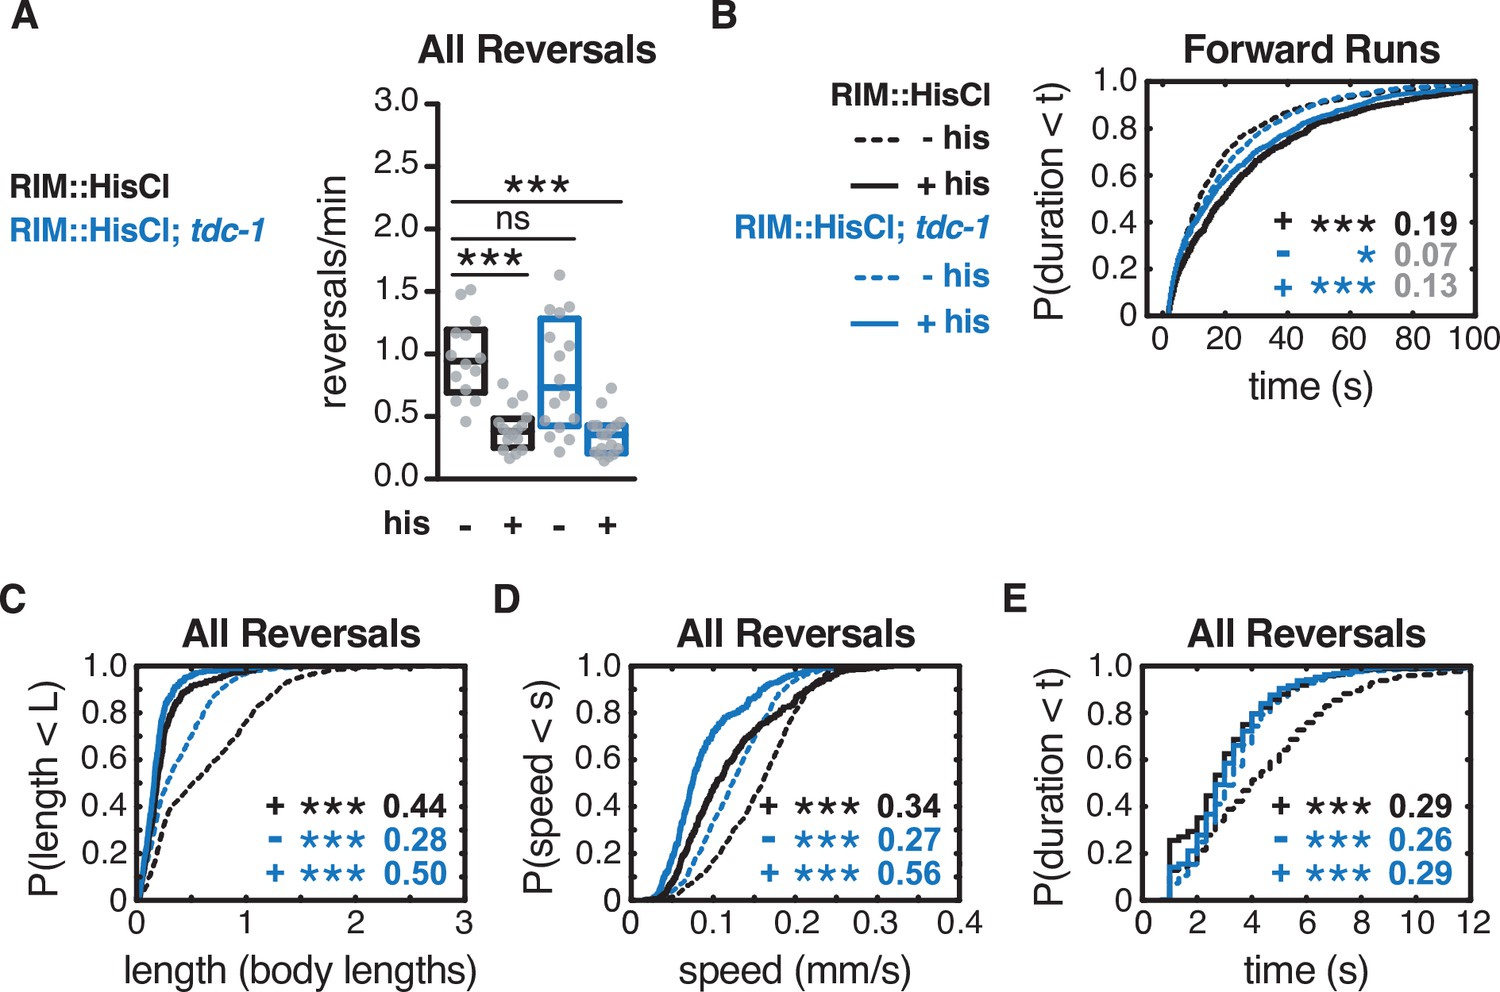
Artificial hyperpolarization of RIM in tdc-1 mutants.
(A) Mean frequency of all reversals during local search, with or without histamine, in wild-type or tdc-1 animals expressing HisCl in RIM. Each gray dot is the mean for 12–15 animals on a single assay plate (Source data 1), with 14–17 plates per genotype. Boxes indicate median and interquartile range for all assays. Reversal frequencies in tdc-1 are lower than in other experiments for unknown reasons. Asterisks indicate statistical significance compared to WT untreated controls using a Kruskal–Wallis test with Dunn’s multiple comparisons test (***p-value<0.0001, ns = p-value≥0.05). (B) Durations of forward runs during local search with (solid lines) and without (dashed lines) histamine, in wild-type or tdc-1 animals expressing HisCl in RIM; empirical cumulative distributions include all runs ≥ 2 s. (C–E) For all reversals during local search, empirical cumulative distributions of reversal length (C), reversal speed (D), and reversal duration (E) with or without histamine, in wild-type or tdc-1 animals expressing HisCl in RIM. (B–E) Asterisks indicate statistical significance compared to WT untreated controls using a two-sample Kolmogorov–Smirnov test with a Bonferroni correction (***p-value<0.0001, ns = p-value≥0.05). Numbers indicate effect size. n = 358–1250 events per genotype from 14 to 17 assays, 12–15 animals per assay (Supplementary file 1, Table 3: Reversals and forward runs, n values).
Figure 5—figure supplement 2
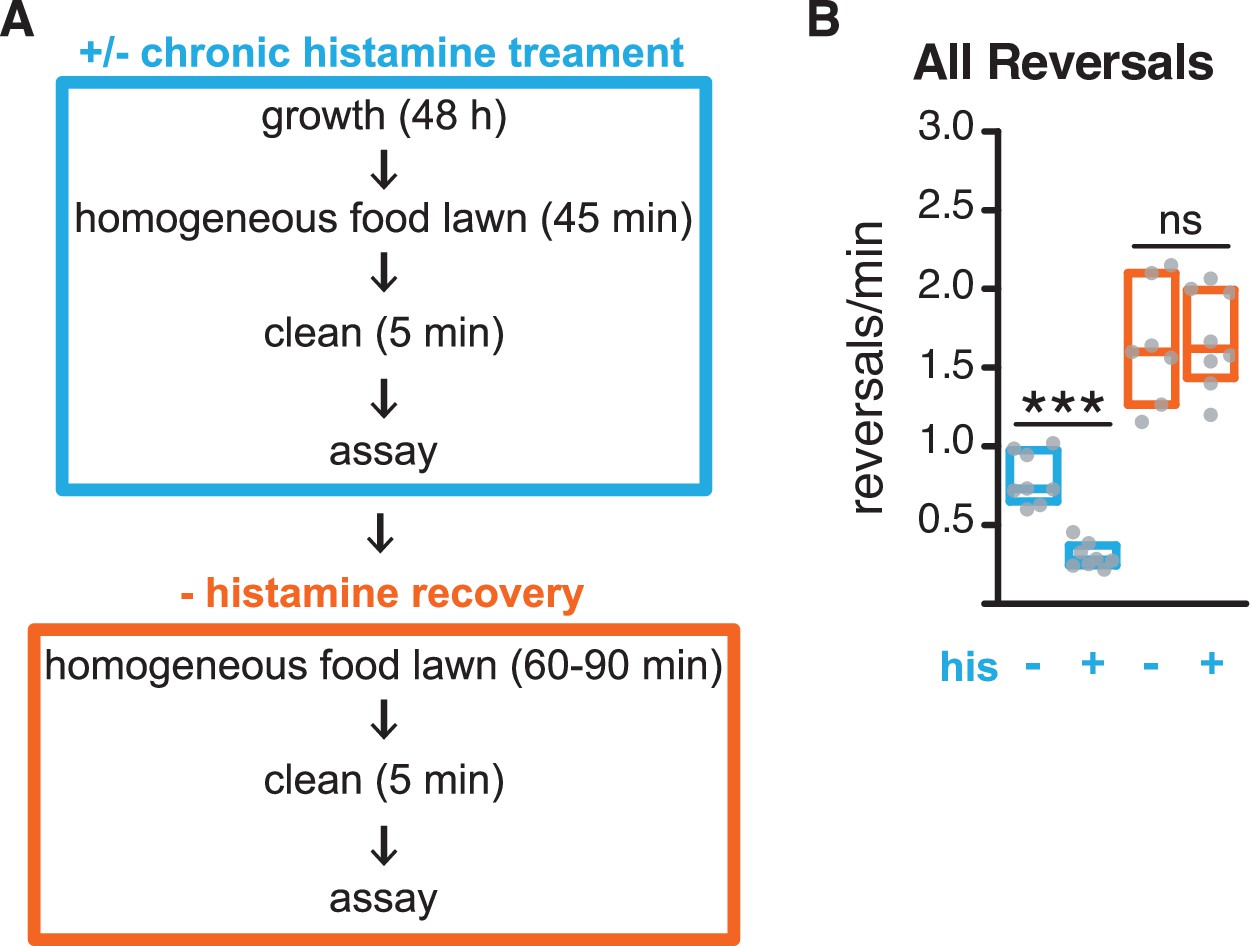
Behavioral recovery in RIM::HisCl animals after histamine removal.
(A) Schematic representing experimental design for chronic histamine treatment: Animals were grown for ~48 hr on histamine-treated plates seeded with E. coli OP50. Histamine treatment persisted throughout the first assay (blue). Animals were then recovered from assay plates and transferred to homogeneous E. coli OP50 lawns on plates free of histamine for 60–90 min, then tested a second time in the absence of histamine (orange). See Materials and methods. (B) Mean frequency of all reversals during local search. Blue: first assay with (+) or without (–) chronic histamine. Orange: second assay after recovery from chronic histamine treatment. All animals express HisCl in RIM. Each gray dot is the mean for 12–15 animals on a single assay plate (Source data 1), with 7–8 plates per genotype. Boxes indicate median and interquartile range for all assays. Asterisks indicate statistical significance compared to untreated controls using a Mann–Whitney test (***p-value<0.001, ns = p-value≥0.05).
Figure 5—figure supplement 3
RIM hyperpolarization decreases AVA activity in paralyzed animals during a local search-like state.
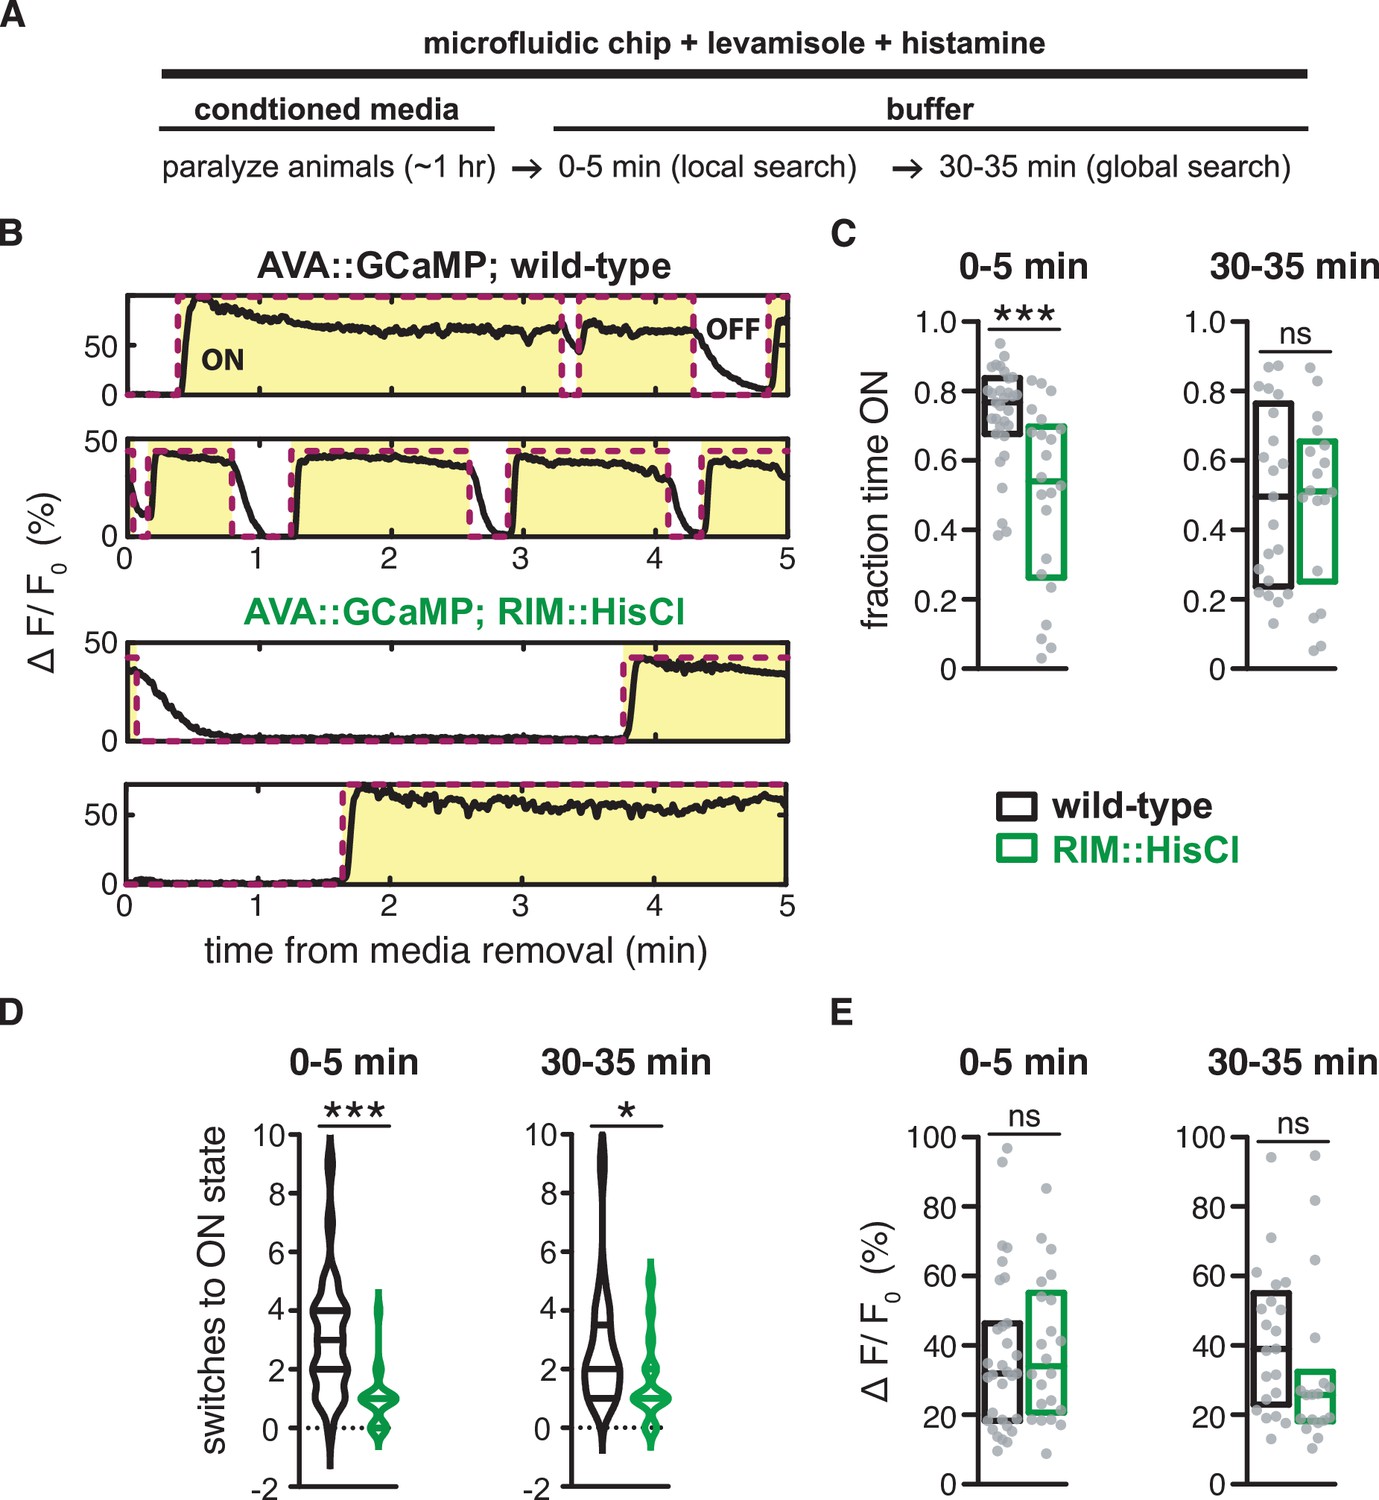
(A) Schematic representing design of imaging experiment: Animals were loaded into a microfluidic device for imaging. Levamisole was present throughout experiment to prevent movement, and histamine was present throughout experiment to hyperpolarize RIM in RIM::HisCl animals. Wild-type controls were imaged in parallel in the same device. Animals were exposed to E. coli OP50-conditioned media for 1 hr, then switched to buffer to create a local search-like state. Spontaneous AVA activity was imaged at 0–5 min after media removal and 30–35 min after media removal. See Materials and methods. (B) Example traces of spontaneous AVA GCaMP activity that were analyzed in panels (C–E). Black lines are AVA GCaMP traces binned by 10 frames (1 s). Red lines represent ON and OFF states of AVA activity determined using the time derivative (Materials and methods). ON states are highlighted in yellow and OFF states are shown in white. Top two panels: wild-type. Bottom two panels: RIM::HisCl. (C–E) AVA activity in wild-type animals (black) or RIM::HisCl animals (green) in the presence of histamine. (C) The fraction of time AVA spent in the ON state determined by dividing all ON state frames by the total number of frames in each 5 min trace. (D) The number of transitions from the OFF state to the ON state during each 5 minute trace. (E) Mean change in fluorescence intensity when AVA was ON. Each gray dot represents AVA activity from a single animal (C, E), and boxes (C, E) or horizontal lines (D) indicate median and interquartile range for all assays. Asterisks indicate statistical significance compared to WT using a Mann–Whitney test (***p-value<0.001, *p-value<0.05, ns = p-value≥0.05). n = 18–31 traces per genotype (Source data 1).
Figure 6 with 3 supplements
RIM gap junctions suppress spontaneous reversals.
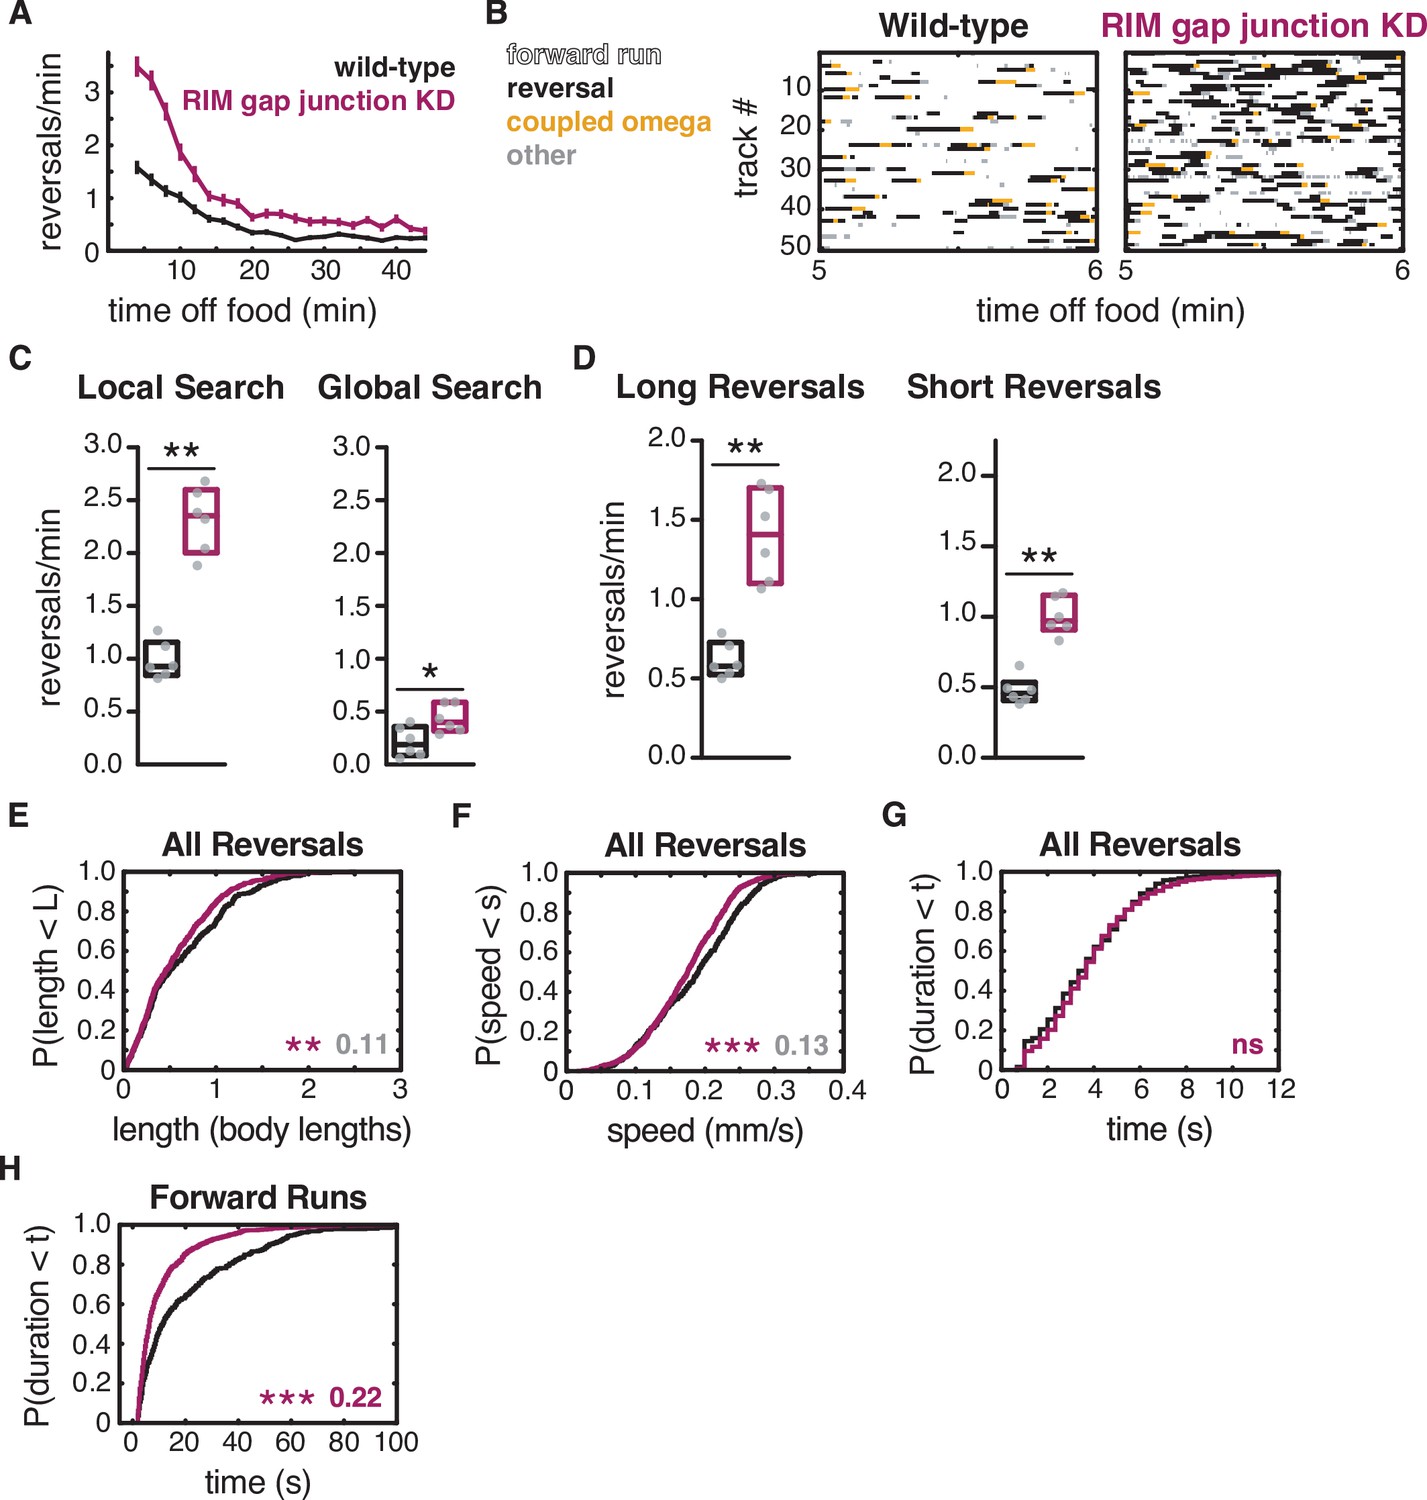
(A) Mean reversals per minute in animals bearing an unc-1(n494) dominant negative transgene to knock down unc-9-containing gap junctions (RIM gap junction KD). Vertical dashes indicate standard error of the mean. n = 77–85. (B) Ethograms of 50 randomly chosen tracks per genotype during minute 5–6 of local search. Color code: white, forward runs; black, reversals; yellow, omega turns coupled to a reversal; gray, pauses, shallow turns, and omega turns that were not preceded by a reversal. (C) Mean frequency of all reversals during local search (4–8 min off food, left) and global search (36–40 min off food, right). (D) Mean frequency of long reversals (>0.5 body lengths, left) and short reversals (<0.5 body lengths, right) during local search. (E–G) For all reversals during local search, empirical cumulative distributions of reversal length (E), reversal speed (F), and reversal duration (G). (H) Durations of forward runs during local search; empirical cumulative distributions include all runs ≥ 2 s. (C, D) Each gray dot is the mean for 12–15 animals on a single assay plate (Source data 1), with six assays per genotype. Boxes indicate median and interquartile range for all assays. Asterisks indicate statistical significance compared to WT using a Mann–Whitney test (*p-value<0.05, **p-value<0.01). (E–H) Asterisks indicate statistical significance compared to WT using a two-sample Kolmogorov–Smirnov test (**p-value<0.01, ***p-value<0.001, ns = p-value≥0.05). Numbers indicate effect size. Although statistically significant, the smaller effect sizes indicated in gray fall below the 0.15 cutoff for discussion established by observing control strains (e.g., Figure 2—figure supplement 1). n = 330–933 events per genotype from six assays, 12–15 animals per assay (Supplementary file 1, Table 3: Reversals and forward runs, n values). Note that the tdc-1 promoter also expresses unc-1(n494) in RIC. Reversal frequencies are not altered in an RIC-selective unc-1(n494) strain, but forward and reversal speed and forward run duration are decreased (Figure 6—figure supplement 3).
Figure 6—figure supplement 1
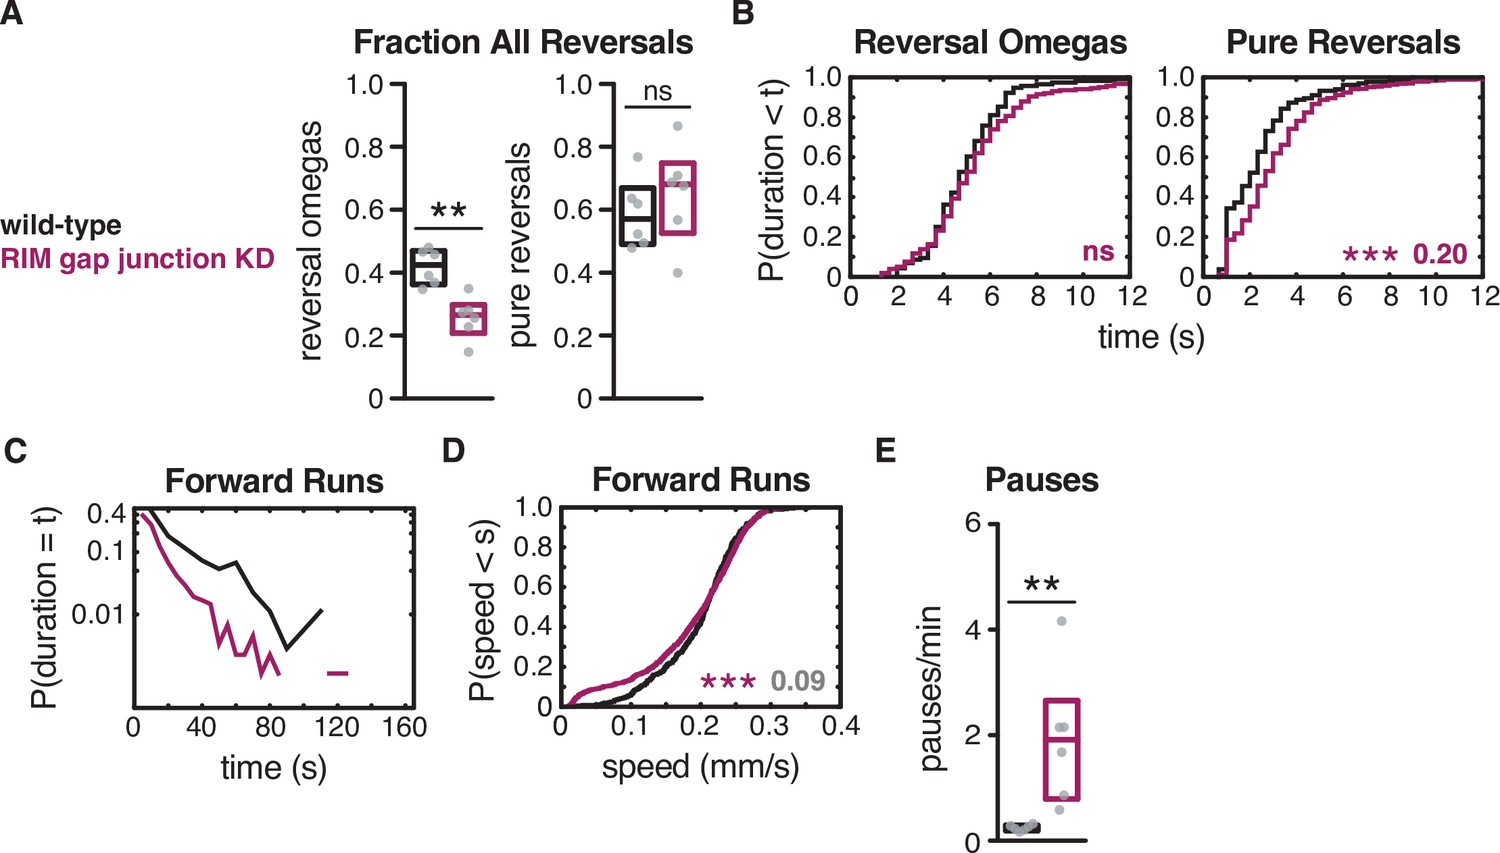
RIM gap junctions affect reversal-omega frequency.
RIM gap junction knockdown decreased the fraction of reversal-omegas without altering reversal-omega durations, and shortened forward runs (see also Figure 6—figure supplement 3 for RIC gap junction knockdown). (A) Fraction of reversals that terminate in an omega turn (left) and fraction of pure reversals (right) for each genotype (see Figure 2F and G). (B) For reversal-omega maneuvers (left) and pure reversals (right) during local search, empirical cumulative distributions of reversal durations. (C) Exponential plot of forward run durations. Y-axis set at a log10 scale. (D) For all forward runs ≥2 s in duration during local search, empirical cumulative distributions of run speed. (E) Mean frequency of pauses during local search. (A, E) Each gray dot is the mean for 12–15 animals on a single assay plate (Source data 1), with six plates per genotype. Boxes indicate median and interquartile range for all assays. Asterisks indicate statistical significance compared to WT using a Mann–Whitney test (**p-value<0.01, ns = p-value≥0.05). (B, D) Asterisks indicate statistical significance compared to WT using a two-sample Kolmogorov–Smirnov (***p-value<0.001, ns = p-value≥0.05). Numbers in figures indicate effect size. Effect sizes indicated in gray fall below the 0.15 cutoff for discussion established using control strains. n = 116–889 events per genotype from six assays, 12–15 animals per assay (Supplementary file 1, Table 3: Reversals and forward runs, n values).
Figure 6—figure supplement 2
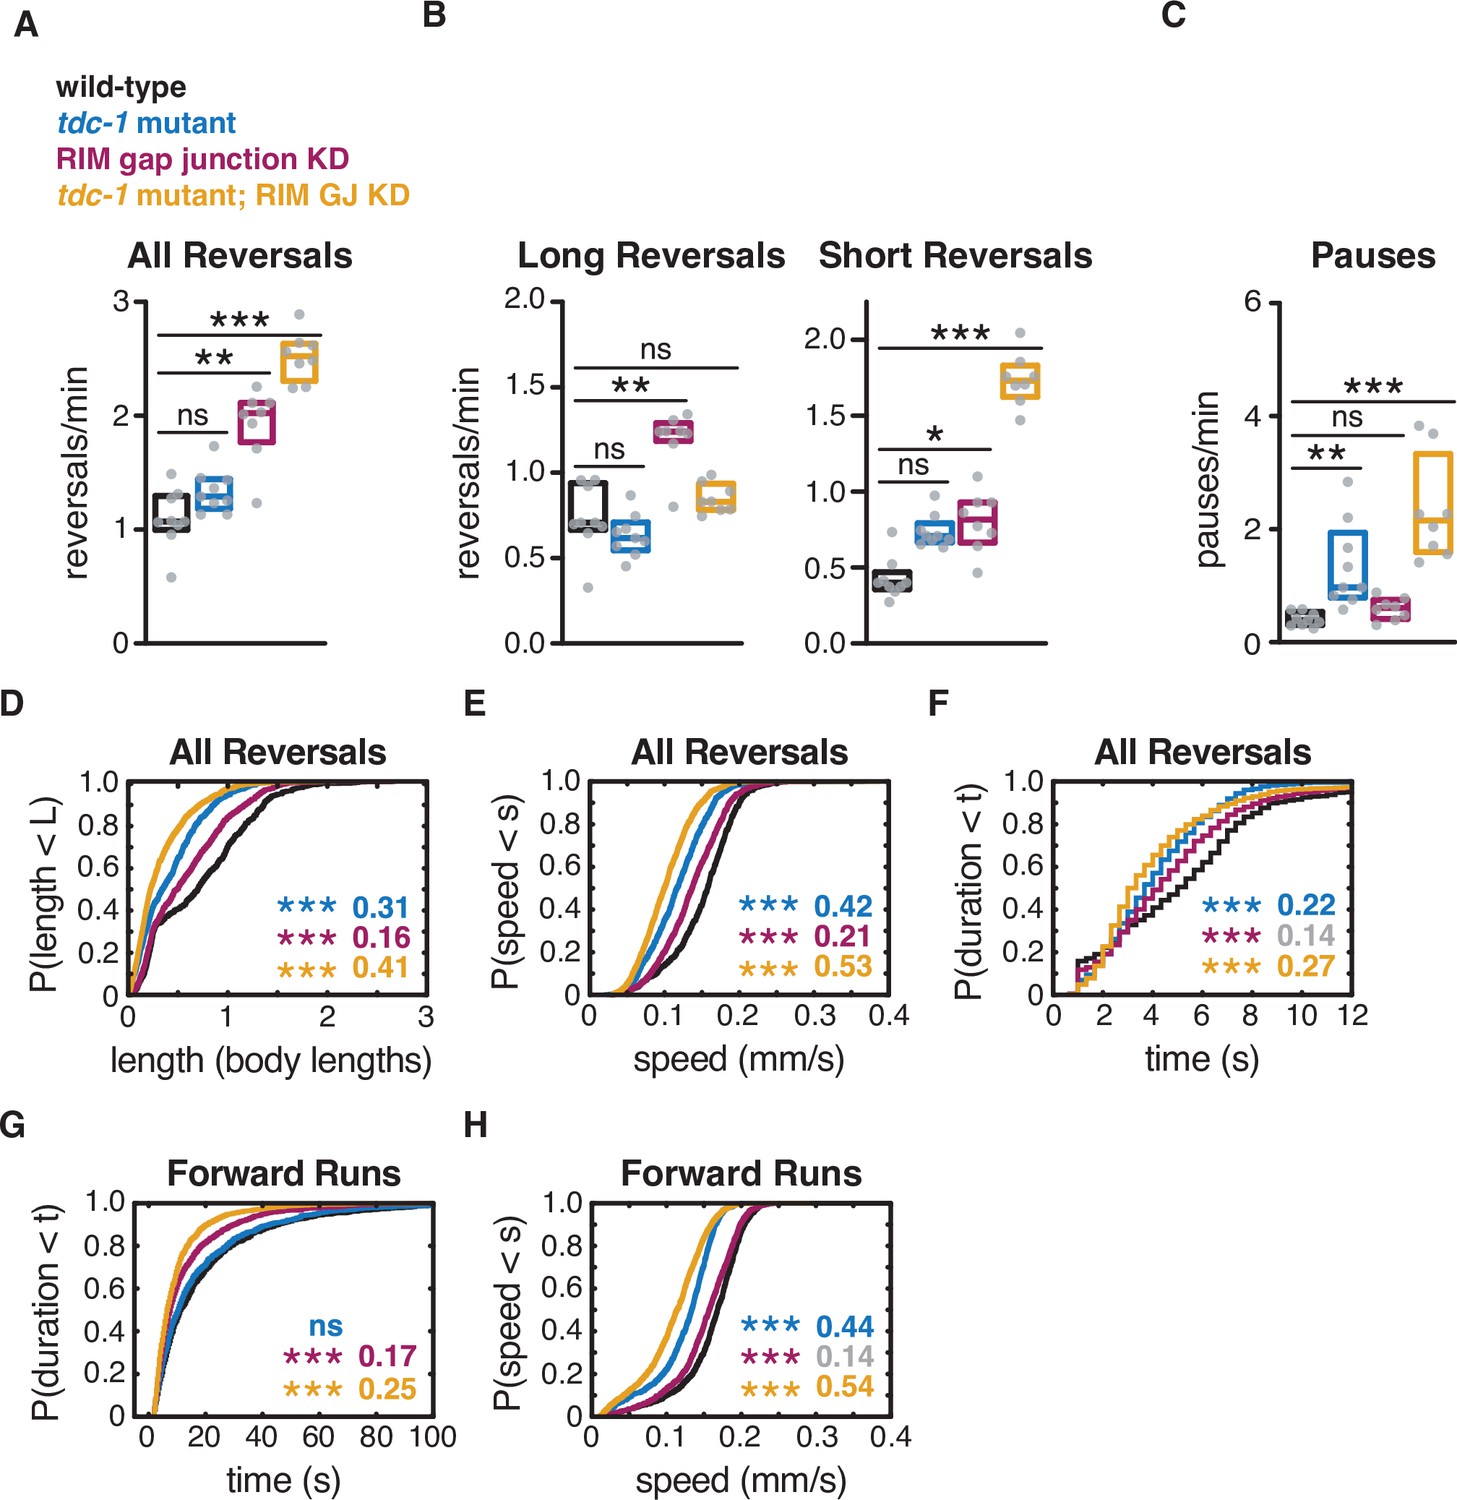
RIM gap junctions and RIM tyramine act additively in spontaneous local search behavior.
(A) Mean frequency of all reversals during local search (4–8 min off food). (B) Mean frequency of long reversals (>0.5 body lengths, left) and short reversals (<0.5 body lengths, right) during local search. (C) Mean frequency of pauses during local search. (D–F) For all reversals during local search, empirical cumulative distributions of reversal length (D), reversal speed (E), and reversal duration (F). (G, H) For all forward runs ≥2 s in duration during local search, empirical cumulative distributions of run duration (G) and run speed (H). (A–C) Each gray dot is the mean for 12–15 animals on a single assay plate (Source data 1), with 8–9 plates per genotype. Boxes indicate median and interquartile range for all assays. Asterisks indicate statistical significance compared to WT using a Kruskal–Wallis test with Dunn’s multiple comparisons test (*p-value<0.05, **p-value<0.01, ***p-value<0.001, ns = p-value≥0.05). (D–H) Asterisks indicate statistical significance compared to WT using a two-sample Kolmogorov–Smirnov test with a Bonferroni correction (***p-value<0.0001, ns = p-value≥0.05). Numbers in figures indicate effect size. Effect sizes indicated in gray fall below the 0.15 cutoff for interpretation established using control strains. n = 691–1541 events per genotype from 8 to 9 assays, 12–15 animals per assay (Supplementary file 1, Table 3: Reversals and forward runs, n values).
Figure 6—figure supplement 3
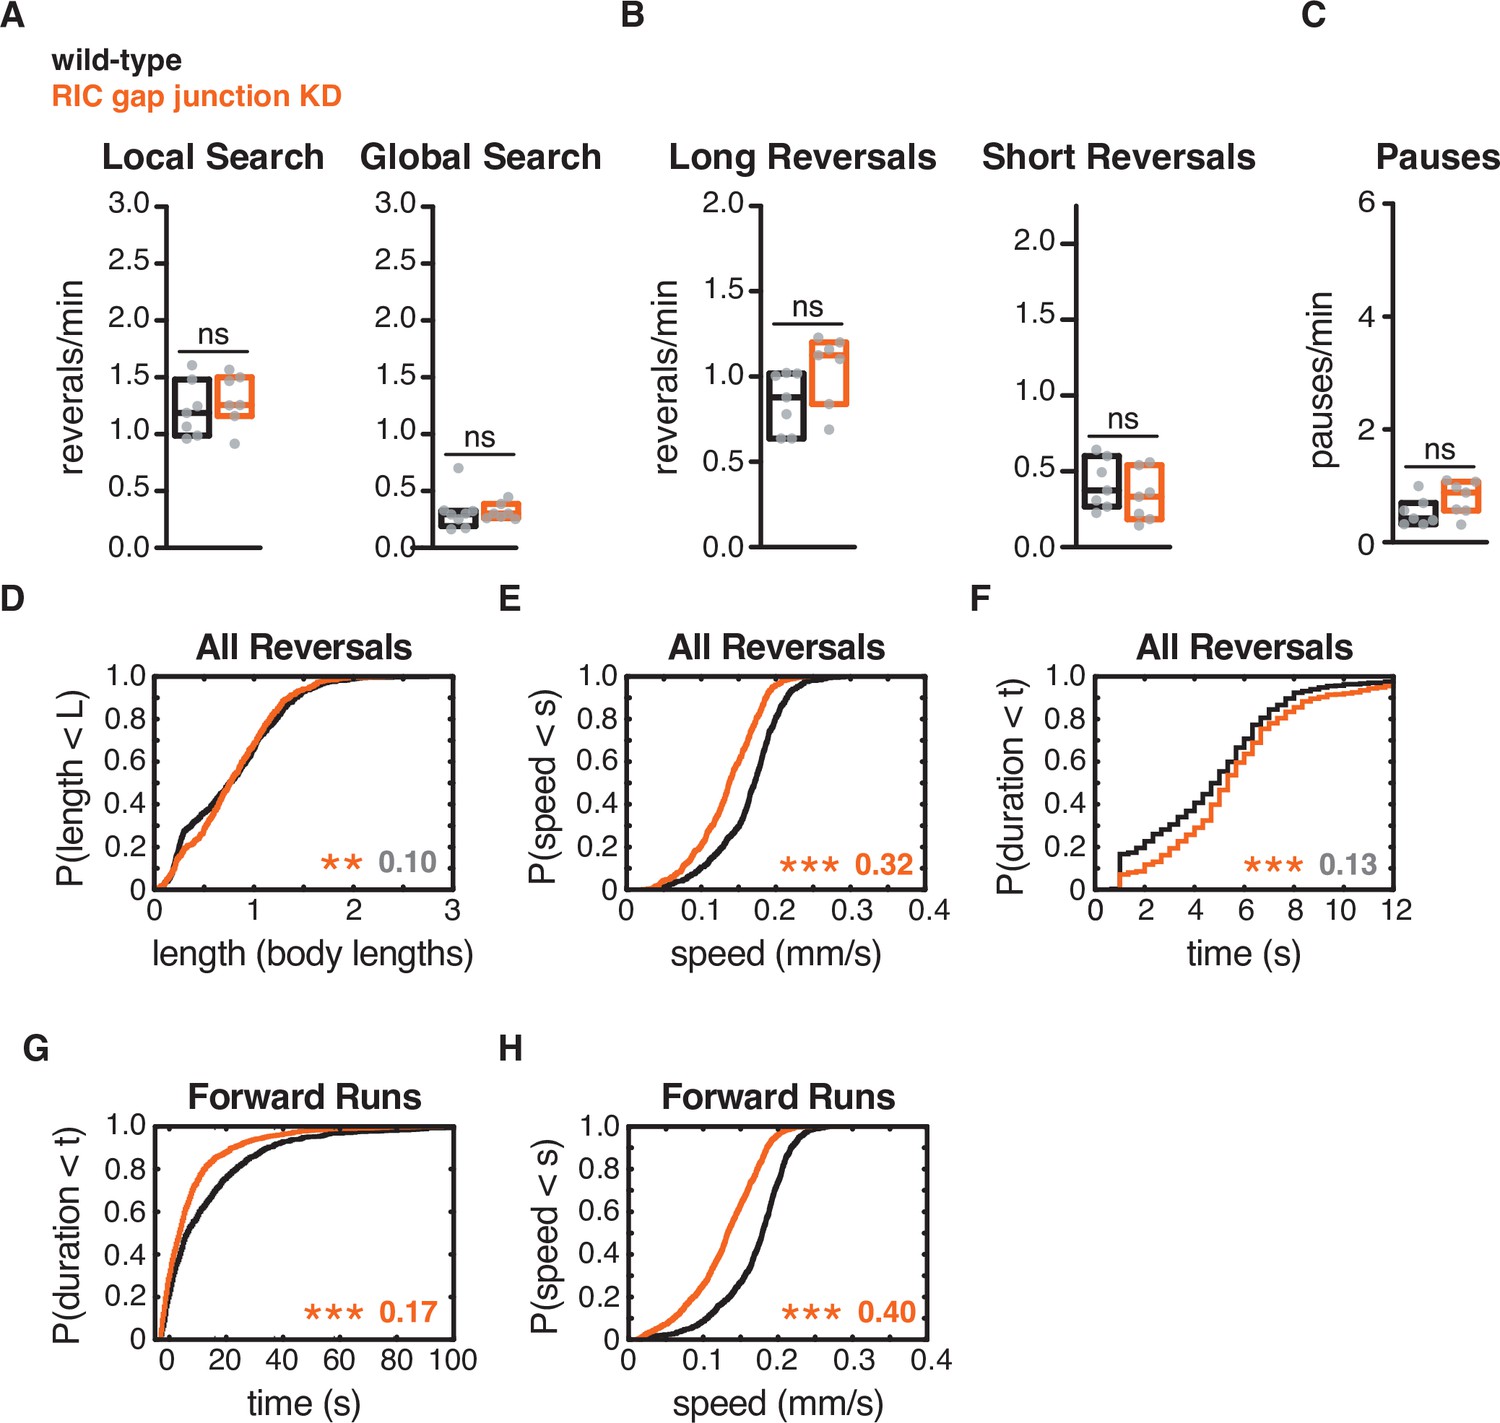
RIC gap junctions affect forward and reversal speed, but not reversal frequency.
Knocking down unc-9 gap junctions in RIC with unc-1(n494) caused decreased speed and shortened forward runs, but did not affect reversal frequency. RIC gap junction knockdown had effects similar to tbh-1 mutants and tbh-1p::tetanus toxin. (A) Mean frequency of all reversals during local search (4–8 min off food). (B) Mean frequency of long reversals (>0.5 body lengths, left) and short reversals (<0.5 body lengths, right) during local search. (C) Mean frequency of pauses during local search. (D–F) For all reversals during local search, empirical cumulative distributions of reversal length (D), reversal speed (E), and reversal duration (F). (G, H) For all forward runs ≥2 s in duration during local search, empirical cumulative distributions of run duration (G) and run speed (H). (A–C) Each gray dot is the mean for 12–15 animals on a singleassay plate (Source data 1), with 7–8 plates per genotype. Boxes indicate median and interquartile range for all assays. Asterisks indicate statistical significance compared to WT using a Mann–Whitney test (ns = p-value≥0.05). (D–H) Asterisks indicate statistical significance compared to WT using a two-sample Kolmogorov test (***p-value<0.0001, ns = p-value≥0.05). Numbers in figures indicate effect size. Effect size indicated in gray falls below the 0.15 cutoff for interpretation established using control strains. n = 537–927 events per genotype from seven assays, 12–15 animals per assay (Supplementary file 1, Table 3: Reversals and forward runs, n values).
Figure 7 with 1 supplement
RIM gap junctions mediate effects of hyperpolarization and depolarization.
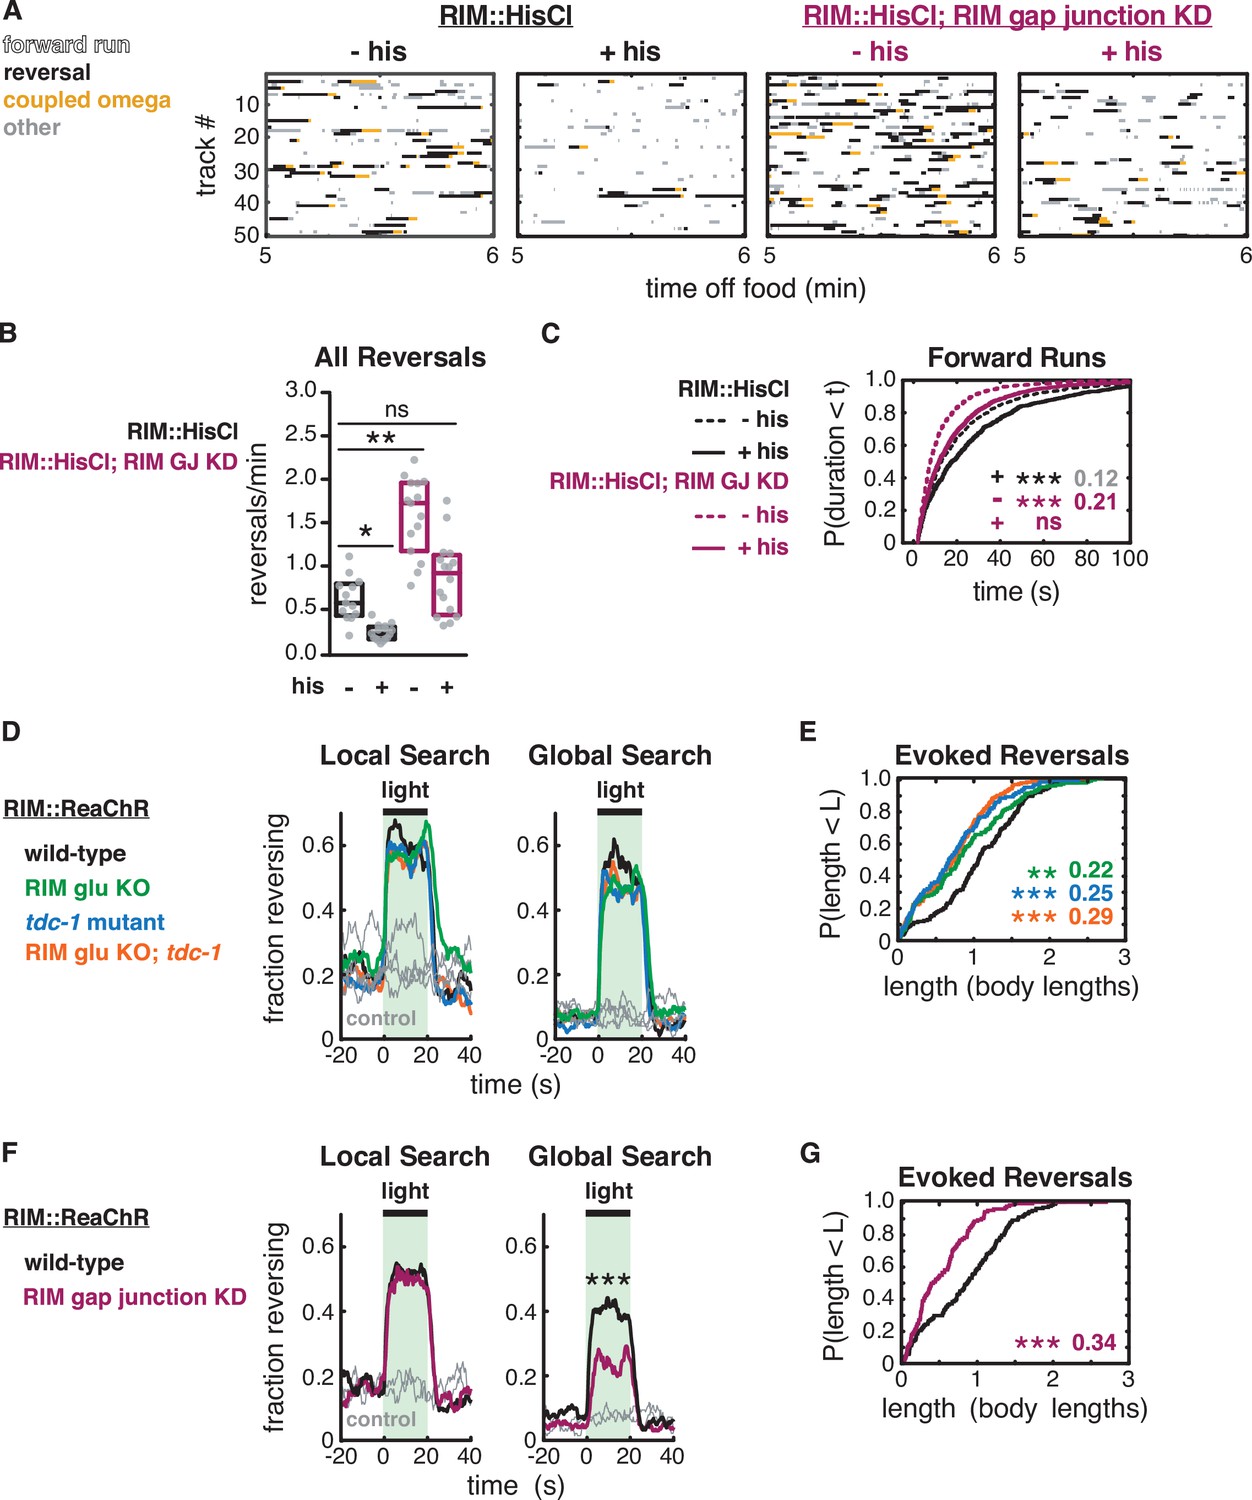
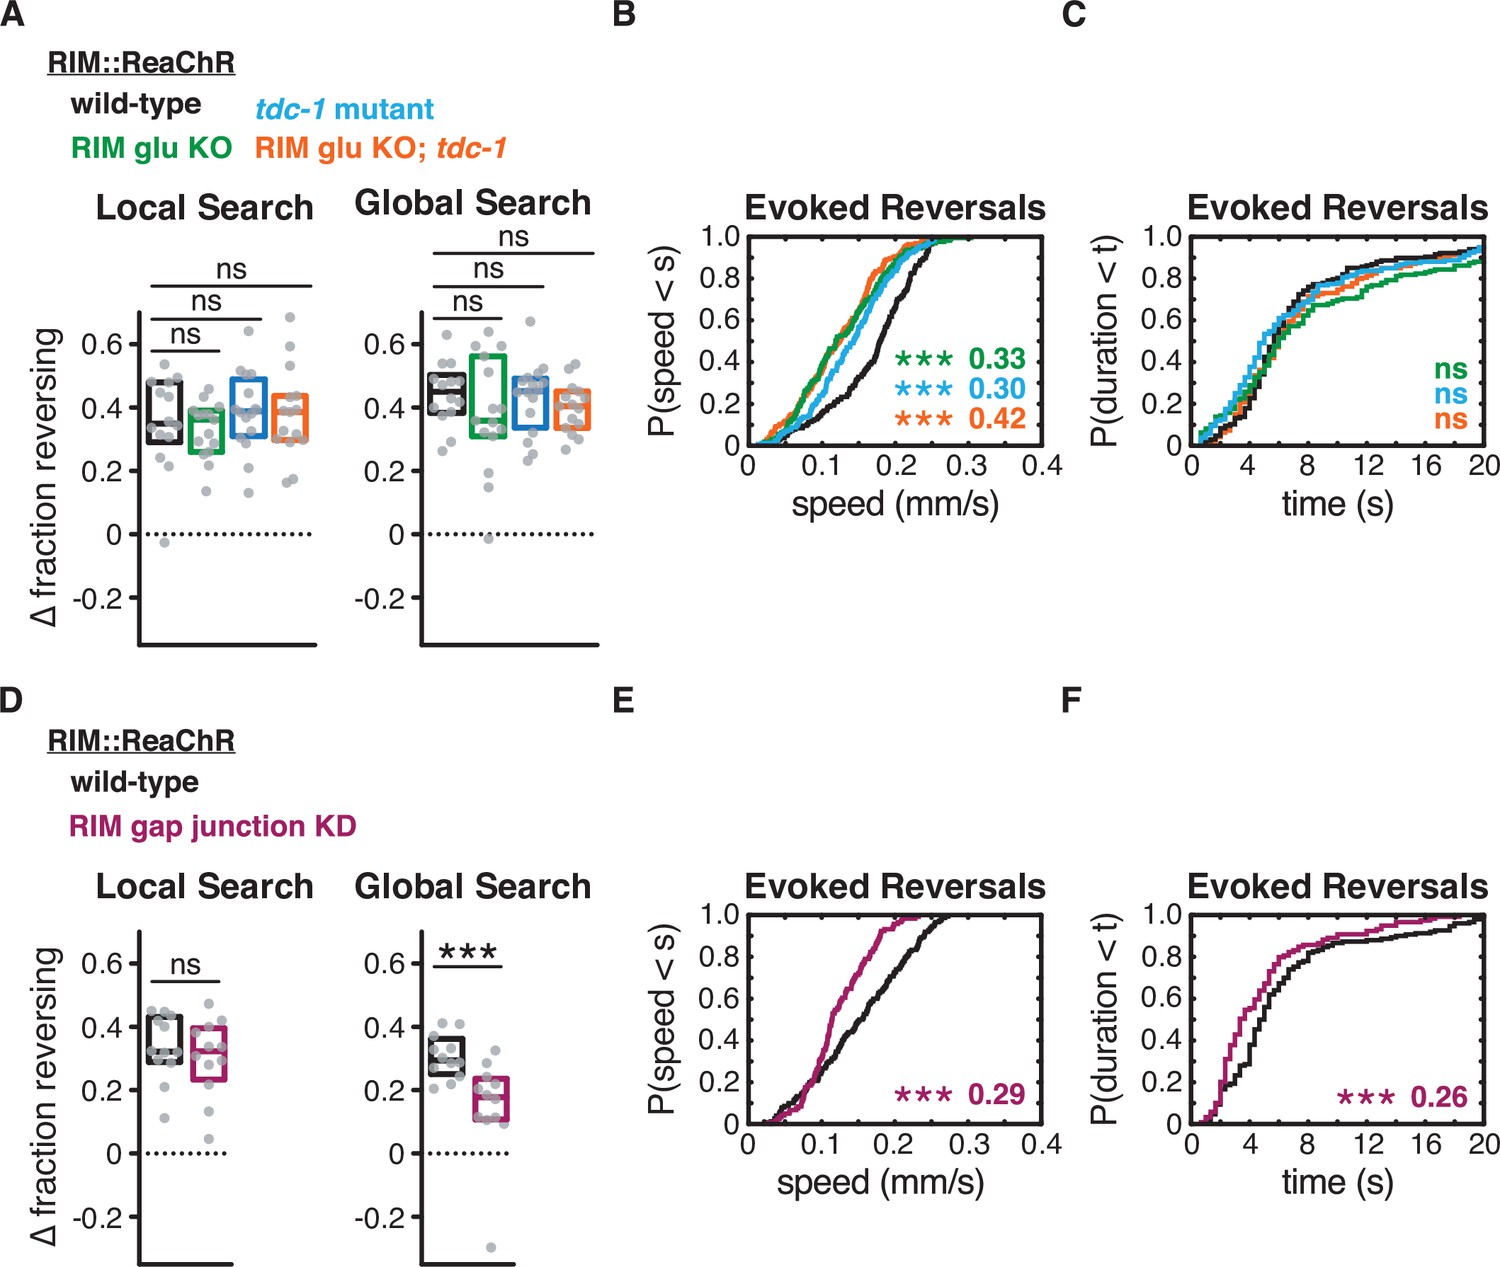
(A–C) Behavior of RIM::HisCl and RIM::HisCl; RIM gap junction knockdown animals. (A) Ethograms of 50 randomly chosen tracks per genotype during minute 5–6 of local search. Color code: white, forward runs; black, reversals; yellow, omega turns coupled to a reversal; gray, pauses, shallow turns, and omega turns that were not preceded by a reversal. (B) Mean frequency of all reversals during local search (4–8 min off food), with or without histamine. Each gray dot is the mean for 12–15 animals on a single assay plate (Source data 1), with 13–16 plates per genotype. Boxes indicate median and interquartile range for all assays. Asterisks indicate statistical significance compared to untreated WT controls using a Kruskal–Wallis test with Dunn’s multiple comparisons test (*p-value<0.05, **p-value<0.01, ns = p-value≥0.05). (C) Durations of forward runs during local search with (solid lines) and without (dashed lines) histamine; empirical cumulative distributions include all runs ≥2 s. n = 768–1994 events from 13 to 16 assays, 12–15 animals per assay (Supplementary file 1, Table 3: Reversals and forward runs, n values). (D–G) Effects of RIM::ReaChR activation in wild-type, RIM glu KO, tdc-1 mutants, RIM glu KO; tdc-1 double mutants, and RIM gap junction knockdown animals. (D, F) Animals were exposed to light for 20 s (green shading), with or without all-trans retinal pretreatment, during local search (8–14 min off food, left) or global search (38–44 min off food, right). Neurotransmitter mutants do not suppress optogenetically evoked reversals (D). RIM gap junction knockdown suppresses optogenetically evoked reversals during global search (F) (***p<0.001, Figure 7—figure supplement 1). Similar results were obtained at lower and higher light levels. (E, G) For all reversals induced during the light pulse during local search (8–14 min off food), empirical cumulative distributions of reversal length. All animals were pretreated with all-trans retinal. n = 119–193 reversals from 12 to 15 assays, 12–15 animals per assay, 2 (E) or 3 (G) light pulses per assay conducted 8–14 min after removal from food (Supplementary file 1, Table 3: Reversals and forward runs, n values). (C, E, G) Asterisks indicate statistical significance compared to controls of the same genotype using a two-sample Kolmogorov–Smirnov test with a Bonferroni correction (**p-value<0.01, ***p-value<0.001, ns = p-value≥0.05). Numbers indicate effect size.
Figure 7—figure supplement 1
RIM gap junctions support optogenetically evoked reversals.
For optogenetically induced reversals, RIM gap junction knockdown decreased reversal frequency during global search, but not local search; RIM chemical synapses did not affect reversal frequency. RIM gap junction knockdown also decreased optogenetically evoked reversal duration, and both RIM gap junction knockdown and chemical synapse mutants decreased reversal speed. (A–F) Effects of RIM::ReaChR activation in wild-type, RIM glu KO, tdc-1 mutants, RIM glu KO; tdc-1 double mutants, and RIM gap junction knockdown animals. All animals pretreated with all-trans retinal. (A, D) Average increase in the fraction of animals reversing during the light pulse during local search (8–14 min off food, left) or global search (38–44 min off food, right). Each gray dot is the mean for 12–15 animals on a single assay plate (Source data 1), with 12–16 plates per genotype. Boxes indicate median and interquartile range for all assays. Asterisks indicate statistical significance compared to WT using a Kruskal–Wallis test with Dunn’s multiple comparisons test (A) or Mann–Whitney test (D) (***p-value<0.001, ns = p-value≥0.05). (B, C, E, F) For all reversals induced during the light pulse during local search (8–14 min off food), empirical cumulative distributions of reversal speed (B, E) and reversal duration (C, F). All animals were pretreated with all-trans retinal. Asterisks indicate statistical significance compared to controls of the same genotype using a two-sample Kolmogorov–Smirnov test with a Bonferroni correction (***p-value<0.001, ns = p-value≥0.05). Numbers indicate effect size. n = 119–193 reversals from 12 to 15 assays, 12–15 animals per assay, 2 (B, C) or 3 (E, F) light pulses per assay conducted 8–14 min after removal from food (Supplementary file 1, Table 3: Reversals and forward runs, n values).
Figure 8
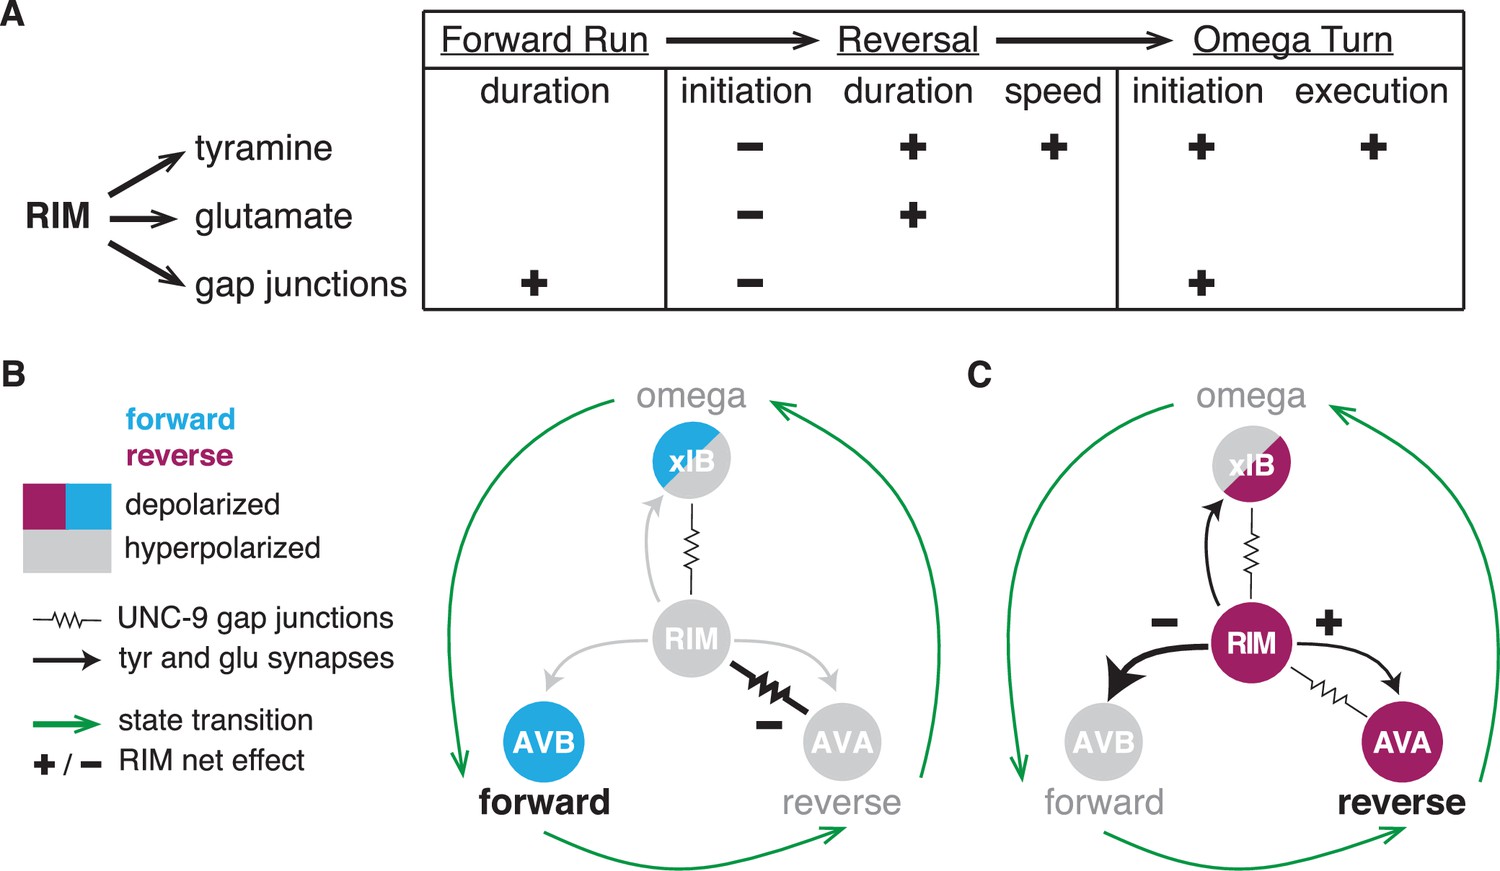
RIM synapses generate behavioral inertia and jointly regulate forward-to-reversal transitions.
(A) Summary of synaptic regulation of spontaneous behaviors (Figures 2—7). (+) indicates that the normal function of the synapse increases the behavioral parameter (e.g., RIM tyramine increases reversal speed because tdc-1 mutant reversals are slower than wild-type). (–) indicates that the synapse decreases the parameter (e.g., RIM tyramine, glutamate, and unc-1/unc-9 gap junctions all inhibit reversal initiation because the mutants have more spontaneous reversals than wild-type). Additional RIM transmitters inhibit reversals during global search (Figure 4), and RIC octopamine and gap junctions increase forward and reversal speed, but not reversal initiation (Figure 2—figure supplement 2, Figure 4—figure supplement 1, Figure 6—figure supplement 3). (B, C) AVB, AVA, and xIB (AIB + RIB) are representative of the neurons that promote forward runs, reversals, and omega turns, respectively. AVB and RIB are depolarized during forward runs; RIM, AVA, and AIB are depolarized during reversals; AIB and RIB are depolarized during turns. (B) RIM unc-1/unc-9 gap junctions stabilize forward runs by propagating a hyperpolarizing signal to reversal-promoting neurons. (C) RIM tyramine and glutamate stabilize reversals by inhibiting forward-promoting neurons and may also activate reversal-promoting neurons.
Tables
Key resources table
| Reagent type (species) or resource | Designation | Source or reference | Identifiers | Additional information |
|---|---|---|---|---|
| Strain, strain background (Caenorhabditis elegans N2, hermaphrodite) | Wild-type | This paper | ID_BargmannDatabase:CX17882 | See Figures 1—3, Figure 2—figure supplements 1 and 2 |
| Strain, strain background (C. elegans N2, hermaphrodite) | CX0007 | This paper | ID_BargmannDatabase:CX0007 | Child of CX17882; See Supplementary file 1, Table 1: Strain details |
| Strain, strain background (C. elegans N2, hermaphrodite) | RIM glu KO | This paper | ID_BargmannDatabase:CX17881 | See Figures 1—3, Figure 2—figure supplement 2 |
| Strain, strain background (C. elegans N2, hermaphrodite) | tdc-1 | This paper | ID_BargmannDatabase:CX17883 | See Figures 1—3, Figure 2—figure supplement 2 |
| Strain, strain background (C. elegans N2, hermaphrodite) | RIM glu KO; tdc-1 | This paper | ID_BargmannDatabase:CX17884 | See Figures 1—3, Figure 2—figure supplement 2 |
| Strain, strain background (C. elegans N2, hermaphrodite) | elt-2p::nGFP; wild-type | This paper | ID_BargmannDatabase:CX18118 | See Figure 2—figure supplement 1 |
| Strain, strain background (C. elegans N2, hermaphrodite) | elt-2p::nGFP; edited eat-4 | This paper | ID_BargmannDatabase:CX17461; ID_BargmannDatabase:CX18118 | See Figure 2—figure supplement 1 |
| Strain, strain background (C. elegans N2, hermaphrodite) | tbh-1 | DOI:10.1016/j.neuron.2005.02.024 | RRID:SCR_007341: MT9455 | See Figure 2—figure supplement 2 |
| Strain, strain background (C. elegans N2, hermaphrodite) | Wild-type | PMC1213120 | RRID:SCR_007341:N2 | See Figure 4, Figure 4—figure supplements 1 and 2, Figure 6—figure supplement 2 |
| Strain, strain background (C. elegans N2, hermaphrodite) | RIM::tetanus toxin::mCherry | DOI:10.1016/j.cell.2015.02.018 | ID_BargmannDatabase:CX14993 | See Figure 4, Figure 4—figure supplements 1 and 2 |
| Strain, strain background (C. elegans N2, hermaphrodite) | tbh-1p::tetanus toxin::mCherry | This paper | ID_BargmannDatabase:CX17912 | See Figure 4—figure supplement 1 |
| Strain, strain background (C. elegans N2, hermaphrodite) | RIM::HisCl; wild-type | DOI:10.1073/pnas.1400615111 | ID_BargmannDatabase:CX18193 | See Figures 5 and 7, Figure 5—figure supplements 1 and 2 |
| Strain, strain background (C. elegans N2, hermaphrodite) | RIM::HisCl; tdc-1 | This paper | ID_BargmannDatabase:CX18194 | See Figure 5—figure supplement 1 |
| Strain, strain background (C. elegans N2, hermaphrodite) | AVA::GCaMP5; wild-type | DOI:10.1016j.cell.2015.02.018 | ID_BargmannDatabase: CX15380 | See Figure 5—figure supplement 3 |
| Strain, strain background (C. elegans N2, hermaphrodite) | AVA::GCaMP5; RIM::HisCl | This paper | ID_BargmannDatabase: CX15380;ID_BargmannDatabase: CX18193 | See Figure 5—figure supplement 3 |
| Strain, strain background (C. elegans N2, hermaphrodite) | Wild-type | This paper | ID_BargmannDatabase:CX17546 | See Figure 6, Figure 4—figure supplement 1, Figure 6—figure supplements 1–3 |
| Strain, strain background (C. elegans N2, hermaphrodite) | RIM gap junction KD | This paper | ID_BargmannDatabase:CX14853 | See Figure 6, Figure 6—figure supplements 1–3 |
| Strain, strain background (C. elegans N2, hermaphrodite) | tdc-1 | DOI:10.1016/j.neuron.2005.02.024 | RRID:SCR_007341:MT13113 | See Figure 6—figure supplement 2 |
| Strain, strain background (C. elegans N2, hermaphrodite) | RIM gap junction KD; tdc-1 | This paper | ID_BargmannDatabase:CX14853RRID:SCR_007341:MT13113 | See Figure 6—figure supplement 2 |
| Strain, strain background (C. elegans N2, hermaphrodite) | RIC gap junction KD | This paper | ID_BargmannDatabase: CX18293 | See Figure 6—figure supplement 3 |
| Strain, strain background (C. elegans N2, hermaphrodite) | RIM::HisCl;RIM gap junction KD | This paper | ID_BargmannDatabase:CX18137 | See Figure 7 |
| Strain, strain background (C. elegans N2, hermaphrodite) | RIM::ReaChR: wild-type | This paper | ID_BargmannDatabase:CX17885 | See Figure 7, Figure 7—figure supplement 1 |
| Strain, strain background (C. elegans N2, hermaphrodite) | RIM::ReaChR:RIM glu KO | This paper | ID_BargmannDatabase:CX17886 | See Figure 7, Figure 7—figure supplement 1 |
| Strain, strain background (C. elegans N2, hermaphrodite) | RIM::ReaChR: tdc-1 | This paper | ID_BargmannDatabase:CX17887 | See Figure 7, Figure 7—figure supplement 1 |
| Strain, strain background (C. elegans N2, hermaphrodite) | RIM::ReaChR:RIM glu KO; tdc-1 | This paper | ID_BargmannDatabase:CX17888 | See Figure 7, Figure 7—figure supplement 1 |
| Strain, strain background (C. elegans N2, hermaphrodite) | RIM::ReaChR: wild-type | DOI:10.1016/j.neuron.2019.01.053 | ID_BargmannDatabase:CX17694 | See Figure 7, Figure 7—figure supplement 1 |
| Strain, strain background (C. elegans N2, hermaphrodite) | RIM::ReaChR:RIM gap junction KD | This paper | ID_BargmannDatabase:CX18195 | See Figure 7, Figure 7—figure supplement 1 |
| Chemical compound, drug | Histamine dihydrochloride | Sigma | H7250 | CAS 56-92-8 |
| Chemical compound, drug | (-)-Levamisole hydrochloride | Sigma | L9756 | CAS 16595-80-5 |
| Chemical compound, drug | Polydimethylsiloxane (PDMS) | Sigma | 761036 | 9:1 base:curing agent, Sylgard 184 |
| Software, algorithm | ImageJ | ImageJ (http://imagej.nih.gov/ij/) | RRID:SCR_003070 | Version 1.50i |
| Software, algorithm | GraphPad Prism | GraphPad Prism (https://graphpad.com) | RRID:SCR_002798 | Versions 7.0c, 8.4.1 |
| Software, algorithm | MATLAB | MathWorks (https://www.mathworks.com/) | RRID:SCR_001622 | Versions R2014a, R2016b, R2018b |
| Software, algorithm | Metamorph | Molecular Devices (https://www.moleculardevices.com) | RRID:SCR_002368 | Version 7.8.2.0 |
| Software, algorithm | Streampix | Norpix(https://www.norpix.com/products/streampix/streampix.php) | RRID:SCR_015773 | Versions 6 and 8 |
| Software, algorithm | Python | Python (https://www.python.org/) | RRID:SCR_008394 | Version 3.8.1 |
| Software, algorithm | Analysis code | This paper (https://doi.org/10.5061/dryad.ht76hdrf6, https://github.com/navinpokala/BargmannWormTracker) | See Dryad repository or Github |
Additional files
-
Transparent reporting form
- https://cdn.elifesciences.org/articles/67723/elife-67723-transrepform1-v1.docx
-
Source data 1
Source data for all dot plots.
Includes numerical values representing the average frequency of a behavioral event, per animal, per minute, on a single assay plate.
- https://cdn.elifesciences.org/articles/67723/elife-67723-supp1-v1.xlsx
-
Source data 2
Source data for Figure 5—figure supplement 3.
- https://cdn.elifesciences.org/articles/67723/elife-67723-supp2-v1.xlsx
-
Supplementary file 1
Supplementary Tables 1-4.
- https://cdn.elifesciences.org/articles/67723/elife-67723-supp3-v1.docx
Download links
A two-part list of links to download the article, or parts of the article, in various formats.
Downloads (link to download the article as PDF)
Open citations (links to open the citations from this article in various online reference manager services)
Cite this article (links to download the citations from this article in formats compatible with various reference manager tools)
Behavioral control by depolarized and hyperpolarized states of an integrating neuron
eLife 10:e67723.
https://doi.org/10.7554/eLife.67723


