Establishment of developmental gene silencing by ordered polycomb complex recruitment in early zebrafish embryos
- Howard Hughes Medical Institute, Department of Oncological Sciences and Huntsman Cancer Institute, University of Utah School of Medicine, United States
- Department of Biomedical Genetics, Wilmot Cancer Center, University of Rochester School of Medicine, United States
Figures
Figure 1 with 3 supplements
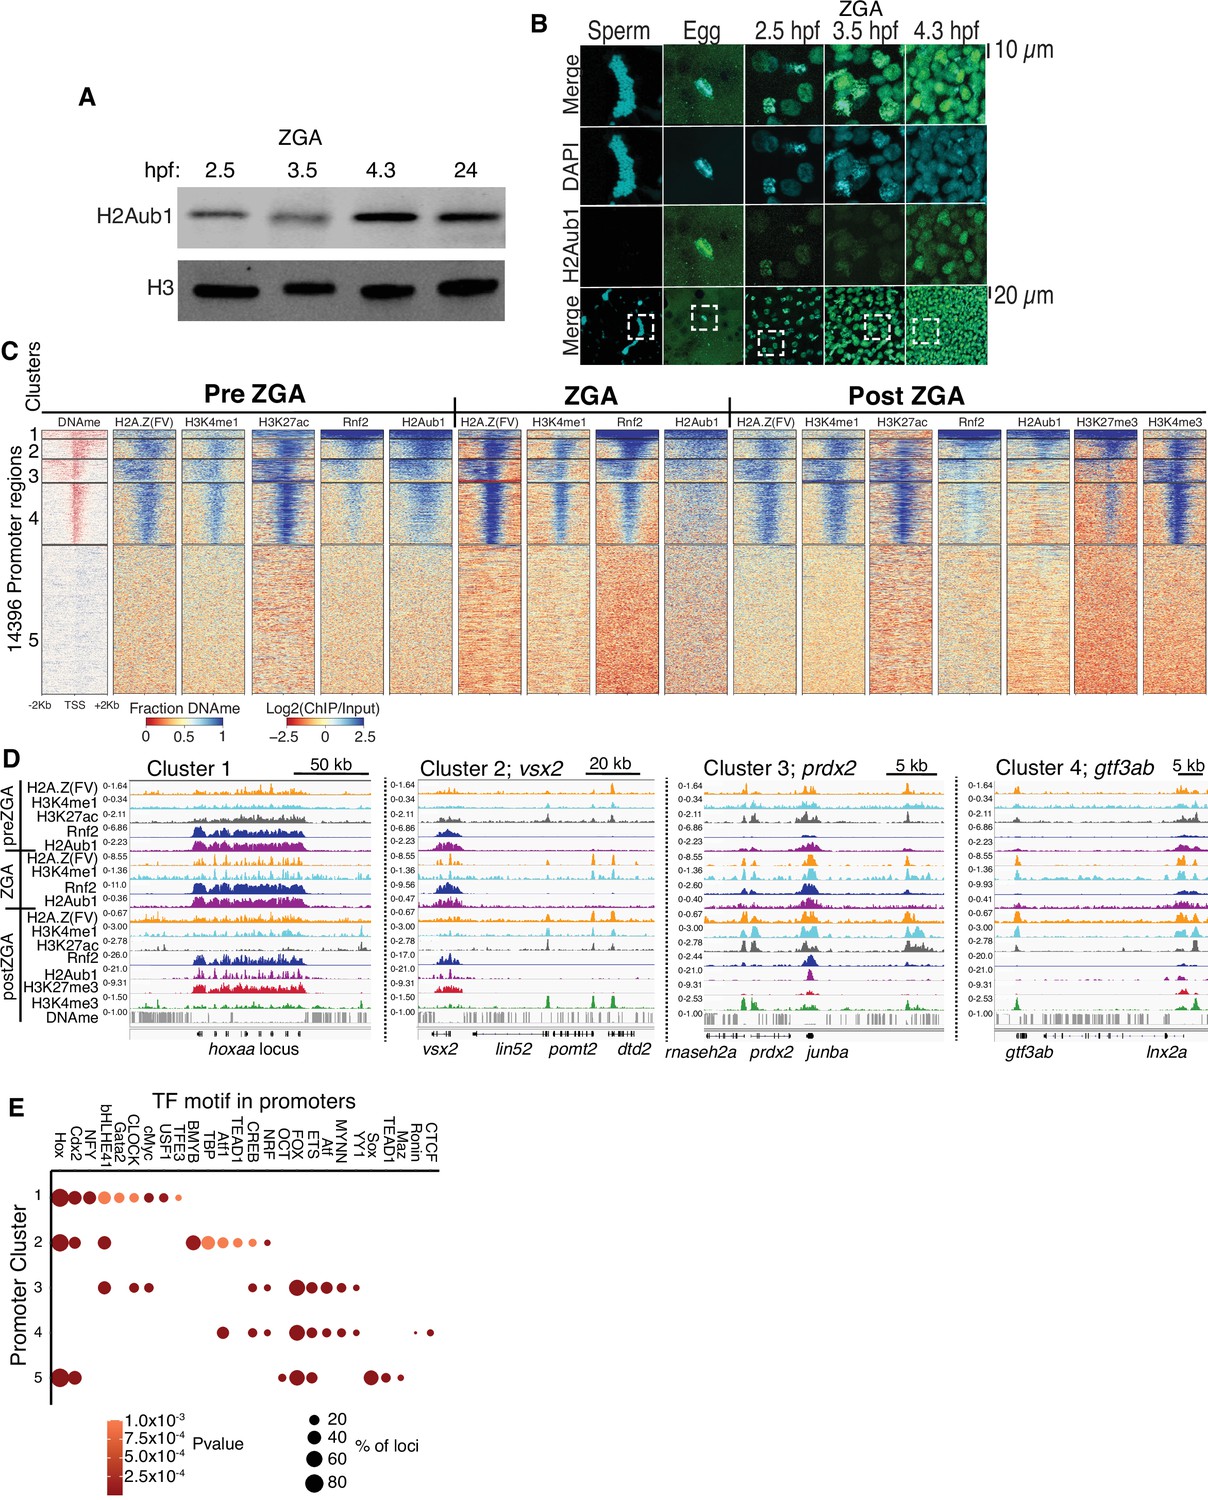
Polycomb repressive complex 1 (PRC1) occupancy and activity precedes H3K27me3 establishment at promoters.
(A) Detection of H2Aub1 and histone H3 (control) by western blot, prior to (2.5 hr post fertilization [hpf]), during (3.5 hpf), following (4.3 hpf) zygotic genome activation (ZGA), and 24 hpf. (B) Nuclear H2Aub1 immunofluorescence in zebrafish sperm, oocytes (egg), and embryos prior to (2.5 hpf), during (3.5 hpf), and following (4.3 hpf) ZGA. Dashed square: field of view in upper panels. (C) K-means clustering of DNA methylation (DNAme) and chromatin immunoprecipitation (ChIP)-seq (histone modifications/variant) at promoters (UCSC refseq). For DNAme, red color indicates regions that lack DNAme. (D) Genome browser screenshots of ChIP-seq enrichment at representative genes from the clusters in panel (C). (E) Transcription factor motif enrichment from HOMER (Heinz et al., 2010) at promoter clusters from (C).
-
Figure 1—source data 1
Uncropped western blots for panel A.
- https://cdn.elifesciences.org/articles/67738/elife-67738-fig1-data1-v2.zip
Figure 1—figure supplement 1
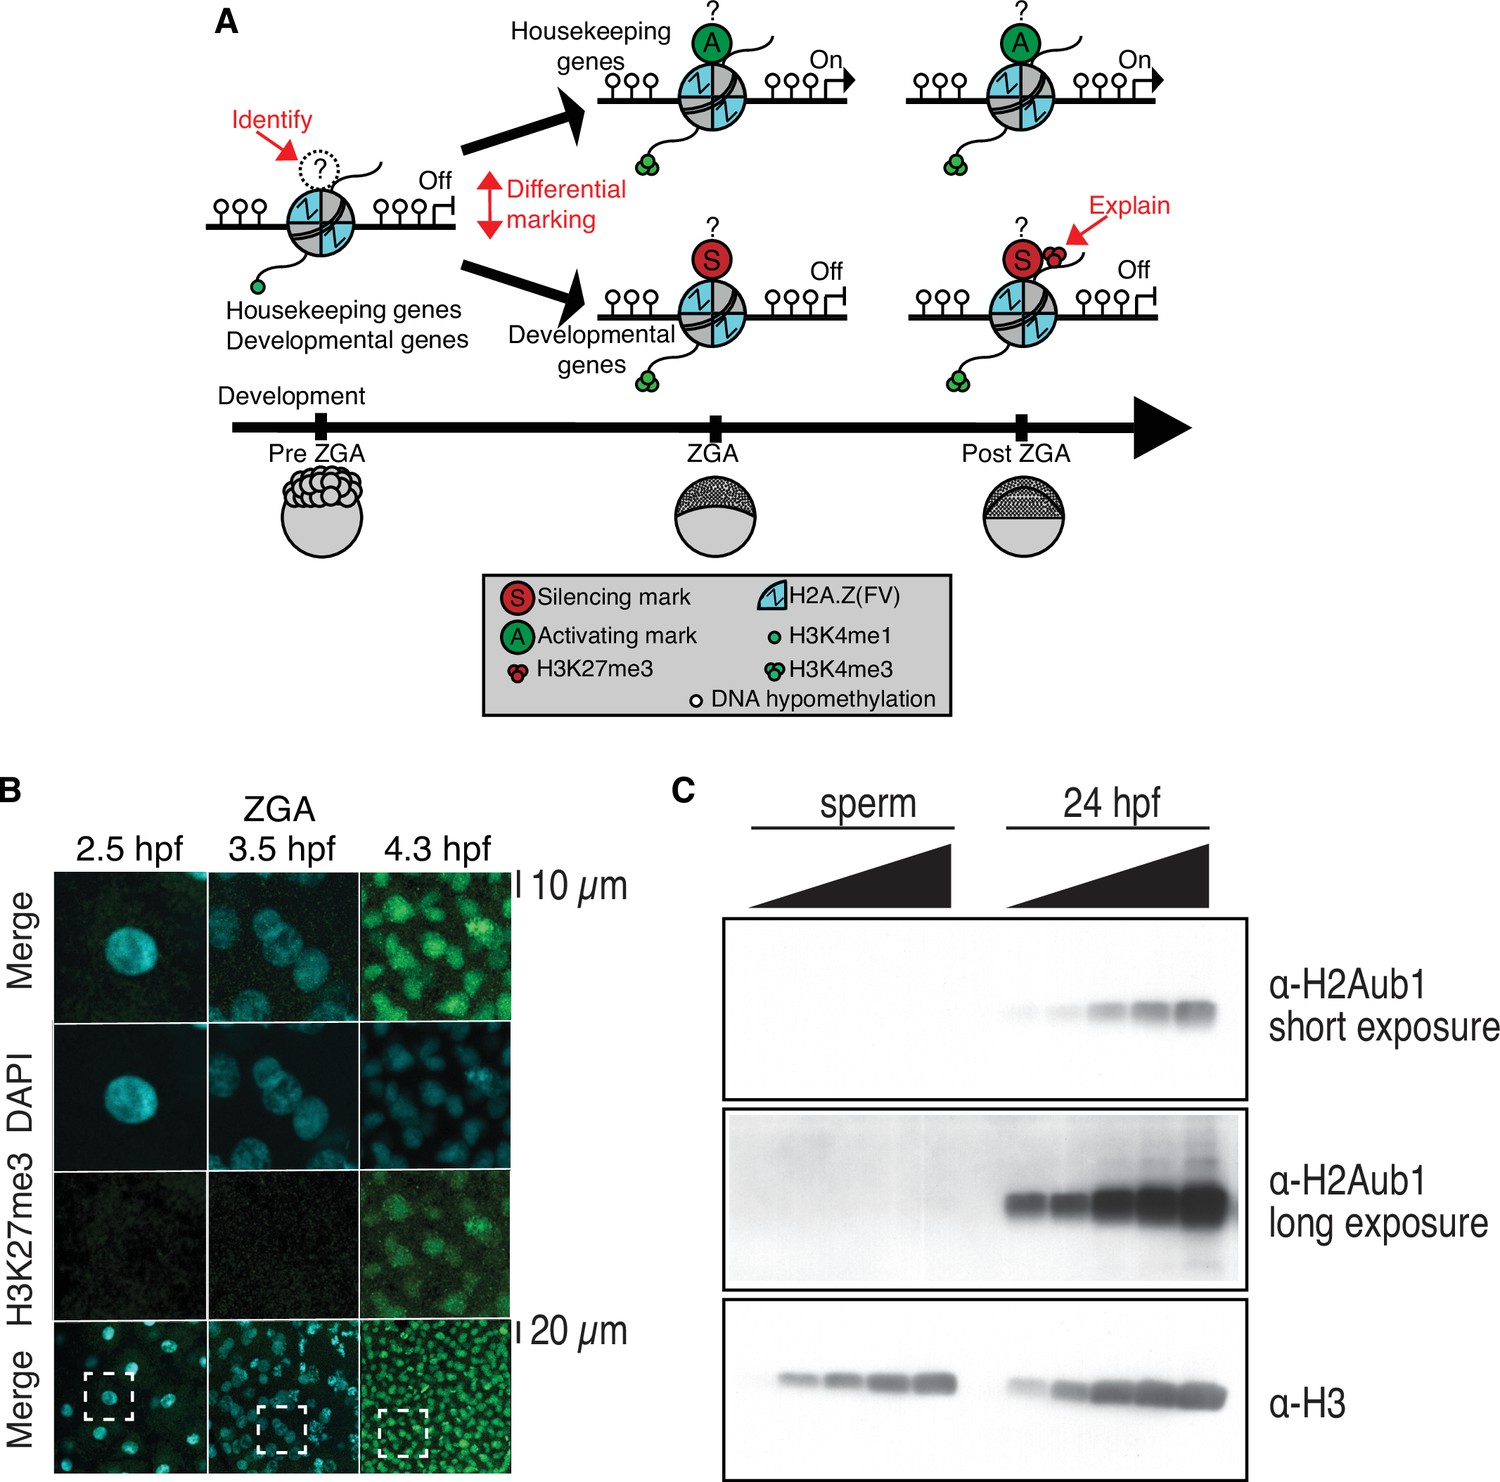
Profiling of histone marks in zebrafish embryos and sperm.
(A) A model illustrating the current knowledge gaps regarding how developmental gene silencing and housekeeping gene activation is achieved in early vertebrate embryos. Question marks represent the possible existence of histone modifications, activating (A?) or silencing (S?) that distinguish gene classes prior to zygotic genome activation (ZGA). (B) Nuclear H3K27me3 detection by immunofluorescence in zebrafish embryos following ZGA (4.3 hr post fertilization [hpf]). One of three biological replicates is shown. No H3K27me3 staining was observed in embryos at preZGA (2.5 hpf) or ZGA (3.5 hpf). Bottom row: The dashed square indicates the field of view for the corresponding top three rows. (C) H2Aub1 is undetected by western blot in zebrafish sperm. Varying amounts of protein from zebrafish sperm (left) or 24 hpf embryos (right) were used for western blotting. Top: Short exposure probing for H2Aub1. Middle: Long exposure probing for H2Aub1. Bottom: Histone H3 loading control. One of three biological replicates is shown.
-
Figure 1—figure supplement 1—source data 1
Uncropped western blots for panel C.
- https://cdn.elifesciences.org/articles/67738/elife-67738-fig1-figsupp1-data1-v2.zip
Figure 1—figure supplement 2
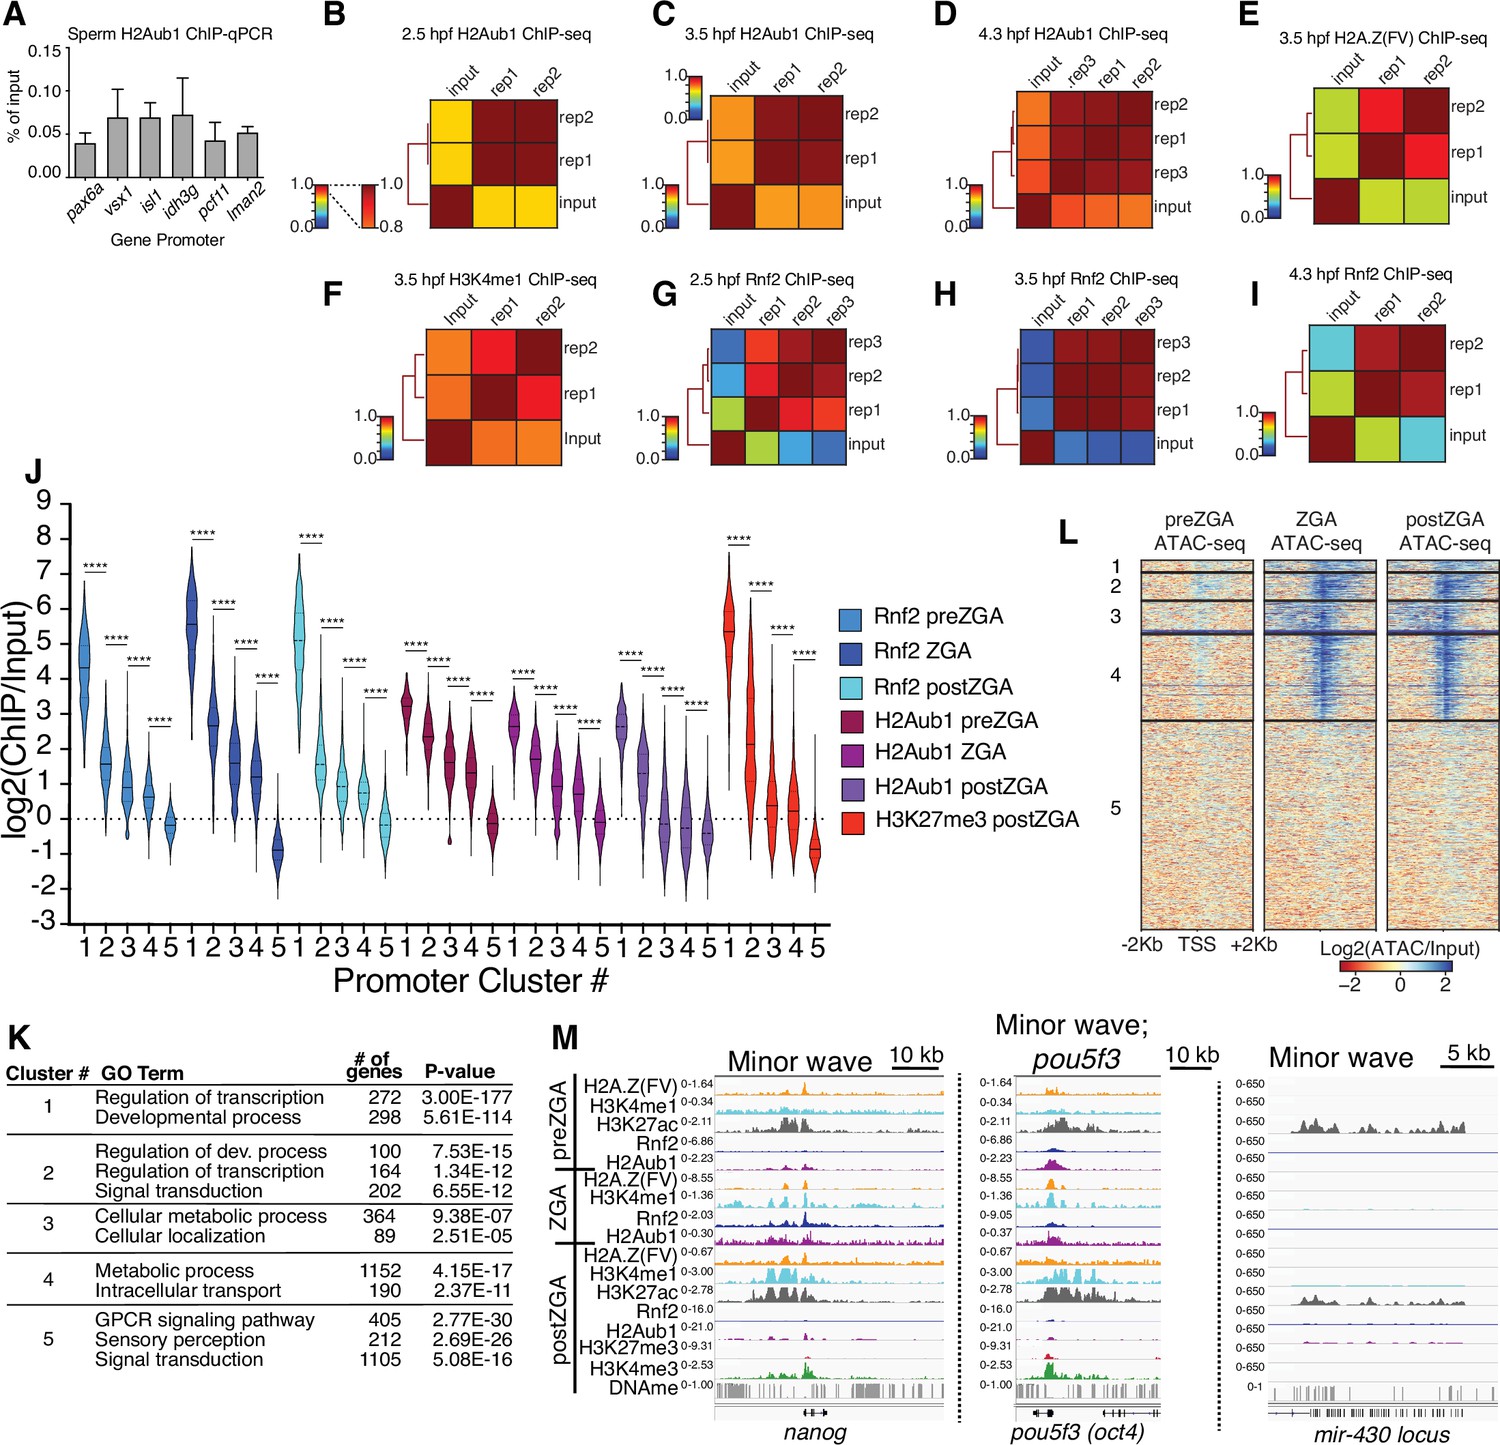
Chromatin immunoprecipitation (ChIP) replicate structures and additional analyses.
(A) ChIP-qPCR of H2Aub1 of indicated gene promoters in zebrafish sperm. No H2Aub1 enrichment was detected at developmental gene promoters (pax6a, vsx1, isl1) in sperm. Housekeeping gene promoters (idh3g, pcf11, lman2) were used as negative control regions. Three biological replicates were conducted. (B–I) Genome-wide correlation matrices of indicated ChIP-seq replicates and input from zebrafish embryos at the indicated developmental timepoints. Heatmap matrices display Pearson correlation coefficients (B–D, G–I) or Spearman correlation coefficients (E, F). (J) Violin plots of ChIP-seq enrichment levels at promoter K-means clusters displayed in Figure 1C. A 1 Kb window flanking the transcription start site (TSS) was utilized to collect mean log2(ChIP/input) data. Unpaired t-test with Welch’s correction was performed in GraphPad Prism version 8.3.1. Asterisks represent p-values that are less than 0.0001. (K) GO-term analysis of promoter clusters in Figure 1C. Top GO terms (enriched gene categories) for the promoter clusters are shown, along with the number of genes (#) and the p-value for enrichment. GO-term analysis was performed with DAVID (Huang et al., 2009). (L) Heatmaps of ATAC-seq at UCSC RefSeq promoters. K-means clusters from Figure 1C were used to plot data. (M) Genome browser screenshots of representative genes involved in the minor wave of zygotic transcription with ChIP-seq enrichment from clusters in Figure 1C.
Figure 1—figure supplement 3
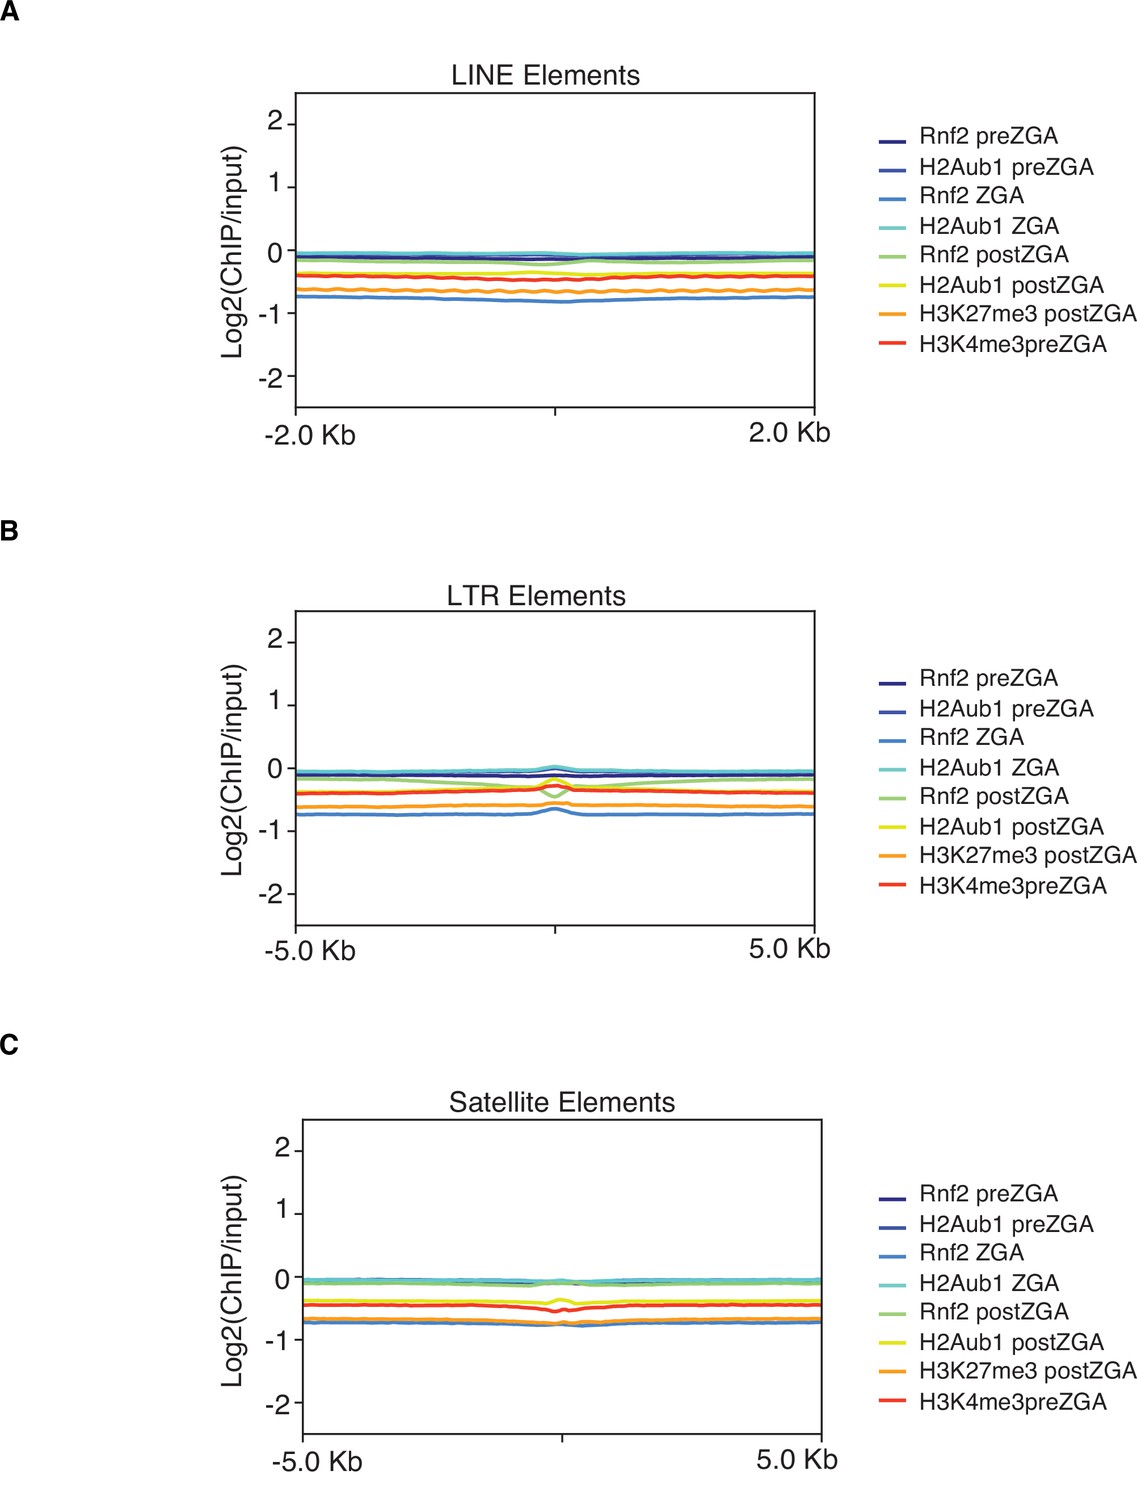
Rnf2 and H2Aub1 are not enriched at LINE, LTR, and satellite repetitive elements.
Mean log2(chromatin immunoprecipitation [ChIP]/input) enrichment scores for the denoted chromatin factor or modification plotted at LINE (A), LTR (B), and satellite repetitive elements (C).
Figure 2 with 1 supplement
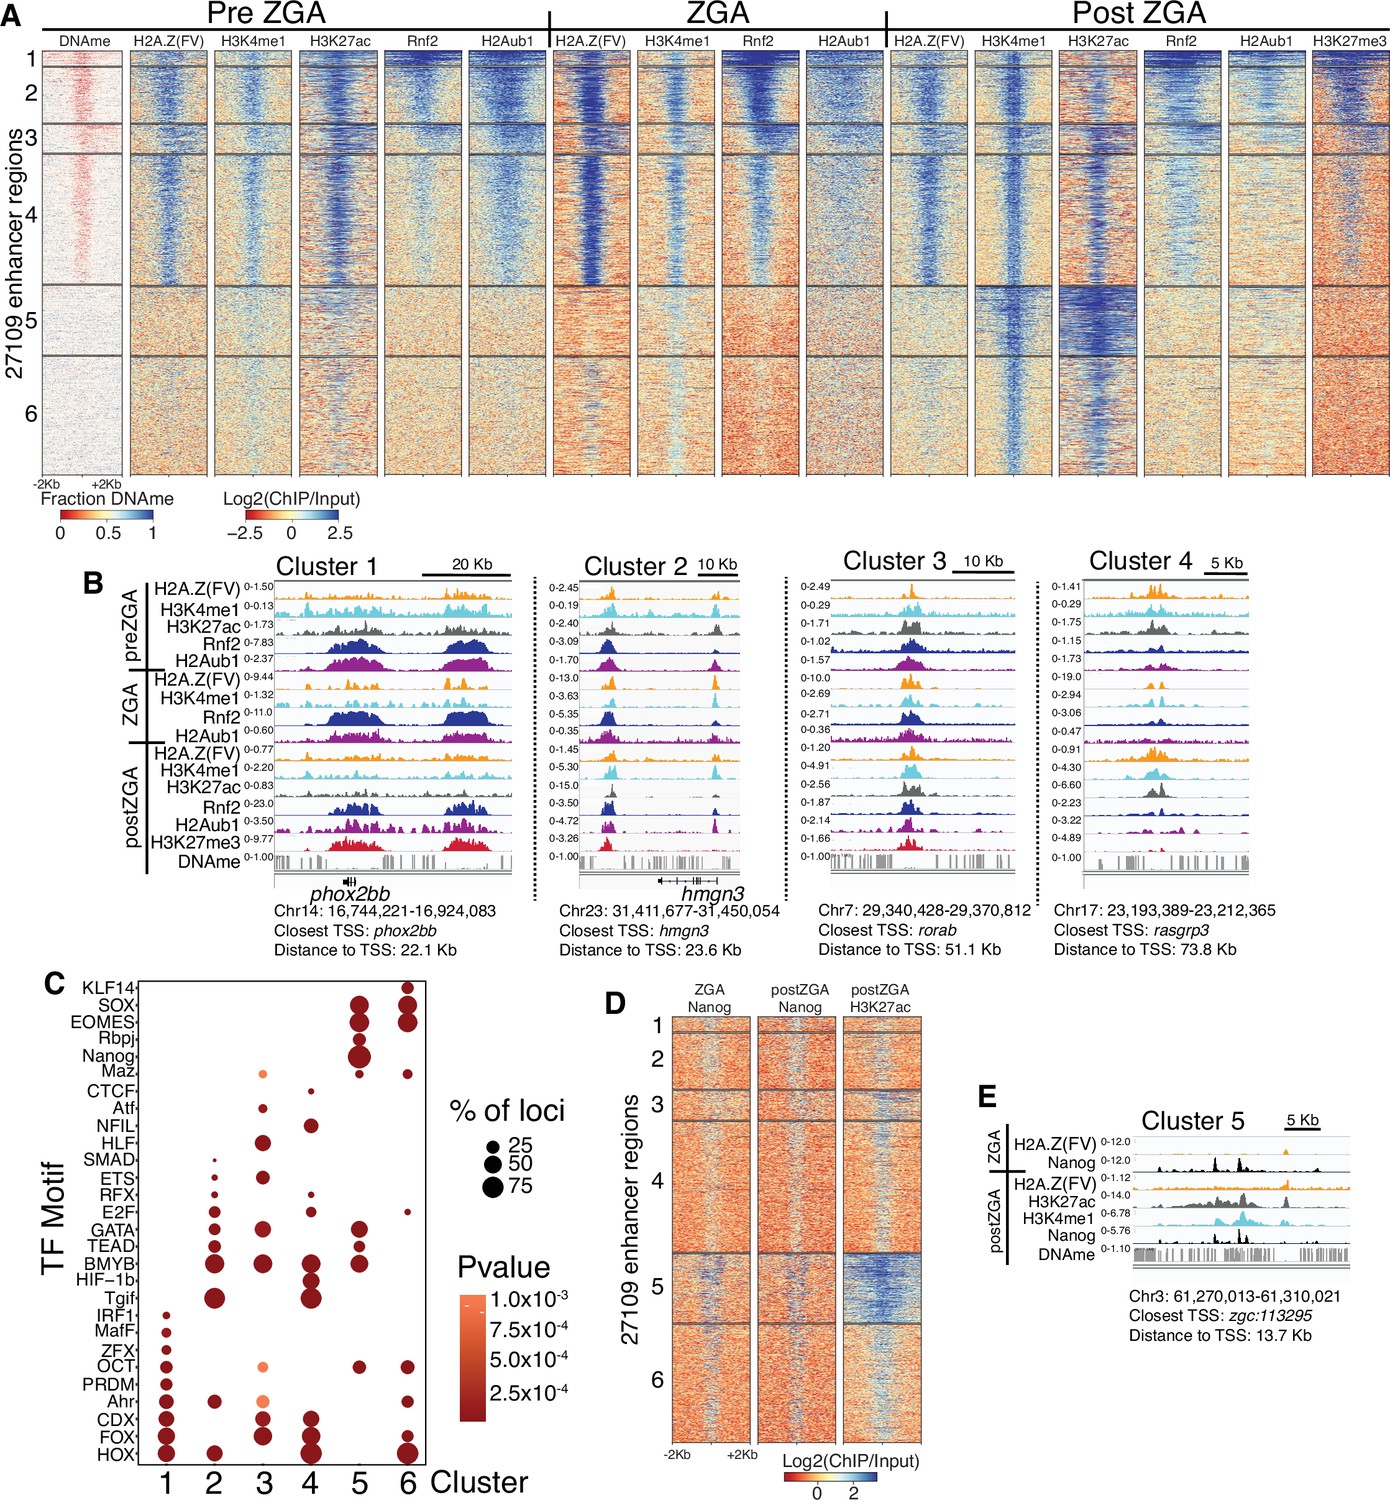
Polycomb repressive complex 1 (PRC1) occupancy and activity precedes H3K27me3 at enhancers.
(A) K-means clustering of whole genome bisulfite sequencing (WGBS) (for DNAme) and chromatin immunoprecipitation (ChIP)-seq at enhancers (postzygotic genome activation [postZGA] H3K4me1 peak summits located outside of promoters). DNAme heatmap displays WGBS fraction-methylated scores (note: red color indicates regions that lack DNAme). ChIP-seq heatmaps display log2(ChIP/input) scores. (B) Genome browser screenshots of ChIP-seq enrichment at representative loci from the indicated K-means clusters in (A). (C) Transcription factor motif enrichment from HOMER (Heinz et al., 2010) at enhancer clusters from (A). (D) Features of an enhancer cluster with exceptionally high H3K27ac and Nanog binding. K-means clusters generated in (A) were utilized to plot heatmaps of Nanog and H3K27ac. (E) A genome browser screenshot depicting Nanog and H3K27ac ChIP enrichment at a DNA-methylated enhancer from cluster 5 in (D).
Figure 2—figure supplement 1
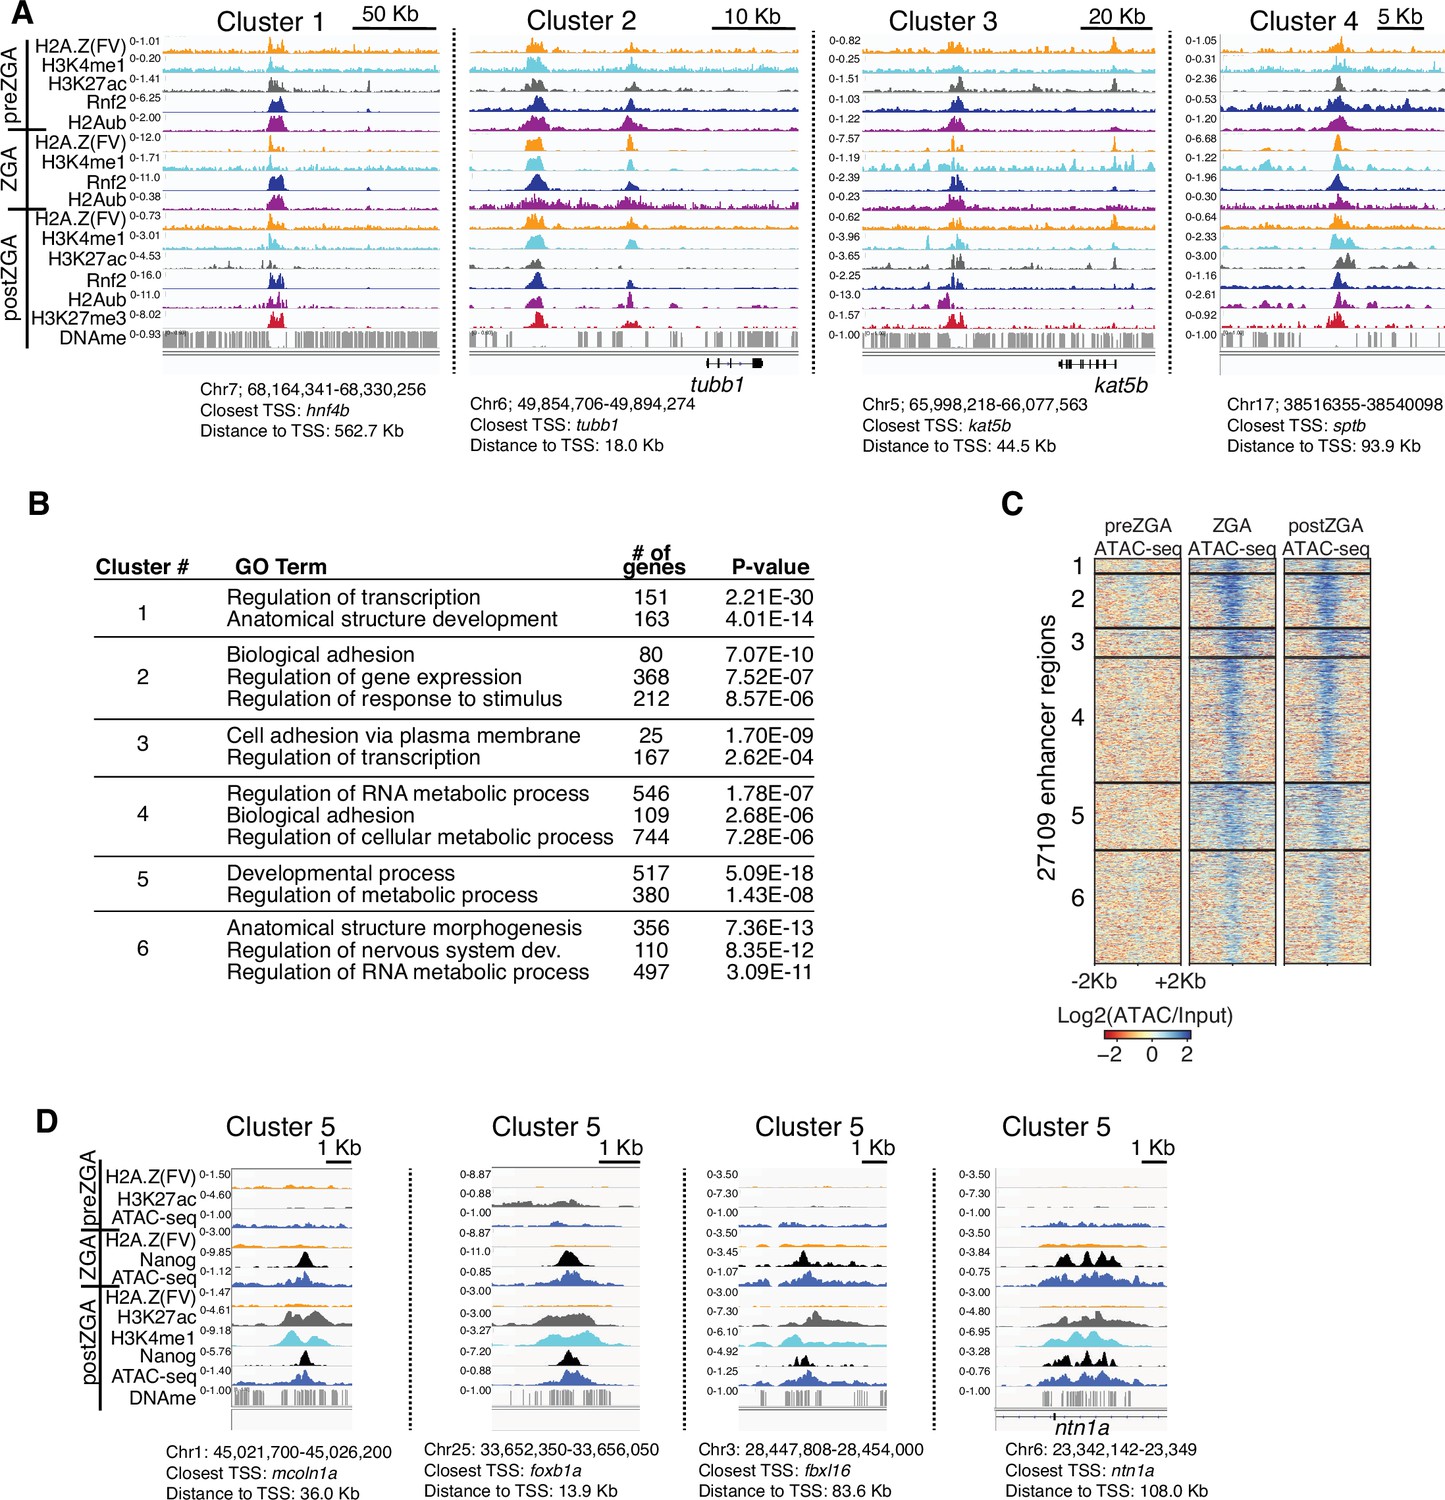
Additional examples of chromatin immunoprecipitation (ChIP) enrichment at enhancers.
(A) Genome browser screenshots of ChIP-seq enrichment at representative enhancer loci from enhancer K-means clusters in Figure 2A. (B) GO-term analysis of enhancer clusters in Figure 1C. Top GO terms (enriched gene categories) for the nearest genes to the enhancer clusters are shown, along with the number of genes (#) and the p-value for enrichment. GO-term analysis was performed with DAVID (Huang et al., 2009). (C) Heatmaps of ATAC-seq at H3K4me1 peak summits. K-means clusters from Figure 2A were used to plot data. (D) Genome browser screenshots of representative ATAC-seq and ChIP-seq enrichment at enhancer cluster 5 from Figure 2A and D.
Figure 3 with 2 supplements

Aebp2-polycomb repressive complex 2 (PRC2) mediates de novo H3K27me3 at loci pre-marked by H2Aub1.
(A) Nuclear Aebp2 detection by immunofluorescence in postzygotic genome activation (postZGA) zebrafish embryos (4.3 hr post fertilization [hpf]). No Aebp2 staining was detected at preZGA (2.5 hpf) or ZGA (3.5 hpf). Bottom row: The dashed square indicates the field of view in upper panels. One of three biological replicates is shown. (B) Aebp2 binding at promoters during postZGA overlaps and scales with occupancy of Rnf2, H2Aub1, and H3K27me3. Promoter clusters from Figure 1C were utilized to plot heatmaps. (C) Genome browser screenshots of chromatin immunoprecipitation (ChIP)-seq at representative promoter loci from clusters in (B). (D) Aebp2 binding at enhancers during postZGA overlaps with occupancy of Rnf2, H2Aub1, and H3K27me3. Enhancer clusters from Figure 2A were utilized to plot heatmaps. (E) Genome browser screenshots of ChIP-seq enrichment at representative enhancer loci from clusters in (D).
Figure 3—figure supplement 1
Chromatin immunoprecipitation (ChIP) profiling of Aebp2 in postzygotic genome activation (postZGA) embryos.
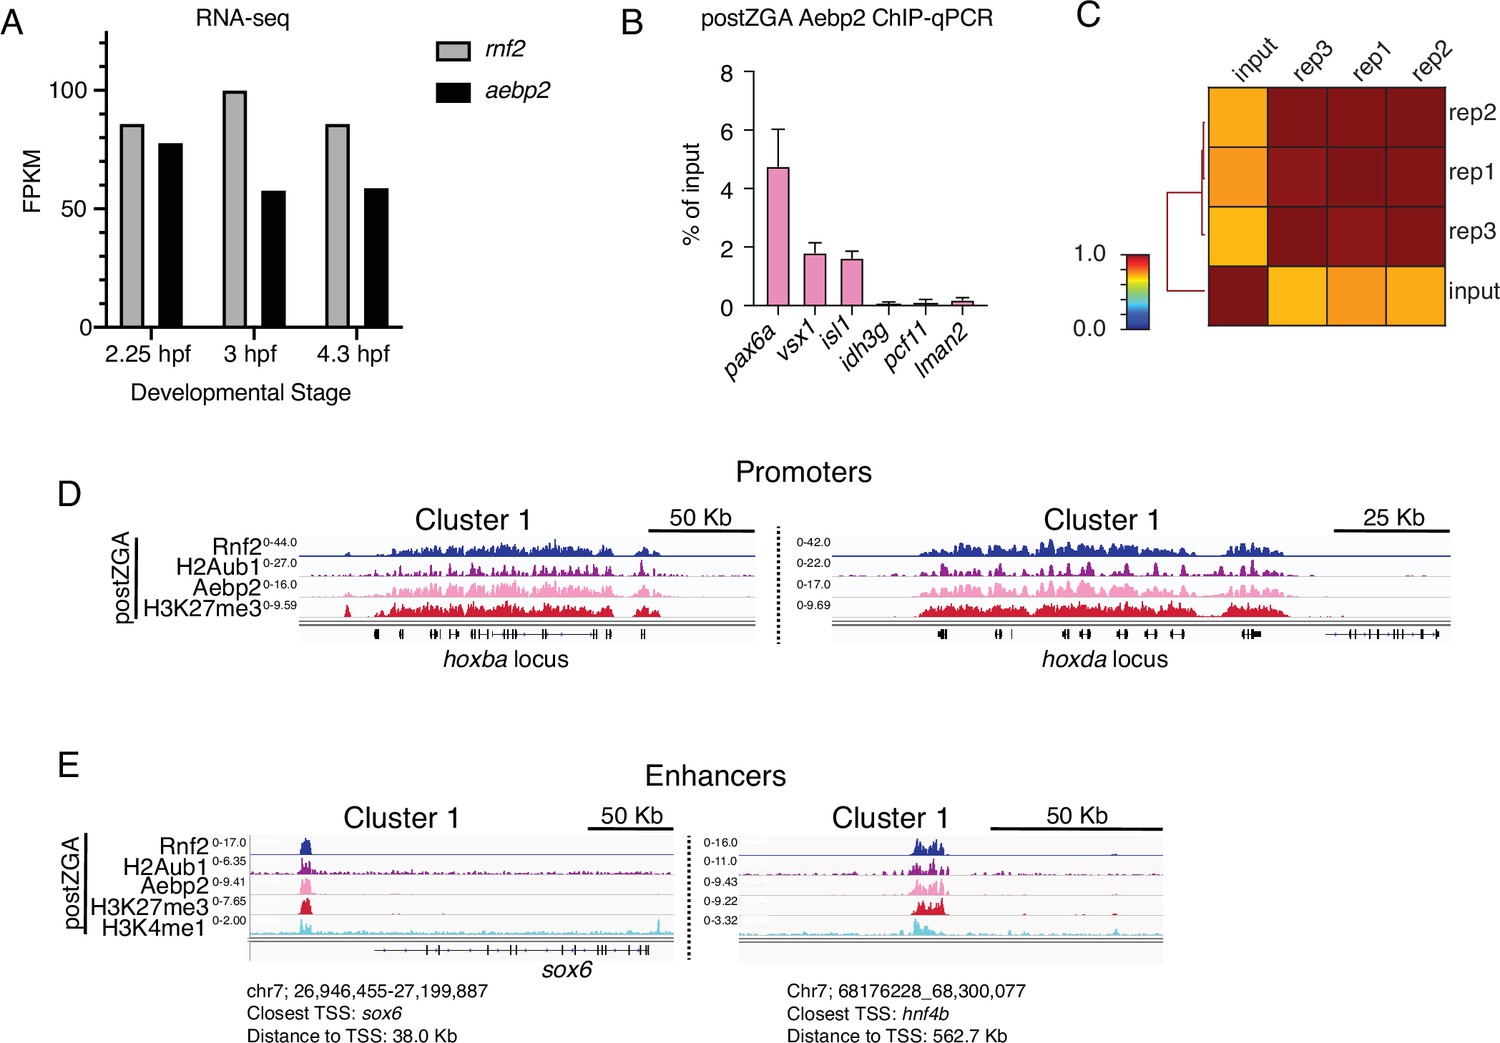
(A) Abundance of aebp2 mRNA in early zebrafish embryos measured by RNA-sequencing. Increased Aebp2 protein levels from preZGA to postZGA observed in Figure 4A are not explained by increased aebp2 mRNA levels (black bars). Levels of rnf2 mRNA are plotted for comparison (gray bars). RNA-seq data was collected from http://www.ebiac.uk/gxa/experiments/E-ERAD-475. (B) Aebp2 ChIP-qPCR demonstrates enrichment of Aebp2 at developmental gene promoters (pax6a, vsx1, isl1) in postZGA stage embryos (4.3 hr post fertilization [hpf]). Housekeeping gene promoters (idh3g, pcf11, lman2) were used as negative control regions. Note: Promoter regions assayed here are either robustly marked by H2Aub1 (pax6a, vsx1, isl1) or lack H2Aub1 (idh3g, pcf11, lman2). Three biological replicates were conducted for ChIP. For qPCR, three technical replicates were conducted on each ChIP biological replicate. (C) Genome-wide correlation matrix of Aebp2 ChIP-seq replicates and input from postZGA (4.3 hpf) zebrafish embryos. Heatmap matrix displays Pearson correlation coefficients. (D) Genome browser screenshots of representative promoters with ChIP-seq enrichment demonstrating binding of Aebp2 at promoters bearing Rnf2, H2Aub1, and H3K27me3 at postZGA (4.3 hpf). (E) Genome browser screenshots of representative enhancers with ChIP-seq enrichment demonstrating binding of Aebp2 at enhancers bearing Rnf2, H2Aub1, and H3K27me3 at postZGA (4.3 hpf).
Figure 3—figure supplement 2
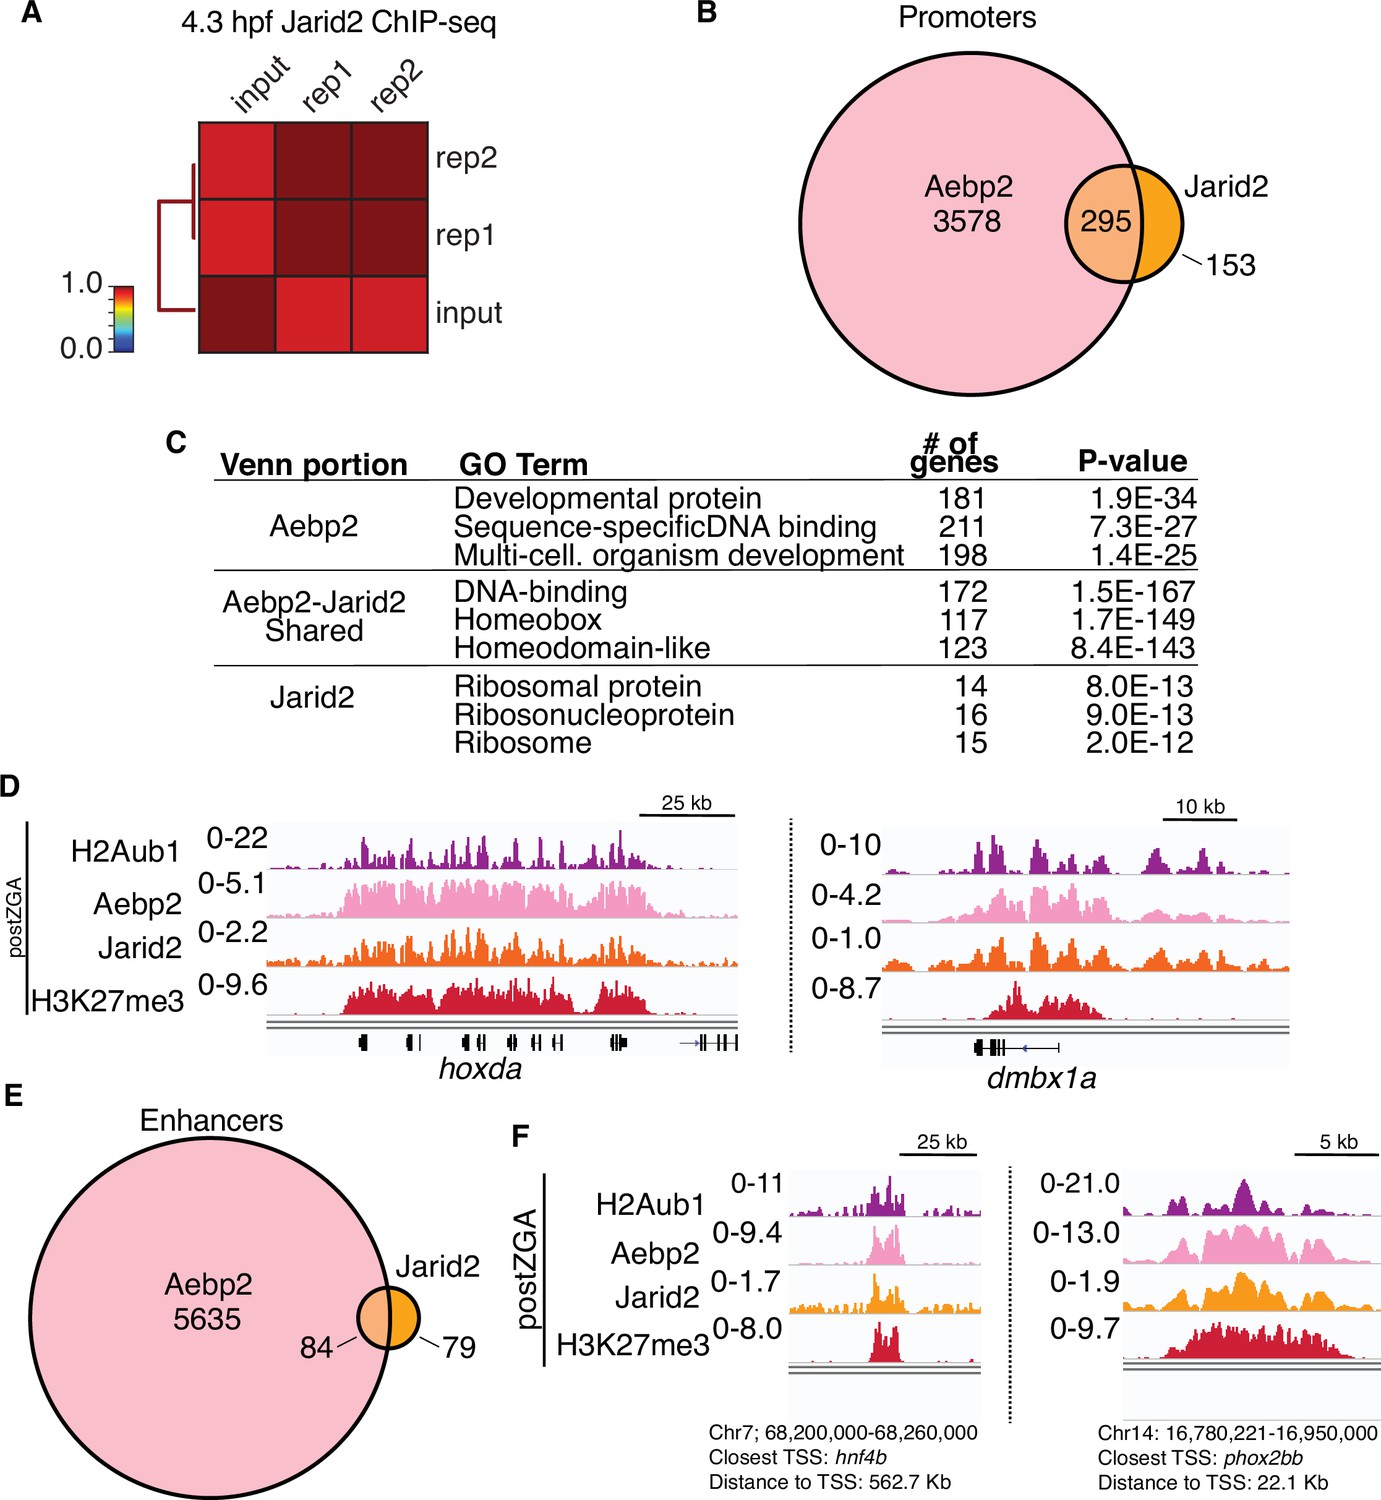
Postzygotic genome activation (postZGA) chromatin immunoprecipitation (ChIP)-seq of Jarid2.
(A) Genome-wide correlation matrix of Jarid2 ChIP-seq replicates and input from postZGA (4.3 hr post fertilization [hpf]) zebrafish embryos. Heatmap matrix displays Pearson correlation coefficients. (B) Venn diagram of gene promoters with peaks of Aebp2 or Jarid2. (C) Top three enriched GO-term categories from the genes depicted in (B). (D) Genome browser screenshots of representative promoters with ChIP-seq enrichment of H2Aub1, Aebp2, Jarid2, and H3K27me3 at postZGA (4.3 hpf). (E) Venn diagram of enhancer loci with peaks of Aebp2 or Jarid2. (F) Genome browser screenshots of representative enhancers with ChIP-seq enrichment of H2Aub1, Aebp2, Jarid2, and H3K27me3 at postZGA (4.3 hpf).
Figure 4 with 3 supplements
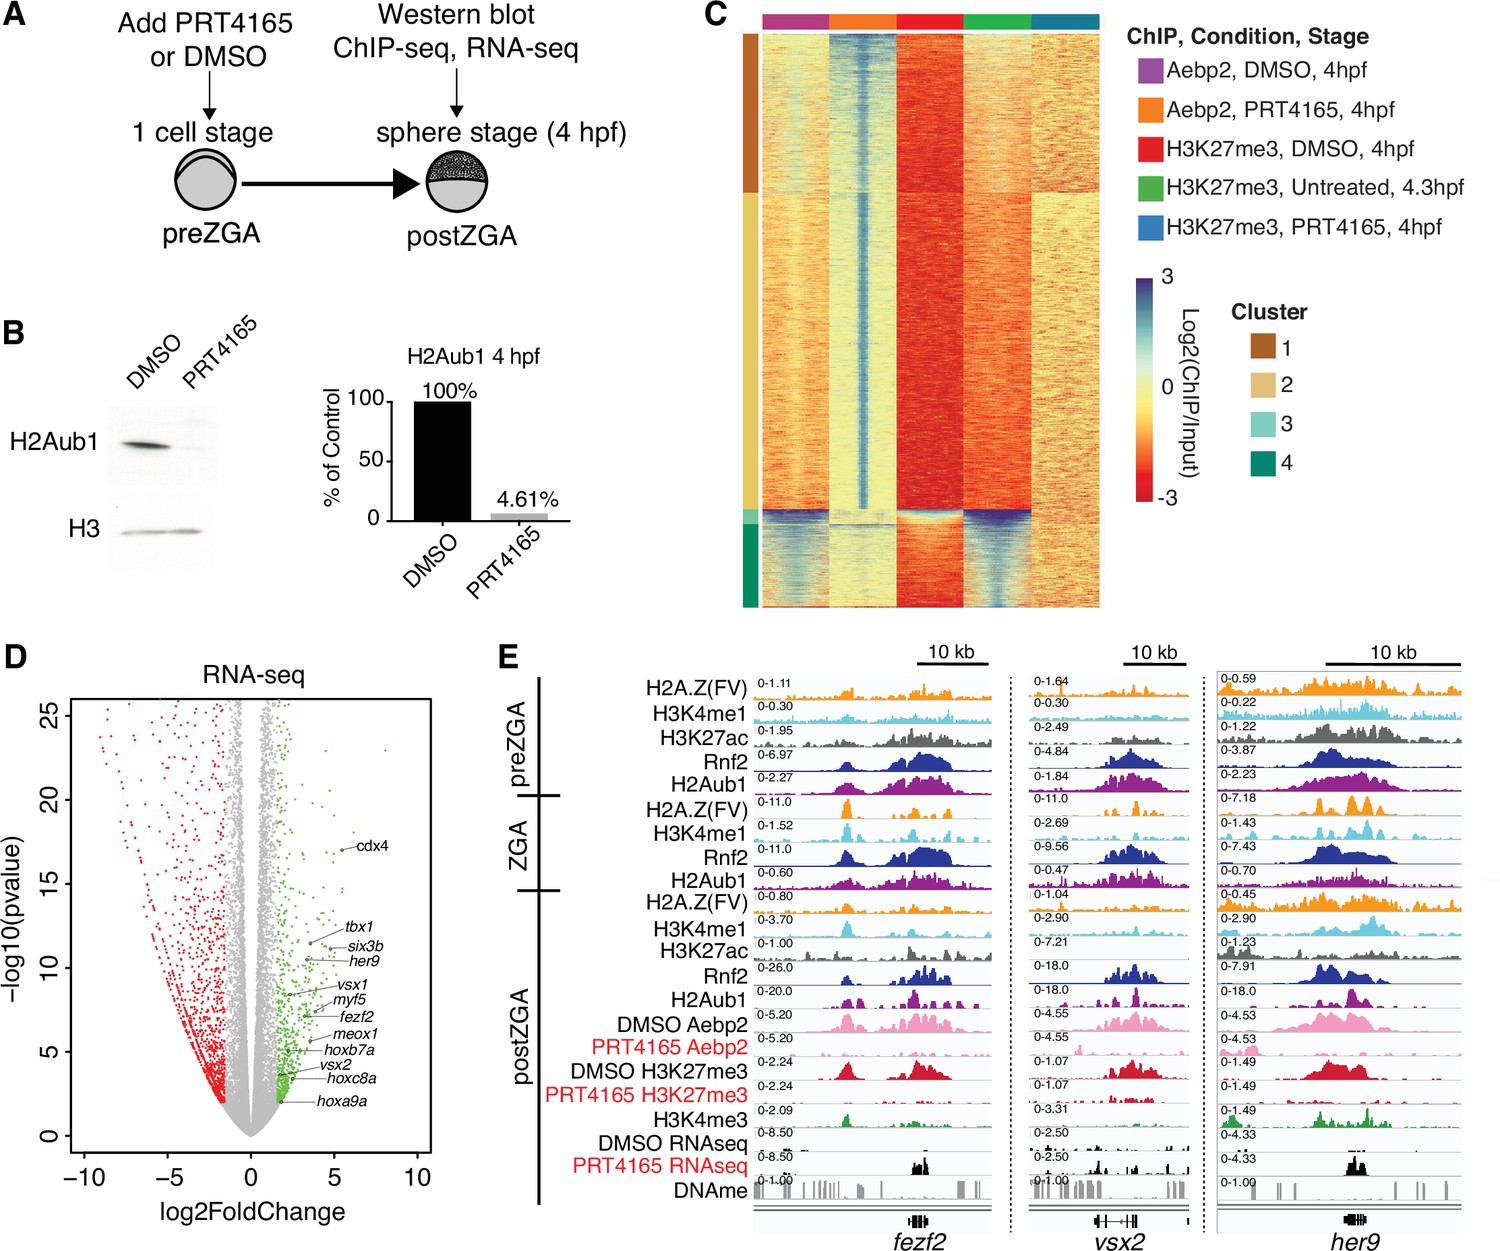
Catalytic activity of polycomb repressive complex 1 (PRC1) is required for aebp2 binding, H3K27me3 establishment, and transcriptional repression of developmental genes.
(A) Experimental design of drug treatments to inhibit Rnf2 activity. Embryos at the one-cell stage were added to media containing either PRT4165 (150 μM) or DMSO and raised until 4 hr post fertilization (hpf). (B) PRT4165 treatment of embryos confers bulk loss of H2Aub1 at 4 hpf. Left: Western blot for H2Aub1 in 4 hpf embryos treated with DMSO (vehicle) or 150 μM PRT4165 (Rnf2 inhibitor). Right: Quantification western blot in left panel. (C) Impact of Rnf2 inhibition on Aebp2 genomic localization and H3K27me3. K-means clustering of Aebp2 and H3K27me3 chromatin immunoprecipitation (ChIP)-seq enrichment at all loci with called peaks in any of the datasets plotted. Embryos were treated from the one-cell stage with either DMSO or 150 μM PRT4165 and harvested at 4 hpf for ChIP analysis. H3K27me3 ChIP-seq from untreated embryos at 4.3 hpf is plotted as a comparitor. (D) Impact of Rnf2 inhibition on gene expression. Volcano plot of RNA-seq data from PRT4165-treated vs. untreated embryos (4 hpf). Green and red data points signify transcripts with p-values < 0.01 and at least a 3-fold change (increase or decrease) in expression, respectively. Marquee upregulated genes encoding developmental transcription factors are labelled. (E) Genome browser screenshots of representative developmental genes which, upon Rnf2 inhibition, lose Aebp2 binding and H3K27me3 marking, and become transcriptionally active.
-
Figure 4—source data 1
Uncropped western blots for panel B.
- https://cdn.elifesciences.org/articles/67738/elife-67738-fig4-data1-v2.zip
Figure 4—figure supplement 1
Replicate structures of chromatin immunoprecipitation (ChIP)-seq and RNA-seq experiments involving drug treatments.
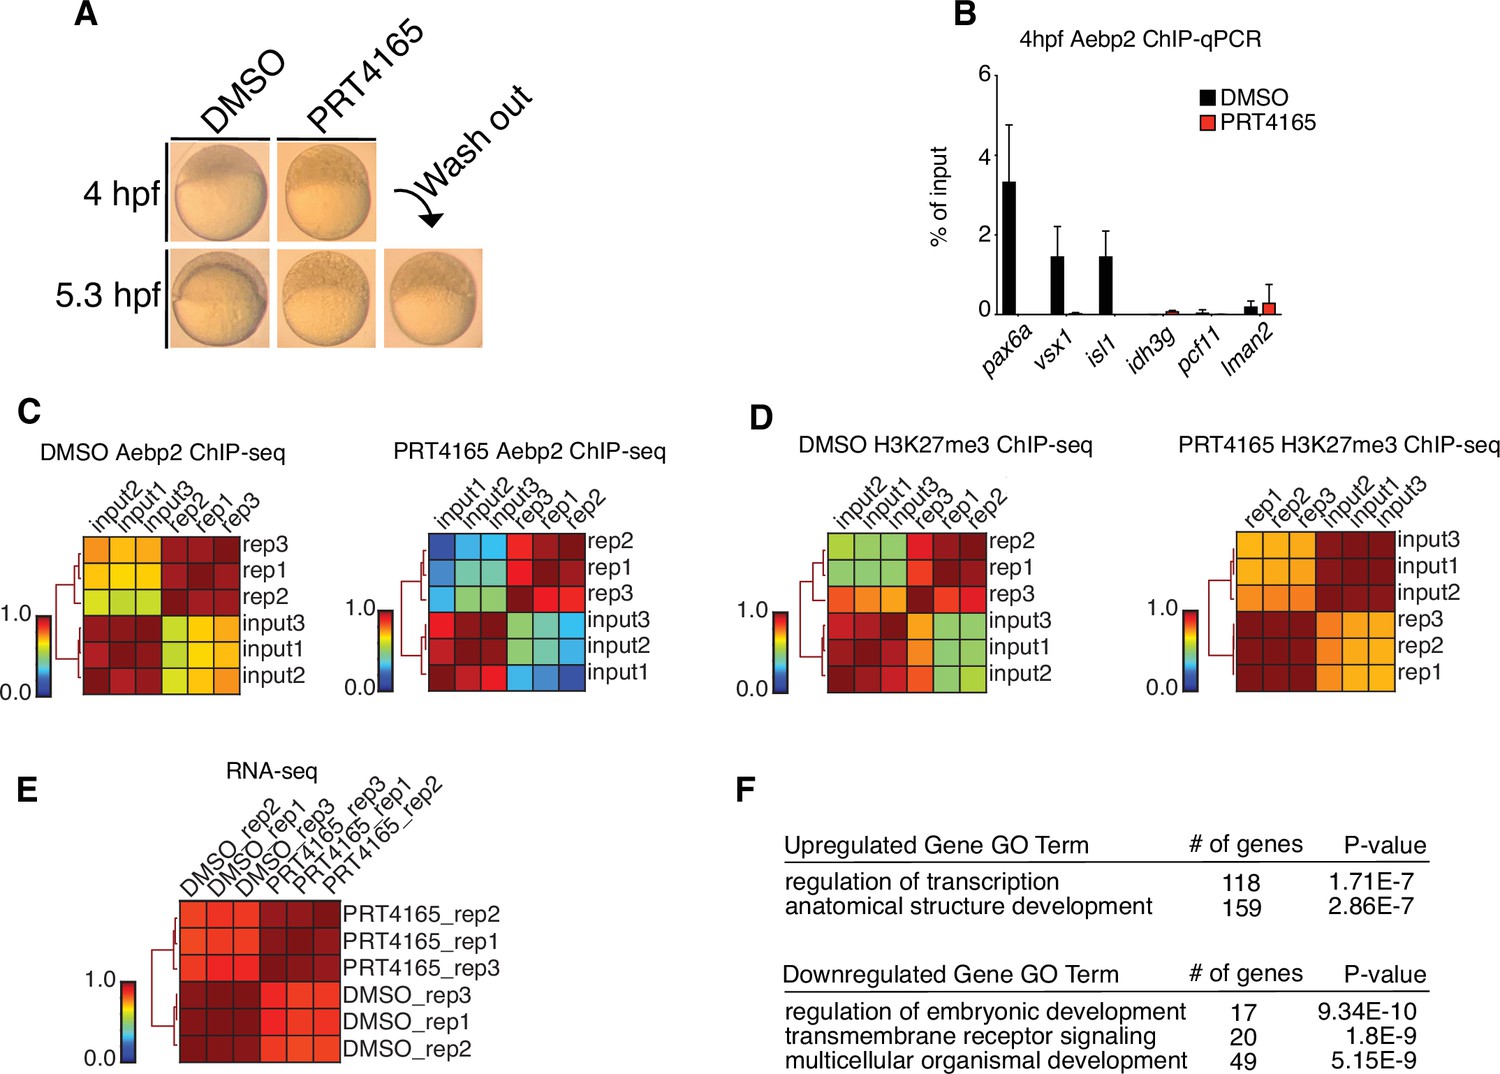
(A) Treatment of zebrafish embryos with PRT4165 (150 μM) beginning at the one-cell stage results in developmental arrest at 4 hr post fertilization (hpf). Removal of PRT4165 at 4 hpf failed to restore normal developmental progression to embryos (lower right, ‘wash out’). (B) Aebp2 ChIP-qPCR in postzygotic genome activation (postZGA) (4 hpf) embryos treated with DMSO (black bars) or PRT4165 (150 μM, red bars). Binding of Aebp2 to developmental gene promoters (pax6a, vsx1, isl1) is lost upon PRC1 inhibition. (C) Genome-wide correlation matrices of Aebp2 ChIP-seq replicates and input from postZGA (4 hpf) zebrafish embryos treated with DMSO (left) or PRT4165 (150 μM, right). Heatmap matrices display Pearson correlation coefficients. (D) Genome-wide correlation matrices of H3K27me3 ChIP-seq replicates and input from postZGA (4 hpf) zebrafish embryos treated with DMSO or PRT4165 (150 μM, right). Heatmap matrices display Pearson correlation coefficients. (E) Genome-wide correlation matrix of RNA-seq replicates from postZGA (4 hpf) zebrafish embryos treated with DMSO or PRT4165. Heatmap matrix displays Pearson correlation coefficients. (F) GO-terms associated with upregulated and downregulated transcripts depicted in Figure 4E. GO-term analysis was performed with DAVID (Huang et al., 2009).
Figure 4—figure supplement 2
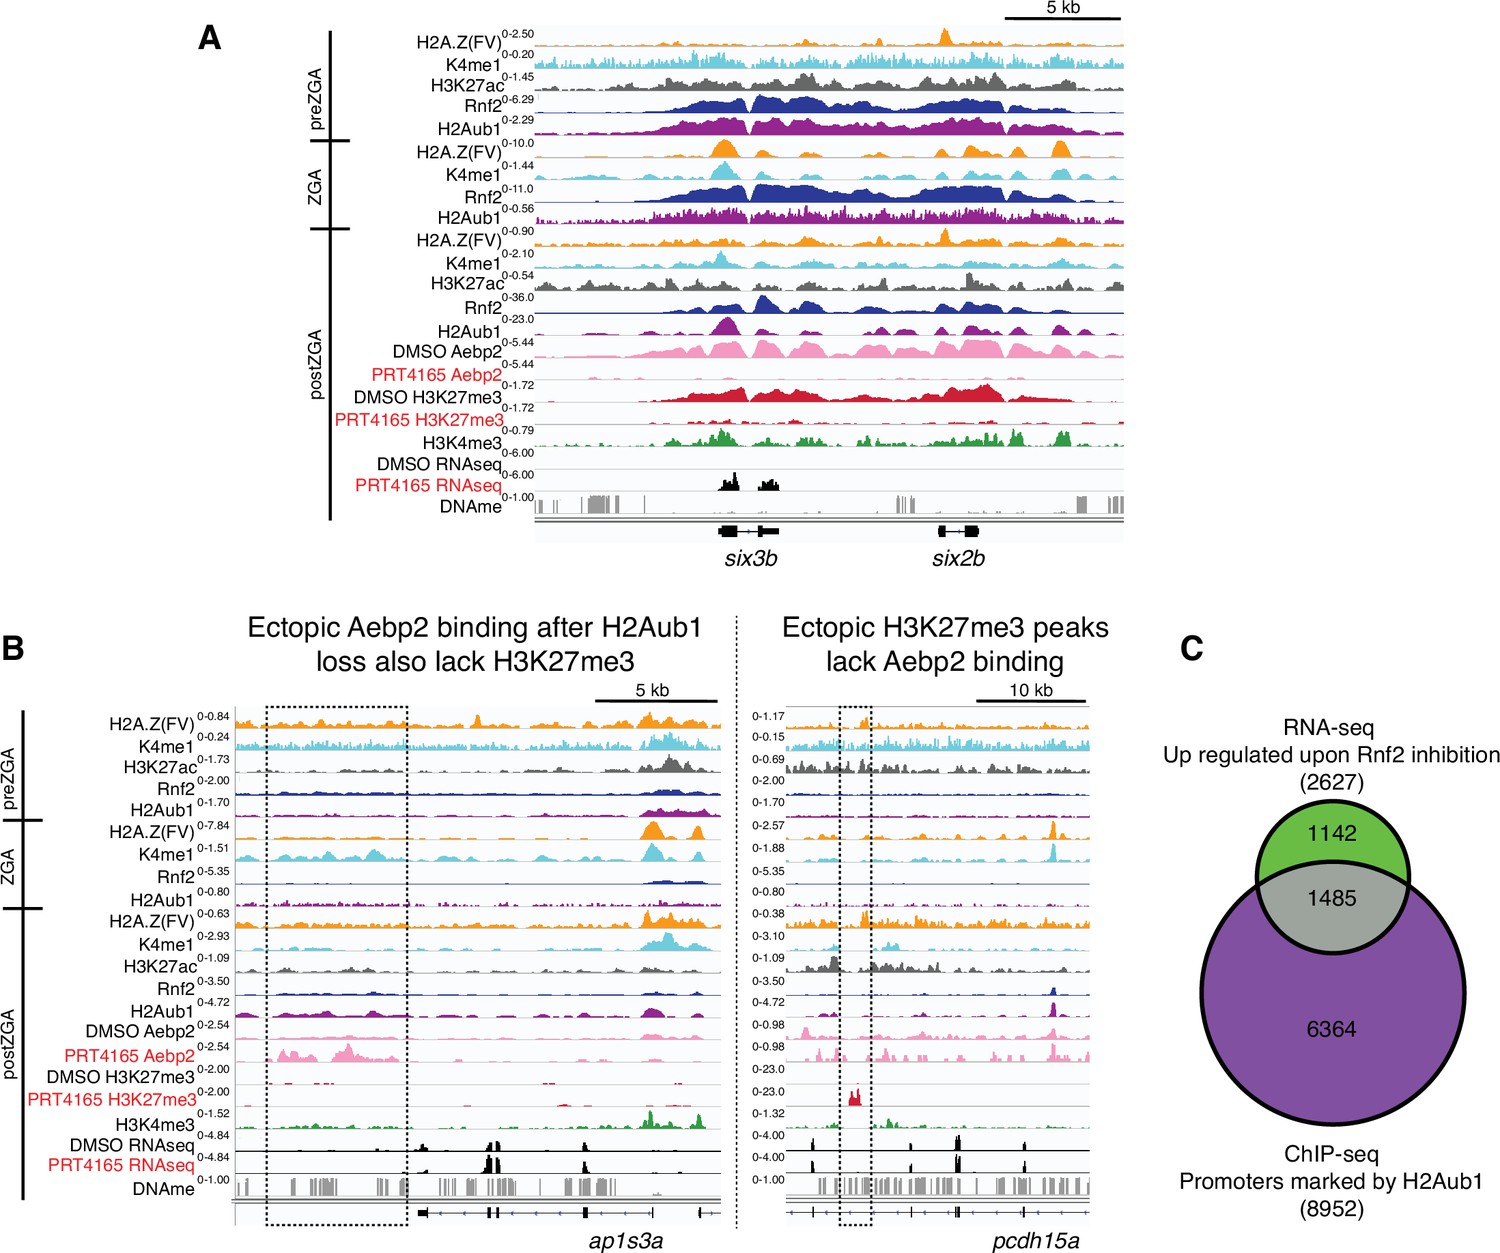
Loss of H2Aub1 results in disrupted Aebp2 localization, H3K27me3 marking, and transcriptional de-repression.
(A) Genome browser screenshots of representative de-repressed genes upon PRC1 inhibition. Both six3b and six2b are bound by Rnf2 and marked by H2Aub1 from prezygotic genome activation (preZGA) onward. At postZGA these genes normally attract binding by Aebp2 and acquire H3K27me3. Inhibition of Rnf2 (via PRT4165) causes failed Aebp2 binding, and prevention of H3K27me3 establishment. Notably, six3b is precociously expressed upon loss of H2Aub1. (B) Genome browser screenshots of representative loci that gain ectopic Aebp2 binding (left) or H3K27me3 marking (right) upon PRC1 inhibition. Ectopic binding events for Aebp2 or H3K27me3 appear to be mutually exclusive. Dotted boxes denote region of ectopic binding or marking by Aebp2 or H3K27me3, respectively. (C) Approximately 16.6% of genes normally silenced by H2Aub1 promoter marking are transcriptionally upregulated upon inhibition of Rnf2. Venn diagram displays the overlap between the gene promoters normally marked by H2Aub1 and protein coding genes that are transcriptionally upregulated (p-value < 0.001, >1.5-fold change) after Rnf2 inhibition. Here, H2Aub1 marked promoters are defined as regions ±2 Kb from transcription start sites and having peak(s) called by MACS2 (Feng et al., 2012) (q-value cutoff 0.01) of H2Aub1 from 4.3 hpf H2Aub1 ChIP-seq.
Figure 4—figure supplement 3
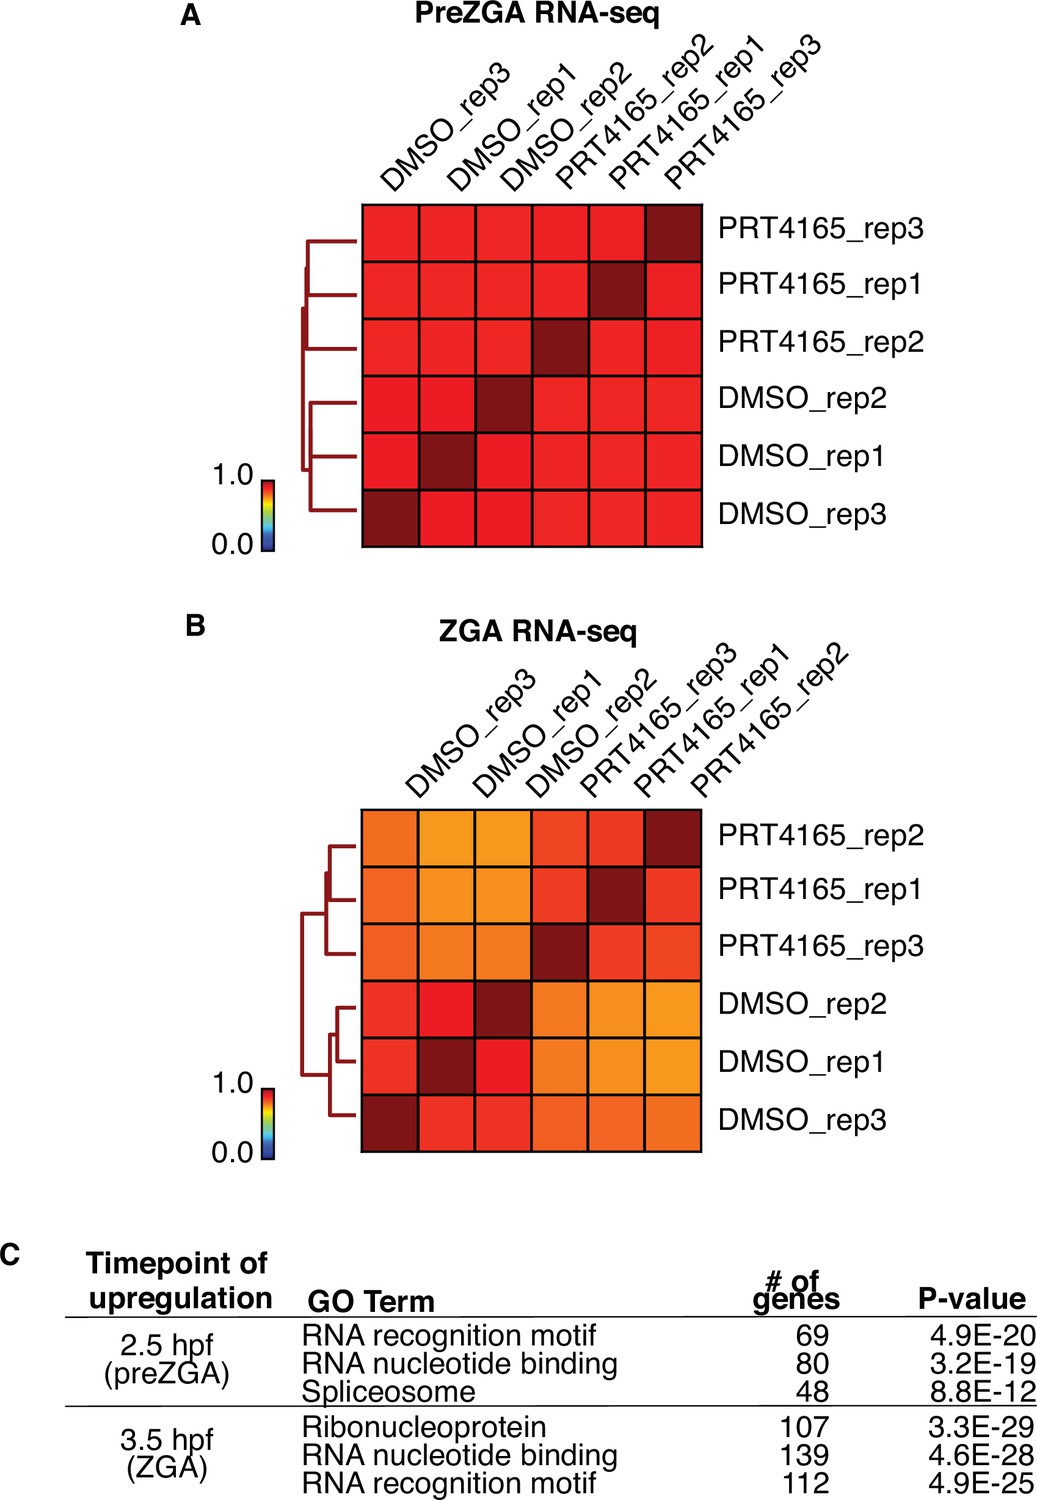
RNAseq of PRT4165-treated embryos at prezygotic genome activation (preZGA) and ZGA.
(A) Genome-wide correlation matrix of RNA-seq replicates from preZGA (2.5 hr post fertilization [hpf]) zebrafish embryos treated with DMSO or PRT4165. Heatmap matrix displays Spearman correlation coefficients. (B) Genome-wide correlation matrix of RNA-seq replicates from ZGA (3.5 hpf) zebrafish embryos treated with DMSO or PRT4165. Heatmap matrix displays Spearman correlation coefficients. (C) Top three enriched GO-term categories from genes upregulated 1.5-fold and with a p-value less than or equal to 0.01 at preZGA or ZGA. GO-term analysis was performed with DAVID (Huang et al., 2009).
Figure 5
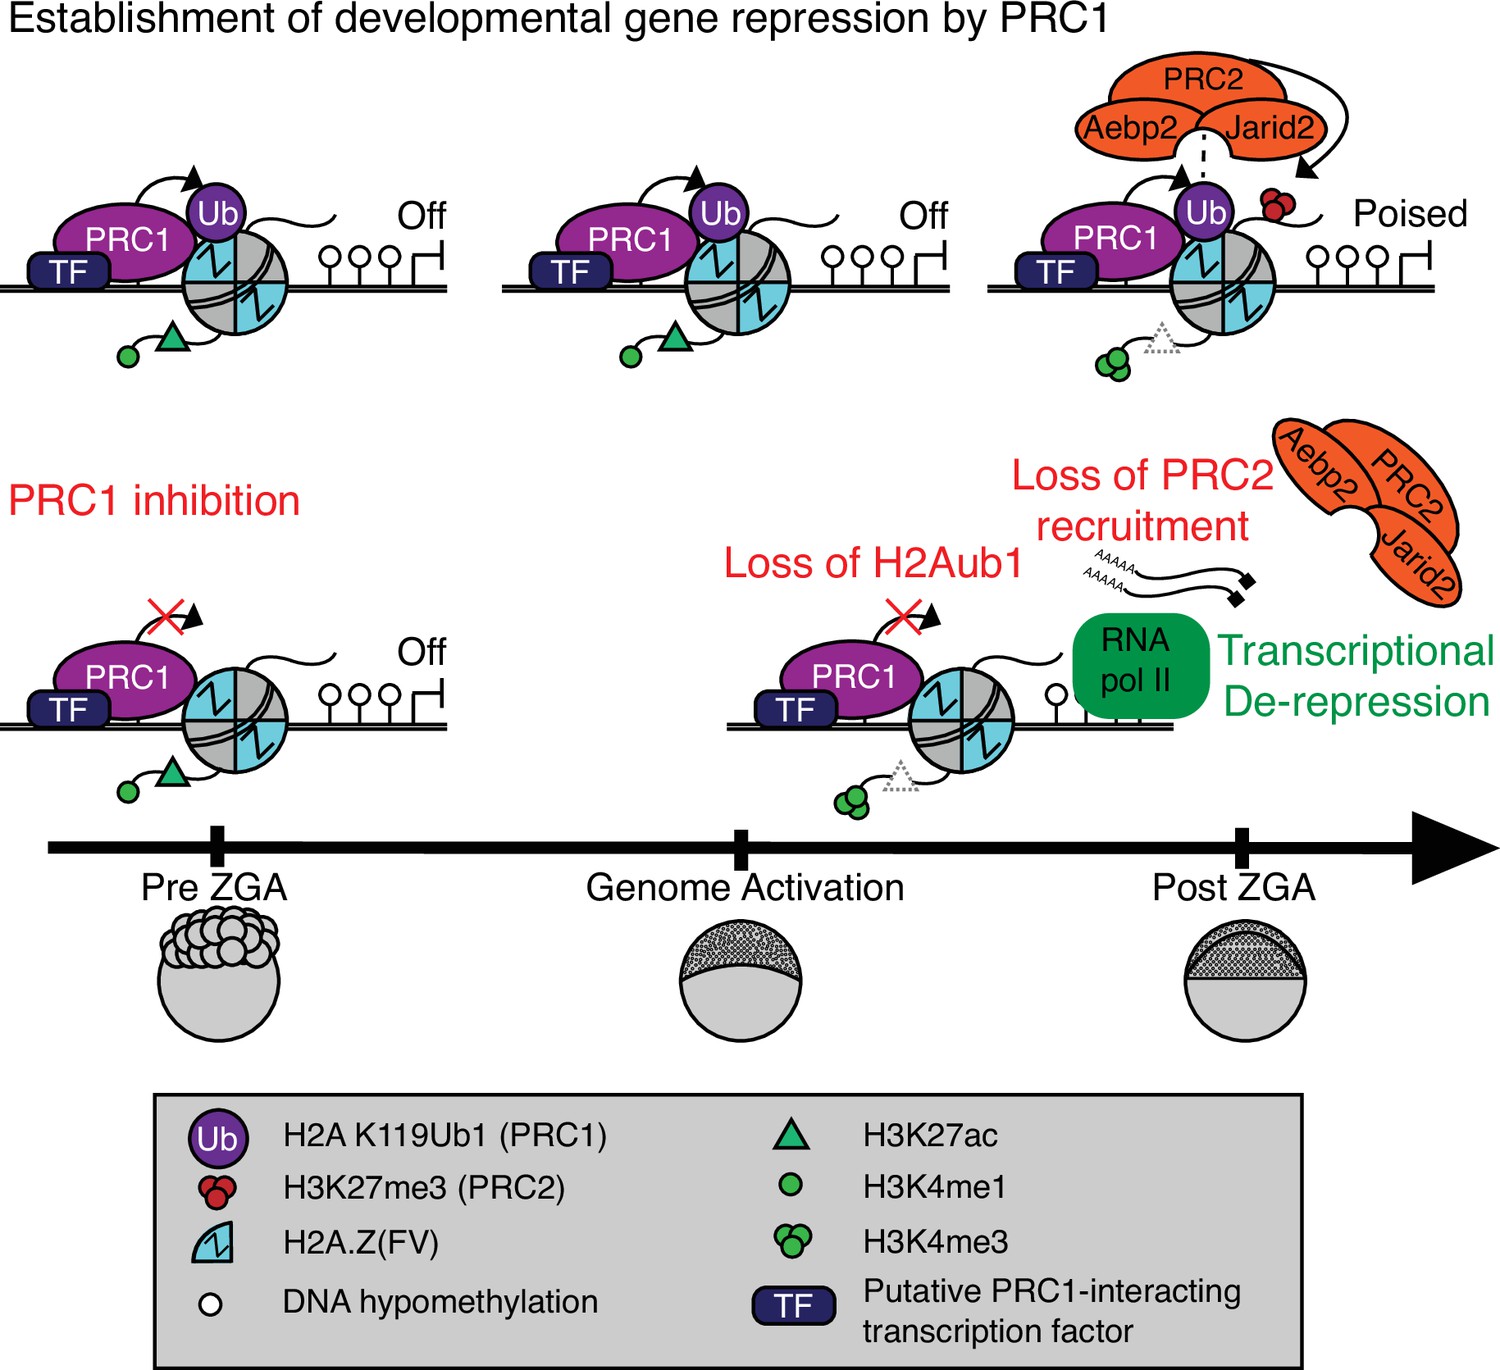
Model for polycomb-mediated establishment of developmental gene silencing during zebrafish embryogenesis.
Prior to zygotic genome activation (ZGA), Rnf2-PRC1 is recruited by transcription factors (TFs) to promoters (shown) and enhancers (not shown) of developmental genes bearing Placeholder nucleosomes (H2A.Z(FV), H3K4me1, H3K27ac). Rnf2-PRC1 deposition of H2Aub1 recruits Aebp2-PRC2 to catalyze H3K27me3 addition. H2Aub1 ablation (via Rnf2 inhibition) eliminates Aebp2-PRC2 recruitment and prevents H3K27me3 establishment. Notably, H2Aub1 loss causes precocious transcription of certain developmental genes after ZGA, identifying H2Aub1 as a critical component of silencing at ZGA.
Author response image 1
Tables
Key resources table
| Reagent type (species) or resource | Designation | Source or reference | Identifiers | Additional information |
|---|---|---|---|---|
| Gene (Danio rerio) | Zebrafish Genome | UCSC | Zv10 | |
| Antibody | Anti-H2Aub1(rabbit monoclonal) | Cell Signaling Technology | Cat# 8240; RRID:AB_10891618 | WB (1:1000)ChIP (1:100)IF (1:500) |
| Antibody | Anti-rnf2(rabbit monoclonal) | Cell Signaling Technology | Cat# 5694; RRID:AB_10705604 | (1:100) |
| Antibody | Anti-H2A.Z(rabbit polyclonal) | Active Motif | Cat# 39113; RRID: AB_2615081 | (5 μl) |
| Antibody | Anti-H3K4me1(rabbit polyclonal) | Active Motif | Cat# 39297; RRID: AB_2615075 | (10 μl) |
| Antibody | Anti-aebp2(rabbit monoclonal) | Cell Signaling Technology | Cat# 14,129 S; RRID: AB_2798398 | ChIP (1:100)IF (1:500) |
| Antibody | Anti-H3K27me3(rabbit polyclonal) | Active Motif | Cat# 39155; RRID: AB_2561020 | ChIP (5 μl)IF (1:500) |
| Antibody | Anti-H3(mouse monoclonal) | Active Motif | Cat# 39763; RRID: AB_2650522 | (1:2000) |
| Antibody | Anti-Jarid2rabbit polyclonal) | Novus | Cat# NB100-2214; RRID:AB10000529 | (5 μl) |
| Cell line (Danio melanogaster) | Cell line S2: S2-DRSC | ATCC | Cat# CRL-1963 RRID:CVCL_Z232 | |
| Chemical compound, drug | PRT4165 | Tocris | Cat# 5047 | |
| Commercial assay or kit | NEBNext ChIP-Seq Library Prep Master Mix Set for Illumina | New England Biolabs | Cat# E6240 | . |
| Commercial assay or kit | Illumina TruSeq Stranded mRNA Library Prep Kit | Illumina | Cat# RS-122–2101, RS-122–2102 | |
| Software, algorithm | Novoalign | Novocraft | RRID:SCR_014818 | |
| Software, algorithm | Samtools | Li et al., 2009 | RRID:SCR_002105 | |
| Software, algorithm | deepTools | Ramírez et al., 2016 | RRID:SCR_016366 | |
| Software, algorithm | MACS2 | Zhang et al., 2008 | RRID:SCR_013291 | |
| Software, algorithm | UCSC Exe Utilities | UCSC Genome Browser | http://hgdownload.soe.ucsc.edu/downloads.html#source_downloads | |
| Software, algorithm | IGV | Thorvaldsdóttir et al., 2012 | RRID:SCR_011793 | |
| Software, algorithm | DAVID | Huang et al., 2009 | https://david.ncifcrf.gov | |
| Software, algorithm | R | R Development Core Team, 2020 | RRID:SCR_001905 | |
| Software, algorithm | R Studio | RStudio Team, 2021 | RRID:SCR_000432 | |
| Software, algorithm | Chipseekr | Yu et al., 2015 | https://www.bioconductor.org/packages/release/bioc/html/ChIPseeker.html | |
| Software, algorithm | Bio-ToolBox | Tim Parnell of the Huntsman Cancer Institute | Parnell, 2021b; https://github.com/tjparnell/biotoolbox | |
| Software, algorithm | Multi-Replica Macs ChIPSeq Wrapper | Tim Parnell of the Huntsman Cancer Institute | Parnell, 2021a; https://github.com/HuntsmanCancerInstitute/MultiRepMacsChIPSeq | |
| Software, algorithm | HOMER | Heinz et al., 2010 | RRID:SCR_010881 | |
| Software, algorithm | STAR | Dobin et al., 2013 | RRID:SCR_015899 | |
| Software, algorithm | featureCounts | Liao et al., 2013 | RRID:SCR_012919 | |
| Software, algorithm | DESeq | Anders and Huber, 2010 | RRID:SCR_000154 |
Table 1
Oligonucleotide sequences used for ChIP-qPCR for amplifying promoter regions.
| Target promoter | Direction | Sequence (5’→3’) |
|---|---|---|
| pax6a | Forward | ctccggatccgaatcacaaaactagtcc |
| pax6a | Reverse | caaaggggtttgcaatctctcacaacc |
| vsx1 | Forward | cccgtcatggtggcagtttc |
| vsx1 | Reverse | gacagtgggatgatctgctggt |
| isl1 | Forward | gtctcccatgtcaagaaagtaaggcg |
| isl1 | Reverse | gccactttcccaccttcacagat |
| idh3g | Forward | cagcaagcgaacactgaccttgt |
| idh3g | Reverse | gcagttgggaaatacagcaaaggtacg |
| pcf11 | Forward | cgatcgtttcagagcagccaataag |
| pcf11 | Reverse | gtccgtcgtactttagcagagactg |
| lman2 | Forward | cccgtccgttatatctgaatatacggaag |
| lman2 | Reverse | ctcgtaaaatgccggtgtgtcac |
Additional files
Download links
A two-part list of links to download the article, or parts of the article, in various formats.
Downloads (link to download the article as PDF)
Open citations (links to open the citations from this article in various online reference manager services)
Cite this article (links to download the citations from this article in formats compatible with various reference manager tools)
Establishment of developmental gene silencing by ordered polycomb complex recruitment in early zebrafish embryos
eLife 11:e67738.
https://doi.org/10.7554/eLife.67738


