Bacterial–fungal interactions in the neonatal gut influence asthma outcomes later in life
- Department of Microbiology and Immunology, University of British Columbia, Canada
- Michael Smith Laboratories, University of British Columbia, Canada
- Children’s Hospital Research Institute of Manitoba and Department of Pediatrics and Child Health, University of Manitoba, Canada
- Department of Pediatrics, University of Alberta, Canada
- School of Public Health, University of Alberta, Canada
- The Hospital for Sick Children, Canada
- Department of Medicine, McMaster University, Canada
- Department of Pediatrics, University of Toronto, Canada
- Department of Biomedical Engineering, University of British Columbia, Canada
- Department of Medical Genetics University of British Columbia, Canada
- Department of Pediatrics, University of British Columbia, Canada
- Department of Biochemistry and Molecular Biology, University of British Columbia, Canada
Figures
Figure 1
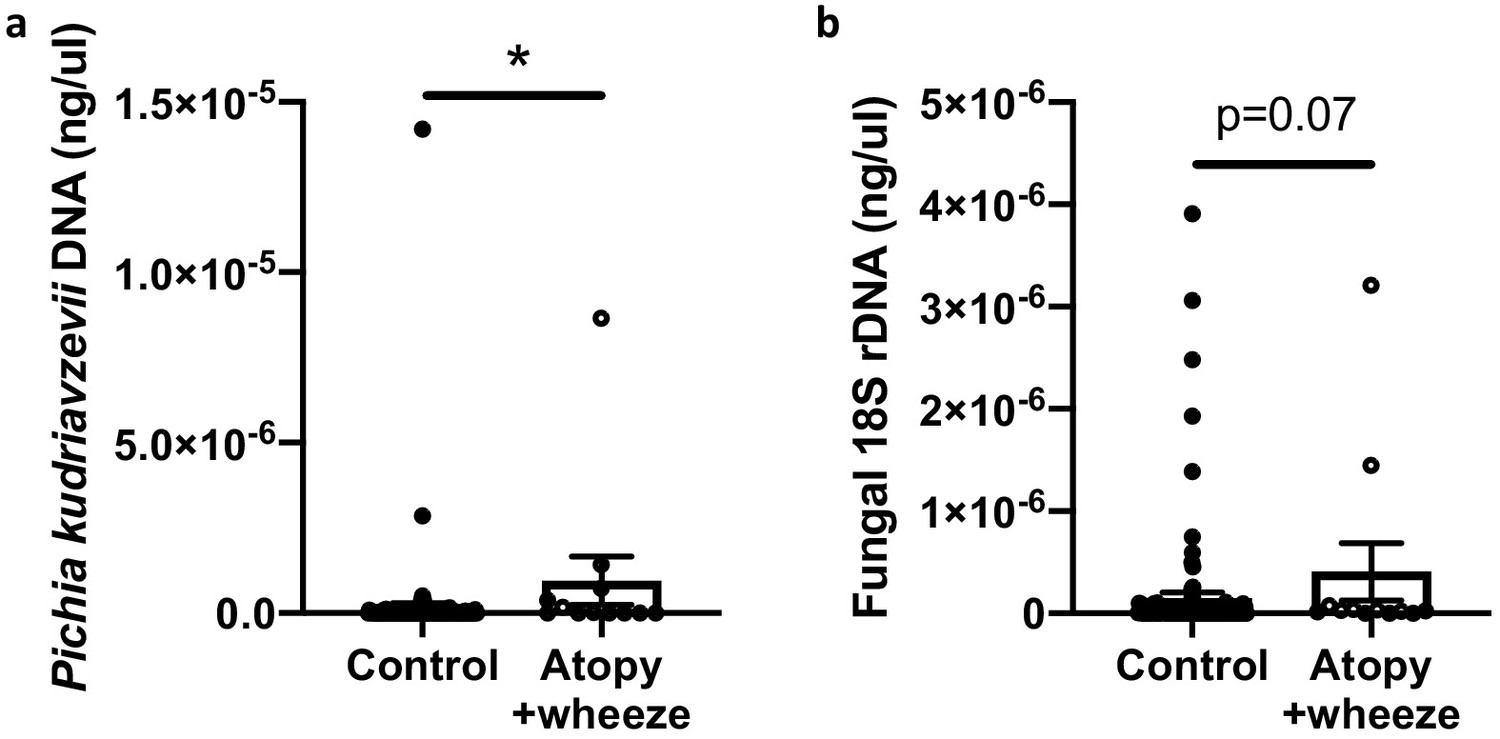
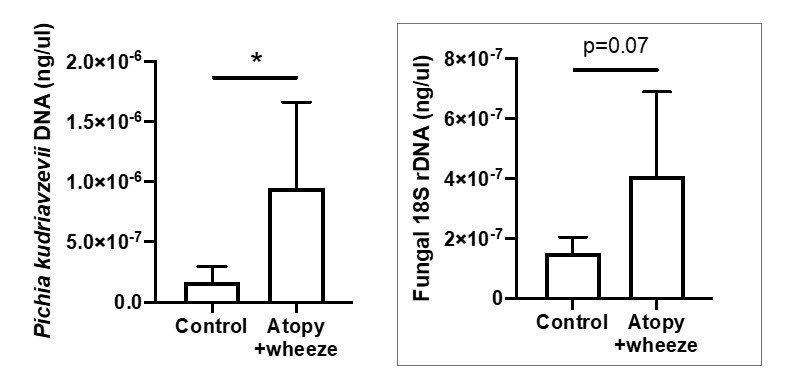
Canadian infants at high risk of asthma demonstrate increased levels of fecal fungi.
Quantitative (q) PCR quantification (standard curve method) of DNA in feces collected at 3 months of age from infants in the CHILD Cohort Study (control subjects, n = 115; Atopy+Wheeze at age 5 years, n = 12). (a) qPCR quantification of Pichia kudriavzevii DNA. (b) qPCR quantification of all fungal 18S rRNA gene copies. Error bars represent the standard error of the mean and p-values were calculated using a Mann–Whitney test in GraphPad Prism; *p<0.05.
-
Figure 1—source data 1
qPCR quantification of Pichia kudriavzevii DNA in CHILD Cohort participants.
- https://cdn.elifesciences.org/articles/67740/elife-67740-fig1-data1-v2.zip
-
Figure 1—source data 2
qPCR quantification of fungal DNA in CHILD Cohort participants.
- https://cdn.elifesciences.org/articles/67740/elife-67740-fig1-data2-v2.zip
Figure 2 with 1 supplement
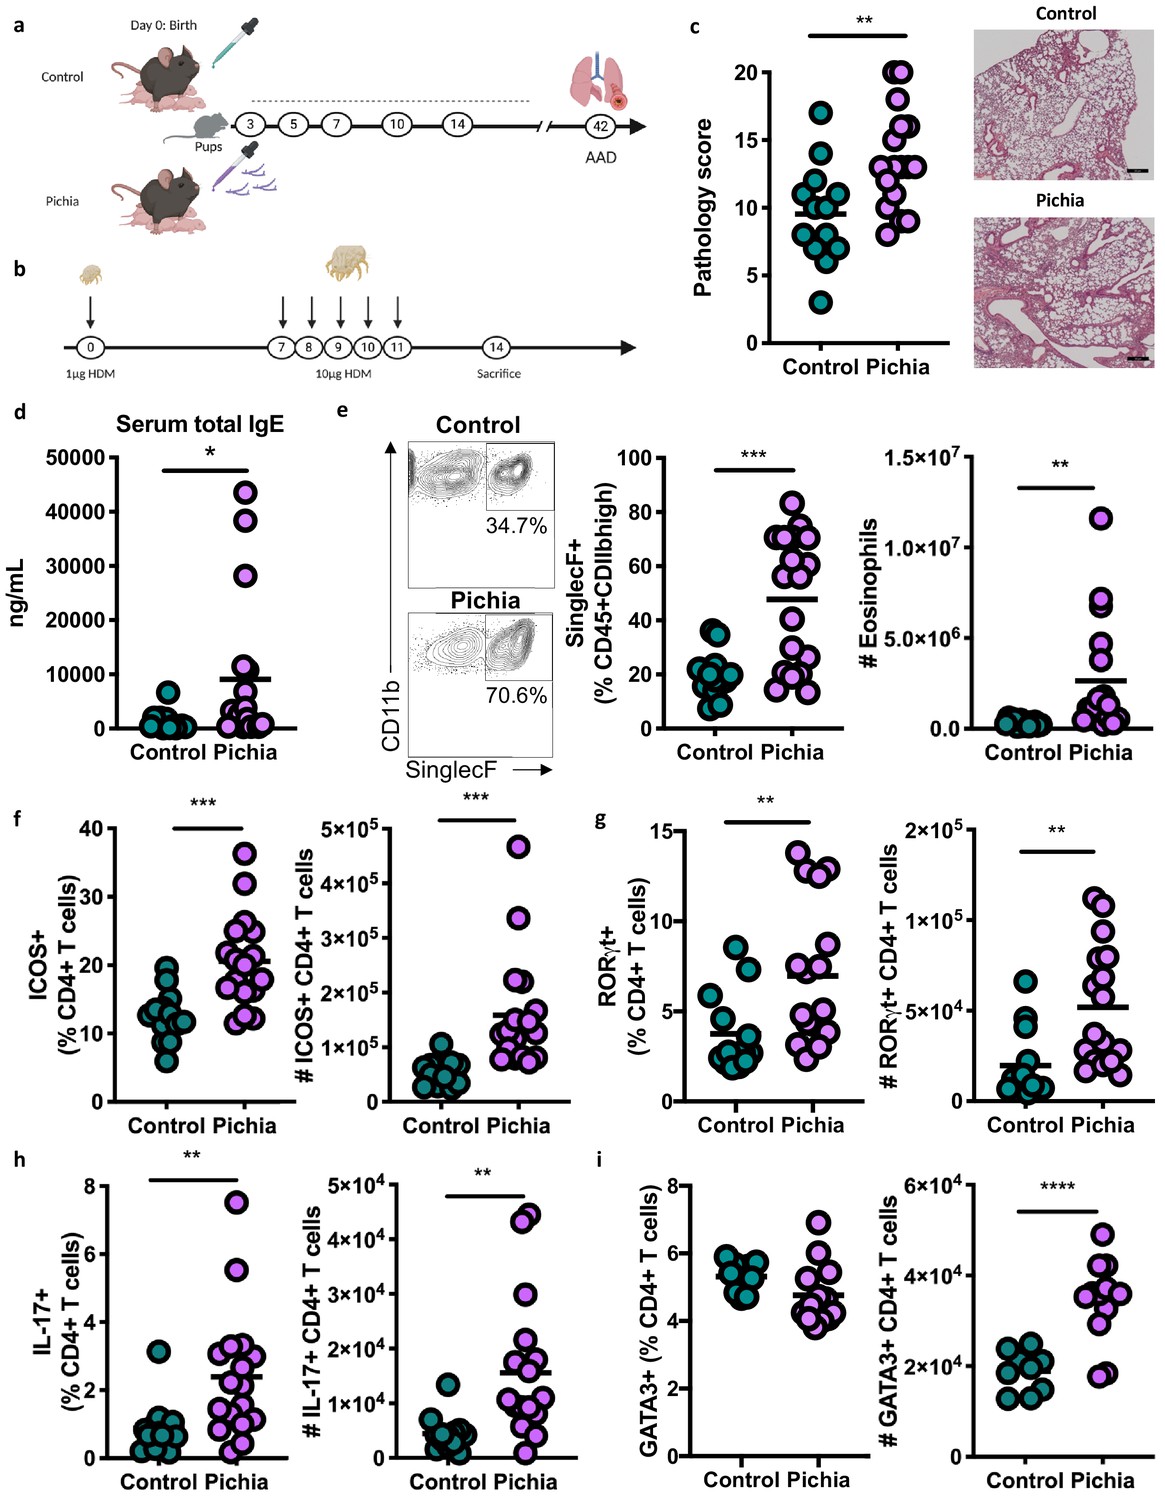
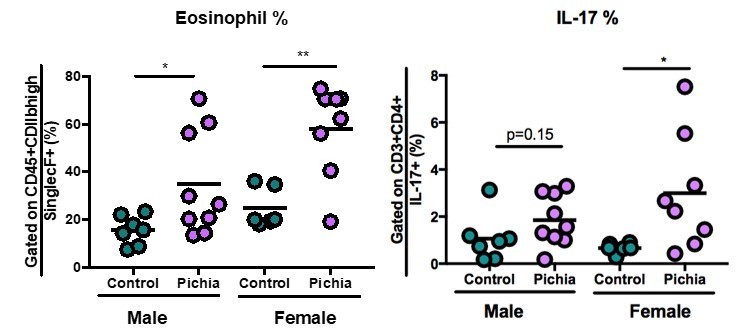
Mice neonatally exposed to Pichia kudriavzevii demonstrate increased inflammatory responses during allergic airway disease later in life.
(a) Experimental procedure for neonatal exposure to P. kudriavzevii (Pichia; numbers indicate days of life) and (b) house dust mite (HDM) model of allergic airway disease (AAD). Dashed lines indicate the period of neonatal exposure in the pups. (c–i) Control and Pichia mice were born to dams treated with either PBS or yeast cells for 2 weeks after giving birth, respectively, and intranasally sensitized and challenged with HDM extract. (c) Lung pathology scores (left; 4–20) and representative images (right; 4× objective). (d) ELISA detection of serum IgE. (e) Representative eosinophil staining (left; pre-gated on single CD45+CD11 bhigh cells), frequency (middle), and total numbers of eosinophils (right) in the lung. (f) Frequencies (left) and numbers (right) of ICOS+ T cells (pre-gated on CD3+CD4+ cells) in the lung. (g) Frequencies (left) and numbers (right) of RORγthigh T cells (pre-gated on CD3+CD4+ cells) in the lung. (h) Frequencies (left) and numbers (right) of IL-17+T cells (pre-gated on CD3+CD4+ cells) in the lung. (i) Frequencies (left) and numbers (right) of GATA3+T cells (pre-gated on CD3+CD4+ cells) in the lung. Data in (c–h) are pooled from three independent experiments each showing the same trends (control n = 13, Pichia n = 17). Data in (i) are pooled from two independent experiments each showing the same trends (control n = 9, Pichia n = 13). Dots represent individual mice and lines indicate the group mean. *p<0.05, **p<0.01, ***p<0.001; unpaired two-tailed Student’s t-test with Welch’s correction.
-
Figure 2—source data 1
Neonatal exposure lung cell counts.
- https://cdn.elifesciences.org/articles/67740/elife-67740-fig2-data1-v2.xlsx
-
Figure 2—source data 2
Neonatal exposure serum IgE.
- https://cdn.elifesciences.org/articles/67740/elife-67740-fig2-data2-v2.xlsx
-
Figure 2—source data 3
Neonatal exposure lung histology scoring.
- https://cdn.elifesciences.org/articles/67740/elife-67740-fig2-data3-v2.xlsx
-
Figure 2—source data 4
Neonatal exposure lung histology.
- https://cdn.elifesciences.org/articles/67740/elife-67740-fig2-data4-v2.xlsx
-
Figure 2—source data 5
Neonatal exposure lung pathology.
- https://cdn.elifesciences.org/articles/67740/elife-67740-fig2-data5-v2.xlsx
Figure 2—figure supplement 1
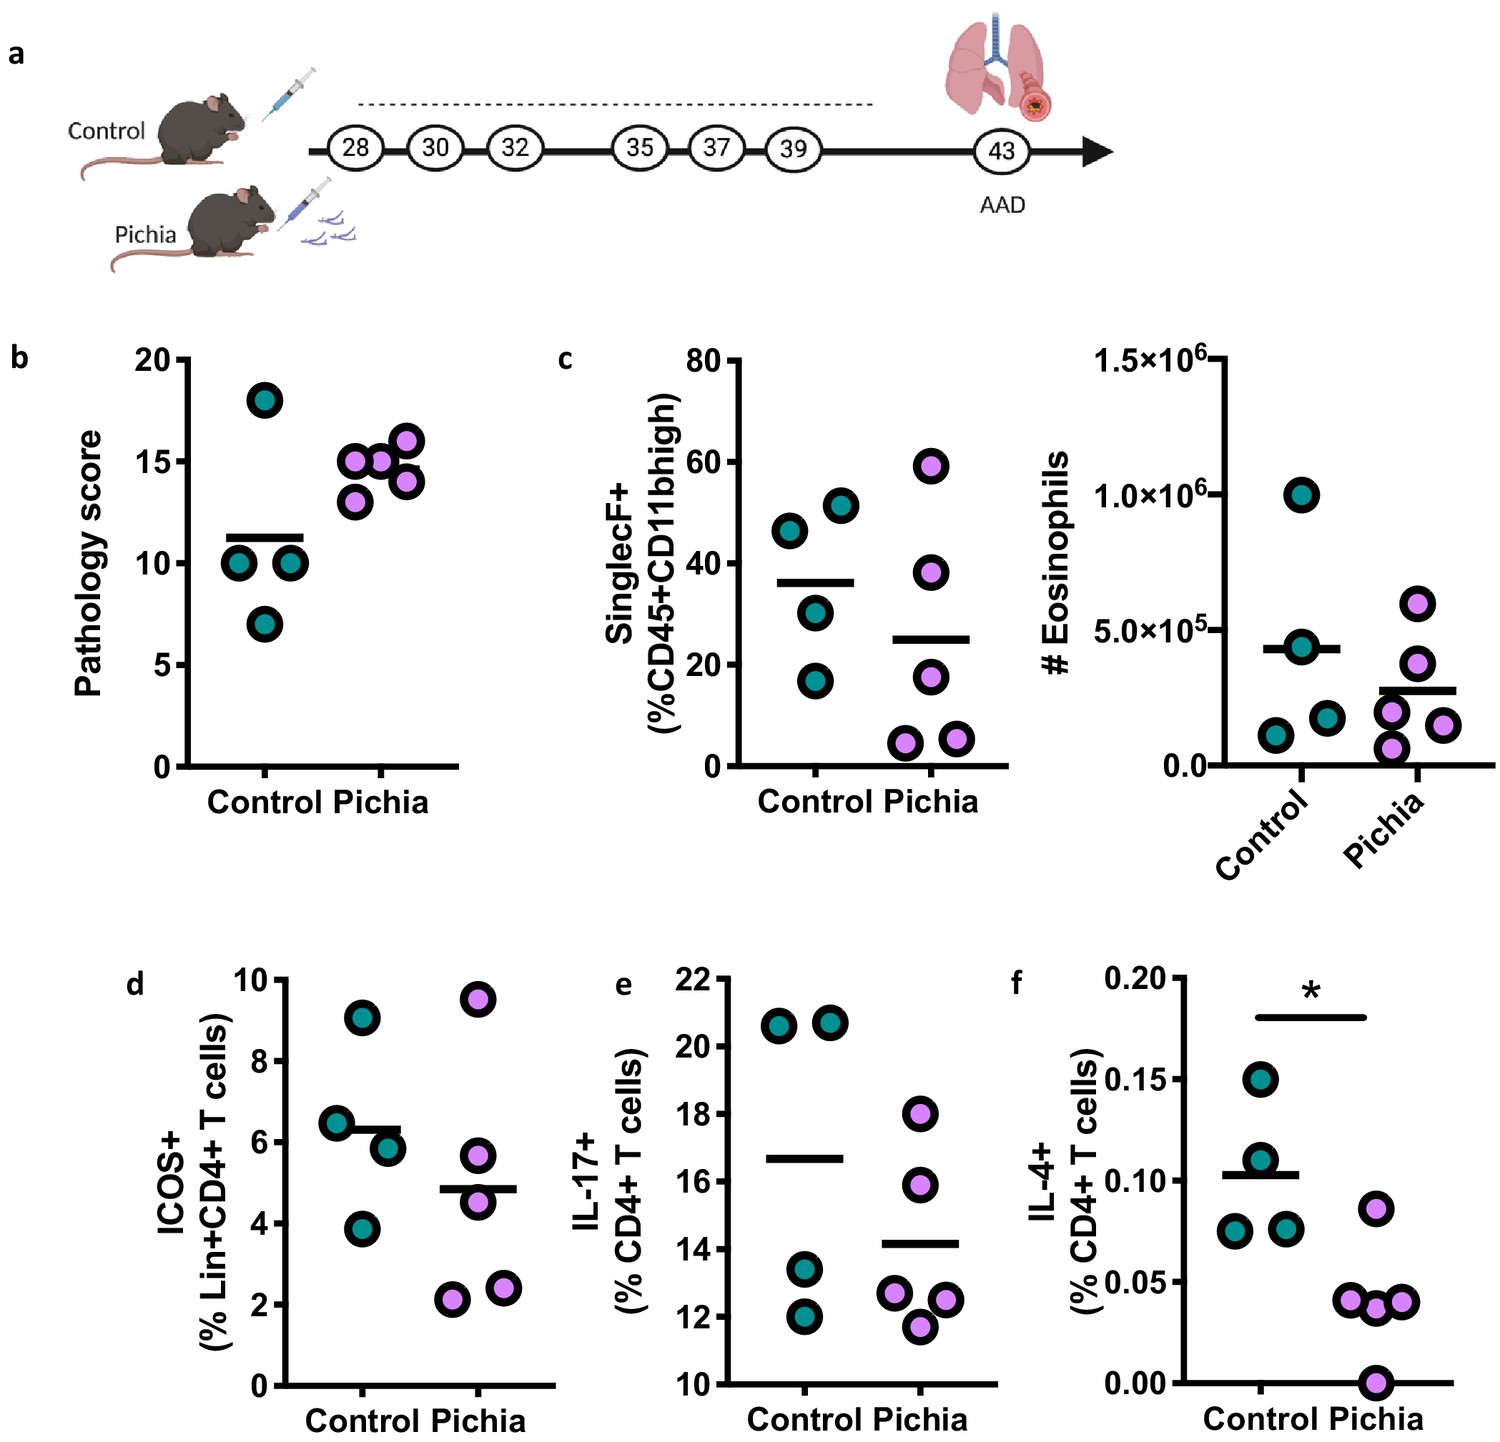
Adolescent exposure to Pichia kudriavzevii does not alter inflammatory responses during allergic airway disease later in life.
(a) Experimental procedure for adolescent exposure to P. kudriavzevii (Pichia; numbers indicate days of life) and house dust mite (HDM) model of allergic airway disease (AAD). (b–d) Control (n = 4) and Pichia (n = 5) mice were exposed to either PBS or yeast cells, respectively, via oral gavage for 2 weeks beginning at 4 weeks of age (day 28 of life) and intranasally sensitized and challenged with HDM extract according to the protocol in Figure 2b. Dashed lines indicate the period of fungal exposure. (b) Lung pathology scores (4–20). (c) Frequencies (left) of SinglecF+ cells (pre-gated on CD45+CDllbhigh single cells) and total numbers of eosinophils (right) in the lung. (d) Frequencies (left) of ICOS+ T cells (pre-gated on Lineage+CD3+CD4+ cells) in the lung. (e) Frequencies (left) of IL-17+T cells (pre-gated on CD3+CD4+ cells) in the lung. (f) Frequencies (left) of IL-4+T cells (pre-gated on CD3+CD4+ cells) in the lung. Dots represent individual mice and lines indicate the group mean. All results are not significant unless otherwise indicated. *p<0.05; unpaired two-tailed Student’s t-test with Welch’s correction.
-
Figure 2—figure supplement 1—source data 1
Adolescent exposure lung cell counts.
- https://cdn.elifesciences.org/articles/67740/elife-67740-fig2-figsupp1-data1-v2.xlsx
-
Figure 2—figure supplement 1—source data 2
Adolescent exposure histology scoring.
- https://cdn.elifesciences.org/articles/67740/elife-67740-fig2-figsupp1-data2-v2.xlsx
Figure 3 with 4 supplements
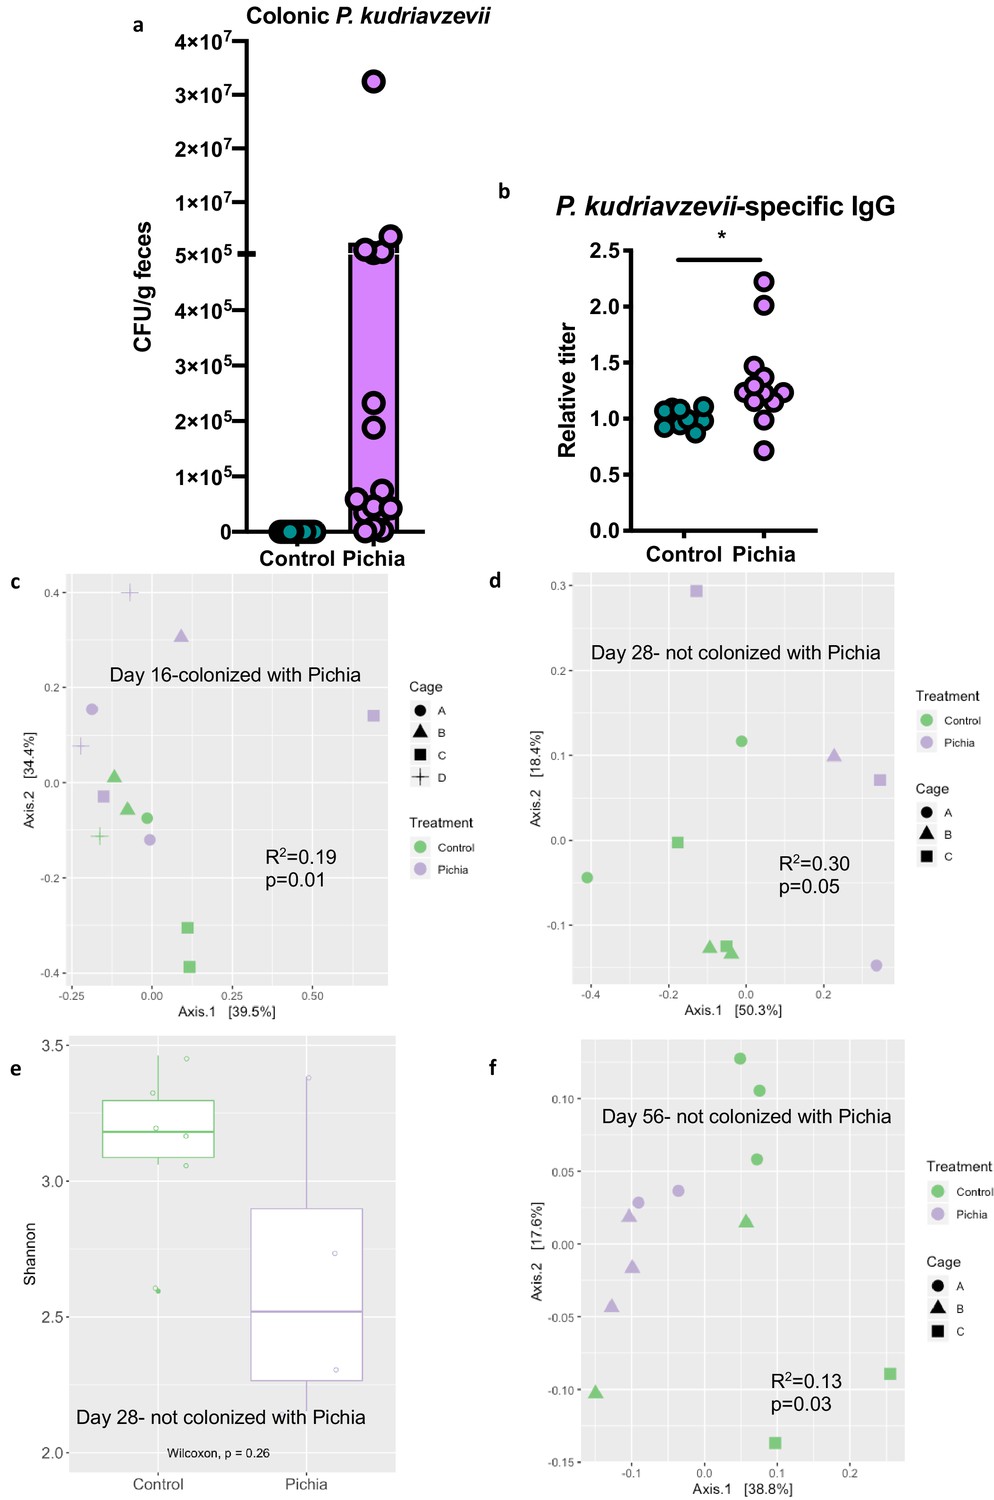
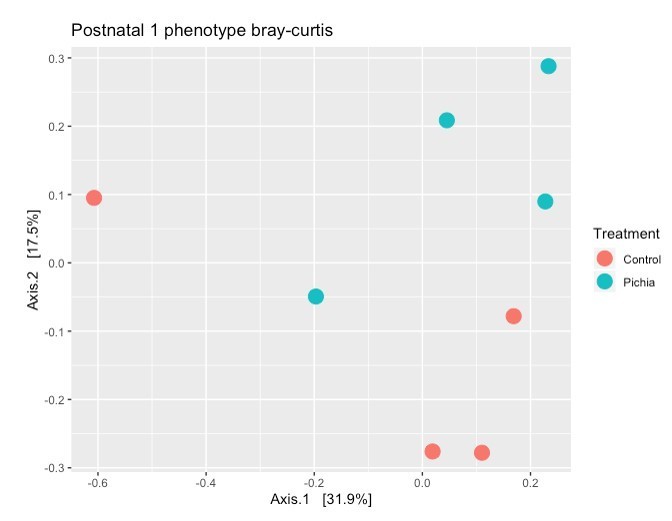
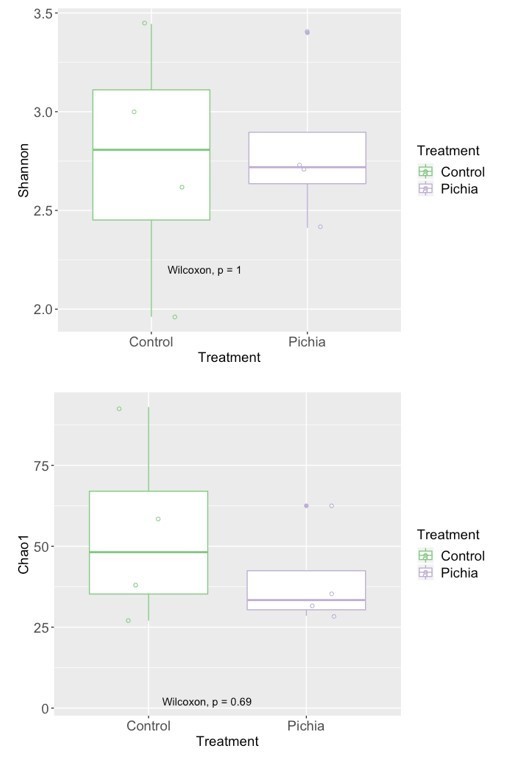
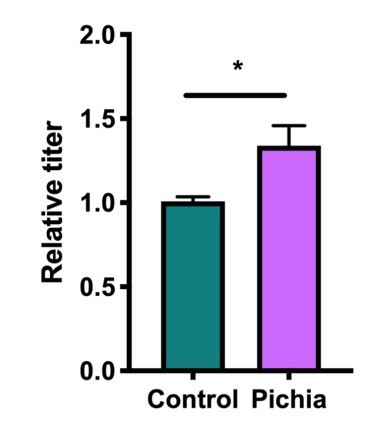
Mice transiently colonized with Pichia kudriavzevii in neonatal life mount an immune response to this yeast and exhibit persistent alterations to their gut bacterial populations.
(a–c) Mice neonatally exposed to PBS (control) or P. kudriavzevii (Pichia) via suckling during the first 2 weeks of life were sacrificed at day 16 of life to assess for colonization by P. kudriavzevii or on day 28 of life for immunophenotyping. (a) Colony counts of P. kudriavzevii in colon tissues isolated from 16-day-old mice. (b) ELISA detection of serum P. kudriavzevii-specific IgG depicted as optical density (OD) absorbance value relative to controls sacrificed on day 28 of life. (c) Principal coordinate analysis (PCoA) plot based on Bray-Curtis Dissimilarity distances from 16S rRNA gene sequencing data from colonic contents collected at 16 days of age (control n = 6; Pichia n = 7). (d) PCoA plot based on Bray-Curtis Dissimilarity distances and (e) alpha diversity (Shannon index) derived from 16S rRNA gene amplicon sequencing data from fecal samples collected at 4 weeks of age (day 28) from mice treated as described in Figure 2a (control n = 6; Pichia n = 4). (f) PCoA plot based on Bray-Curtis Dissimilarity distances from 16S rRNA gene sequencing data from fecal samples collected at sacrifice (day 56) for animals treated as described in Figure 2a (control n = 7; Pichia n = 5). Mice in (f) were siblings of mice in (c–e). Data in (a) are pooled from three independent experiments each showing the same trends (control n = 15, Pichia n = 16). Data in (b) are pooled from two independent experiments each showing the same trends (control n = 9, Pichia n = 12). (c–f) Data are representative of at least two independent experiments each showing the same trends. Colors indicate treatment and shapes indicate different cages within each treatment condition. Fungal colonization status (presence/absence of Pichia in the gut) is indicated in each panel. (c, d, and f) p-values determined by PERMANOVA and corrected for cage effects. Dots represent individual mice. *p<0.05; unpaired two-tailed Student’s t-test with Welch’s correction.
-
Figure 3—source data 1
Neonatal exposure colony counts.
- https://cdn.elifesciences.org/articles/67740/elife-67740-fig3-data1-v2.xlsx
-
Figure 3—source data 2
Neonatal exposure Pichia-specific IgG.
- https://cdn.elifesciences.org/articles/67740/elife-67740-fig3-data2-v2.xlsx
-
Figure 3—source data 3
Neonatal exposure colony counts.
- https://cdn.elifesciences.org/articles/67740/elife-67740-fig3-data3-v2.xlsx
-
Figure 3—source data 4
Neonatal exposure colony counts.
- https://cdn.elifesciences.org/articles/67740/elife-67740-fig3-data4-v2.xlsx
Figure 3—figure supplement 1
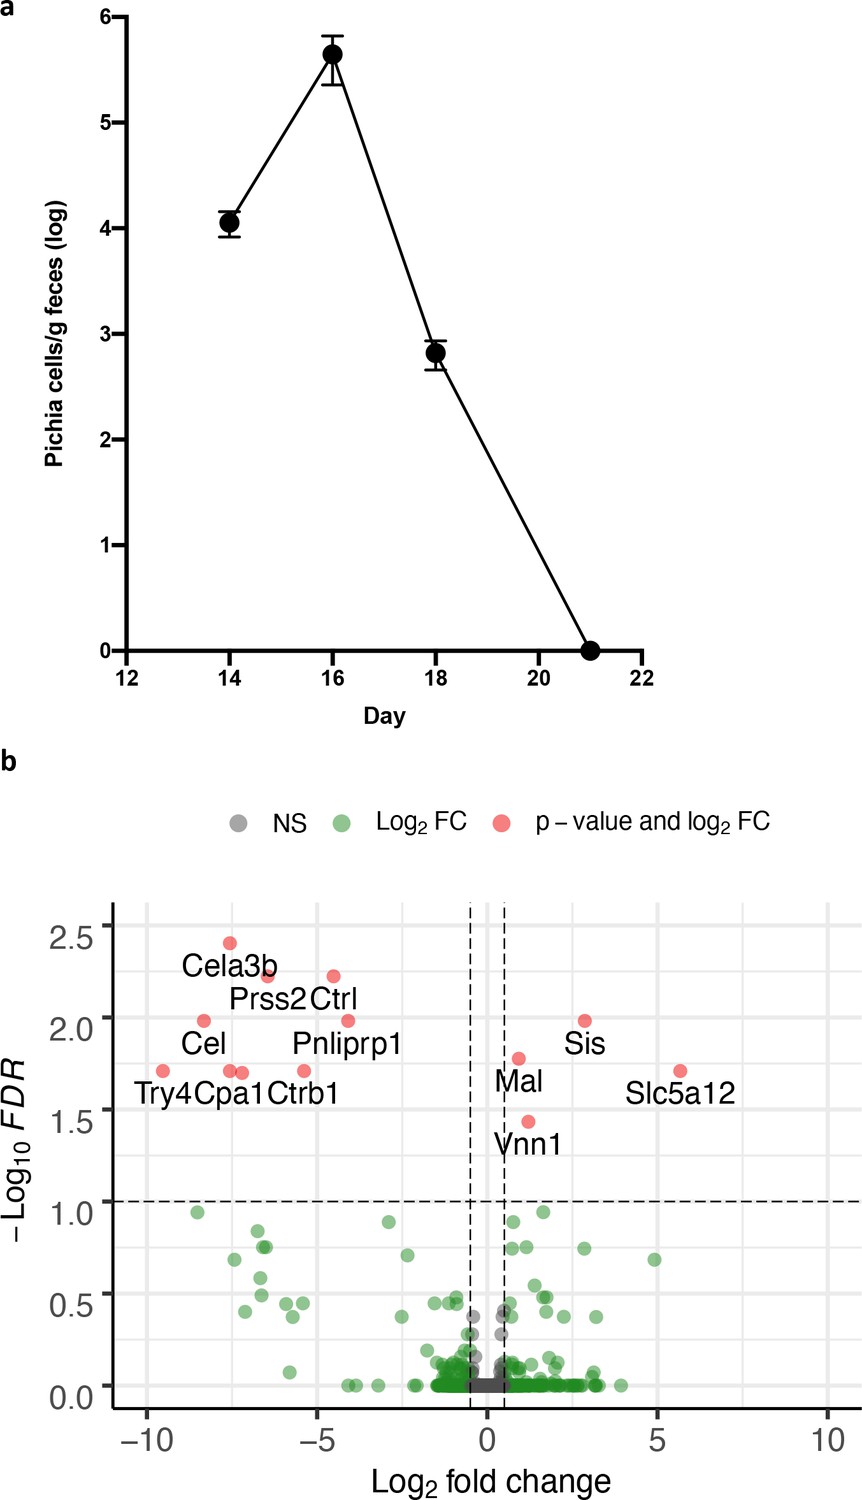
Mice neonatally exposed to Pichia kudriavzevii are transiently colonized and mount an immune response in the gut.
(a) Colony counts of Pi.kudriavzevii (Pichia) in fecal samples collected on day 14 (n = 7), day 16 (n = 10), day 18 (n = 15), and day 21 (n = 15) from pups neonatally exposed to P. kudriavzevii via suckling during the first 2 weeks of life. Error bars represent SEM and dots represent the mean. (b) Volcano plot demonstrating genes with altered gene expression in the colons of mice neonatally exposed to P. kudriavzevii via suckling during expression in the colons of mice neonatally exposed to P. kudriavzevii via suckling during the first 2 weeks of life relative to mice exposed to vehicle alone. X-axis indicates log2 fold change in expression and y-axis indicates -log10 of the associated p-value corrected by the FDR method. NS: not significant. FC: Fold change.
-
Figure 3—figure supplement 1—source data 1
Pichia colonization time course.
- https://cdn.elifesciences.org/articles/67740/elife-67740-fig3-figsupp1-data1-v2.xlsx
Figure 3—figure supplement 2
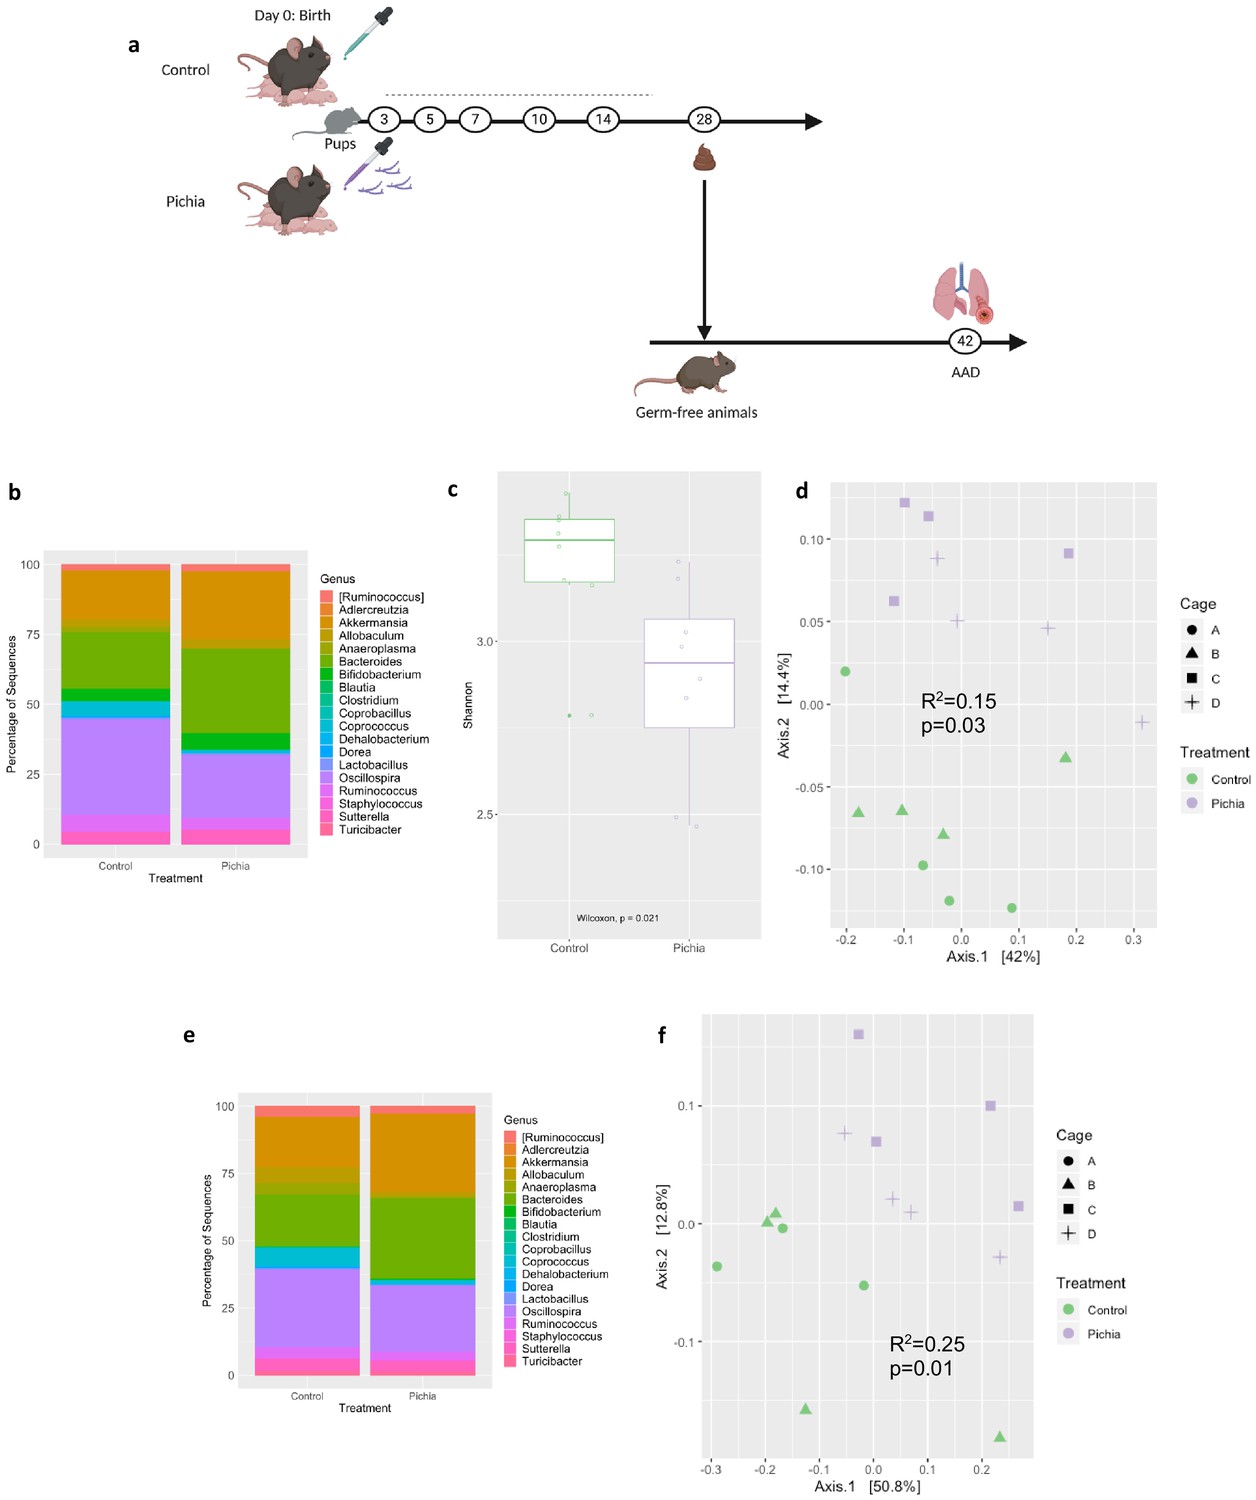
Gut bacterial populations from mice neonatally exposed to Pichia kudriavzevii in PBS or PBS alone are faithfully transplanted into germ-free mice.
(a–f) Bacterial microbiota of germ-free mice given a fecal transplant with samples collected at day 28 from mice treated as described in Figure 2a. (a) Experimental design (numbers indicate days of experimental timeline beginning from birth of donor mice). (b) Relative abundances of the bacterial genera found in fecal samples collected 2 weeks following the fecal transplant based on 16S sequencing data (control [n = 8] and Pichia [n = 8]). (c) Alpha diversity (Shannon index) and (d) principal coordinate analysis (PCoA) plot based on Bray-Curtis Dissimilarity distances and derived from 16S rRNA gene amplicon sequencing data from fecal samples described in b. Colors indicate treatment and shapes indicate different cages within each treatment condition. (e) Relative abundances of the bacterial genera identified in fecal samples collected 4 weeks following the fecal transplant (at sacrifice) based on 16S rRNA gene sequencing data and after merging 16S amplicon sequence variants to genus level (control [n = 7] and Pichia [n = 8]). (f) PCoA plot based on Bray-Curtis Dissimilarity distances and derived from 16S rRNA gene amplicon sequencing data from fecal samples described in e. (d and f) p-values determined by PERMANOVA and corrected for cage effects. AAD: allergic airway disease.
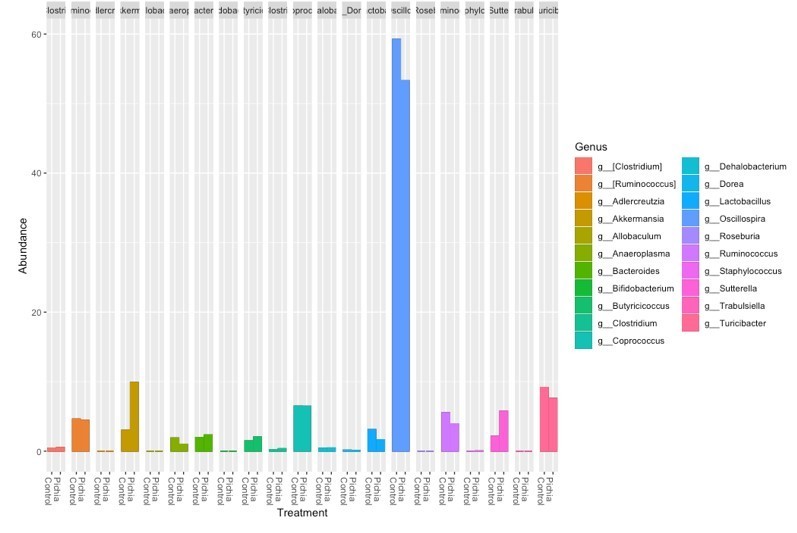
Figure 3—figure supplement 3
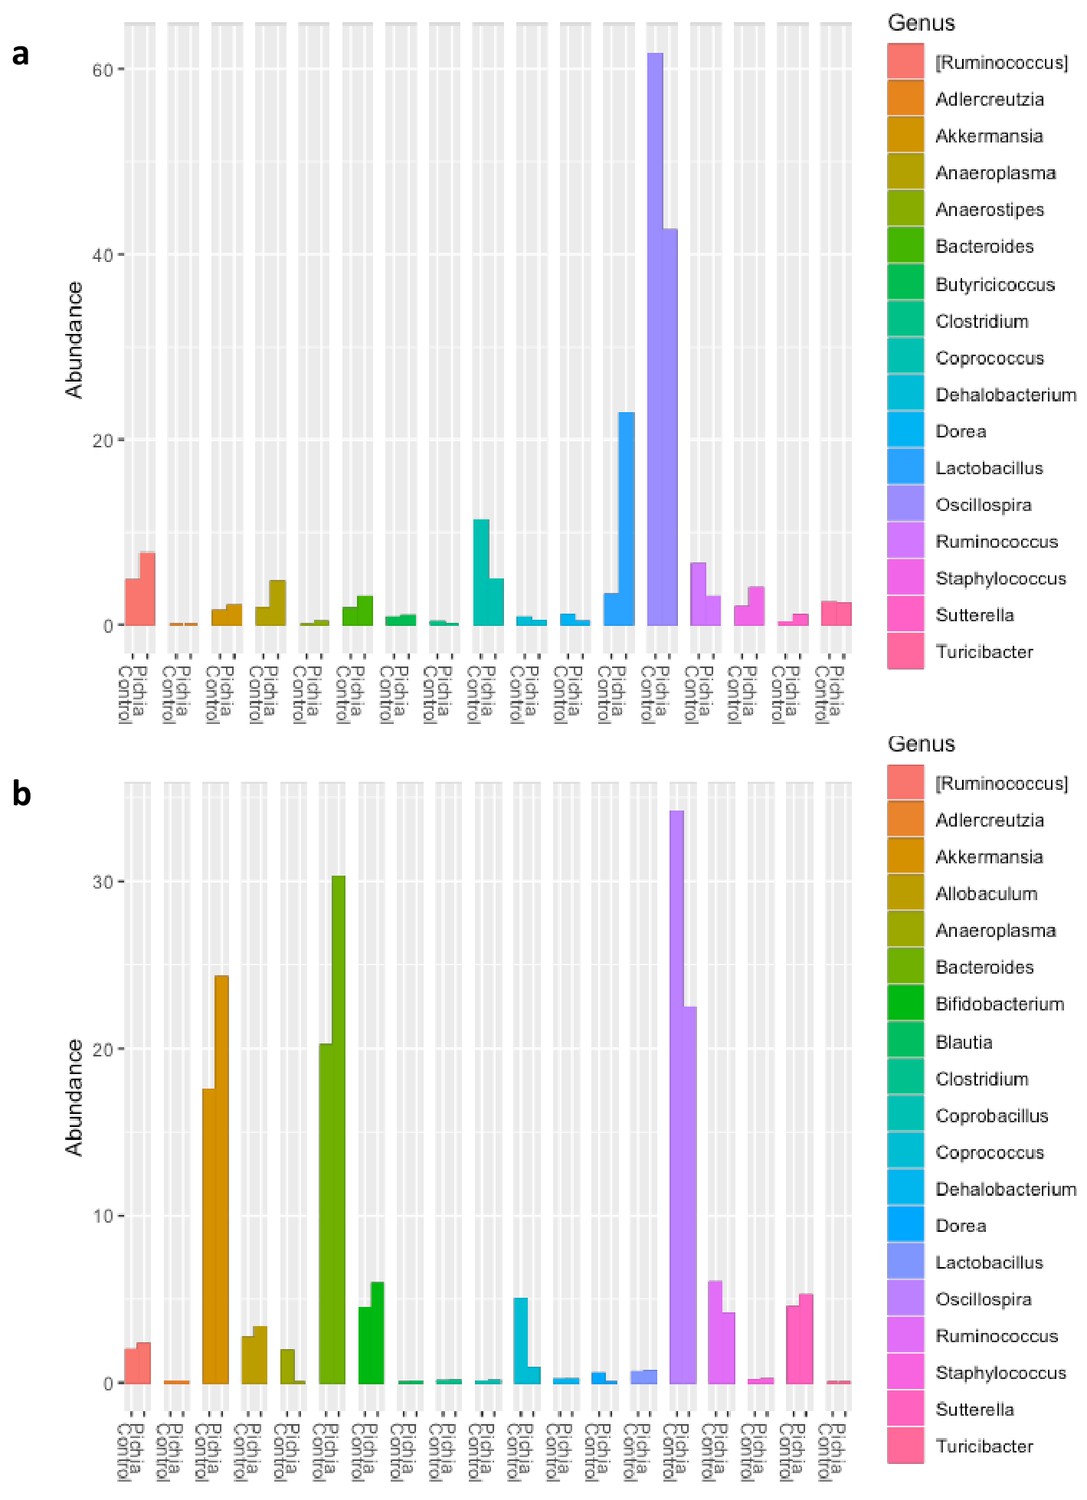
Relative abundance of the bacterial genera identified in fecal samples based on 16S rDNA amplicon sequencing from (a) 4-week-old mice (day 28) described in Figure 2a and (b) ex-germ-free mice given a fecal transplant as described in Figure 3—figure supplement 1a 2 weeks after the fecal transplant.
Figure 3—figure supplement 4
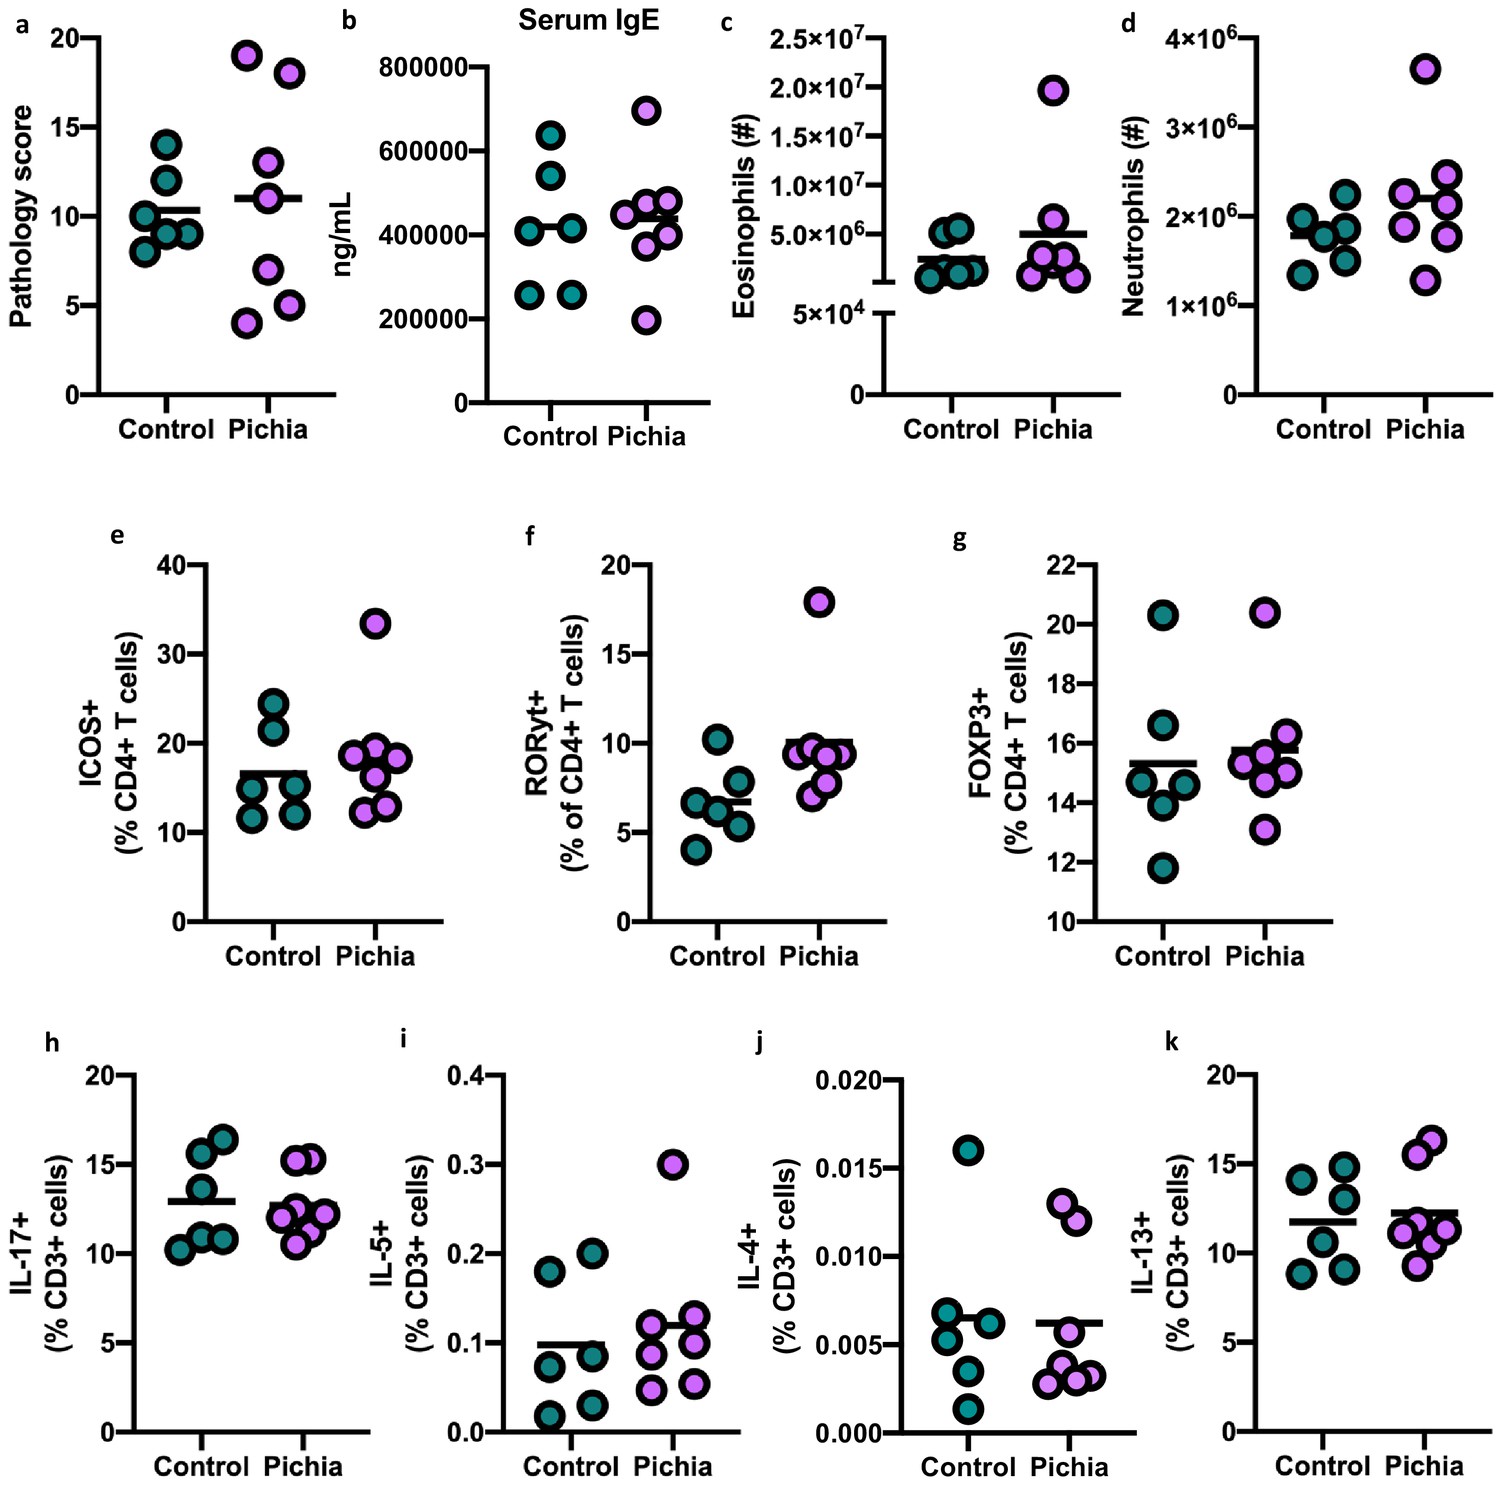
Changes to gut bacteria resulting from neonatal colonization with Pichia kudriavzevii are not responsible for increased lung inflammation observed during allergic airway disease later in life.
(a–k) Severity of allergic airway disease (AAD) induced following the procedure in Figure 2b with house dust mite does not differ in germ-free mice given a fecal transplant with samples collected at day 28 from mice in Figure 2a (control [n = 6] and Pichia [n = 7]). (a) Lung pathology scores (4–20). (b) ELISA detection of serum IgE. (c and d) Total numbers of SinglecF+CD45+CDllbhigh eosinophils (c) and Gr1+CD45+CDllb+ neutrophils in the lung (d). (e–g) Frequencies of ICOS+ CD4 T cells (e), RORγthigh CD4 T cells (f), and FOXP3+CD4 T cells (g) pre-gated on CD3+CD4+ cells in the lung. (h–k) Frequencies of IL-17+T cells (h), IL-5+T cells (i), IL-4+T cells (j), and IL-13+T (k) cells (pre-gated on CD3+) in the lung. Dots represent individual mice and lines indicate the group mean. No statistical differences between groups were identified by unpaired two-tailed Student’s t-test with Welch’s correction.
-
Figure 3—figure supplement 4—source data 1
Germ-free mice lung cell counts.
- https://cdn.elifesciences.org/articles/67740/elife-67740-fig3-figsupp4-data1-v2.xlsx
-
Figure 3—figure supplement 4—source data 2
Germ-free mice serum IgE.
- https://cdn.elifesciences.org/articles/67740/elife-67740-fig3-figsupp4-data2-v2.xlsx
Figure 4 with 1 supplement

Short-chain fatty acids inhibit the growth of Pichia kudriavzevii.
(a–d) Growth over time (top; mean of three biological replicates) and optical density (OD) at 600 nm at 15 hr (bottom) of P. kudriavzevii grown in yeast peptone dextrose (YPD) broth supplemented with sodium chloride (a) or the sodium salts of the short-chain fatty acids (SCFA) acetate (b), butyrate (c), or propionate (d) at the indicated biologically relevant concentrations (shown in units equivalent to μmol/g stool). (e–i) Scanning electron microscopy of P. kudriavzevii grown in YPD (e) or 150 μmol/mL of sodium chloride (NaCl) (f) or the sodium salts of acetate (g), butyrate (h), or propionate (i) at high (top) and low (bottom) magnification. (j) Epithelial cell adhesion assay experimental setup for (k). (k) Colony counts (colony forming units; CFU) of P. kudriavzevii pre-cultured in the presence of solutions described in (e–i) adherent to TC7 cells after 2 hr (left) and of P. kudriavzevii pre-cultured in the presence of the short-chain fatty acids (SCFA) acetate (150 μmol/mL), butyrate (30 μmol/mL), or propionate (30 μmol/mL) at biologically relevant molar ratios (shown in units equivalent to μmol/g stool) or biotin (10 mg/L) adherent to TC7 cells after 2 hr (right). (a–d and k) Data represent results from four independent experiments performed in triplicate. Dots represent biological replicates and unless otherwise stated, data are presented as mean ± SEM. Statistical comparisons are relative to SCFA-free controls. *p<0.05, **p<0.01, ***p<0.001, NS: not significant; ANOVA with Tukey’s post hoc test.
-
Figure 4—source data 1
SCFA growth curve.
- https://cdn.elifesciences.org/articles/67740/elife-67740-fig4-data1-v2.xlsx
-
Figure 4—source data 2
SCFA growth curve.
- https://cdn.elifesciences.org/articles/67740/elife-67740-fig4-data2-v2.xlsx
-
Figure 4—source data 3
SCFA growth curve.
- https://cdn.elifesciences.org/articles/67740/elife-67740-fig4-data3-v2.xlsx
-
Figure 4—source data 4
SCFA growth curve.
- https://cdn.elifesciences.org/articles/67740/elife-67740-fig4-data4-v2.xlsx
-
Figure 4—source data 5
SCFA growth curve.
- https://cdn.elifesciences.org/articles/67740/elife-67740-fig4-data5-v2.xlsx
-
Figure 4—source data 6
SCFA growth curve.
- https://cdn.elifesciences.org/articles/67740/elife-67740-fig4-data6-v2.xlsx
-
Figure 4—source data 7
SCFA growth curve.
- https://cdn.elifesciences.org/articles/67740/elife-67740-fig4-data7-v2.xlsx
-
Figure 4—source data 8
SCFA growth curve.
- https://cdn.elifesciences.org/articles/67740/elife-67740-fig4-data8-v2.xlsx
-
Figure 4—source data 9
SCFA growth curve.
- https://cdn.elifesciences.org/articles/67740/elife-67740-fig4-data9-v2.xlsx
Figure 4—figure supplement 1
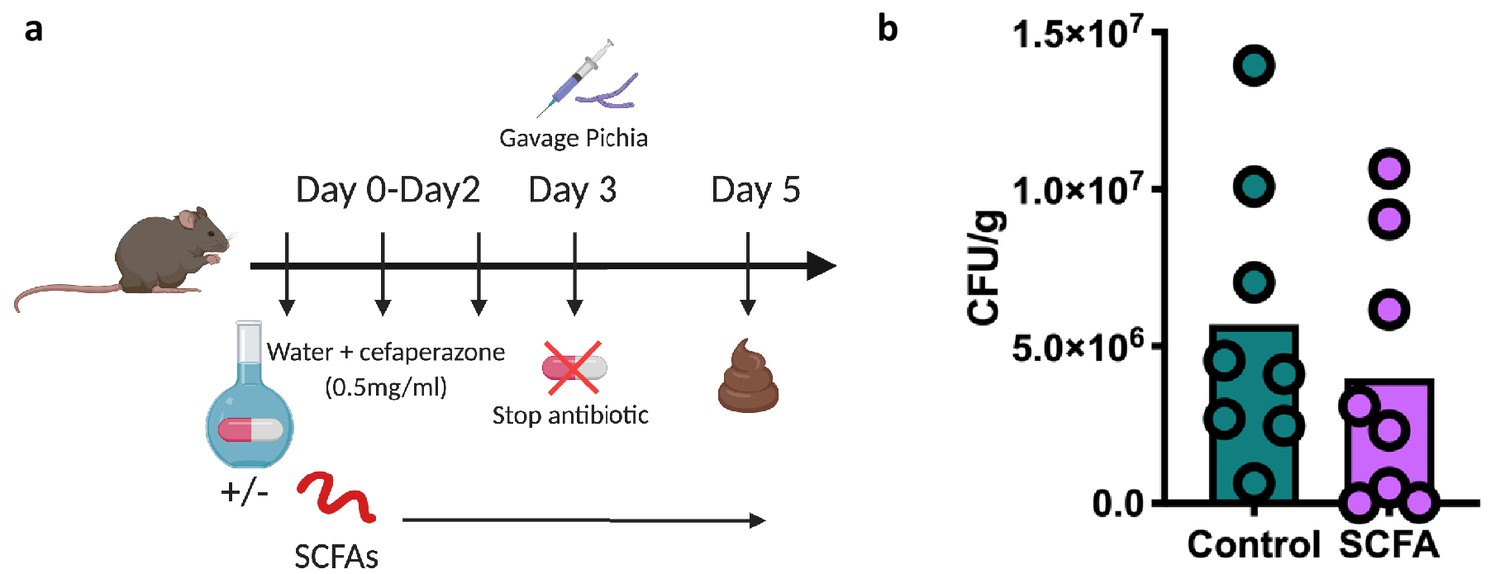
Mice supplemented with short-chain fatty acids (SCFAs) exhibit reduced colonization by Pichia kudriavzevii.
(a and b) Experimental design (a) and colony counts (b) in fecal samples collected from animals given an oral gavage of P. kudriavzevii 48 hr previously and maintained on regular (control; n = 15) or SCFA-supplemented (SCFA; n = 16) water. (b) Data represent results from two independent experiments each showing the same trends. Dots represent individual mice.
-
Figure 4—figure supplement 1—source data 1
SCFA supplementation colonization.
- https://cdn.elifesciences.org/articles/67740/elife-67740-fig4-figsupp1-data1-v2.xlsx
Figure 5
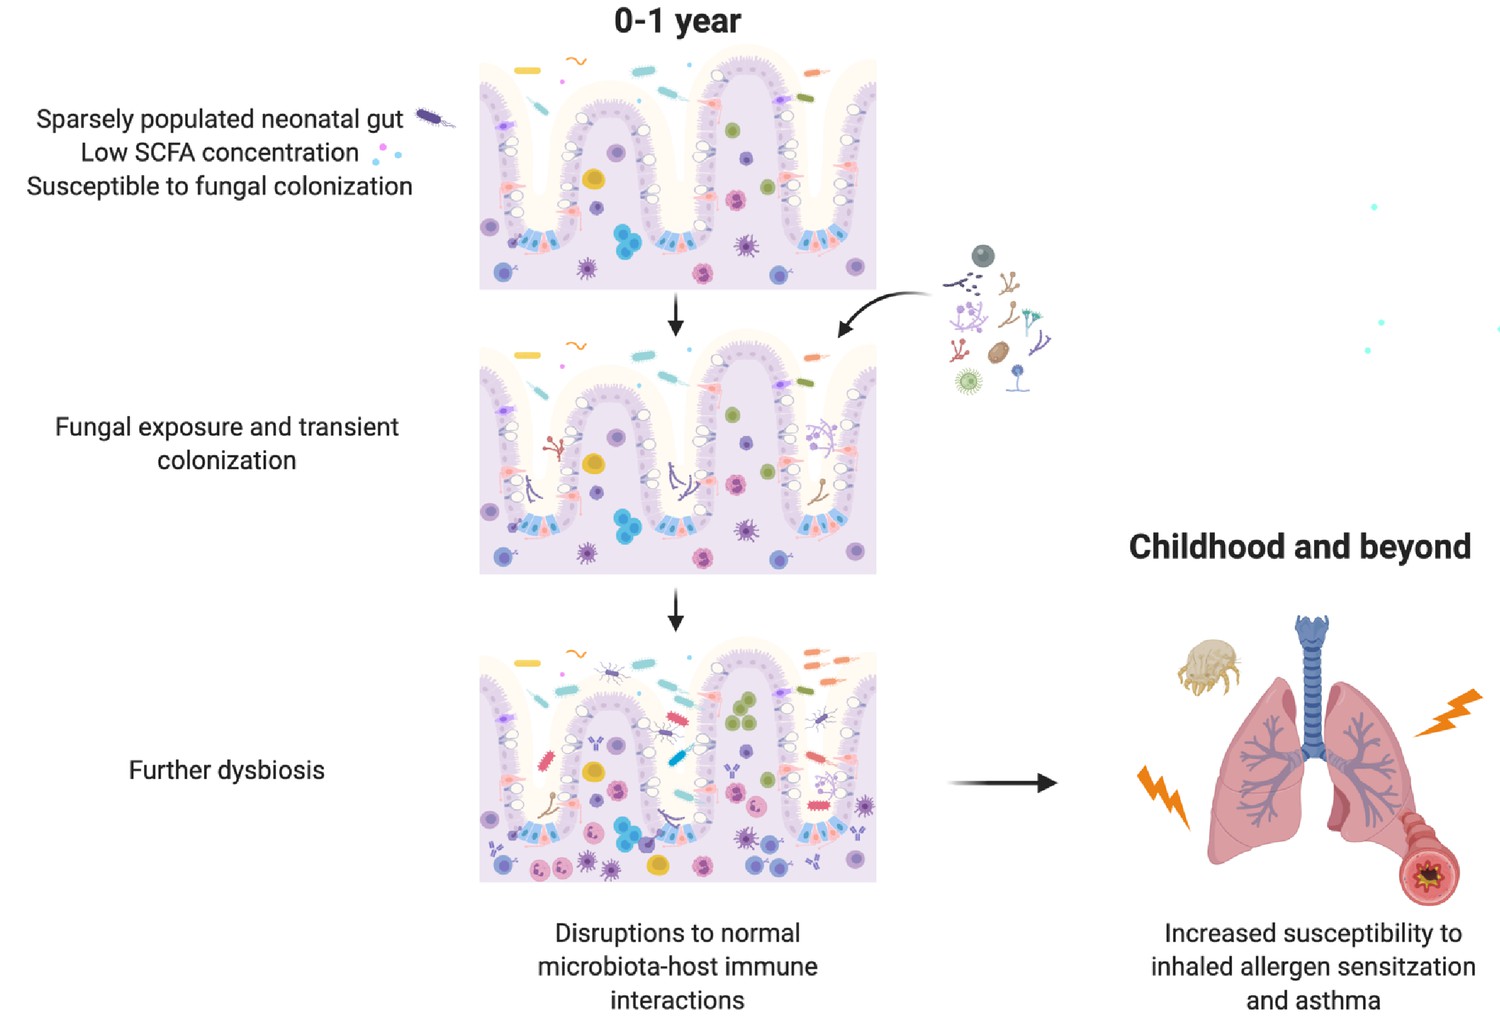
Schematic summary of the hypothesized sequence of events by which early life gut fungal dysbiosis associated with increased susceptibility to asthma in childhood occurs.
Author response image 1
Author response image 2
Author response image 3
Author response image 4
Author response image 5

Author response image 6

Author response image 7
Author response image 8
Author response image 9
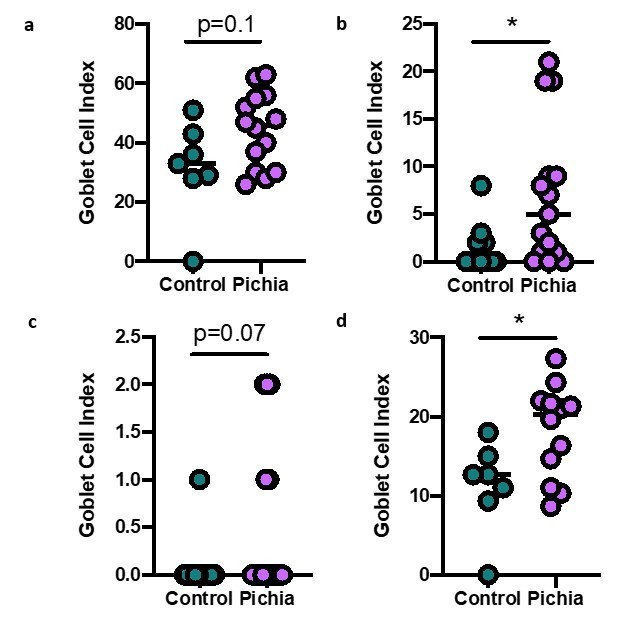
Goblet cell numbers quantified in primary (A), secondary (B), and tertiary (C) airways of mice in Figure 1.
(D) Shows the average goblet cell index for all airways in each animal. Figure illustrates combined results of three experiments.
Author response image 10
Author response image 11
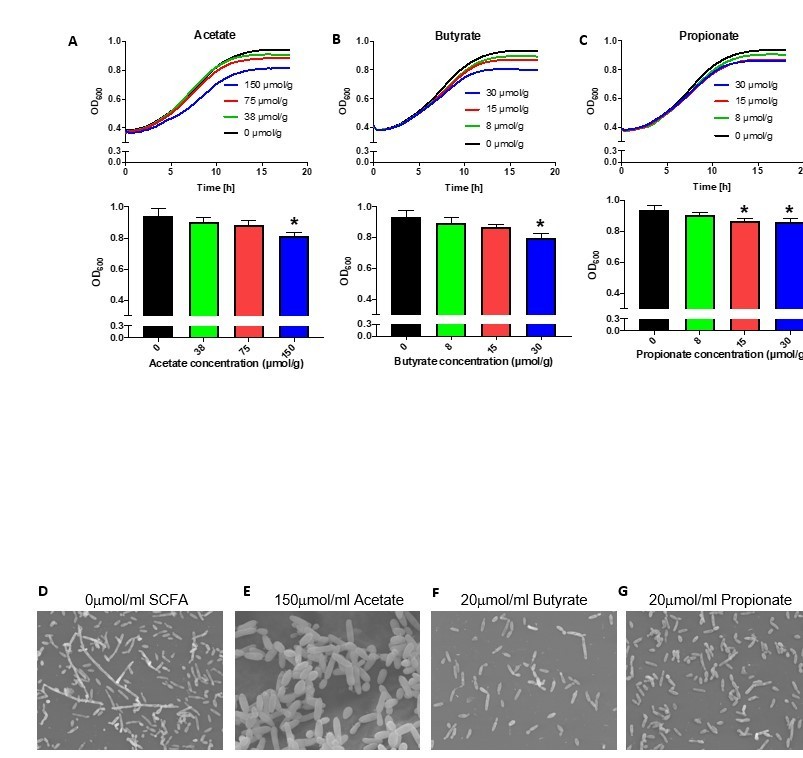
(A-C) Growth over time (top) and optical density (OD) at 600nm at 18 hours (bottom) of Pichia kudriavzevii grown in Yeast Peptone Dextrose (YPD) broth supplemented with the sodium salts of the short chain fatty acids (SCFA) acetate (A), butyrate (B), or propionate (C) at the indicated concentrations.
(D-G) Scanning electron microscopy of P. kudriavzevii grown in YPD (D) or the sodium salts of acetate (E), butyrate (F), or propionate (G). (A-C) Data represent results from three independent experiments performed in triplicate. Dots represent biological replicates and data are presented as mean ± SEM. Statistical comparisons are relative to SCFA-free controls. *p < 0.05, **p < 0.01, ***p < 0.001.
Author response image 12
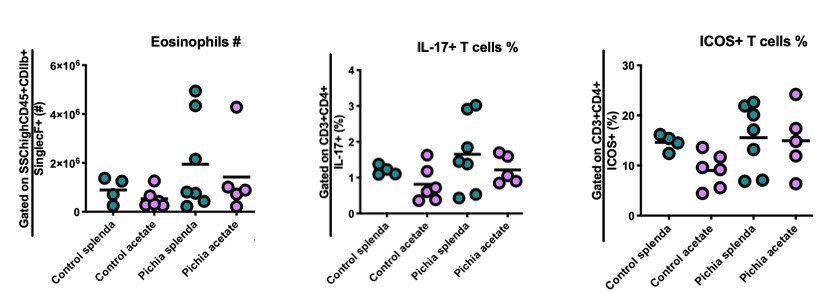
Number of eosinophils (left) and percentage of IL-17+ (middle) and ICOS+ (right) T cells in the lungs of mice given allergic airway disease via house dust mite extract sensitization and challenge in adulthood.
Gating strategies are indicated on the y-axis. Animals were neonatally exposed to the yeast Pichia kudriavzevii (Pichia) or PBC (control) and born to dams supplemented with either both acetate and 4mg/mL Splenda and 200mM sodium acetate (acetate) or Splenda alone (Splenda) in drinking water.
Tables
Table 1
Anti-mouse flow cytometry antibodies used in this study.
| Cell marker | Fluorophore | Source | Clone |
|---|---|---|---|
| CD3† | eFluor450 | eBioscience | 17A2 |
| CD4 | PerCP-Cy5.5 | TONBO biosciences | RM4-5 |
| CD4 | FITC | TONBO biosciences | RM4-5 |
| FOXP3 | PE | eBioscience | FJK-16s |
| RORγt | APC | eBioscience | B2D |
| ICOS | FITC | eBioscience | 7E.17G9 |
| GATA3 | PE-Cy7 | eBioscience | TWAJ |
| CD11b† | eFluor450 | eBioscience | M1/70 |
| CD11b | APC | eBioscience | M1/70 |
| CD11c | eFluor450 | eBioscience | N418 |
| F4/80 | FITC | eBioscience | BM8 |
| CD45 | PerCPCy5.5 | eBiosceicne | 30-F11 |
| SinglecF | PE | BD Biosciences | E50-2440 |
| GR-1 | PE-Cy7 | eBioscience | RB6-8C5 |
| IL-13 | APC-eFluor780 | eBioscience | eBio13A |
| IL-5 | PE | eBioscience | TRFK5 |
| IFN-γ | AlexaFluor700 | eBioscience | XMG1.2 |
| IFN-γ | PE | TONBO biosciences | XMG1.2 |
| IL-4 | APC | eBioscience | 11B11 |
| IL-17A | PE-Cy7 | eBioscience | eBio17B7 |
| B220† | eFluor450 | eBioscience | RA3-6B2 |
| NK1.1† | eFluor450 | eBioscience | PK136 |
| FcεRI† | eFluor450 | eBioscience | MAR-1 |
-
*Cy = cyanine.
†Used to define lineage + cells.
Additional files
-
Source data 1
R code for RNA-seq data.
- https://cdn.elifesciences.org/articles/67740/elife-67740-data1-v2.zip
-
Transparent reporting form
- https://cdn.elifesciences.org/articles/67740/elife-67740-transrepform-v2.docx
Download links
A two-part list of links to download the article, or parts of the article, in various formats.
Downloads (link to download the article as PDF)
Open citations (links to open the citations from this article in various online reference manager services)
Cite this article (links to download the citations from this article in formats compatible with various reference manager tools)
Bacterial–fungal interactions in the neonatal gut influence asthma outcomes later in life
eLife 10:e67740.
https://doi.org/10.7554/eLife.67740


