Dual targeting of salt inducible kinases and CSF1R uncouples bone formation and bone resorption
- Endocrine Unit, Massachusetts General Hospital, Harvard Medical School, United States
- Center for Advanced Orthopaedic Studies, Department of Orthopedic Surgery, Beth Israel Deaconess Medical Center, Harvard Medical School, United States
- Dana Farber Cancer Institute, Harvard Medical School, United States
- Ludwig Boltzmann Institute of Osteology at Hanusch Hospital of OEGK and AUVA Trauma Centre, Meidling, 1st Medical Department Hanusch Hospital, Austria
- Center for Bone Quality, Leiden University Medical Center, Netherlands
- Center for Clinical and Translational Research, Maine Medical Center Research Institute, Canada
- Department of Endocrinology and Metabolism, Academic Medical Center, Netherlands
- Broad Institute of MIT and Harvard, United States
- Center for Computational and Integrative Biology, Massachusetts General Hospital, United States
- Department of Pharmacological Sciences, Icahn School of Medicine at Mount Sinai, United States
- Department of Integrative Biology and Pharmacology, McGovern Medical School at The University of Texas Health Science Center at Houston (UTHealth), United States
- Université de Paris, Institut Cochin, CNRS, France
- Harvard Stem Cell Institute, United States
Figures
Figure 1 with 1 supplement
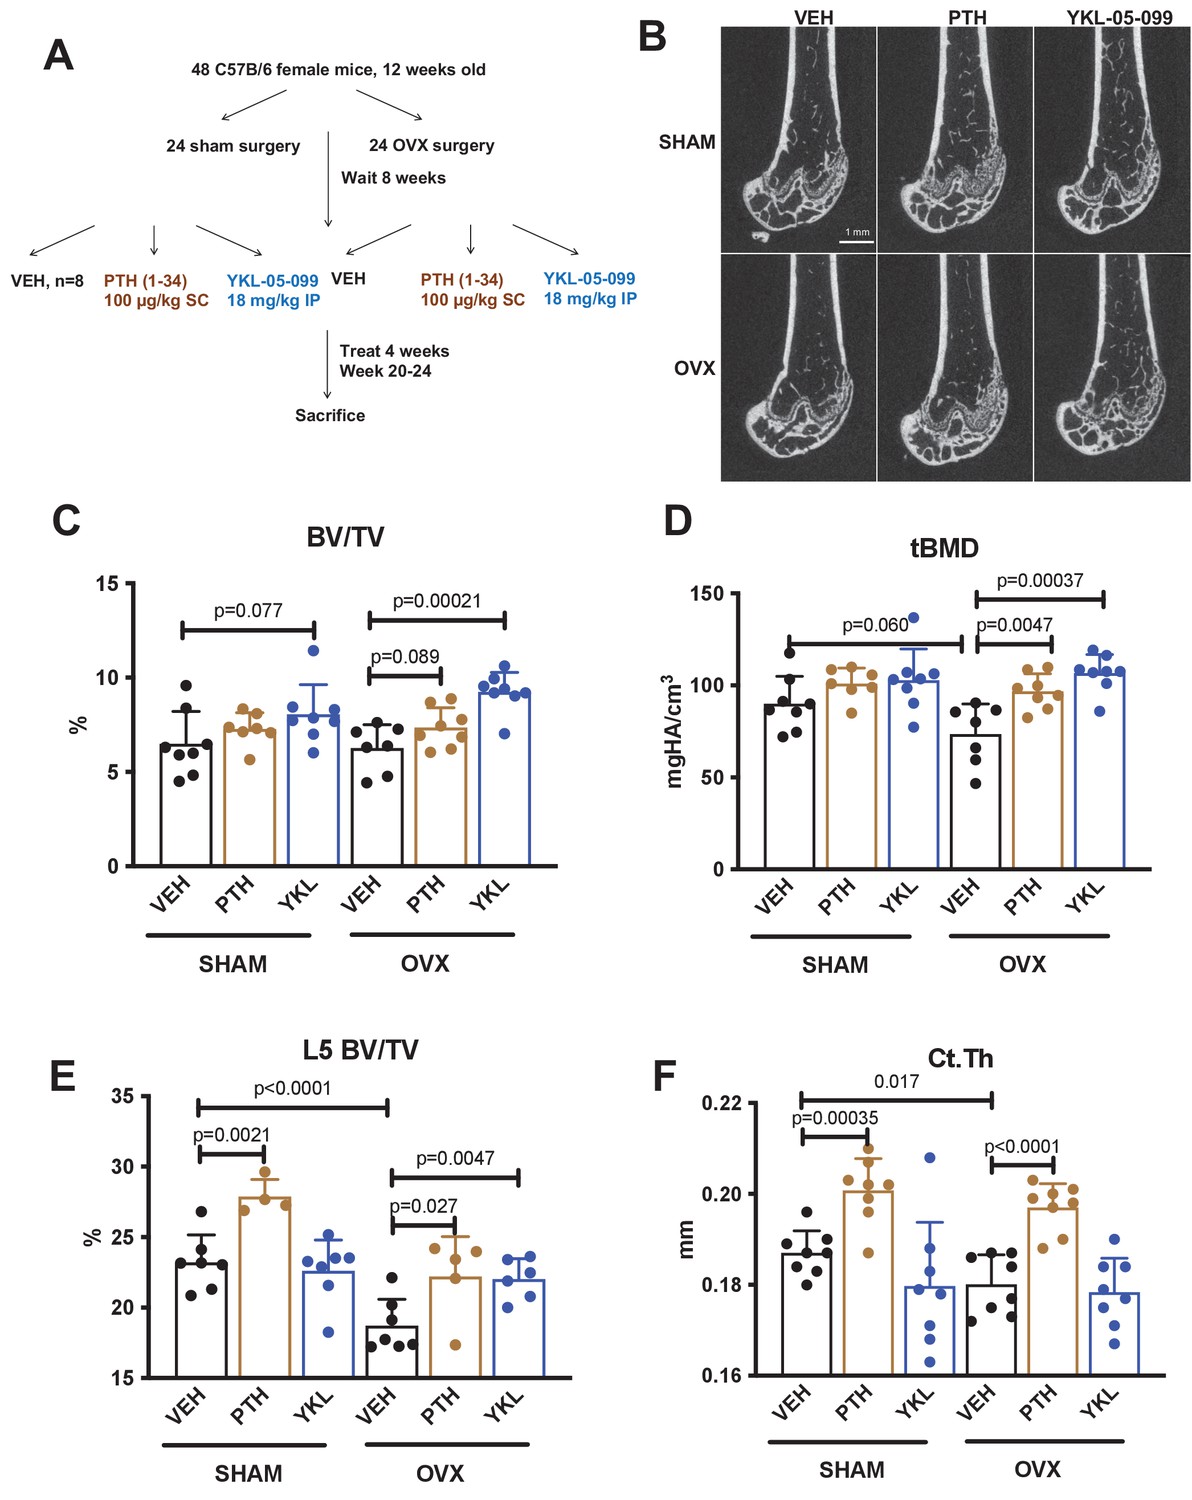
YKL-05–099 increases cancellous bone mass in hypogonadal female mice.
(A) Overview of ovariectomy (OVX) study design. N = 48 C57B/6 mice were subjected to sham or OVX surgery at 12 weeks of age. Eight weeks later, mice were randomly divided into the six indicated treatment groups, with n = 8 mice per group. Animals were treated over the course of 4 weeks and then sacrificed for skeletal analyses. (B) Representative femur micro-CT images from each treatment group. Scale bar = 1 mm. (C–D) Trabecular parameters in the distal femur. BV/TV = bone vol fraction. tBMD = trabecular bone mineral density. p Values between groups were calculated by two way ANOVA followed by Dunnett’s multiple comparisons test. All p values less than 0.1 are shown. OVX surgery reduces trabecular bone mineral density, and this is rescued by YKL-05–099 treatment. (E) Trabecular bone mass in L5. OVX surgery reduces vertebral trabecular bone mass, and this is rescued by YKL-05–099 treatment. (F) Cortical thickness in the femur midshaft. OVX surgery reduces cortical thickness. PTH (100 mcg/kg/d), but not YKL-05–099, increases cortical thickness. Also see Supplementary file 1 for all micro-CT data from both skeletal sites. All graphs show mean ± SD with each data point representing an individual experimental animal. See Source Data File for additional information.
Figure 1—figure supplement 1
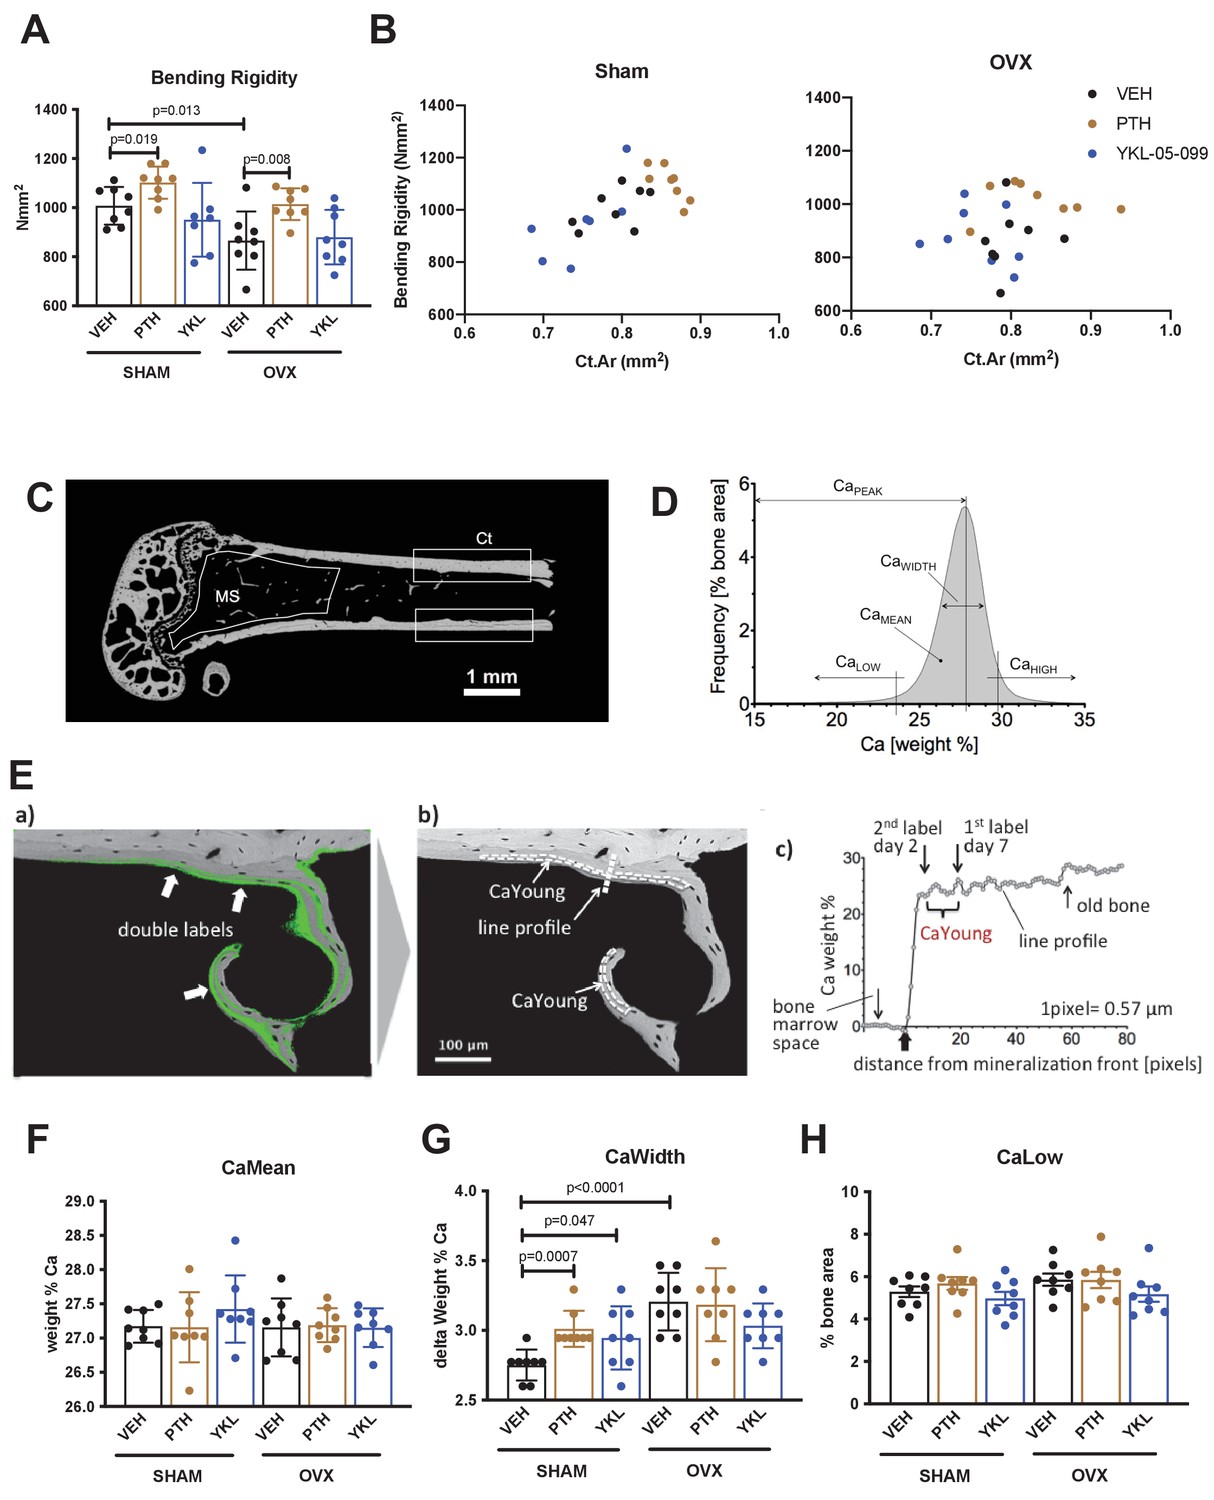
Results of biomechanical testing (A,B) and quantitative backscattered electron imaging (qBEI, C–H) from OVX study.
(A) Bending rigidity results. Consistent with cortical bone micro-CT data, only PTH treatment increases femur mechanical strength. p Values between groups were calculated by two way ANOVA followed by Dunnett’s multiple comparisons test. All p values less than 0.05 are shown. See Supplementary file 3 for additional parameters obtained from three point bending testing. (B) The relationship between cortical bone mass (x-axis, Cortical Area) and bone strength (y-axis, Bending rigidity) was plotted for individual mice in the indicated surgical and drug treatment groups. No obvious changes in the bone mass/strength relationship were noted in response to PTH or YKL-05–099 compared to vehicle-treated animals. (C) qBEI was performed on distal femur from OVX study mice (n = 8 per each group) to determine the effects of OVX and drug treatments on bone mineralization in metaphyseal spongiosa (MS) and midshaft cortical bone (Ct). (D) BMDD from a representative SHAM-VEH mouse in the cortical midshaft region. The BMDD parameters are depicted: CaMean (mean Ca content), CaPeak (mode Ca content), CaWidth (the full width at half maximum of the distribution), CaLow (the percentage of mineralized bone with a calcium concentration less than 23.84 weight % corresponding to CaYoung), and CaHigh (the percentage of bone areas with a calcium concentration beyond the 95th percentile of the SHAM-VEH group BMDD, which was 29.81 weight % Ca in cortex and 28.25 weight % Ca in the metaphysis). (E) For the evaluation of CaLow, the mean calcium concentration between the two fluorescence labels CaYoung (corresponding to a mineralized tissue age of 2–7 days) was determined. For this purpose, the (a) qBEI image was overlaid with a matched confocal scanning laser microscope image (fluorescence mode) from the identical sample surface, and (b) CaYoung was measured in the bone areas between the double labels (areas enclosed by dotted lines). (c) Example of mineralization of a line profile through an area of new bone formation as indicated in (b), showing the rapid primary increase and second slower increase in bone matrix mineralization. CaYoung represents the calcium level at the beginning of the second phase. Graphs in (F–H) show the effects of surgery and drug treatment on cortical bone CaMean, CaWidth and CaLow (for cortical bone CaPeak and CaHigh as well as metaphyseal BMDD results, see Supplementary file 4). In sham-operated mice, PTH treatment increases CaWidth. In general, minimal effects of surgery or drug (PTH or YKL-05–099) were observed as assessed by qBEI. See Source Data File for additional information.
Figure 2 with 2 supplements
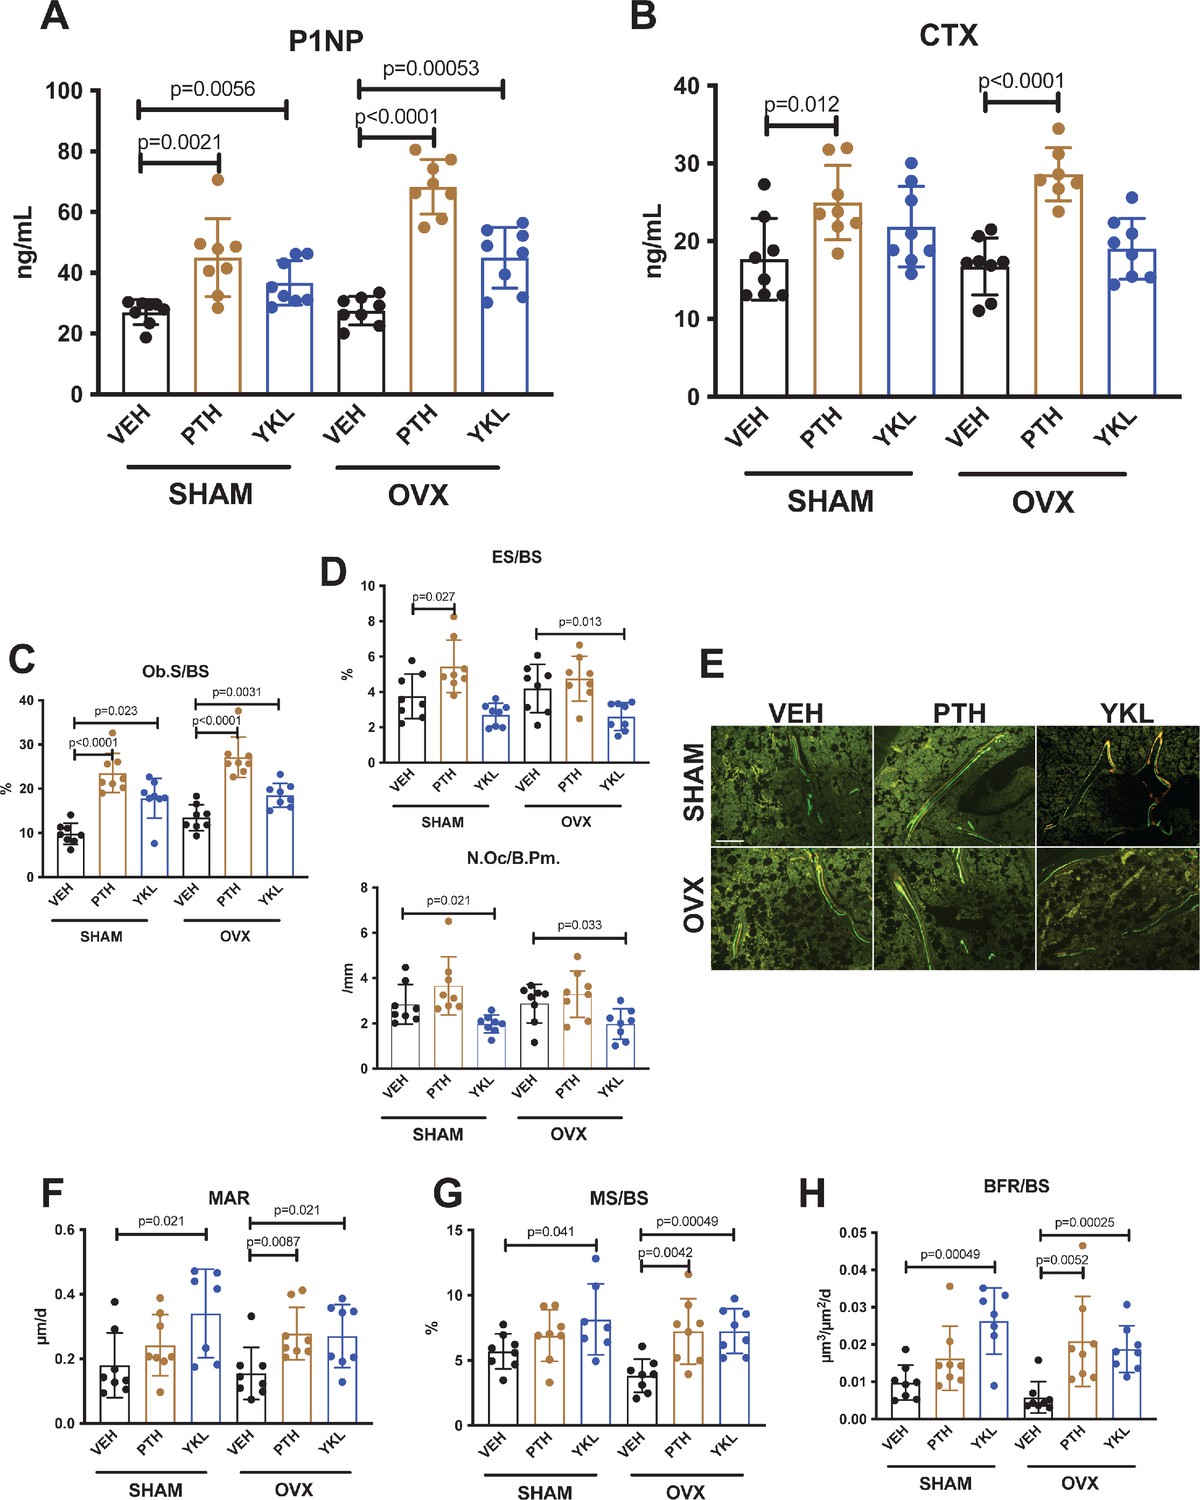
YKL-05–099 increases bone formation without increasing bone resorption in OVX mice.
(A, B) Fasting serum was obtained just prior to sacrifice, following 4 weeks of treatment as indicated. p Values between groups were calculated by two way ANOVA followed by Dunnett’s multiple comparisons test. All p values less than 0.05 are shown. Both PTH and YKL-05–099 increase levels of the bone formation marker P1NP. In contrast, only PTH treatment increases levels of the bone resorption marker CTX. P1NP levels (mean ± SD) in the different treatment groups are as follows: SHAM/VEH 27.05 (ng/ml)±4.07, SHAM/PTH 44.97 ± 12.9, SHAM/YKL 36.73 ± 7.33, OVX/VEH 27.53 ± 4.64, OVX/PTH 68.29 ± 9.0, OVX/YKL 44.97 ± 10.01. CTX levels (mean ± SD) in the different treatment groups are as follows: SHAM/VEH 17.69 (ng/ml)±5.26, SHAM/PTH 24.97 ± 4.78, SHAM/YKL 21.88 ± 5.18, OVX/VEH 16.75 ± 3.67, OVX/PTH 28.61 ± 3.4, OVX/YKL 19.04 ± 3.9. (C, D) Static histomorphometry was performed on the tibia in the proximal metaphysis to measure cancellous osteoblast surface (Ob.S/BS), eroded surface (ES/BS), and osteoclast number per bone perimeter (Oc.N/B.Pm). Both PTH and YKL-05–099 treatment increases osteoblast surfaces, only PTH tends to increase osteoclast numbers and eroded surface while YKL-05–099 shows the opposite effect. (E) Representative fluorescent images showing dual calcein (green) and demeclocycline (red) labeling on trabecular surfaces. (F–H) Quantification of dynamic histomorphometry parameters: MAR = matrix apposition rate. MS/BS = mineralizing surface per total bone surface. BFR/BS = bone formation rate. Also see Supplementary file 2 for all histomorphometry data. See Source Data File for additional information.
Figure 2—figure supplement 1
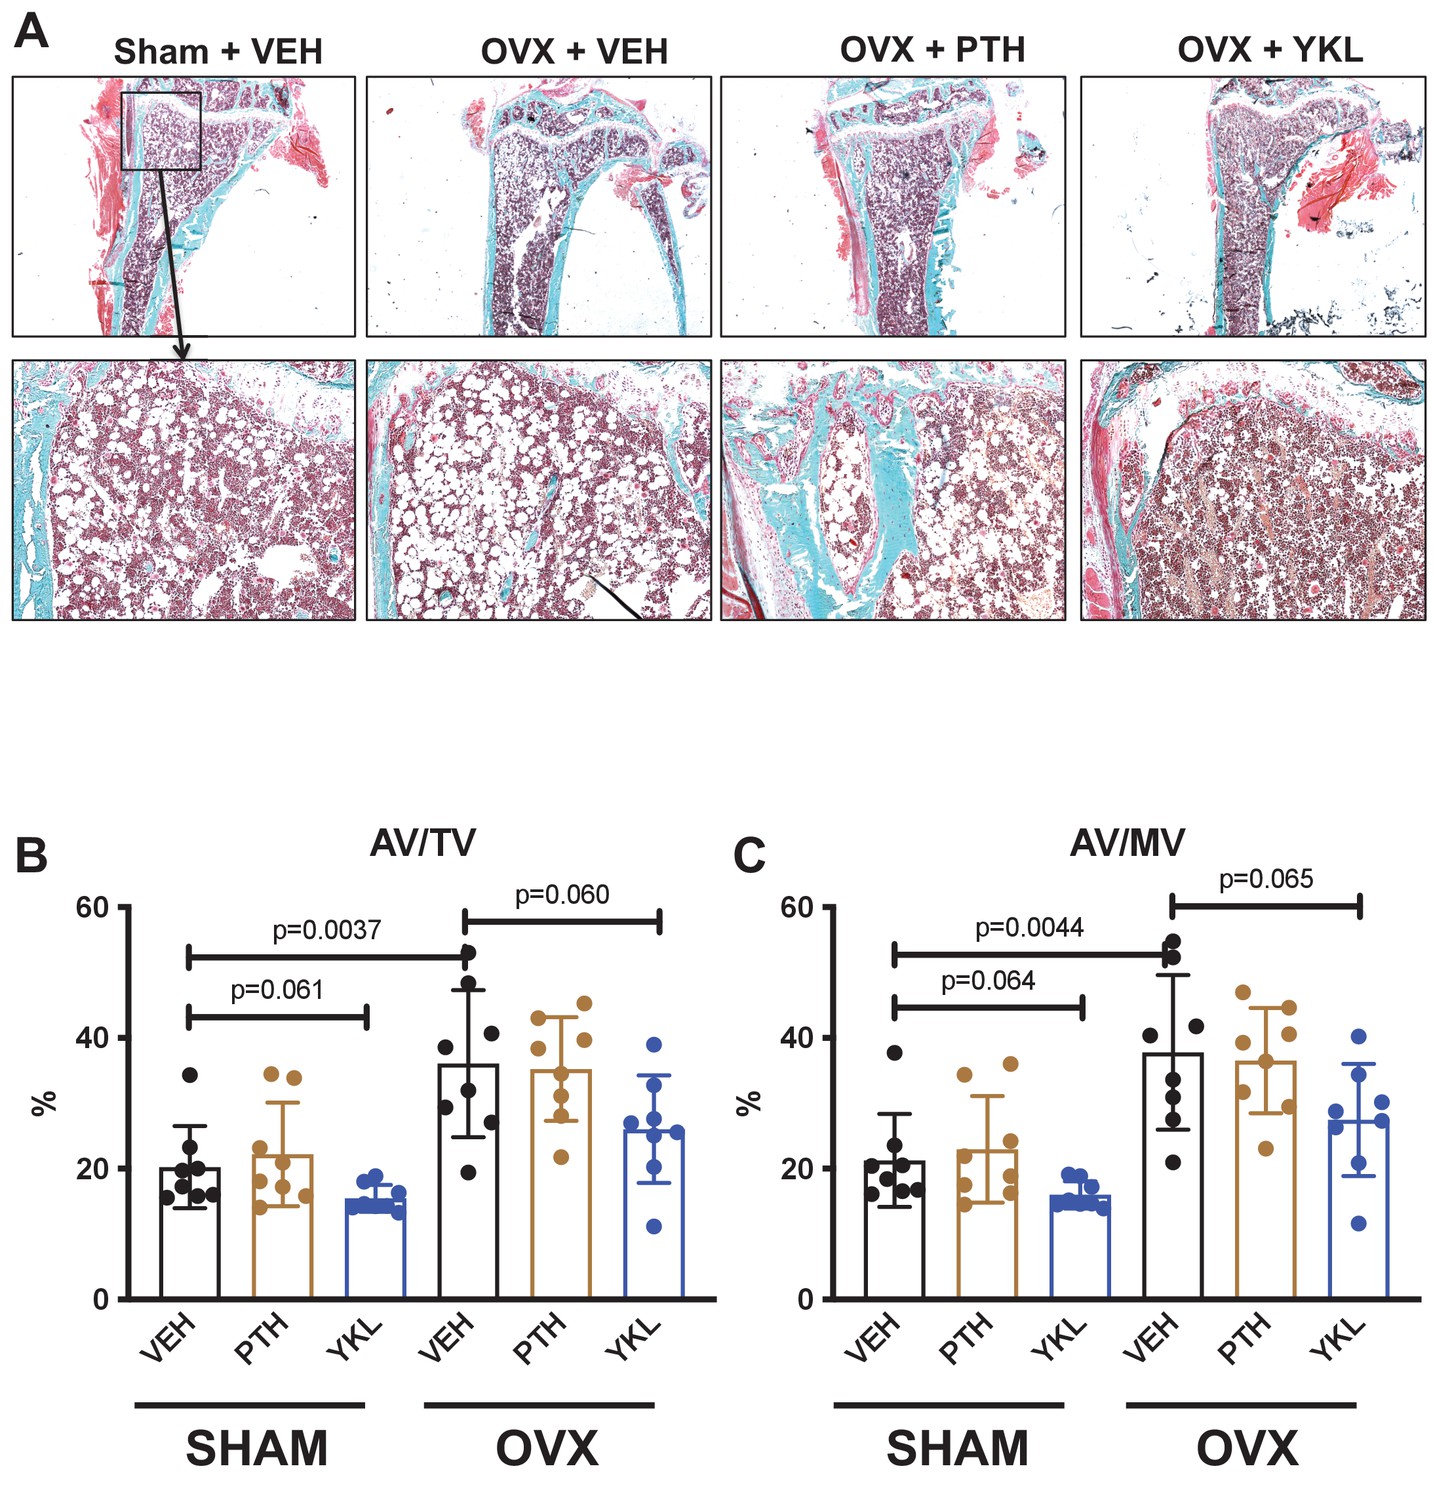
Effects of YKL-05–099 on marrow adipocytes in the proximal tibia.
(A) Trichrome stained tibia sections for histomorphometry are shown. In 24-week-old mice, many cells with adipocyte morphology are seen in the proximal tibial metaphysis. Qualitative reductions in adipocytes at this skeletal site are seen in YKL-05–099-treated mice. (B) Marrow adipocytes were quantified in a blinded manner. p Values between groups were calculated by two-way ANOVA followed by Dunnett’s multiple comparisons test. All p values less than 0.1 are shown. OVX surgery increases tissue space occupied by marrow adipocytes, and YKL-05–099 treatment tends to reduce this parameter. See Source Data File for additional information.
Figure 2—figure supplement 2
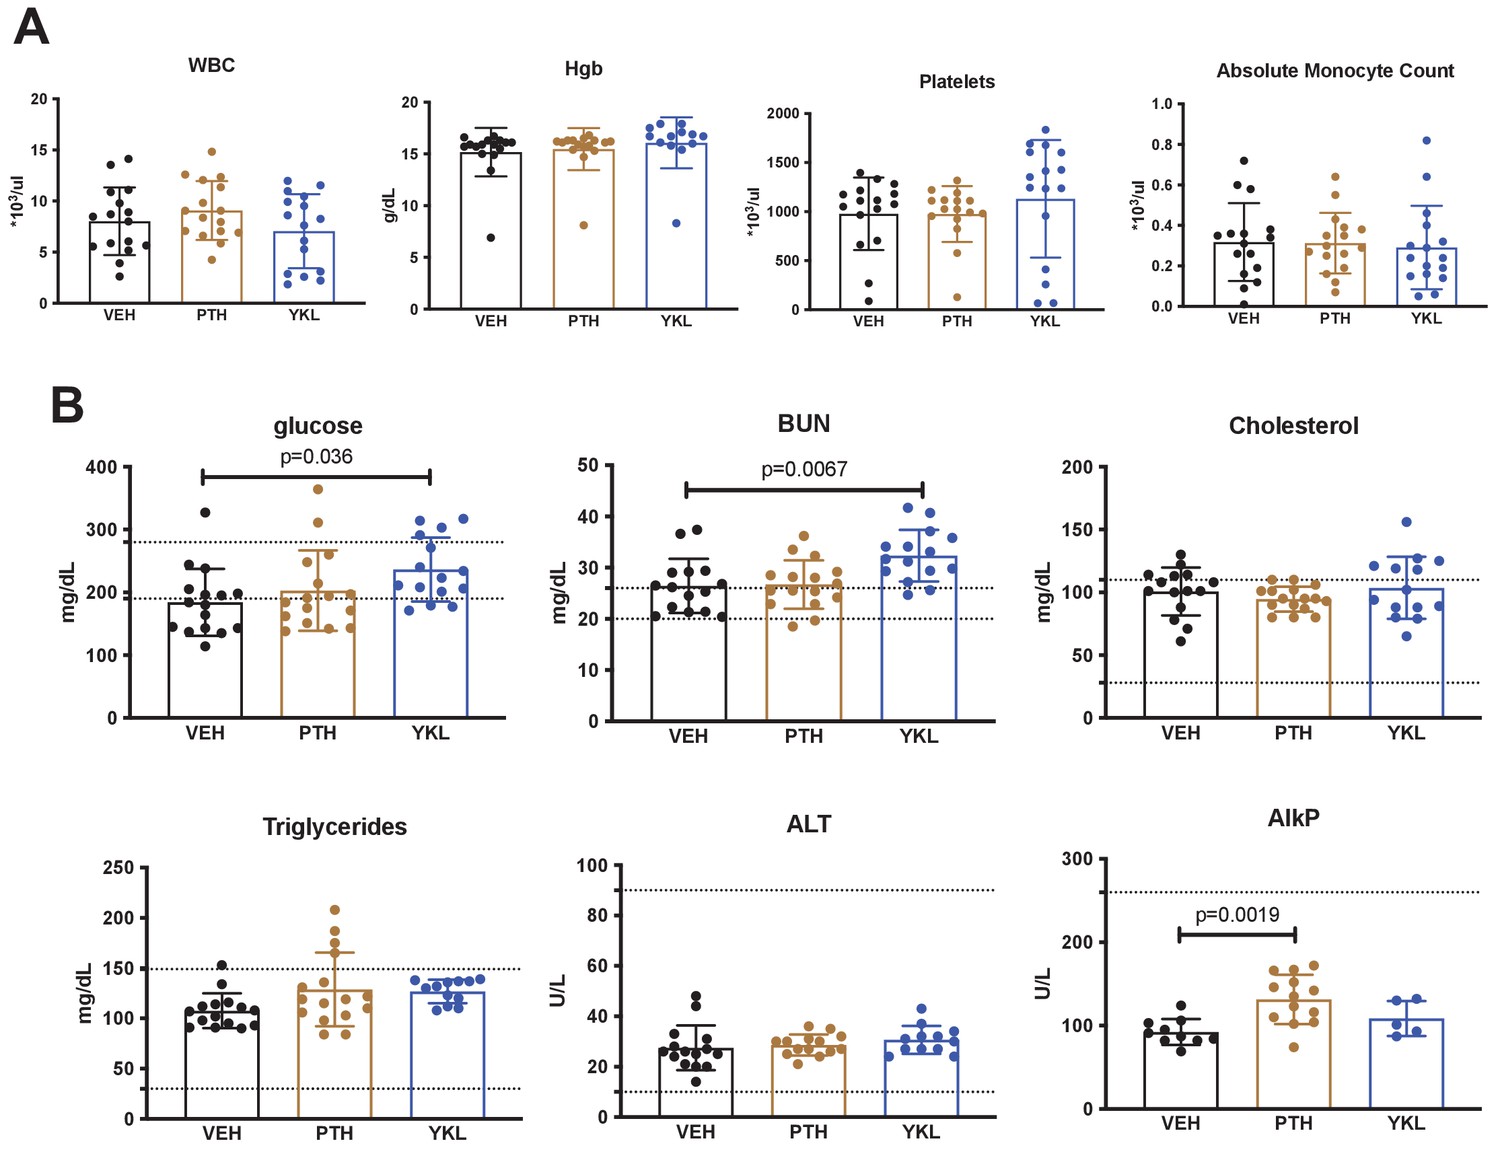
Effects of YKL-05–099 treatment on basic hematologic and serum parameters.
Three hr fasting blood was collected prior to sacrifice and analyzed for complete blood counts (A, WBC = white blood cells, Hgb = hemoglobin) and the indicated serum parameters (B, BUN = blood urea nitrogen, ALT = alanine transaminase, AlkP = alkaline phosphatase). For (B), the normal mouse reference ranges are shown in dotted horizontal lines. p Values between groups were calculated by one way ANOVA followed by Dunnett’s correction. All p values less than 0.05 are shown. For these analyses, no effects of surgical intervention (sham versus ovariectomy) were noted. Therefore, mice are grouped based on drug treatment alone. No significant changes in hematologic parameters were noted. YKL-05–099 treatment led to statistically significant increases in serum glucose and BUN. See Source Data File for additional information.
Figure 3 with 4 supplements
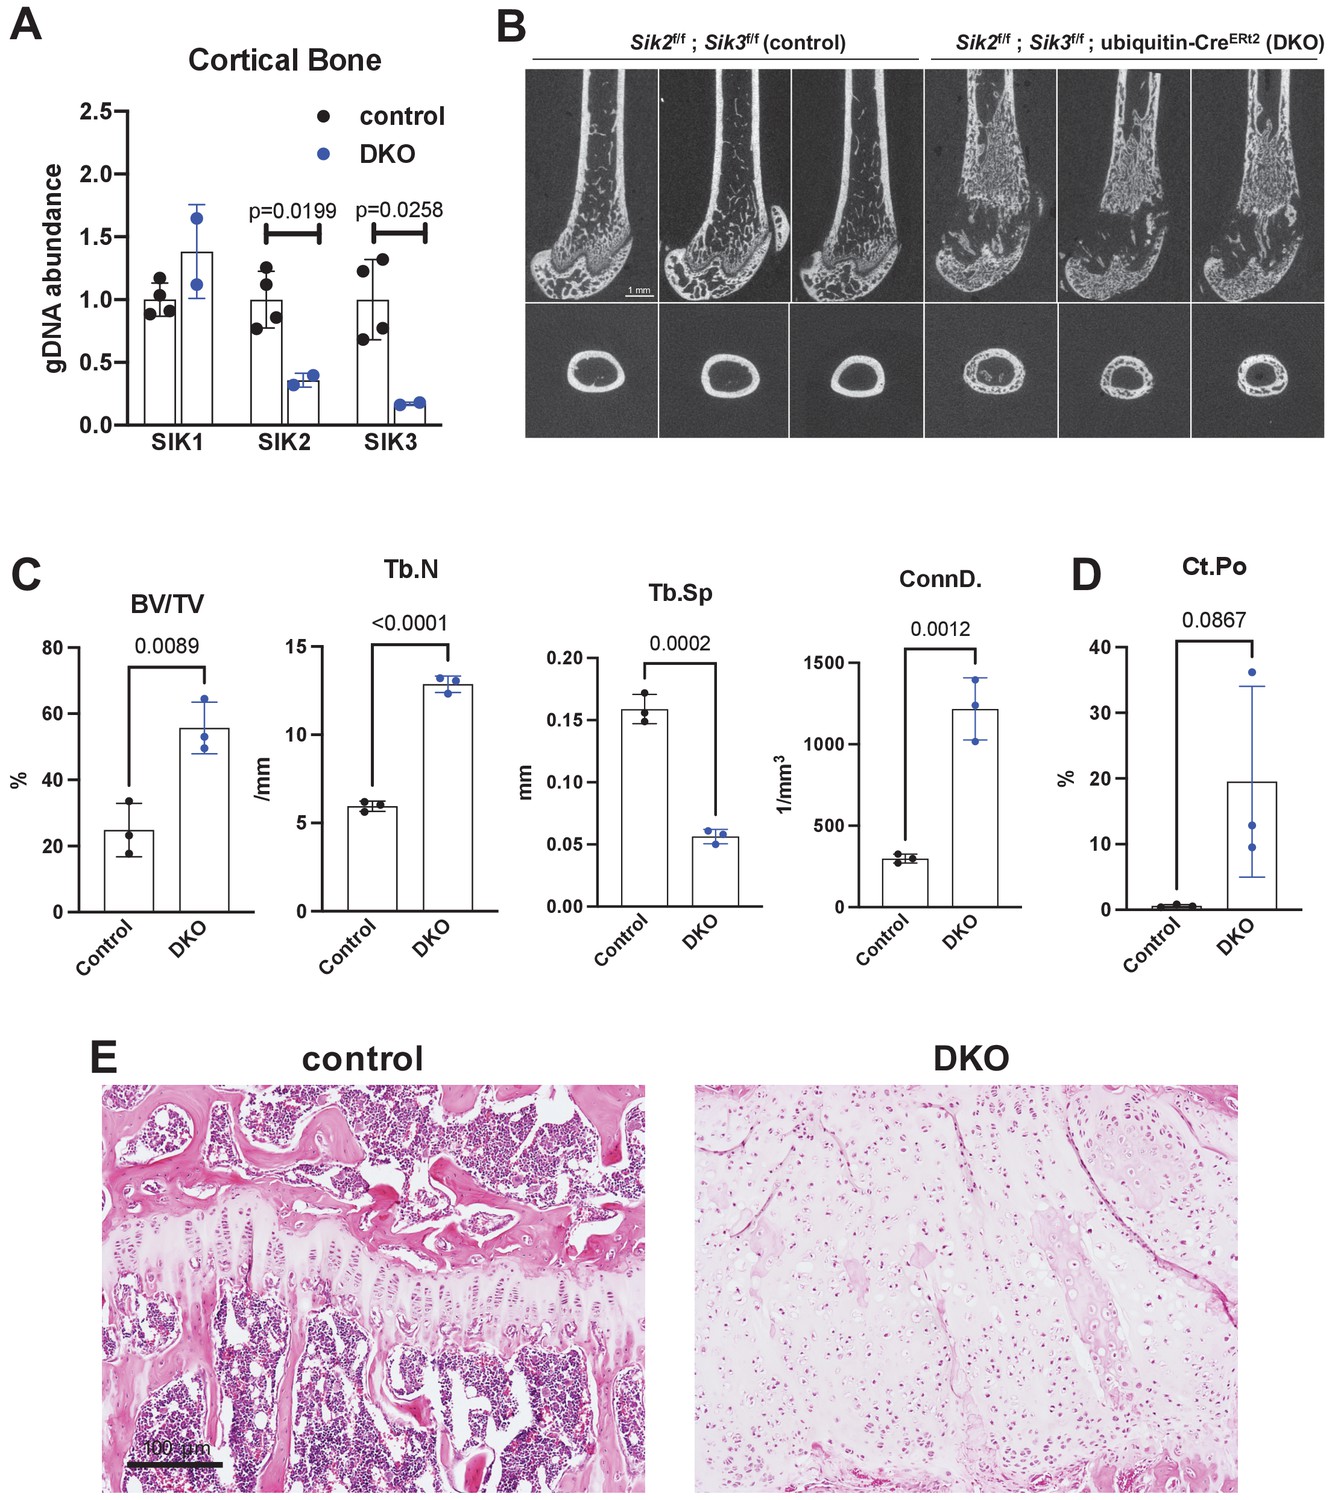
Postnatal onset global Sik2/3 deletion increases trabecular bone mass.
(A) 6 week old Sik2f/f; Sik3f/f (WT) or Sik2f/f; Sik3f/f; ubiquitin-CreERt2 (DKO) mice were treated with tamoxifen (1 mg by intraperitoneal injection, every other day, three doses total) and then sacrificed 14 days after the first tamoxifen injection. Cortical bone genomic DNA was isolated and SIK gene deletion was quantified. (B–D) 6 week old Sik2f/f; Sik3f/f (WT) or Sik2f/f; Sik3f/f; ubiquitin-CreERt2 (DKO) mice were treated with tamoxifen (1 mg, IP, Q48H, three doses total) and then sacrificed 21 days after the first tamoxifen injection. Micro-CT images (B) of the femur show increased trabecular bone mass in the secondary spongiosa, growth plate expansion, and increased cortical porosity. Micro-CT results are quantified in (C, D). N = 3 female mice of each genotype were studied. Also see Supplementary file 5 for all micro-CT parameters measured. (E) Tibiae from mice as in (B) were stained with hematoxylin and eosin. Representative photomicrographs of the growth plate are shown. Dramatic growth plate expansion and disorganization is observed in inducible Sik2/3 mutant mice, as also demonstrated in Supplementary file 5. Scale bar = 100 µm. All graphs show mean ± SD with each data point representing an individual experimental animal. See Source Data File for additional information.
Figure 3—figure supplement 1
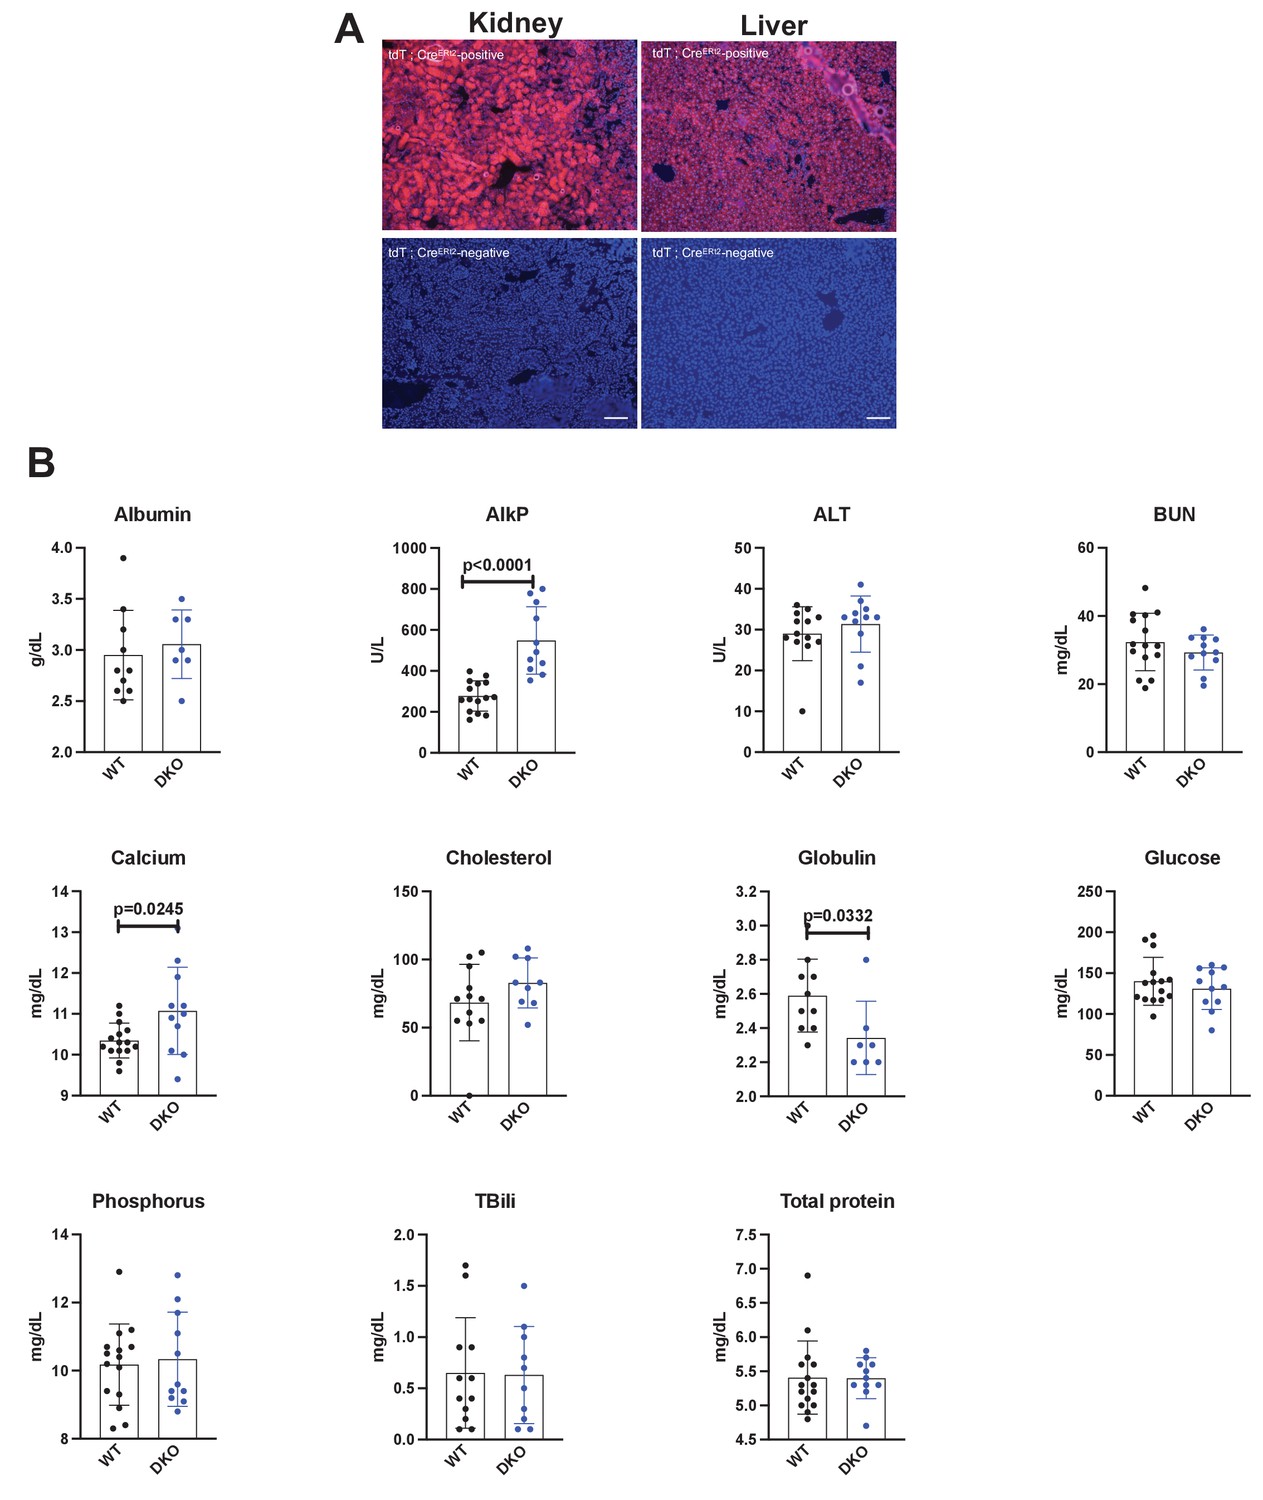
Efficacy and safety of global inducible Sik2/3 deletion.
(A) Ubiquitin-CreERt2 mice were crossed to tdTomato reporter (Ai14) animals. Six-week-old male mice were treated with tamoxifen (1 mg by intraperitoneal injection, every other day, three doses total) and then sacrificed 7 days after the first tamoxifen injection. Cryosections of the kidney and liver were analyzed for tdTomato fluorescence. Bottom panels show kidney and liver sections from ubiquitin-CreERt2 mice that are negative for the Ai14 reporter allele. (B) Sik2f/f; Sik3f/f (WT) and Sik2f/f; Sik3f/f; ubiquitin-CreERt2 (DKO) mice were treated with tamoxifen (1 mg by intraperitoneal injection, every other day, three doses total) starting at 6 weeks of age. Two weeks later (8 weeks of age), fasting serum was collected for analysis of the indicated parameters. p Values between groups were calculated by student’s t-test. All p values less than 0.05 are shown on individual graphs. Sik2/3 deletion in this model led to statistically significant increases in AlkP and calcium, and slight reduction in globulin levels. Notably, BUN and glucose were not increased by tamoxifen-induced ubiquitous Sik2/3 deletion. See Source Data File for additional information.
Figure 3—figure supplement 2
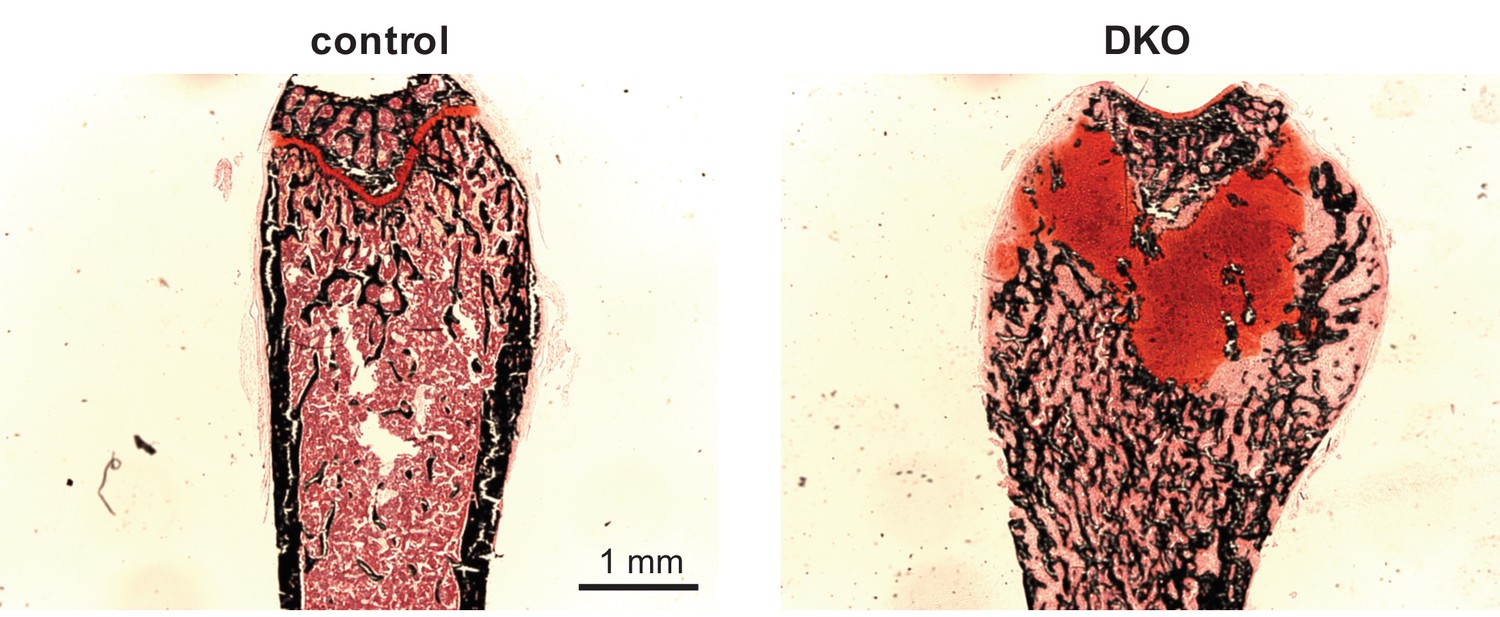
Growth plate defect induced by post-natal SIK2/3 deletion.
6 week old female Sik2f/f; Sik3f/f (WT) or Sik2f/f; Sik3f/f; ubiquitin-CreERt2 (DKO) mice were treated with tamoxifen (1 mg by intraperitoneal injection, every other day, three doses total) and then sacrificed 21 days after the first tamoxifen injection. Non-decalcified sections were obtained from the tibia which were stained with von Kossa (black) and safranin O (red). Dramatic growth plate expansion and disorganization is noted with inducible Sik2/3 deletion. See also Figure 3E.
Figure 3—figure supplement 3
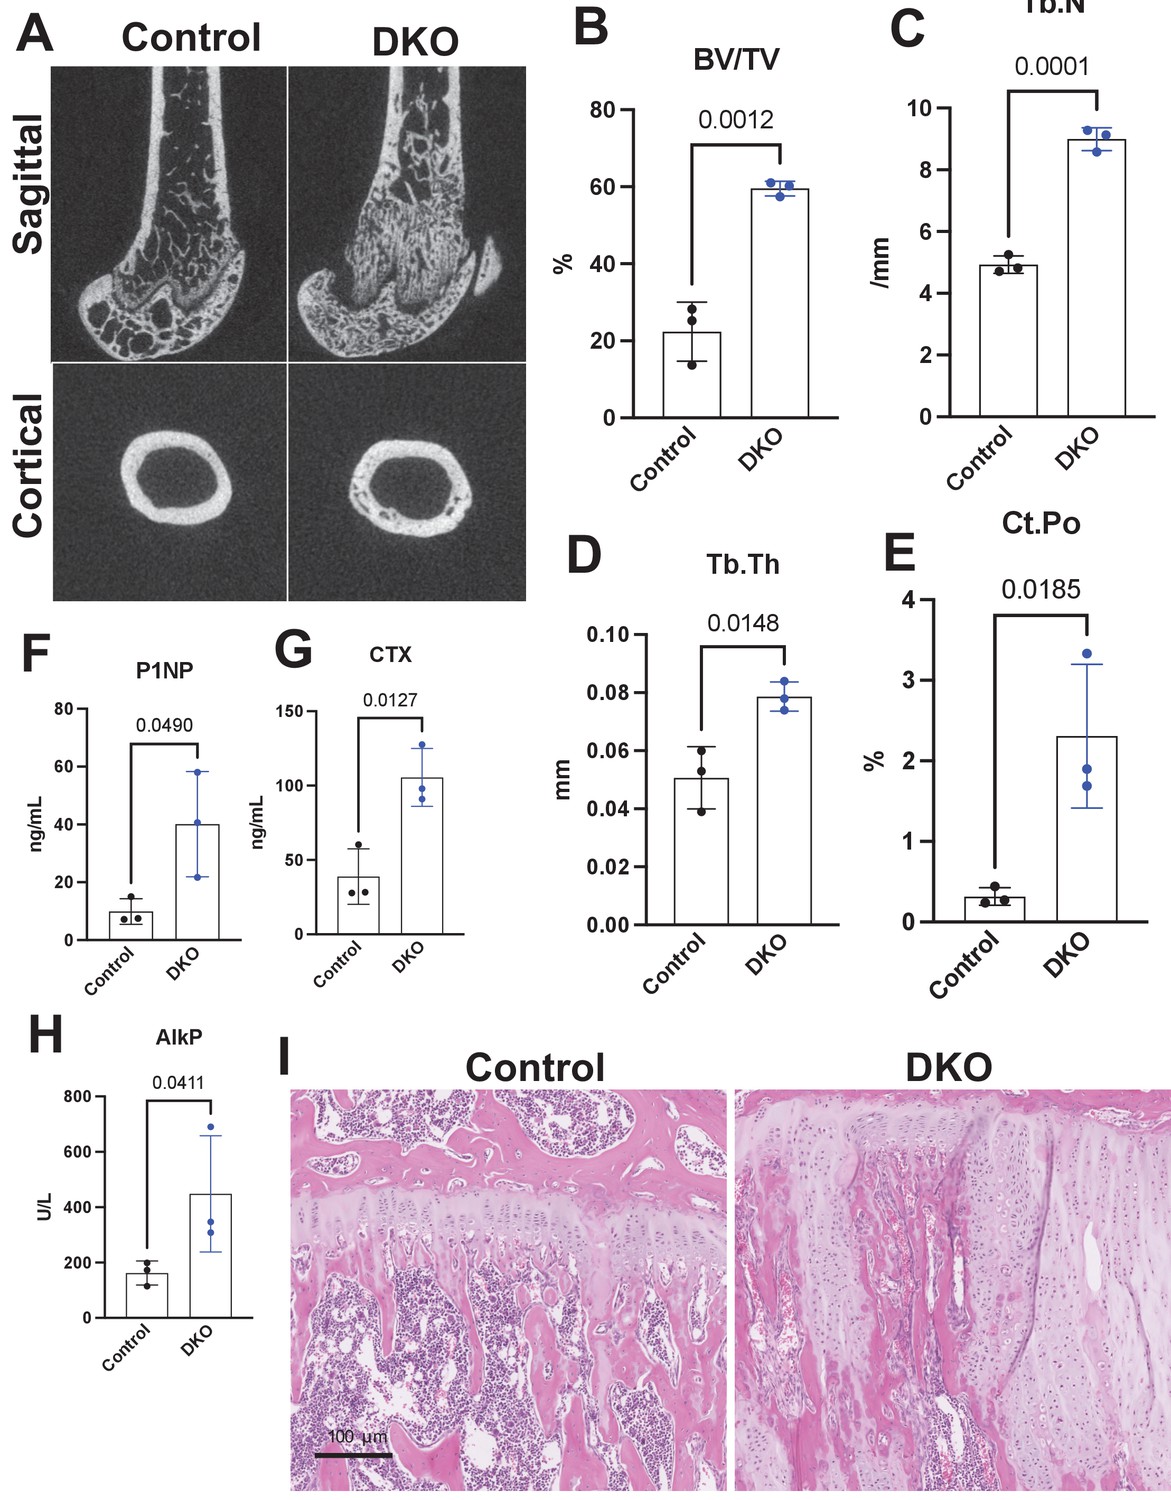
Adult-onset global Sik2/3 deletion increases trabecular bone mass.
(A) Twelve-week-old female Sik2f/f; Sik3f/f (control) or Sik2f/f; Sik3f/f; ubiquitin-CreERt2 (DKO) mice were treated with tamoxifen (1 mg by intraperitoneal injection, every other day, three doses total) and then sacrificed 4 weeks after the first tamoxifen injection. Representative micro-CT images are shown in (A) and quantified in (B–E). N = 3 female mice of each genotype were studied. (F–H) Fasting serum was collected from mice prior to sacrifice for measurement of bone turnover markers P1NP, CTX, and AlkP, all of which are significantly increased in mutants. (I) Tibiae from mice as in (A) were stained with hematoxylin and eosin. Representative photomicrographs of the growth plate are shown. Growth plate expansion and disorganization is observed in inducible Sik2/3 mutant mice along with increased trabecular bone and marrow stromal cells. Scale bar = 100 µm. See Source Data File for additional information.
Figure 3—figure supplement 4
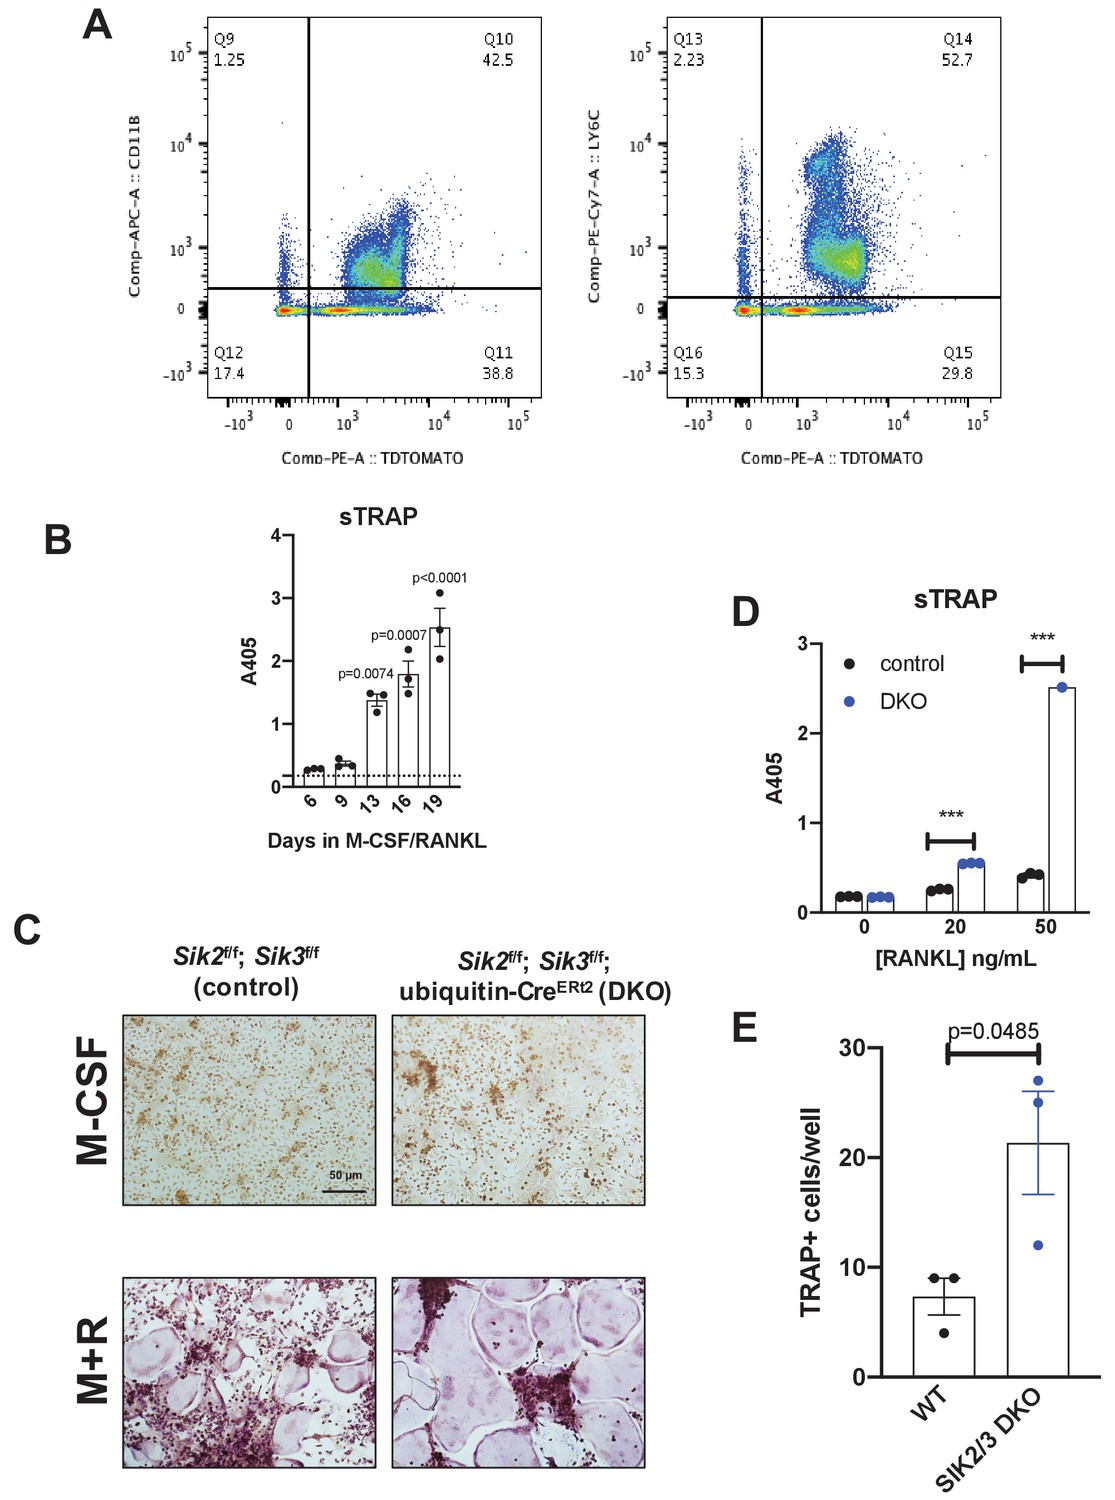
In vivo SIK2/3 deletion increases ex vivo osteoclast differentiation.
(A) Ubiquitin-CreERt2; Ai14 reporter mice (tdTomatoLSL) were treated with tamoxifen (1 mg by intraperitoneal injection, every other day, three doses total) starting at 6 weeks of age. Mice were sacrificed 2 weeks after the first tamoxifen dose and bone marrow cells were analyzed by flow cytometry. The majority (>90%) of myeloid lineage cells, as marked by CD11B (left) or LY6C (right), show evidence of CreERt2 activity as assessed by tdTomato protein. 97% of CD11B+ cells are tdTomato+, and 96% of LY6C+ cells are tdTomato+. (B) Bone marrow macrophages were grown in the presence of M-CSF plus RANKL for the indicated times. Culture supernatants were collected and secreted TRAP activity was measured over time. Robust osteoclast differentiation is noted after 10–14 days in these culture conditions. (C) Bone marrow cells were isolated from mice 2 weeks after in vivo tamoxifen administration as in (A). Bone marrow macrophages were isolated and grown in the presence of M-CSF alone (top) or M-CSF plus RANKL (M + R, bottom) followed by TRAP staining (purple). Cells isolated from DKO mice treated with tamoxifen in vivo show increased osteoclast differentiation. Scale bar = 50 µm (D) Culture supernatants from (C) were assessed for secreted TRAP activity. (E) TRAP-positive multinucleated cells from (C) treated with RANKL 50 ng/mL were quantified. See Source Data File for additional information.
Figure 4
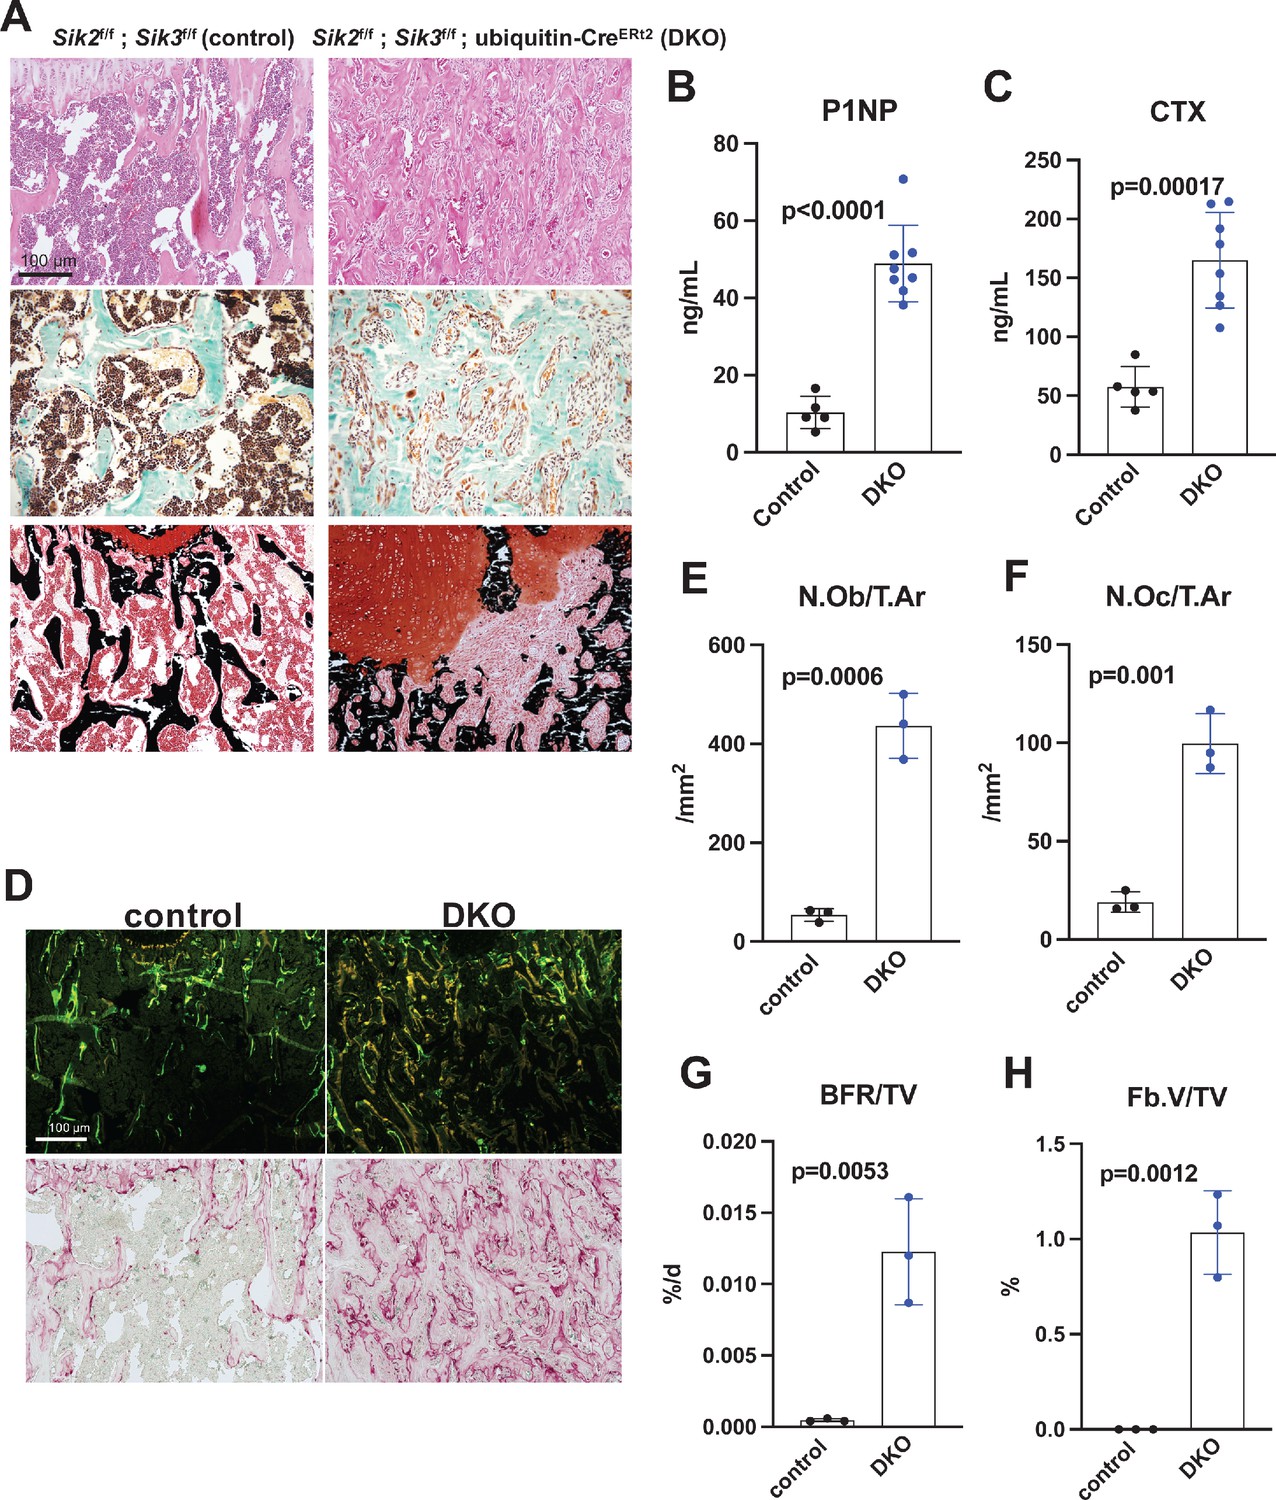
Postnatal onset global Sik2/3 deletion increases bone remodeling.
(A) 6 week old Sik2f/f; Sik3f/f (WT) or Sik2f/f; Sik3f/f; ubiquitin-CreERt2 (DKO) mice were treated with tamoxifen (1 mg by intraperitoneal injection, every other day, three doses total) and then sacrificed 21 days after the first tamoxifen injection. Representative photomicrographs of the proximal tibia are shown. Scale bar = 100 µm. Top panels show hematoxylin and eosin stains on decalcified paraffin-embedded sections revealing increased bone mass and marrow stromal cells in the secondary spongiosa in Sik2/3 DKO mice. Middle panels show trichrome stains demonstrating similar findings on non-decalcified sections used for histomorphometry. Bottom panel shows dual staining with von Kossa and safranin O to demonstrate increased trabecular bone mass, expansion of marrow stromal cells, and growth plate disorganization. Also see Supplementary file 5 for low power images of growth plate expansion in inducible Sik2/3 DKO mice. Results shown are representative images from n = 3 female mice per genotype. (B, C) Fasting serum from male mice treated as in (A) were measured for P1NP (bone formation marker) and CTX (bone resorption marker). Sik2/3 DKO mice show increases in both bone turnover markers. (D) Top panel, mice treated as in (A) were labeled with calcein and demeclocycline at 7 and 2 days prior to sacrifice. Dark field fluorescent images show increased labeling surfaces in Sik2/3 DKO animals. Bottom panel, decalcified paraffin sections from mice treated as in (A) were stained with TRAP (pink) to label osteoclasts. Sik2/3 DKO mice show dramatic increases in TRAP + cells present on bone surfaces. (E–H) Quantification of static and dynamic histomorphometry results from mice as in (A). N.Ob/T.Ar=osteoblast number per tissue area. N.Oc/T.Ar=osteoclast number per tissue area. BFR/TV = bone formation rate per tissue volume. Fb.V/TV = fibroplasia vol per tissue volume. See also Supplementary file 6 for complete histomorphometry data. See Source Data File for additional information.
Figure 5
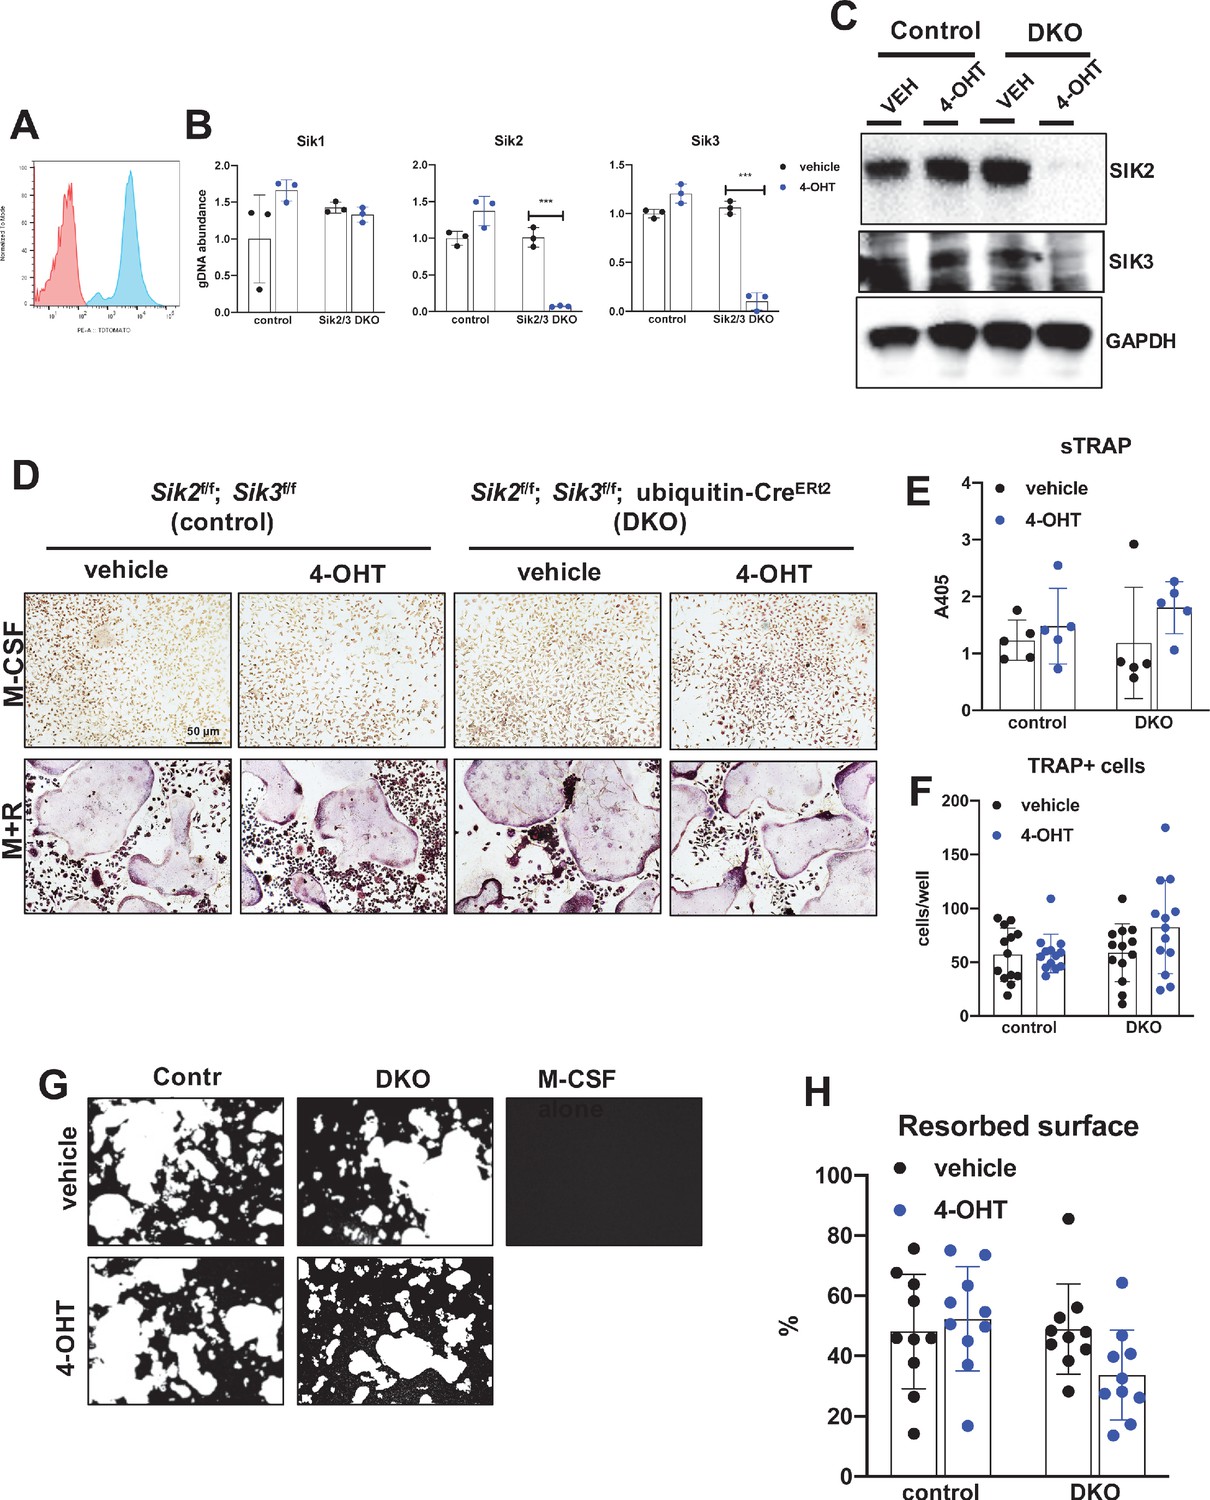
Deletion of SIK2 and SIK3 does not affect cell-autonomous osteoclast differentiation or function.
(A) Bone marrow macrophages from ubiquitin-CreERt2; Ai14 mice were treated with vehicle (red) or 4-hydroxytamoxifen (blue, 4-OHT, 300 nM) for 72 hr followed by flow cytometry. 4-OHT treatment induces in vitro ubiquitin-CreERt2 activity as measured by this sensitive reporter allele. (C) Bone marrow macrophages from control or DKO mice were treated as indicated followed by immunoblotting. 4-OHT treatment leads to robust deletion of SIK2 and SIK3 protein in DKO cells. (D, E, F) BMMs from control or DKO mice were treated with vehicle or 4-OHT and then subjected to in vitro osteoclast differentiation with M-CSF plus RANKL (M + R). 4-OHT treatment in DKO cells did not cause significant changes in osteoclast differentiation as assessed by morphology (D, scale bar = 50 µm), quantifying TRAP secretion (E), or counting TRAP-positive multi-nucleated cells (F). (G, H) Osteoclasts as in (D) were grown on hydroxyapatite-coated plates in the presence of M-CSF plus RANKL. After 7 days, resorption was measured by von Kossa staining. 4-OHT treatment of DKO cells did not affect resorbed surface. M-CSF treatment alone serves as a negative control to demonstrate that pit resorption in this assay is RANKL-dependent. All in vitro experiments were repeated three times. See Source Data File for additional information.
Figure 6 with 1 supplement
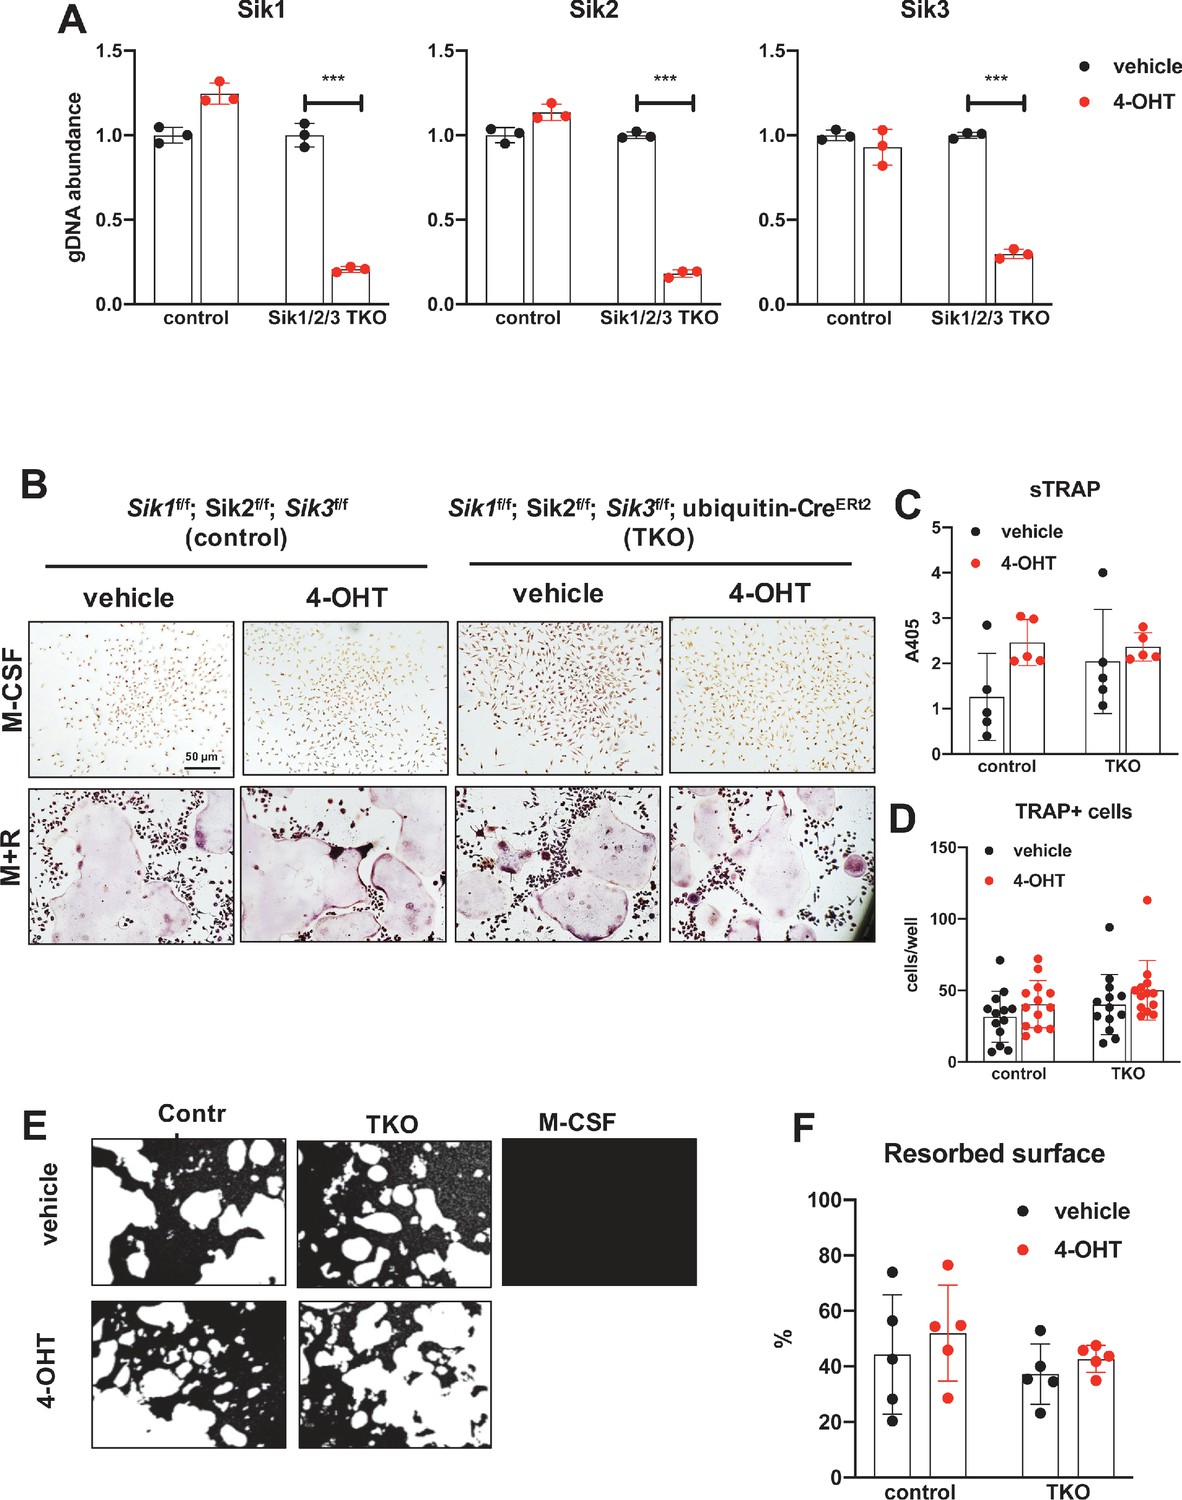
Deletion of SIK1, SIK2, and SIK3 does not affect cell-autonomous osteoclast differentiation or function.
(A) Bone marrow macrophages from ubiquitin-CreERt2; SIK1/2/3 floxed mice were treated with vehicle (blue) or 4-hydroxytamoxifen (red, 4-OHT, 300 nM) for 72 hr. Genomic DNA was isolated for qPCR-based assessment of SIK isoform deletion. (B, C, D) BMMs from control or TKO mice were treated with vehicle or 4-OHT and then subjected to in vitro osteoclast differentiation with M-CSF plus RANKL. 4-OHT treatment in TKO cells did not cause significant changes in osteoclast differentiation as assessed by morphology (B), quantifying TRAP secretion (C, scale bar = 50 µm), or counting TRAP-positive multi-nucleated cells (D). (E, F) Osteoclasts as in (B) were grown on hydroxyapatite-coated plates in the presence of M-CSF plus RANKL. After 7 days, resorption was measured by von Kossa staining. 4-OHT treatment of DKO cells did not affect resorbed surface. M-CSF treatment alone serves as a negative control to demonstrate that pit resorption in this assay is RANKL-dependent. All in vitro experiments were repeated three times. See Source Data File for additional information.
Figure 6—figure supplement 1
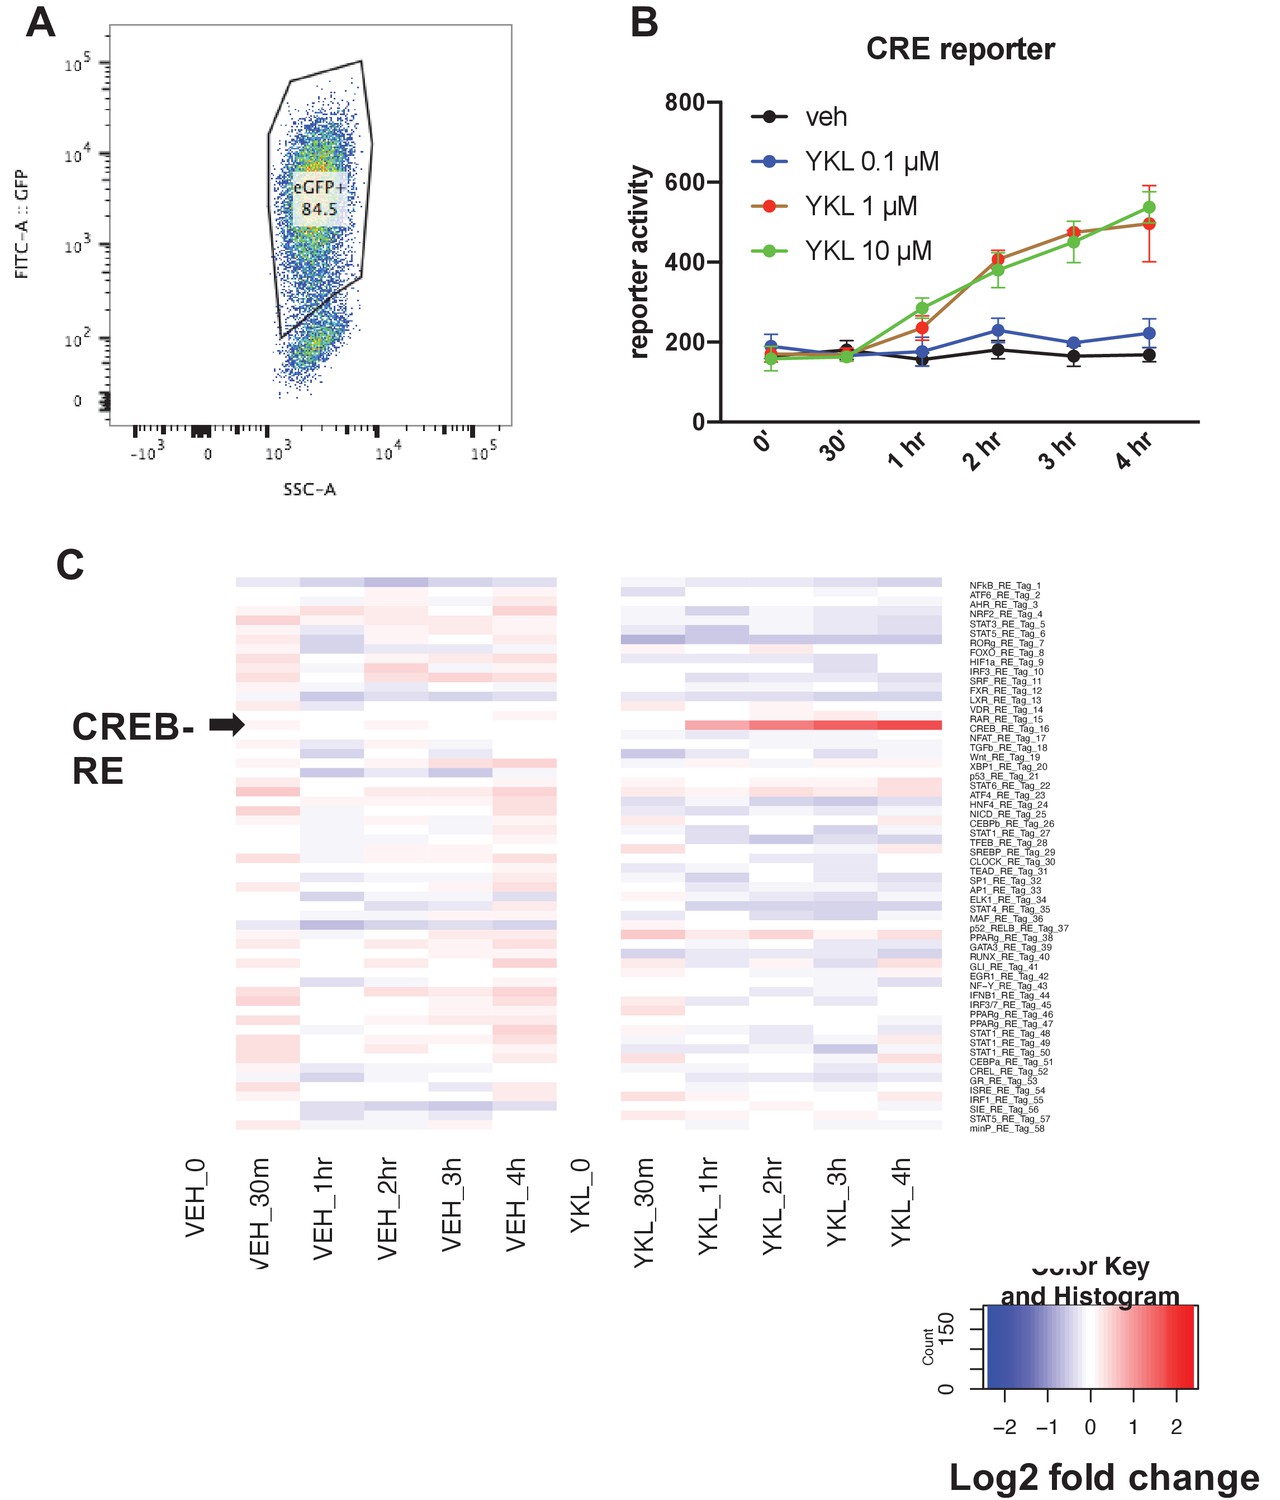
Parallel reporter assay (TF-seq) was used to determine the effects of YKL-05–099 on 58 reporter synthetic reporter elements.
(A) Ocy454 cells were infected with TF-seq lentiviral particles which co-express GFP using spin infection in the presence of polybrene (2 µg/ml). Infected cells were expanded and then subjected to flow cytometry. GFP + cells were sorted for subsequent experiments. (B) Sorted GFP +TF seq Ocy454 cells were treated with the indicated dose of YKL-05–099 or DMSO (vehicle) control for the indicated times. Cells were lysed and reporter element (RE) for each of the 58 elements was measured as detailed in the methods. Of the 58 elements tested, only CRE activity was significantly regulated by YKL-05–099 treatment. Panel B shows the effects of YKL-05–099 on CRE activity. (C) Heat map showing activity of all 58 reporter elements in response to vehicle or 10 µM YKL-05–099. Each row represents a distinct reporter element. Arrowhead (left) shows the row that corresponds to the CRE element. Color code shows log2 fold change relative to time zero. This TF-seq experiment was performed twice. See Source Data File for additional information.
Figure 7
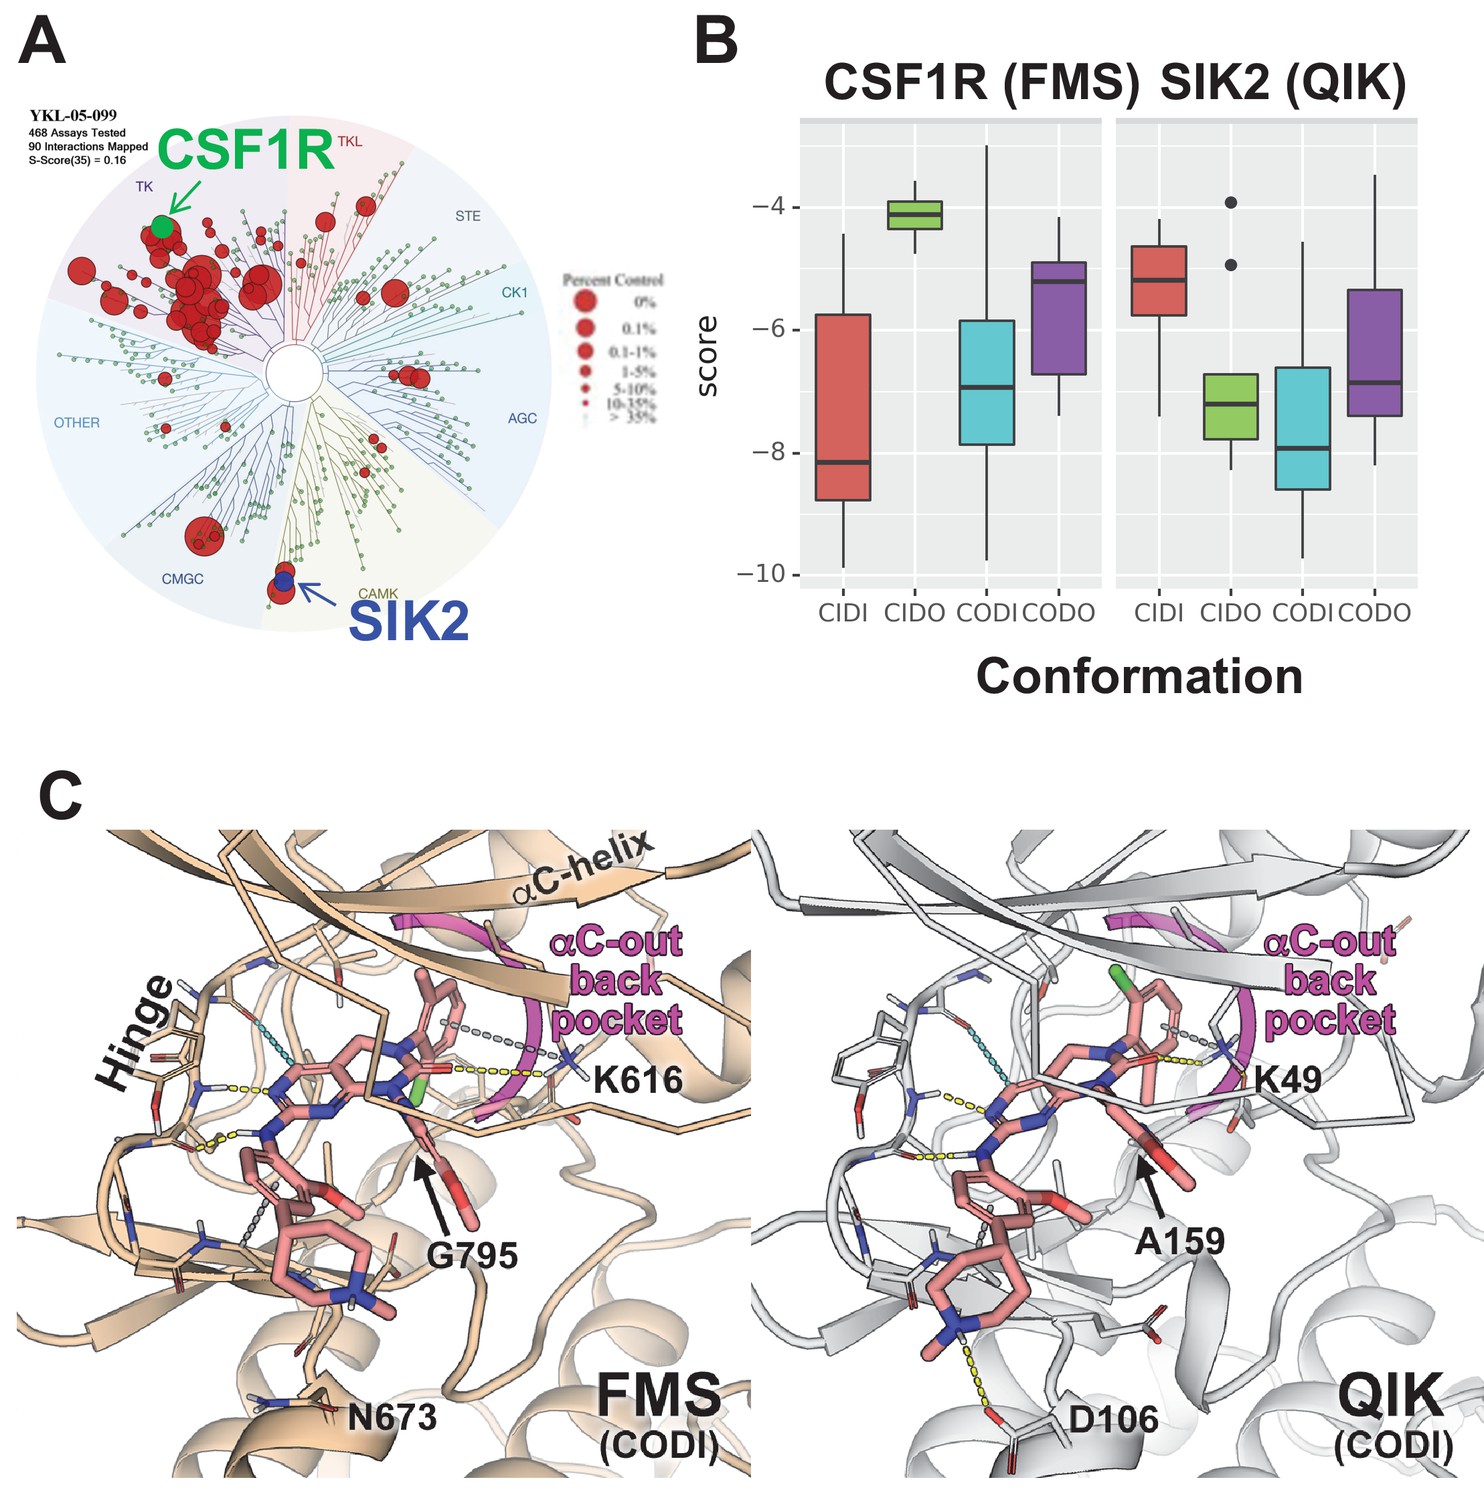
Modeling reveals YKL-05–099 preference for αC-out/DFG-in (CODI) conformation of CSF1R and SIK2.
(A) Dendrogram representation of previously published (Sundberg et al., 2016) kinome profiling data for YKL-05–099 tested at 1.0 µM. Red circles indicate kinases with active site binding to this compound. The position of CSF1R (green) and SIK2 (blue) are noted. (B) Docking scores for YKL-05–099 binding to the active site of four kinase conformation defined by the αC-helix and DFG-motif for CSF1R (left) and SIK2 (right). (C) Preferential docked pose of YKL-05–099 in the modeled αC-out/DFG-in (CODI) conformation of CSF1R (FMS) (left) and SIK2 (QIK) (right).
Figure 8 with 3 supplements
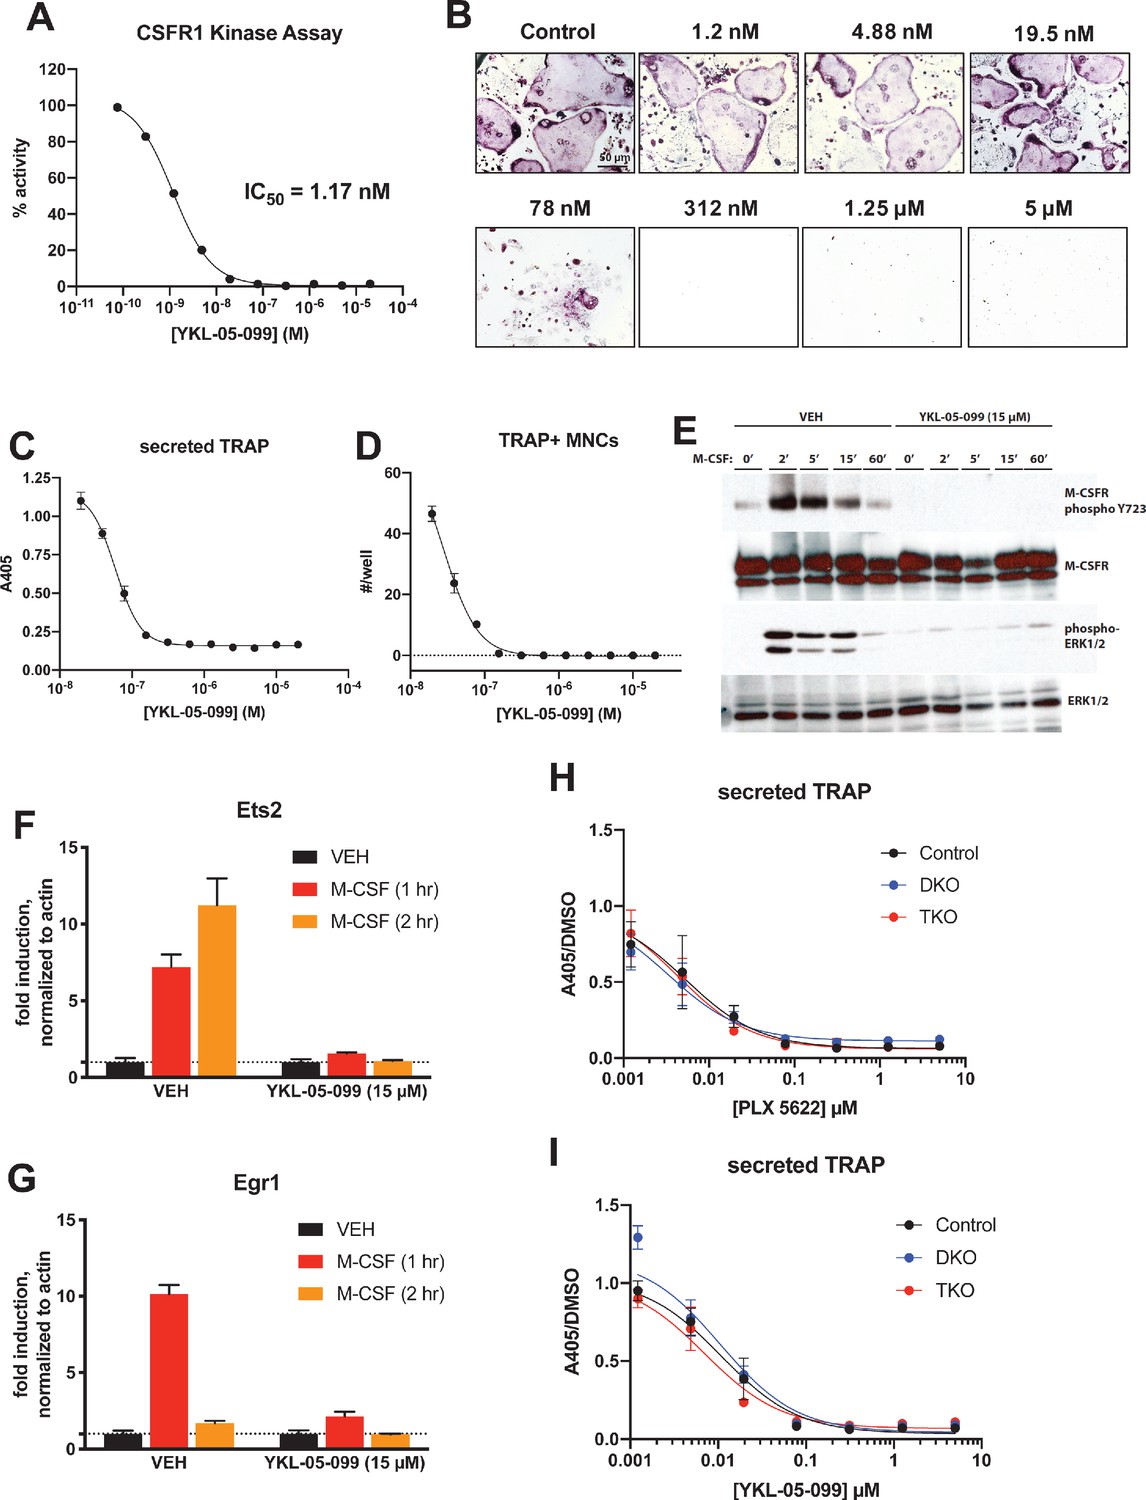
YKL-05–099 blocks M-CSF action.
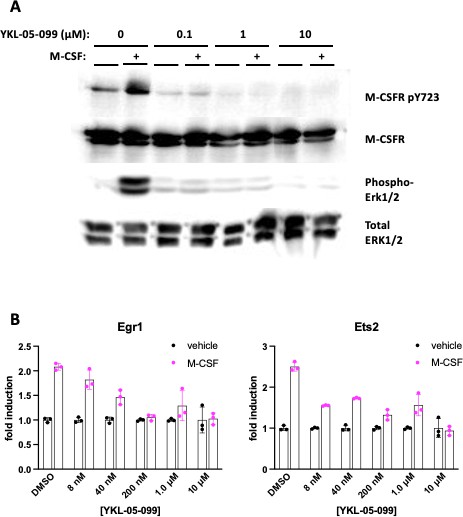
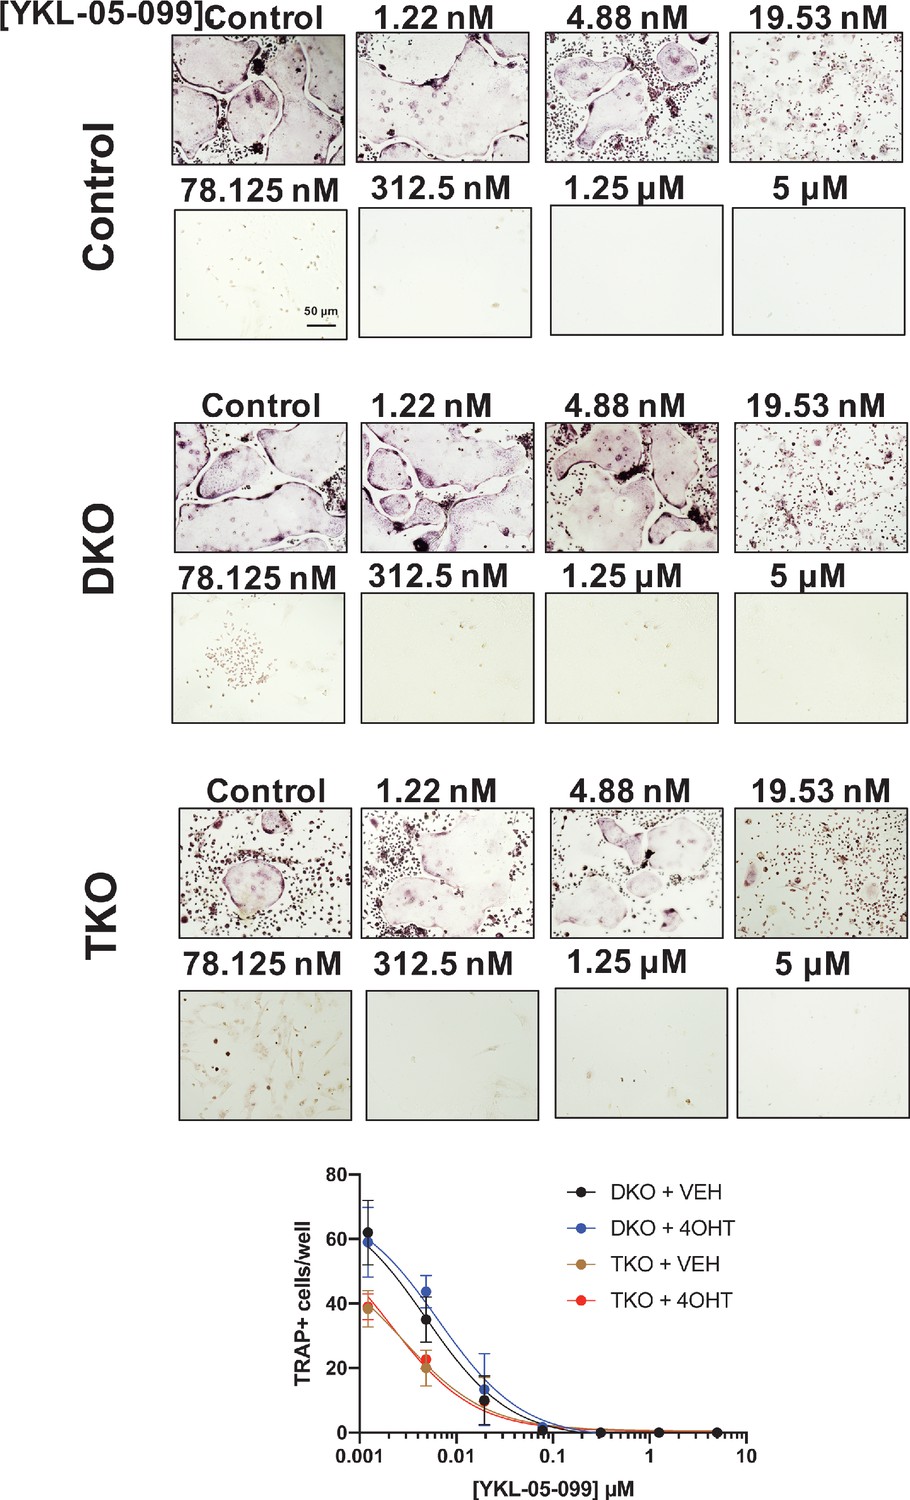
(A) CSF1R in vitro kinase assays were performed in the presence of increasing doses of YKL-05–099. This compound blocks CSF1R activity with an IC50 of 1.17 nM. (B) Murine bone-marrow-derived macrophages were grown in the presence of M-CSF, RANKL, and the indicated doses of YKL-05–099. After 3 days of differentiation, TRAP staining (purple) was performed. YKL-05–099 blocks osteoclast differentiation and causes cytotoxicity in these cultures (scale bar = 50 µm). (C) After three days of differentiation in the presence of M-CSF and RANKL, conditioned medium was collected and secreted TRAP assays were performed. YKL-05–099 treatment causes a dose-dependent reduction in TRAP secretion. Values indicate mean ± SD of n = 3 wells per condition. (D) After three days of differentiation in the presence of M-CSF and RANKL, TRAP staining was performed. The number of TRAP positive multinucleated cells (MNCs) per well of a 96-well plate (n = 3 wells/condition) is shown. (E) Murine bone marrow macrophages were grown in the presence of M-CSF for 5 days. Cells were then deprived of M-CSF for 6 hr, then pre-treated plus/minus YKL-05–099 (15 µM) for 60 min. Cells were then re-challenged with M-CSF (50 ng/ml) for the indicated times followed by immunoblotting. YKL-05–099 pre-treatment blocks M-CSF-induced M-CSFR autophosphorylation and ERK1/2 phosphorylation. (F, G) Cells as in (E) were challenged with M-CSF (50 ng/ml) for the indicated times, followed by RT-qPCR for the M-CSF target genes Ets2 and Egr1. YKL-05–099 pre-treatment blocks M-CSF-induced Ets2 and Egr1 up-regulation. (H, I) Bone marrow macrophages from ubiquitin-CreERt2; SIK2/3 (DKO) or ubiquitin-CreERt2; SIK1/2/3 (TKO) floxed mice were treated plus/minus 4-OHT as in Figures 5 and 6, then plated in M-CSF/RANKL plus the indicated doses of PLX-5622 (H) or YKL-05–099 (I) for 12 days followed by secreted TRAP assays (n = 6 wells from two independent experiments were assayed). In these plots, ‘control’ cells include BMMs from both DKO and TKO mice treated with vehicle prior to M-CSF/RANKL and inhibitor dose response. Irrespective of the cellular genotype, CSF1R inhibitor (PLX-5622 or YKL-05–099) treatment potently blocked osteoclast differentiation. All in vitro experiments were repeated three times. See Source Data File for additional information.
Figure 8—figure supplement 1
The dose response relationship of YKL-05–099 on M-CSF action in bone marrow macrophages.
Murine bone marrow macrophages were grown in the presence of M-CSF for 5 days. Cells were then deprived of M-CSF for 6 hr, then pre-treated ±the indicated doses of YKL-05–099 for 60 min. Cells were then re-challenged with M-CSF (50 ng/ml) followed by immunoblotting (A, 5 min M-CSF treatment) or RT-qPCR (B, 90 min M-CSF treatment). YKL-05–099 inhibits M-CSF action at sub-µM doses in both of these assays. All in vitro experiments were repeated twice. See Source Data File for additional information.
Figure 8—figure supplement 2

PLX-5622 blocks osteoclast differentiation in SIK mutant cells.
Bone marrow macrophages from ubiquitin-CreERt2; SIK2/3 (DKO) or ubiquitin-CreERt2; SIK1/2/3 (TKO) floxed mice were treated plus/minus 4-OHT and then were grown in the presence of M-CSF/RANKL plus the indicated doses of PLX-5622 for 12 days followed by TRAP staining. Representative photomicrographs from the indicated cells and drug concentration are shown. Scale bar = 50 µm. Bottom, quantification of TRAP +multinucleated cells. For each condition, n = 3 wells (96 well plate) were analyzed, error bars represent mean ± SD. PLX-5622 reduced numbers of TRAP +multinucleated cells irrespective of SIK genotype. All in vitro experiments shown here were performed three times. See Source Data File for additional information.
Figure 8—figure supplement 3
YKL-05–099 blocks osteoclast differentiation in SIK mutant cells.
Bone marrow macrophages from ubiquitin-CreERt2; SIK2/3 (DKO) or ubiquitin-CreERt2; SIK1/2/3 (TKO) floxed mice were treated plus/minus 4-OHT and then were grown in the presence of M-CSF/RANKL plus the indicated doses of YKL-05–099 for 12 days followed by TRAP staining. Representative photomicrographs from the indicated cells and drug concentration are shown. Scale bar = 50 µm. Bottom, quantification of TRAP +multinucleated cells. For each condition, n = 3 wells (96 well plate) were analyzed, error bars represent mean ± SD. YKL-05–099 reduced numbers of TRAP +multinucleated cells irrespective of SIK genotype. All in vitro experiments shown here were performed three times. See Source Data File for additional information.
Tables
Key resources table
| Reagent type (species) or resource | Designation | Source or reference | Identifiers | Additional information |
|---|---|---|---|---|
| Strain, strain background (Mus musculus C57BL/6) | Sik1 floxed | EUCOMM | RRID:MGI_6712189 | Both males and females were used |
| Strain, strain background (Mus musculus C57BL/6) | Sik2 floxed | EUCOMM | RRID:MGI_ 6712188 | Both males and females were used |
| Strain, strain background (Mus musculus C57BL/6) | Sik3tm1a(EUCOMM)Hmgu | EUCOMM | RRID:MGI_5085429 | Both males and females were used |
| Strain, strain background (Mus musculus C57BL/6) | PGK1-FLPo | The Jackson Laboratory | IMSR Cat# JAX:011065, RRID:IMSR_JAX:011065 | Both males and females were used |
| Strain, strain background (Mus musculus C57BL/6) | Ubc-CreERt2 | The Jackson Laboratory | IMSR Cat# JAX:008085, RRID:IMSR_JAX:008085 | Both males and females were used |
| Strain, strain background (Mus musculus C57BL/6) | Ai14 LSL-tdTomato reporter, Gt(ROSA)26Sor | The Jackson Laboratory | IMSR Cat# JAX:007914, RRID:IMSR_JAX:007914 | Both males and females were used |
| Strain, strain background (Mus musculus C57BL/6) | OVX-operated female C57BL/6 | The Jackson Laboratory | IMSR Cat# JAX:000664, RRID:IMSR_JAX:000664 | |
| Antibody | SIK2 (Rabbit monoclonal) | Cell Signaling Technology | Cat# 6919, RRID:AB_10830063 | WB (1:1000) |
| Antibody | Anti-SIK3 (Rabbit polyclonal) | Abcam | Cat# ab88495, RRID:AB_2042747 | WB (1:1000) |
| Antibody | Phospho-M-CSF Receptor Tyr723 (Rabbit monoclonal) | Cell Signaling Technology | Cat# 3155, RRID:AB_2085229 | WB (1:1000) |
| Antibody | CSF1R (Rabbit monoclonal) | Cell Signaling Technology | Cat# 67455, RRID:AB_2799725 | WB (1:1000) |
| Antibody | Phospho-ERK1/2 (Rabbit monoclonal) | Cell Signaling Technology | Cat# 4376, RRID:AB_331772 | WB (1:1000) |
| Antibody | ERK1/2 (Rabbit monoclonal) | Cell Signaling Technology | Cat# 4695, RRID:AB_390779 | WB (1:2000) |
| Antibody | Tubulin (Rabbit monoclonal) | Cell Signaling Technology | Cat# 2128, RRID:AB_823664 | WB (1:1000) |
| Antibody | APC anti-mouse/human CD11b antibody | BioLegend | Cat# 101211, RRID:AB_312794 | FC (1:50) |
| Antibody | FITC anti-mouse CD3 antibody | BioLegend | Cat# 100305, RRID:AB_312670 | FC (1:33) |
| Antibody | PE/Cy7 anti-mouse Ly-6C antibody | BioLegend | Cat# 128017, RRID:AB_1732093 | FC (1:75) |
| Antibody | Anti-rabbit IgG, HRP-linked antibody | Cell Signaling Technology | Cat# 7074, RRID:AB_2099233 | WB (1:2500) |
| Commercial assay or kit | pro-collagen type 1 N-terminal peptide (P1NP) | IDS Immunodiagnostic Systems | Cat# AC-33F1, RRID:AB_2801263 | |
| Commercial assay or kit | carboxy-terminal telopeptide of type I collagen (CTX) | IDS Immunodiagnostic Systems | Cat# AC-06F1, RRID:AB_2801265 | |
| Commercial assay or kit | Acid phosphatase leukocyte kit | Sigma-Aldrich | Cat# 387A-1KT | |
| Commercial assay or kit | DNeasy Blood and Tissue Kit | Qiagen | Cat# 69504 | |
| Chemical compound, drug | (Z)−4-Hydroxytamoxifen | Sigma-Aldrich | Cat# H7904-5MG | |
| Chemical compound, drug | Tamoxifen | Sigma-Aldrich | Cat# T5648 | |
| Chemical compound, drug | Methanol BioReagent | Sigma-Aldrich | Cat# 494437–1L | |
| Chemical compound, drug | Dimethyl sulfoxide | Sigma-Aldrich | Cat# D8418-100ML | |
| Chemical compound, drug | Sodium L-tartrate dibasic dihydrate | Sigma-Aldrich | Cat# 228729–100G | |
| Chemical compound, drug | Phosphatase substrate | Sigma-Aldrich | Cat# SRE0026 | |
| Chemical compound, drug | Acetone | VWR | Cat# E6460500mL | |
| Chemical compound, drug | 140 Proof Pure Ethanol | Koptec | Cat# UN1170 | |
| Chemical compound, drug | Formaldehyde 37% by weight with preservative | Fisher Chemical | Cat# F79-500 | |
| Chemical compound, drug | phosphatase inhibitor cocktail | Thermo Fisher Scientific | Cat# 78440 | |
| Chemical compound, drug | PLX5622 | MCE MedChemExpress | Cat# HY-114153 | |
| Chemical compound, drug | Calcein | Sigma-Aldrich | Cat# C0875-5G | |
| Chemical compound, drug | Demeclocycline hydrochloride | Sigma-Aldrich | Cat# D6140-1G | |
| Peptide, recombinant protein | Recombinant mouse RANKL | R and D systems | Cat# 462-TEC-010 | |
| Peptide, recombinant protein | Recombinant mouse M-CSF | R and D systems | Cat# 416 ML-050 | |
| Peptide, recombinant protein | Recombinant CSFR1 | Invitrogen | Cat# PV3249 | |
| Software, algorithm | HeskaView Integrated software | Heska | ||
| Software, algorithm | FlowJo | BD Biosciences | RRID:SCR_008520 | |
| Software, algorithm | ImageJ | PMID:22930834 | NIH Image, RRID:SCR_003073 | |
| Software, algorithm | Prism 8.0 | GraphPad Software | RRID:SCR_002798 | |
| Other | Bio-Rad Protein Assay Dye Reagent Concentrate | Bio-Rad | Cat# 5000006 | |
| Other | Pierce ECL Plus Western Blotting Substrate | Thermo Scientific | Cat# 32132 | |
| Other | Maxima reverse transcriptase | Thermo Fisher Scientific | Cat# EP0742 | |
| Other | Sunflower oil | Sigma-Aldrich | Cat# 88921–250 ML-F | |
| Other | Red blood cell lysis buffer | Sigma-Aldrich | Cat# R7757-100mL | |
| Other | 0.05% Trypsin-EDTA (1x) | Gibco | Cat# 25300–062 |
Additional files
-
Source data 1
Source data for all figures.
- https://cdn.elifesciences.org/articles/67772/elife-67772-data1-v2.xlsx
-
Supplementary file 1
µCT results from ovariectomy study.
- https://cdn.elifesciences.org/articles/67772/elife-67772-supp1-v2.xlsx
-
Supplementary file 2
Mechanical testing results from ovariectomy study.
- https://cdn.elifesciences.org/articles/67772/elife-67772-supp2-v2.xlsx
-
Supplementary file 3
Histomorphometry measurements from ovariectomy study.
- https://cdn.elifesciences.org/articles/67772/elife-67772-supp3-v2.xlsx
-
Supplementary file 4
Quantitative backscatter electron imaging results from ovariectomy study.
- https://cdn.elifesciences.org/articles/67772/elife-67772-supp4-v2.xlsx
-
Supplementary file 5
µCT results from control and Sik2/3 DKO mice.
- https://cdn.elifesciences.org/articles/67772/elife-67772-supp5-v2.xlsx
-
Supplementary file 6
Histomorphometry measurements from control and Sik2/3 DKO mice.
- https://cdn.elifesciences.org/articles/67772/elife-67772-supp6-v2.xlsx
-
Supplementary file 7
Sequence of PCR primers.
- https://cdn.elifesciences.org/articles/67772/elife-67772-supp7-v2.xlsx
-
Transparent reporting form
- https://cdn.elifesciences.org/articles/67772/elife-67772-transrepform-v2.docx
Download links
A two-part list of links to download the article, or parts of the article, in various formats.
Downloads (link to download the article as PDF)
Open citations (links to open the citations from this article in various online reference manager services)
Cite this article (links to download the citations from this article in formats compatible with various reference manager tools)
Dual targeting of salt inducible kinases and CSF1R uncouples bone formation and bone resorption
eLife 10:e67772.
https://doi.org/10.7554/eLife.67772


