Tissue-specific targeting of DNA nanodevices in a multicellular living organism
- Department of Chemistry, The University of Chicago, United States
- Grossman Institute of Neuroscience, Quantitative Biology and Human Behavior, The University of Chicago, United States
- Department of Neurobiology, The University of Chicago, United States
- Recombinant Antibody Platform (TAb-IP), Institut Curie, PSL Research University, CNRS UMR144, France
- Cell Biology and Cancer Unit, Institut Curie, PSL Research University, CNRS UMR144, France
- Department of Biological Sciences, Tata Institute of Fundamental Research, India
Figures
Figure 1
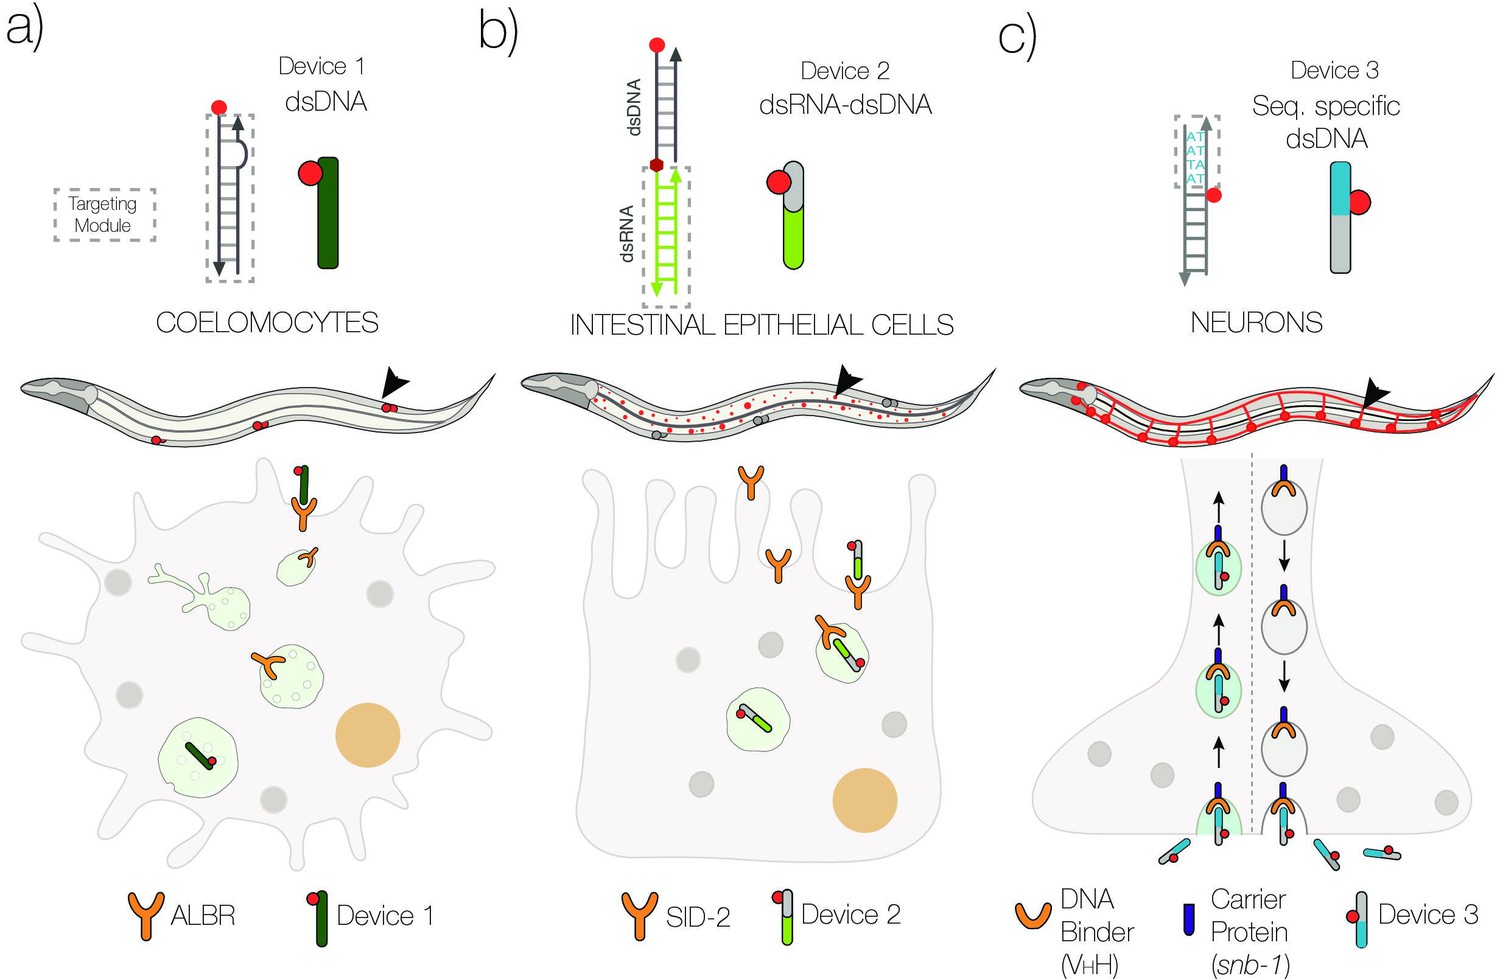
Schematic of strategies to target DNA devices to different cell types.
(a) DNA nanodevices are intrinsically targeted to coelomocytes via the endogenously expressed scavenger receptors. (b) DNA nanodevices that display a dsRNA (green) domain are targeted to intestinal epithelial cells by engaging endogenously expressed SID-2 receptors. (c) DNA nanodevices are targeted selectively to neurons that express a DNA-binding protein (VHH) fused to synaptobrevin-1 (snb-1). The DNA nanodevice has a sequence (blue) recognized specifically by VHH.
Figure 2 with 1 supplement

DNA nanodevices are targeted to intestinal epithelial cells (IECs).
(a) Table of the composition and length of the various Alexa647 labeled DNA nanodevices used. (b) Mean Alexa647 fluorescence intensity corresponding to the uptake of the indicated nanodevice in C. elegans IECs. (c) Representative fluorescence and DIC images of IECs labeled with the indicated R100-conjugated nanodevice quantified in (d). (e) Representative fluorescence images of IECs labeled with nanodevice R100D50 in the indicated genetic background quantified in (f). Data represented as mean ± standard error of the mean of 10 worms, ~500 endosomes. The four IECs closest to the pharynx were considered for quantification. Scale bar = 10 μm.
-
Figure 2—source data 1
Quantitation of uptake of nanodevices by IECs.
- https://cdn.elifesciences.org/articles/67830/elife-67830-fig2-data1-v2.xlsx
-
Figure 2—source data 2
Quantitation of uptake of R100 conjugated nanodevices by IECs.
- https://cdn.elifesciences.org/articles/67830/elife-67830-fig2-data2-v2.xlsx
-
Figure 2—source data 3
Quantitation of uptake of R100D50 nanodevices by IECs in various genetic backgrounds.
- https://cdn.elifesciences.org/articles/67830/elife-67830-fig2-data3-v2.xlsx
Figure 2—figure supplement 1

Uptake of nucleic acid probes in the intestinal epithelial cells.
(a) Schematic showing protocol of synthesis of azide labeled RNA for R50 and R100 strands. (b) The conjugation of Alexa 647 was confirmed by gel electrophoresis for R50. The 8% native PAGE gel was imaged in the EtBr channel and Alexa 647 channel (red box). (c) The conjugation of R100 (lane 2) with D38 (lane 3) to form R100 D38 (lane 4) was confirmed by gel electrophoresis. The 15% native PAGE gel was imaged in the EtBr channel. (d) Representative images of colocalization between lysosome-related organelle (LRO) markers (LMP1::GFP and GLO-1::GFP) and R50 D38 fluorophore labeled nucleic acid probes in intestinal epithelial cells. (e) Pearson’s correlation coefficient (PCC) for colocalization between R50 D38 (red) and LRO markers (green) in indicated transgenics. To test whether our Rn Dn devices localized in LROs, we performed colocalization experiments in transgenic worms expressing fluorescently labeled lysosomal markers LMP1::GFP or GLO-1::GFP that label lysosomes and LROs, respectively. Transgenics were incubated in a solution of 1 μM R100 D38 for 2 hr. Worms were then washed and incubated on OP50 plates for 1 hr for clearing their intestine lumens of excess R100 D38. Our experiments revealed that R100 D38 and LMP1::GFP showed high colocalization, indicating that the nanodevices labeled LROs. Similarly, R100 D38 and GLO-1::GFP also colocalized. However, there was lower uptake into the IECs and poorer clearance of the gut lumen in GLO-1::GFP transgenic worms.
-
Figure 2—figure supplement 1—source data 1
Pearson’s correlation coefficient (PCC) for colocalization between Rn Dn and LRO markers.
- https://cdn.elifesciences.org/articles/67830/elife-67830-fig2-figsupp1-data1-v2.xlsx
Figure 3 with 4 supplements
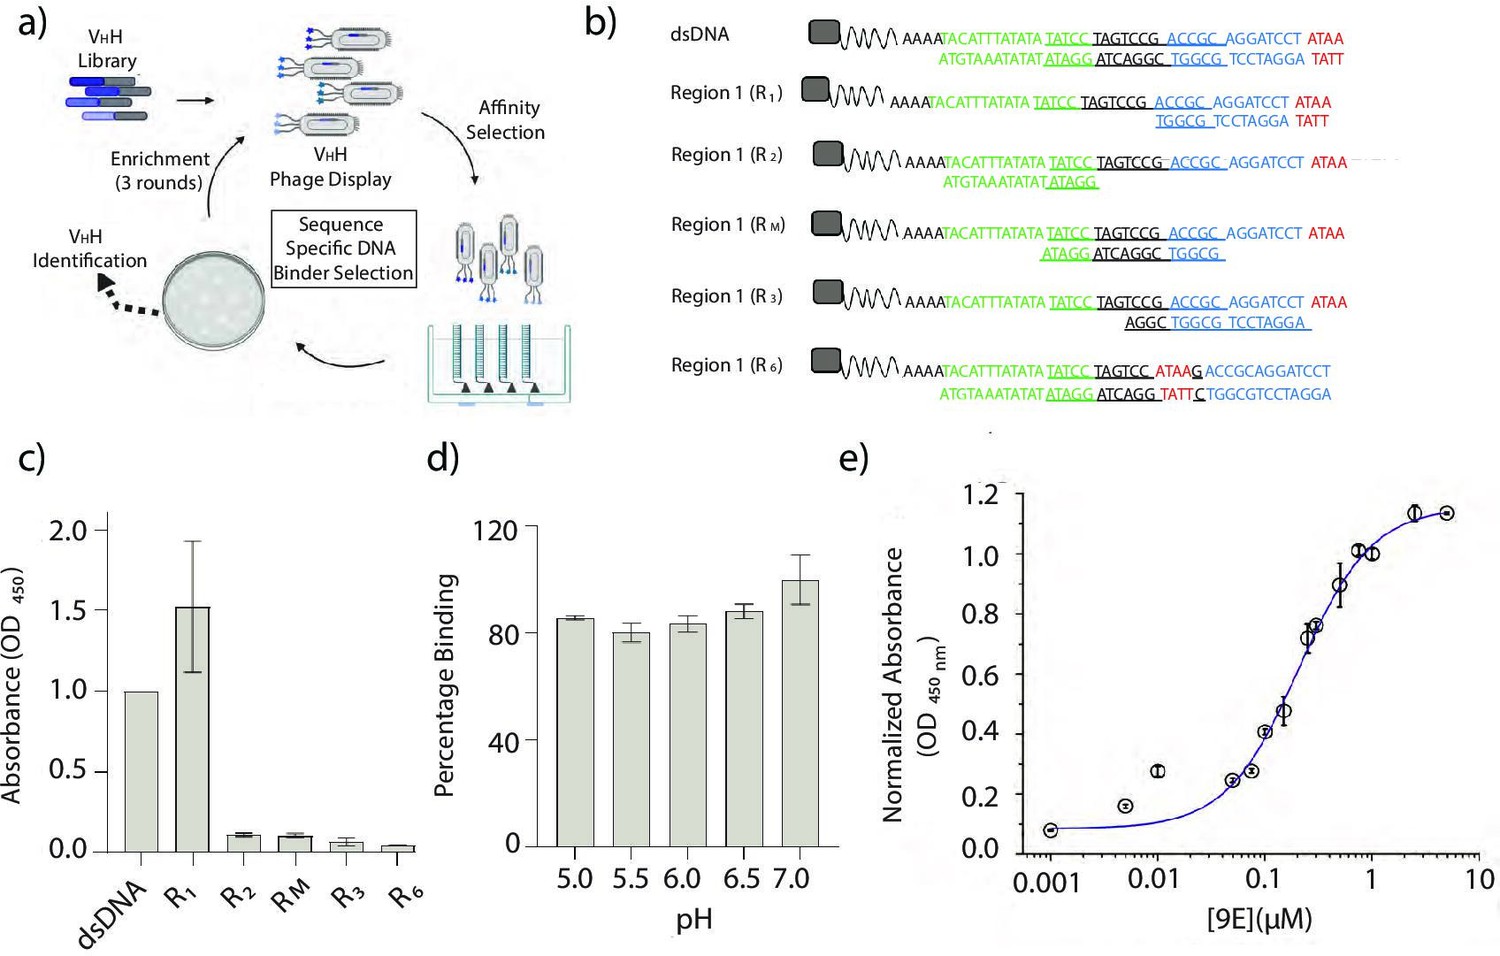
Identification and characterization of a sequence-specific DNA-binding recombinant antibody 9E.
(a) Schematic of phage display screen to identify DNA binders using a humanized VHH antibody library. (b) Sequence of the various dsDNA epitopes used to pinpoint the dsDNA sequence bound by the recombinant antibody, 9E. The tested regions are R1 (blue and red), R2 (green), an overlapping region RM (italicized and underlined), R3 (region R1 frame-shifted by a window of 4 nt), and R6 (4-nt motif in red, present in the middle of the DNA duplex). Biotin (gray square) was incorporated to immobilize the DNA epitopes on streptavidin-coated magnetic beads. (c) Binding efficiencies of the recombinant antibody 9E with the indicated dsDNA constructs as determined by ELISA. (d) Effect of pH on binding efficiency of 9E with dsDNA as determined by ELISA. (e) The relative binding constant of 9E and dsDNA epitope in solution. Serial dilutions of the purified protein were added to a fixed amount of immobilized dsDNA (25 pmoles). All experiments were performed in triplicate, and the data is represented as mean ± s.e.m.
-
Figure 3—source data 1
Binding efficiencies of the recombinant antibody 9E with dsDNA.
- https://cdn.elifesciences.org/articles/67830/elife-67830-fig3-data1-v2.xlsx
-
Figure 3—source data 2
Effect of pH on binding efficiencies.
- https://cdn.elifesciences.org/articles/67830/elife-67830-fig3-data2-v2.xlsx
-
Figure 3—source data 3
Relative binding constant of 9E and dsDNA.
- https://cdn.elifesciences.org/articles/67830/elife-67830-fig3-data3-v2.xlsx
Figure 3—figure supplement 1
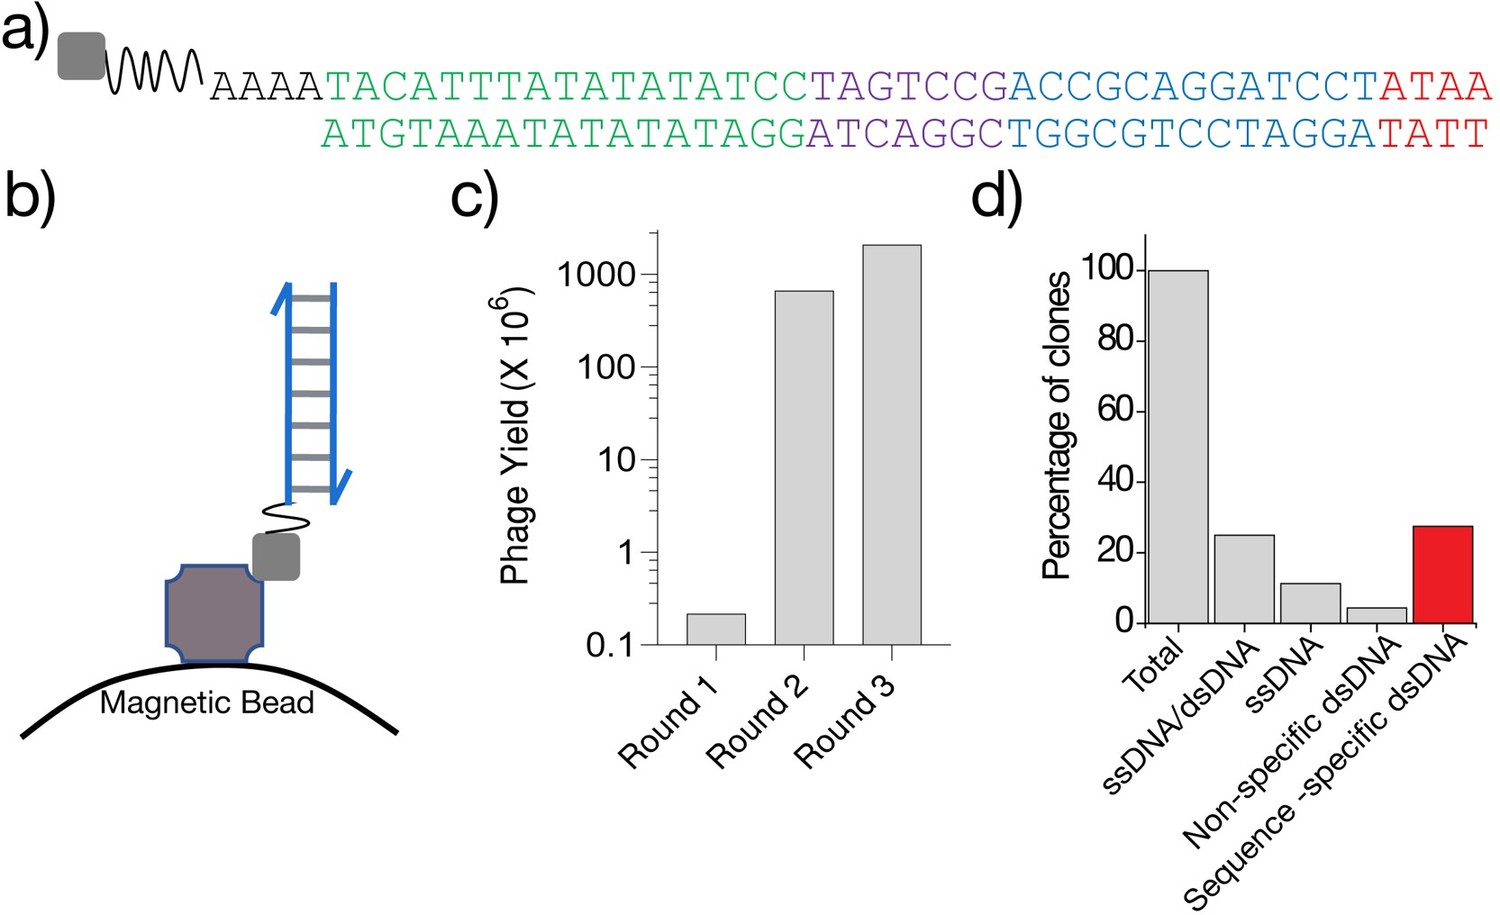
Analysis of recombinant antibody binders of adsDNA epitope.
(a) Sequence of the biotin-labeled dsDNA epitope used for the phage display screen. (b) The epitope was immobilized via biotin (gray square) on streptavidin-conjugated magnetic beads. (c) Yield of the phages after each round of selection, calculated as described in Materials and methods. (d) Percentage of VHH clones obtained that bound the indicated epitope and their sequence specificity.
-
Figure 3—figure supplement 1—source data 1
Yield of the phages after each round of selection.
- https://cdn.elifesciences.org/articles/67830/elife-67830-fig3-figsupp1-data1-v2.xlsx
Figure 3—figure supplement 2

Characterization of dsDNA‐binding VHH antibodies.
(a) Schematic of the dsDNA constructs used to find the minimal dsDNA‐binding motif. All sequence details are provided in Supplementary file 1. Epitopes were immobilized on streptavidin-conjugated magnetic beads via biotin (gray square). Relative binding of a few representative dsDNA‐binding VHH antibodies to (b) duplexes R1, R2, and RM, (c) duplexes R3,R4, and R5 , and (d) duplex R6 . All ELISA experiments were performed in triplicate, and errors are presented as mean ± s.e.m.
-
Figure 3—figure supplement 2—source data 1
Relative binding of VHH antibodies to duplexes R1, R2, and RM.
- https://cdn.elifesciences.org/articles/67830/elife-67830-fig3-figsupp2-data1-v2.xlsx
-
Figure 3—figure supplement 2—source data 2
Relative binding of VHH antibodies to duplexes R3,R4, and R5.
- https://cdn.elifesciences.org/articles/67830/elife-67830-fig3-figsupp2-data2-v2.xlsx
-
Figure 3—figure supplement 2—source data 3
Relative binding of VHH antibodies to duplex R6.
- https://cdn.elifesciences.org/articles/67830/elife-67830-fig3-figsupp2-data3-v2.xlsx
Figure 3—figure supplement 3
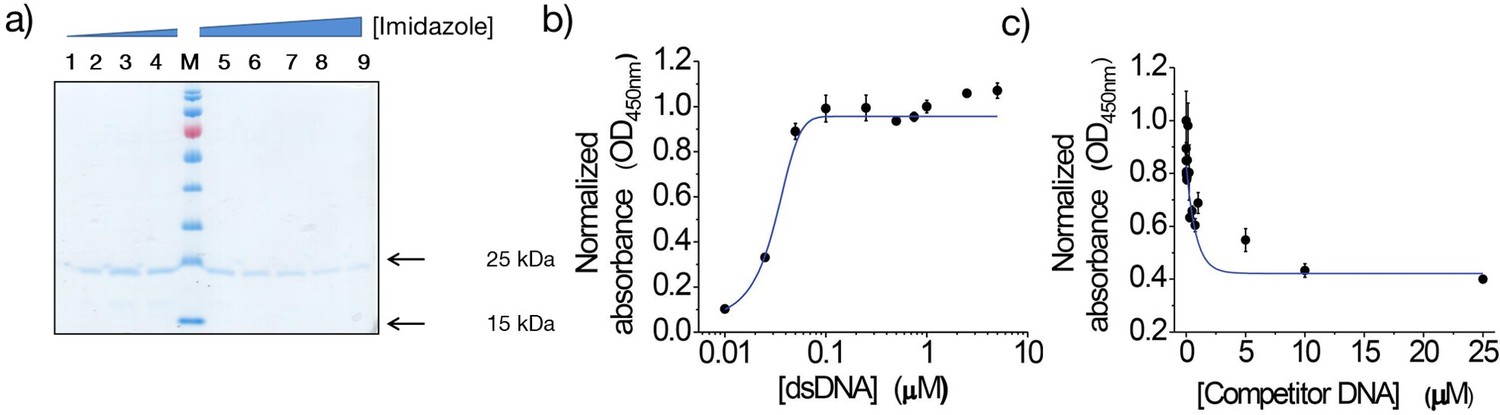
Characterization of 9E.
(a) Purification of the dsDNA-binding 9E. Clone 9E was expressed and purified as described in Materials and methods, and the fractions obtained after elution using increasing concentrations of imidazole were resolved on a 12.5% SDS-polyacrylamide gel. Fractions 3–9 were found to be enriched in the eluted protein. Semi-quantitative determination of affinity of 9E for the 41-mer dsDNA using (b) increasing concentrations of immobilized dsDNA and fixed amount of protein (250 nM), and (c) immobilized dsDNA (500 nM) in the presence of increasing amounts of competitor dsDNA. All experiments were performed in triplicate, and the data is represented as mean ± s.e.m.
-
Figure 3—figure supplement 3—source data 1
Determination of affinity of 9E for dsDNA_1.
- https://cdn.elifesciences.org/articles/67830/elife-67830-fig3-figsupp3-data1-v2.xlsx
-
Figure 3—figure supplement 3—source data 2
Determination of affinity of 9E for dsDNA_2.
- https://cdn.elifesciences.org/articles/67830/elife-67830-fig3-figsupp3-data2-v2.xlsx
Figure 3—figure supplement 4

Electrophoretic mobility shift assay (EMSA) to demonstrate binding of 9E to the 4-nt minimal binding motif.
(a) Sequences, and the corresponding schematics, of DNA constructs engineered with the 4-nt epitope (red) to demonstrate binding of 9E. (b) EMSA of 9E (red crescent) to biotinylated dsDNA (lanes 1, 2), dsDNA (lanes 3, 4), and a DNA duplex (I4 ; lanes 5, 6) where the 4-nt epitope was placed at one end of the duplex (region highlighted in red), while the other end comprised an I-motif forming C-rich segment. Binding assays were setup as described in Materials and methods and run on an 8% non-denaturing polyacrylamide-TAE gel.
Figure 4 with 2 supplements
Targeting DNA nanodevices to neurons.
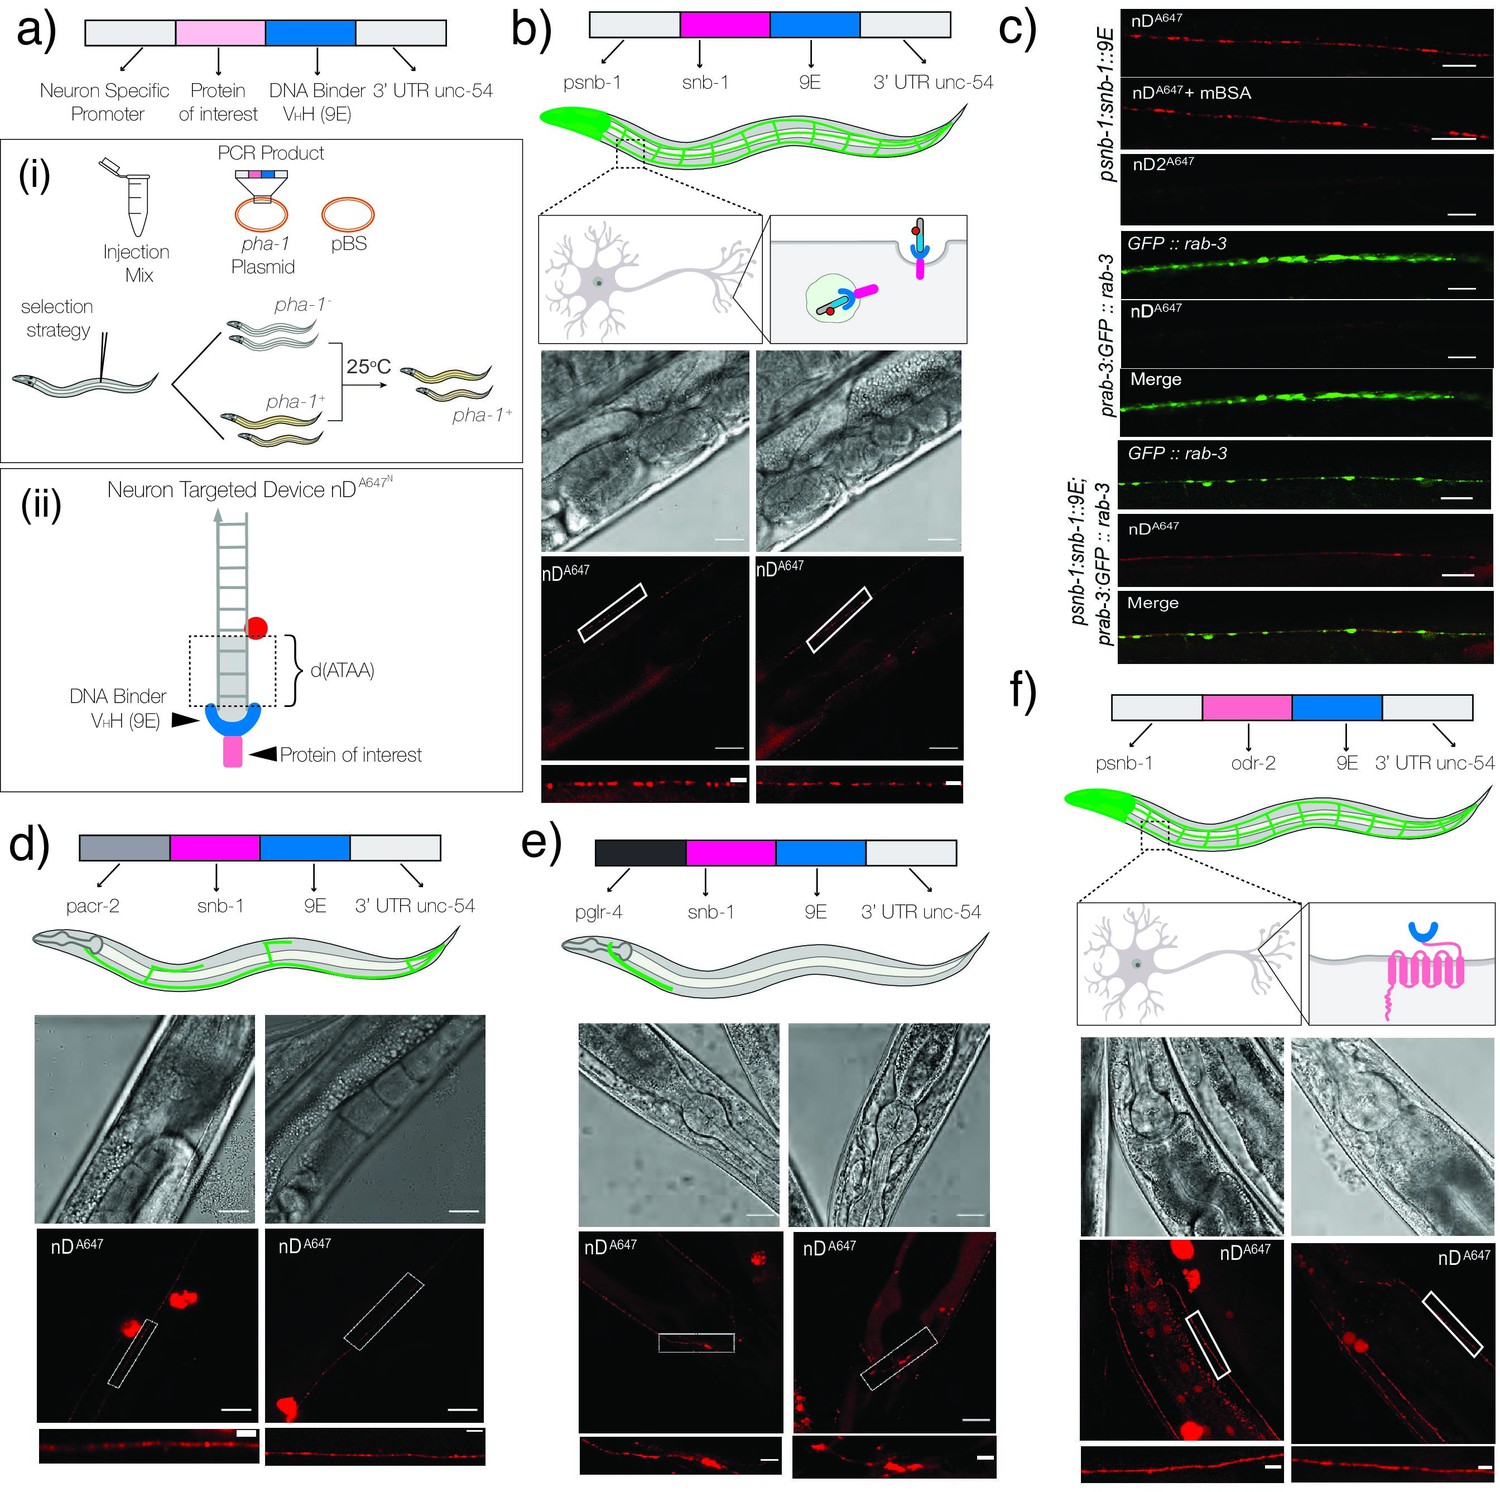
(a) Schematic of the constructs used to make transgenics: (i) strategy to select transgenics based on pha-1+ worms; (ii) schematic of neuron targetable DNA nanodevice nDA647N bound to its synthetic receptor, 9E, fused to the protein of interest. (b) Schematic of nanodevice uptake into neurons of psnb-1::snb-1::9E worms. Brightfield and fluorescence images of C. elegans neurons labeled with nDA647N. (c) Representative fluorescence images of (i) neurons in psnb1::snb-1::9E worms injected with nDA647N in the presence or absence of mBSA and nD2A647 lacking the 3′ terminal d(ATAA); (ii) neurons in prab-3::gfp::rab-3; and (iii) prab-3::gfp::rab-3; psnb1::snb-1::9E expressing C. elegans injected with nDA647N. nDA647N can be targeted to neuronal subsets. (d) nDA647N labels cholinergic motor neurons in pacr-2::snb-1::9E and head neurons in (e) pglr-4::snb-1::9E expressing C. elegans. nDA647N can be targeted via the labeling cassette to other proteins cell-specifically. (f) Images of neurons in psnb1::odr-2::9E expressing animals labeled with nDA647N. In all images, the white boxed region is shown in the zoomed image below. Scale: 20 µm; Inset: 5 µm.
Figure 4—figure supplement 1
Gel electrophoresis characterization of PCR fragements and transgenic worms.
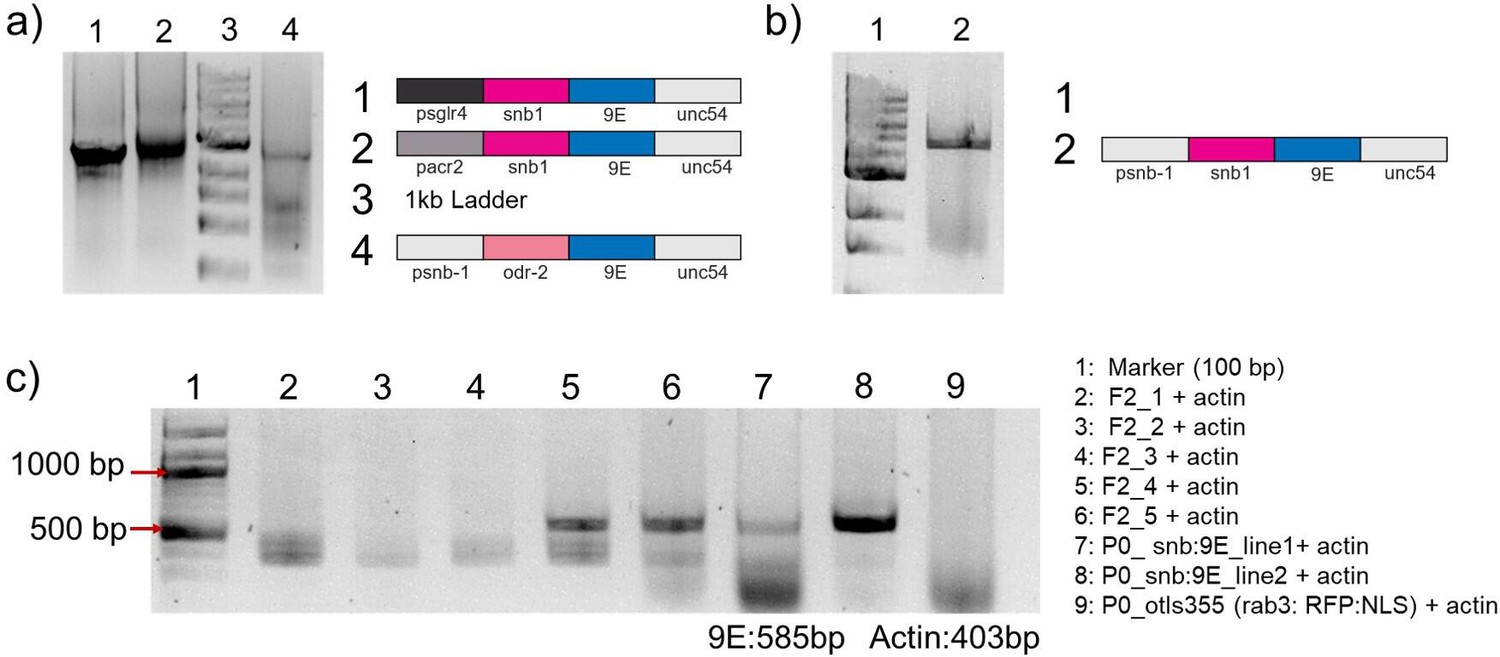
(a, b) PCR fragments used for making various transgenic strains to target DNA probes to neurons. PCR product was confirmed by gel electrophoresis with 1% agarose gel and (c) single-worm PCR showing selection of worms containing psnb-1::snb-1:: 9E and 2XNLS::RFP.
Figure 4—figure supplement 2

Representative images of transgenic worms containing both (a) rab-3p(prom1)::2xNLS::TagRFP or (b, c) unc-119::GFP or (d) prab-3::gfp::rab-3 and psnb-1::snb-1::9E injected with nDNA.
(e) Representative images of nD647 nanodevice uptake (red) in transgenic worms expressing both prab-3::gfp::rab-3 (green) and psnb-1::snb-1::9E.Also shown are normalized line intensity profiles of regions of interest indicated in the merged image; (f) percentage colocalization of nD647 (red) with GFP::rab-3 (green) obtained from the line profiles in (e).
-
Figure 4—figure supplement 2—source data 1
Line intensity profiles for neuron 1.
- https://cdn.elifesciences.org/articles/67830/elife-67830-fig4-figsupp2-data1-v2.xlsx
-
Figure 4—figure supplement 2—source data 2
Line intensity profiles for neuron 2.
- https://cdn.elifesciences.org/articles/67830/elife-67830-fig4-figsupp2-data2-v2.xlsx
Figure 5 with 1 supplement
Mapping the pH of cell-surface versus internalized nanodevices using pHlava-9E.
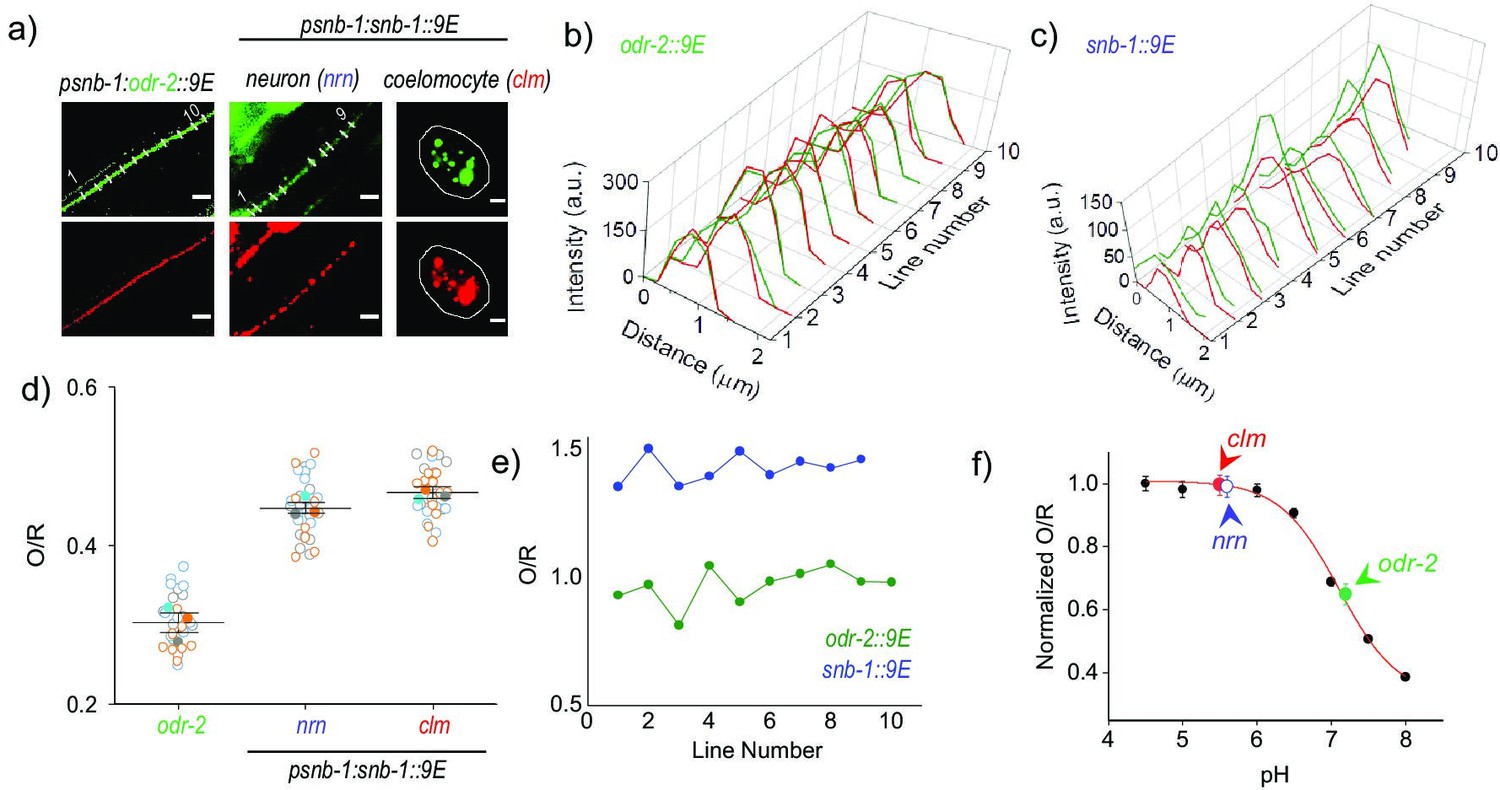
(a) Representative images of pHlava-9E labeled compartments in neurons (nrn) and coelomocytes (clm) of psnb-1::snb-1::9E worms and neurons in psnb-1::odr-2::9E, acquired in the TMR (O) and ATTO 647N (R) channels. Scale bar, 5 μm. (b, c) Pixel-wise line intensity profiles in the O (green lines) and R (red lines) channels of pHlava-9E labeled neurons in (b) psnb-1::snb-1::9E worms and (c) psnb-1::odr-2::9E along each indicated white line in (a). (d) O/R values reported by pHlava-9E along each indicated line in (a). (e) Distributions of O/R values from three representative datasets for each of the three regions, one of which is shown in (a). Data points from each dataset are shown in a unfilled circles of different colors, and the color-filled circles correspond to the average of that dataset. Lines depict average and standard error of the mean. (f) pH calibration profile of pHlava-9E showing normalized TMR and Alexa 647 fluorescence intensity ratio (O/R) versus pH, on which is overlaid the O/R values of pHlava-9E labeled neurons and coelomocytes in psnb-1:snb-1::9E and neurons in psnb-1:odr-2::9E worms. Error bars indicate the mean of three independent experiments ± s.e.m.
-
Figure 5—source data 1
Pixel-wise line intensity profiles of pHlava-9E labeled neurons.
- https://cdn.elifesciences.org/articles/67830/elife-67830-fig5-data1-v2.xlsx
-
Figure 5—source data 2
Pixel-wise line intensity profiles of pHlava-9E labeled neurons _2.
- https://cdn.elifesciences.org/articles/67830/elife-67830-fig5-data2-v2.xlsx
-
Figure 5—source data 3
O/R values along line profile.
- https://cdn.elifesciences.org/articles/67830/elife-67830-fig5-data3-v2.xlsx
-
Figure 5—source data 4
Distributions of O/R values for 3 representative regions.
- https://cdn.elifesciences.org/articles/67830/elife-67830-fig5-data4-v2.xlsx
-
Figure 5—source data 5
pH calibration profile of pHlava-9E.
- https://cdn.elifesciences.org/articles/67830/elife-67830-fig5-data5-v2.xlsx
Figure 5—figure supplement 1
Design and characterization of pHlava-9E.
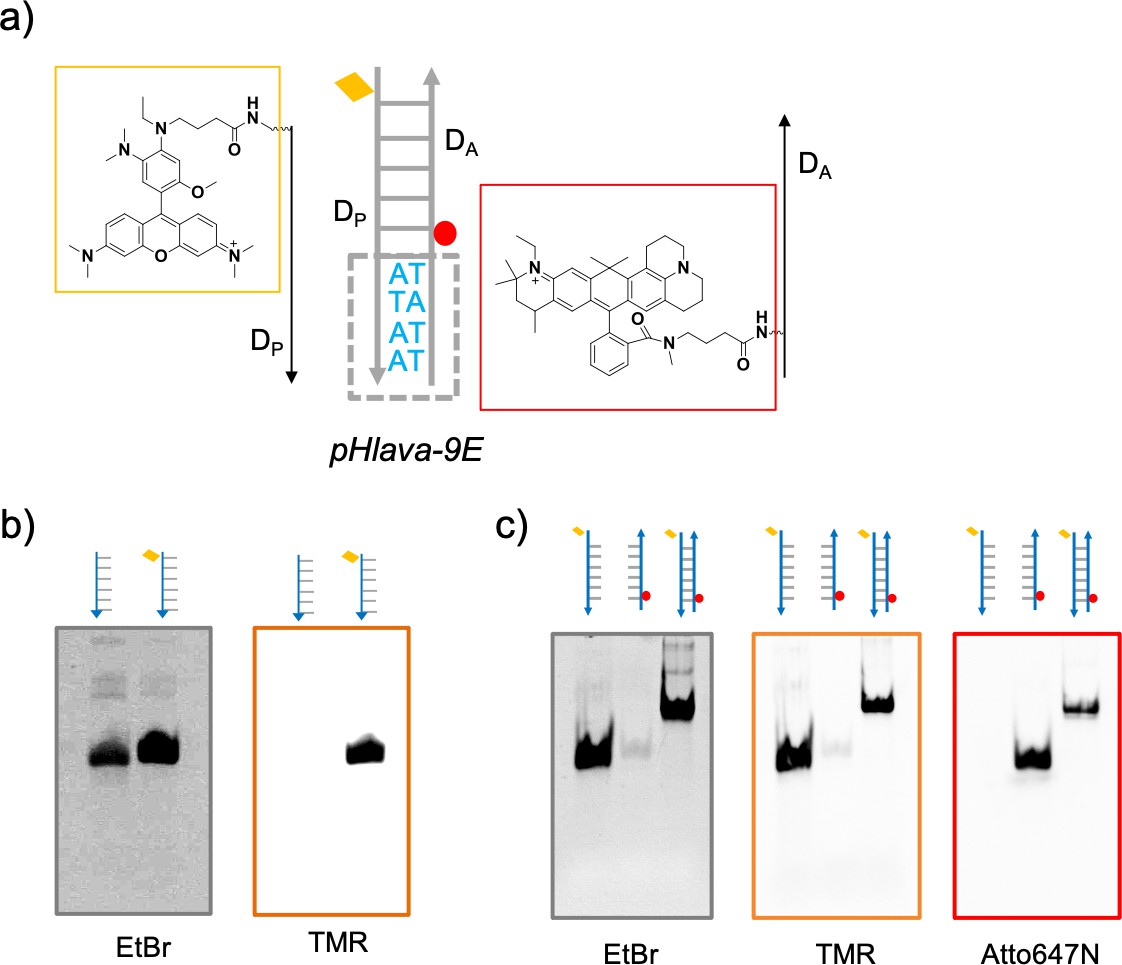
(a) Schematic showing the components of pHlava-9E. pHlava-9E is a dimeric complex comprising pH sensing strand DP, normalizing strand DA . pHlava-9E has a d(ATAA) motif at the terminus to bind 9E. (b) Gel showing the conjugation of pHrodored to DP strand. Gels were visualized in EtBr and TMR channels. (c) Native PAGE showing formation of pHlava-9E. Gels were visualized in EtBr, TMR, and Alexa Fluor 647 channels.
Author response image 1
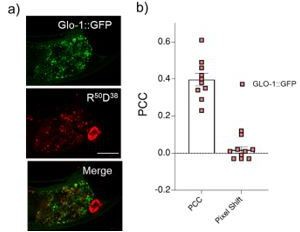
a) Representative images showing colocalization between LRO marker, GLO-1::GFP and R50D38 nanodevices uptaken by intestinal epithelial cells b) Pearson’s correlation coefficient (PCC) calculated of the colocalization between R50D38 (red) and GLO-1 (green) in GLO-1::GFP worms.
Additional files
-
Supplementary file 1
Table listing all oligonucleotides used in this study.
- https://cdn.elifesciences.org/articles/67830/elife-67830-supp1-v2.docx
-
Transparent reporting form
- https://cdn.elifesciences.org/articles/67830/elife-67830-transrepform1-v2.docx
Download links
A two-part list of links to download the article, or parts of the article, in various formats.
Downloads (link to download the article as PDF)
Open citations (links to open the citations from this article in various online reference manager services)
Cite this article (links to download the citations from this article in formats compatible with various reference manager tools)
Tissue-specific targeting of DNA nanodevices in a multicellular living organism
eLife 10:e67830.
https://doi.org/10.7554/eLife.67830


