Open-source, Python-based, hardware and software for controlling behavioural neuroscience experiments
- Department of Experimental Psychology, University of Oxford, United Kingdom
- Champalimaud Neuroscience Program, Champalimaud Centre for the Unknown, Portugal
- Janelia Research Campus, Howard Hughes Medical Institute, United States
- Department of Physiology Anatomy & Genetics, University of Oxford, United Kingdom
- Institute of Applied Physiology, Ulm University, Germany
- Instituto de Neurociencias (Universidad Miguel Hernández-Consejo Superior de Investigaciones Científicas), Spain
- Institute of Neuroscience and Psychology, University of Glasgow, United Kingdom
- Department of Neuroscience and Neurology, Zuckerman Mind Brain Behavior Institute, Columbia University, United States
- Wellcome Centre for Integrative Neuroimaging, University of Oxford, United Kingdom
Figures
Figure 1 with 1 supplement
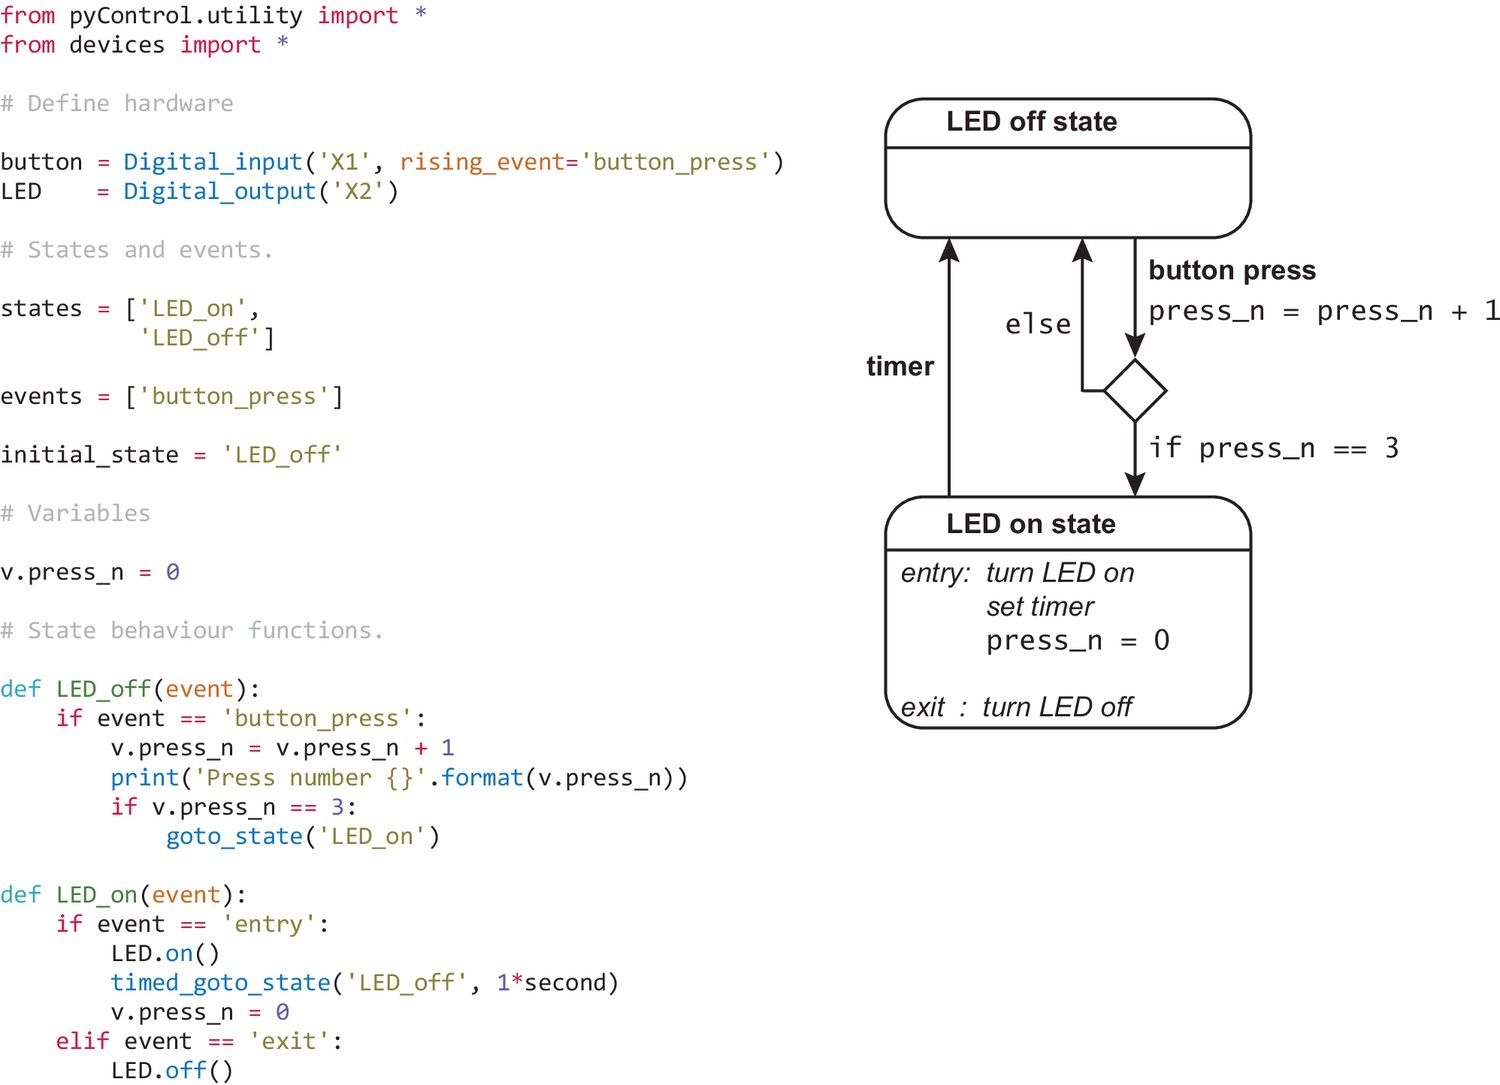
Example task.
Complete task definition code (left panel) and corresponding state diagram (right panel) for a simple task that turns an LED on for 1 s when a button is pressed three times. Detailed information about the task definition syntax is provided in the Programming Tasks documentation.
Figure 1—figure supplement 1
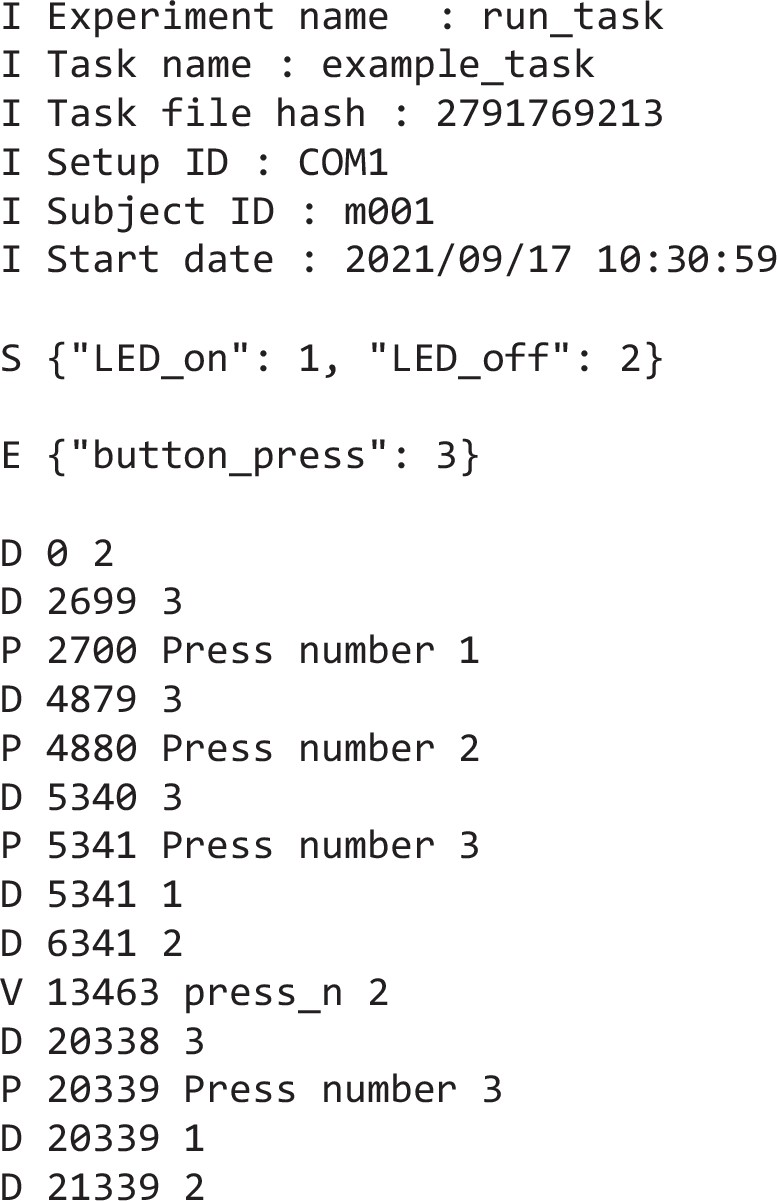
Example data file.
Text file generated by running the example task shown in Figure 1. Lines beginning I contain information about the session including subject, task, and experiment names, start date, and time. The single line beginning S is a JSON object (also a Python dict) containing the state names and corresponding IDs used below in the data file. The single line beginning E is a JSON object containing the event names and corresponding IDs. Lines beginning D are data lines generated while the framework was running, with format D timestamp ID where timestamp is the time in milliseconds since the start of the framework run and ID is a state ID (indicating a state transition) or an event ID (indicating an event occurred). Lines beginning P are the output of print statements with format P timestamp printed output. The line beginning V indicates the value of a task variable that has been set by the user while the task was running, along with a timestamp.
Figure 2
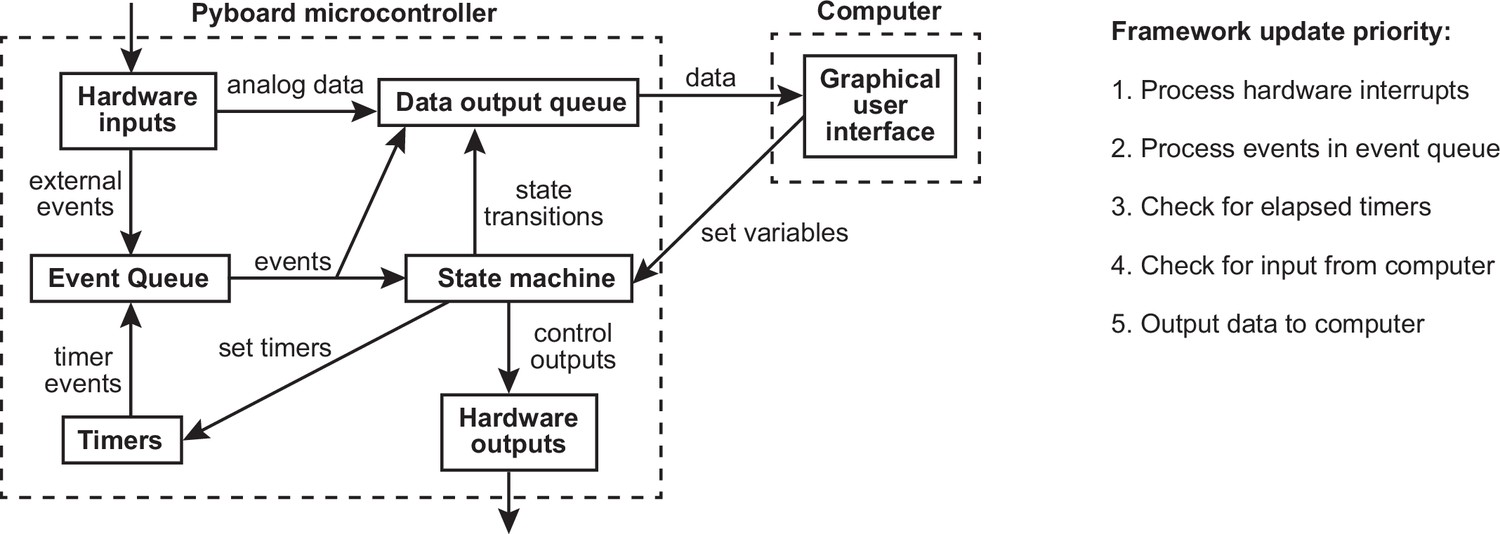
Framework diagram.
Diagram showing the flow of information between different components of the framework and the graphical user interface (GUI) while a task is running. Right panel shows the priority with which processes occur in the framework update loop.
Figure 3
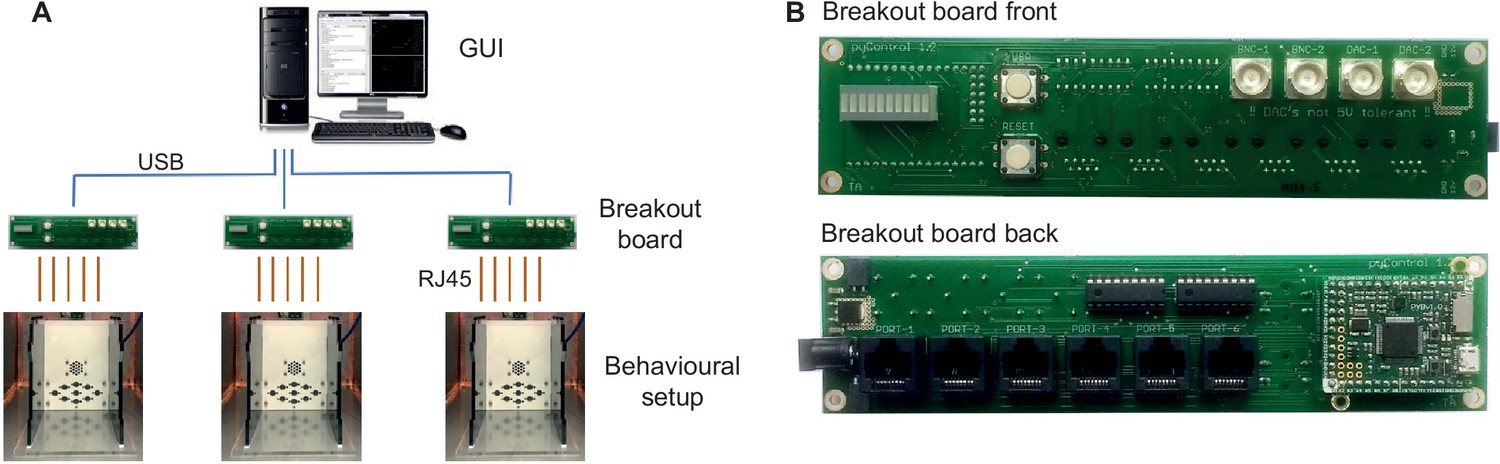
pyControl hardware.
(A) Diagram of a typical pyControl hardware setup, a single computer connects to multiple breakout boards, each of which controls one behavioural setup. Each behavioural setup comprises devices connected to the breakout board RJ45 behaviour ports using standard network cables. (B) Breakout board interfacing the pyboard microcontroller with a set of behaviour ports, BNC connectors, indicator LEDs, and user buttons. See Figure 6—figure supplement 1, Figure 7—figure supplement 1, and Figure 8—figure supplement 1 for hardware configurations used in the behavioural experiments reported in this article, along with their associated hardware definition files. For more information, see the hardware docs.
Figure 4
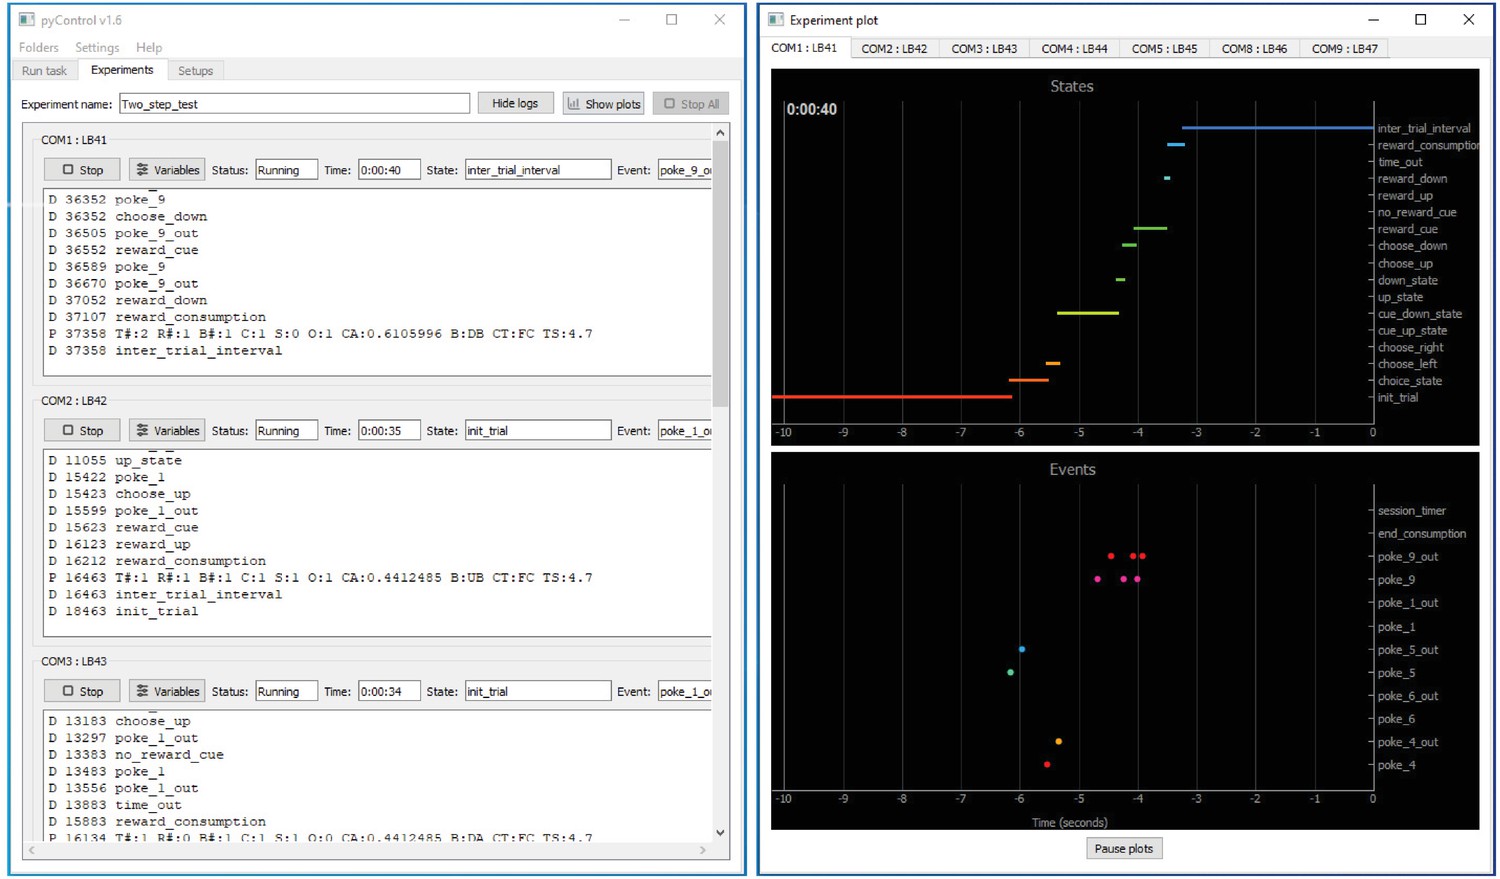
pyControl graphical user interface (GUI).
The GUI’s Experiments tab is shown on the left running a multi-subject experiment, with the experiment’s plot window open on the right showing the recent states and events for one subject. For images of the other GUI functionality, see the GUI docs.
Figure 5
Framework performance.
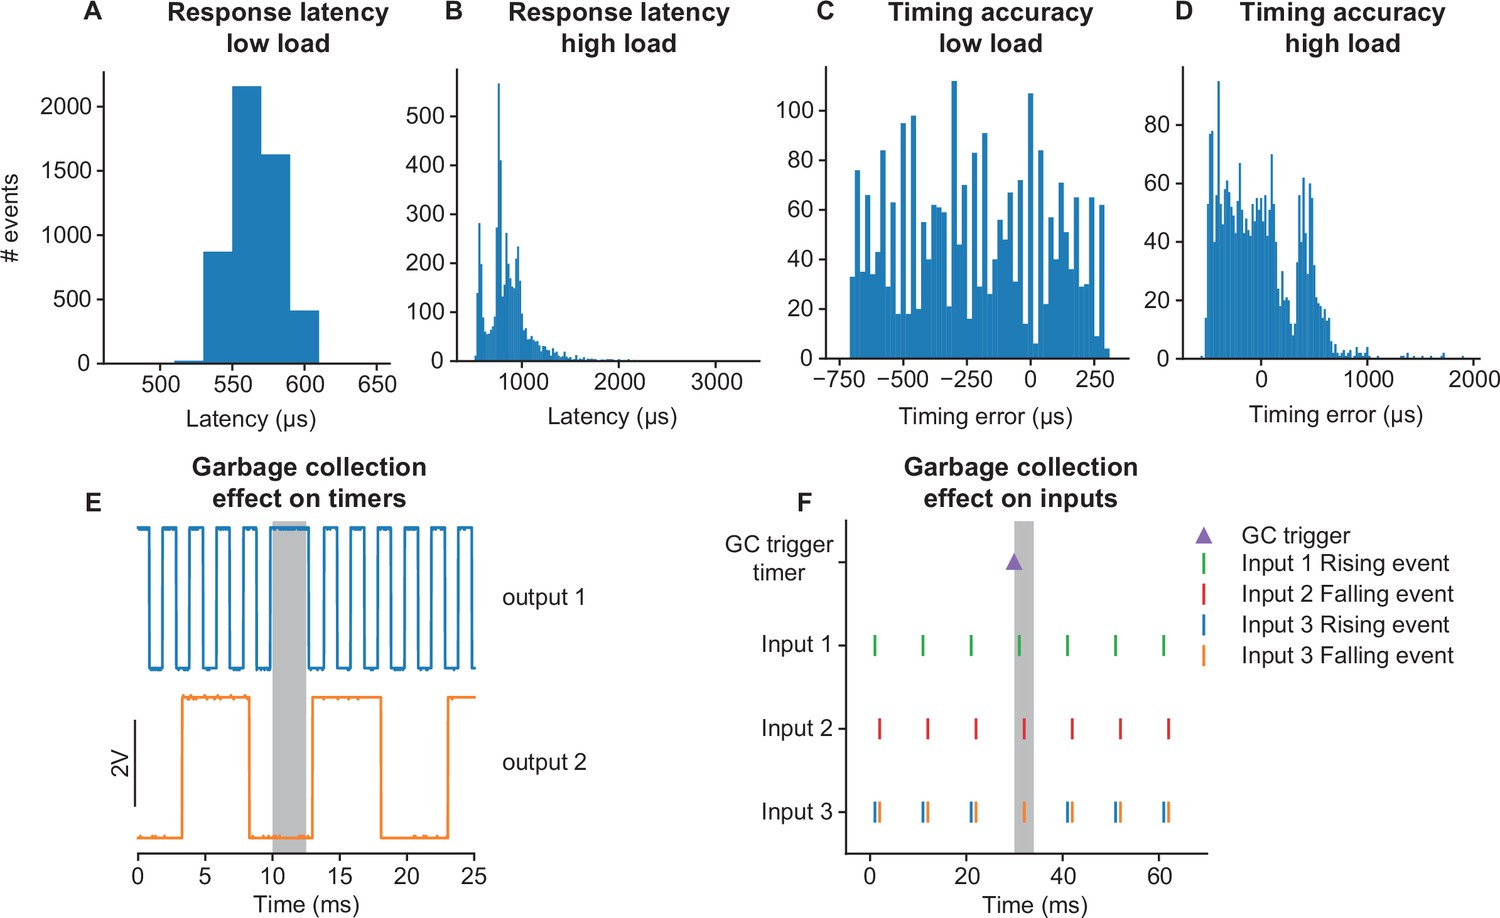
(A) Distribution of latencies for the pyControl framework to respond to a change in a digital input by changing the level of a digital output. (B) As (A) but under a high load condition (see main text). (C) Distribution of pulse duration errors when framework generates a 10 ms pulse. (D) As (C) but under a high load condition. (E) Effect of MicroPython garbage collection on pyControl timers. Signals are two digital outputs, one toggled on and off every 1 ms (blue), and one every 5 ms (orange), using pyControl timers. The 1 ms timer that that elapsed during garbage collection (indicated by grey shading) was processed once garbage collection had finished, causing a short delay. Garbage collection had no effect on the 5 ms timer that was running but did not elapse during garbage collection. (F) Effect of garbage collection on pyControl inputs. A signal comprising 1 ms pulses every 10 ms was received by three pyControl digital inputs. Input 1 was configured to generated framework events on rising edges (green), input 2 on falling edges (red), and input 3 on both rising (blue) and falling (orange) edges. Garbage collection (indicated by grey shading) was triggered 1 ms before an input pulse. Inputs 1 and 2 both generated their event that occurred during garbage collection with the correct timestamp. If multiple events occur on a single digital input during a single garbage collection, only the last event is generated correctly, causing the missing rising event on input 3.
Figure 6 with 1 supplement
5-choice serial reaction time task (5-CSRTT).
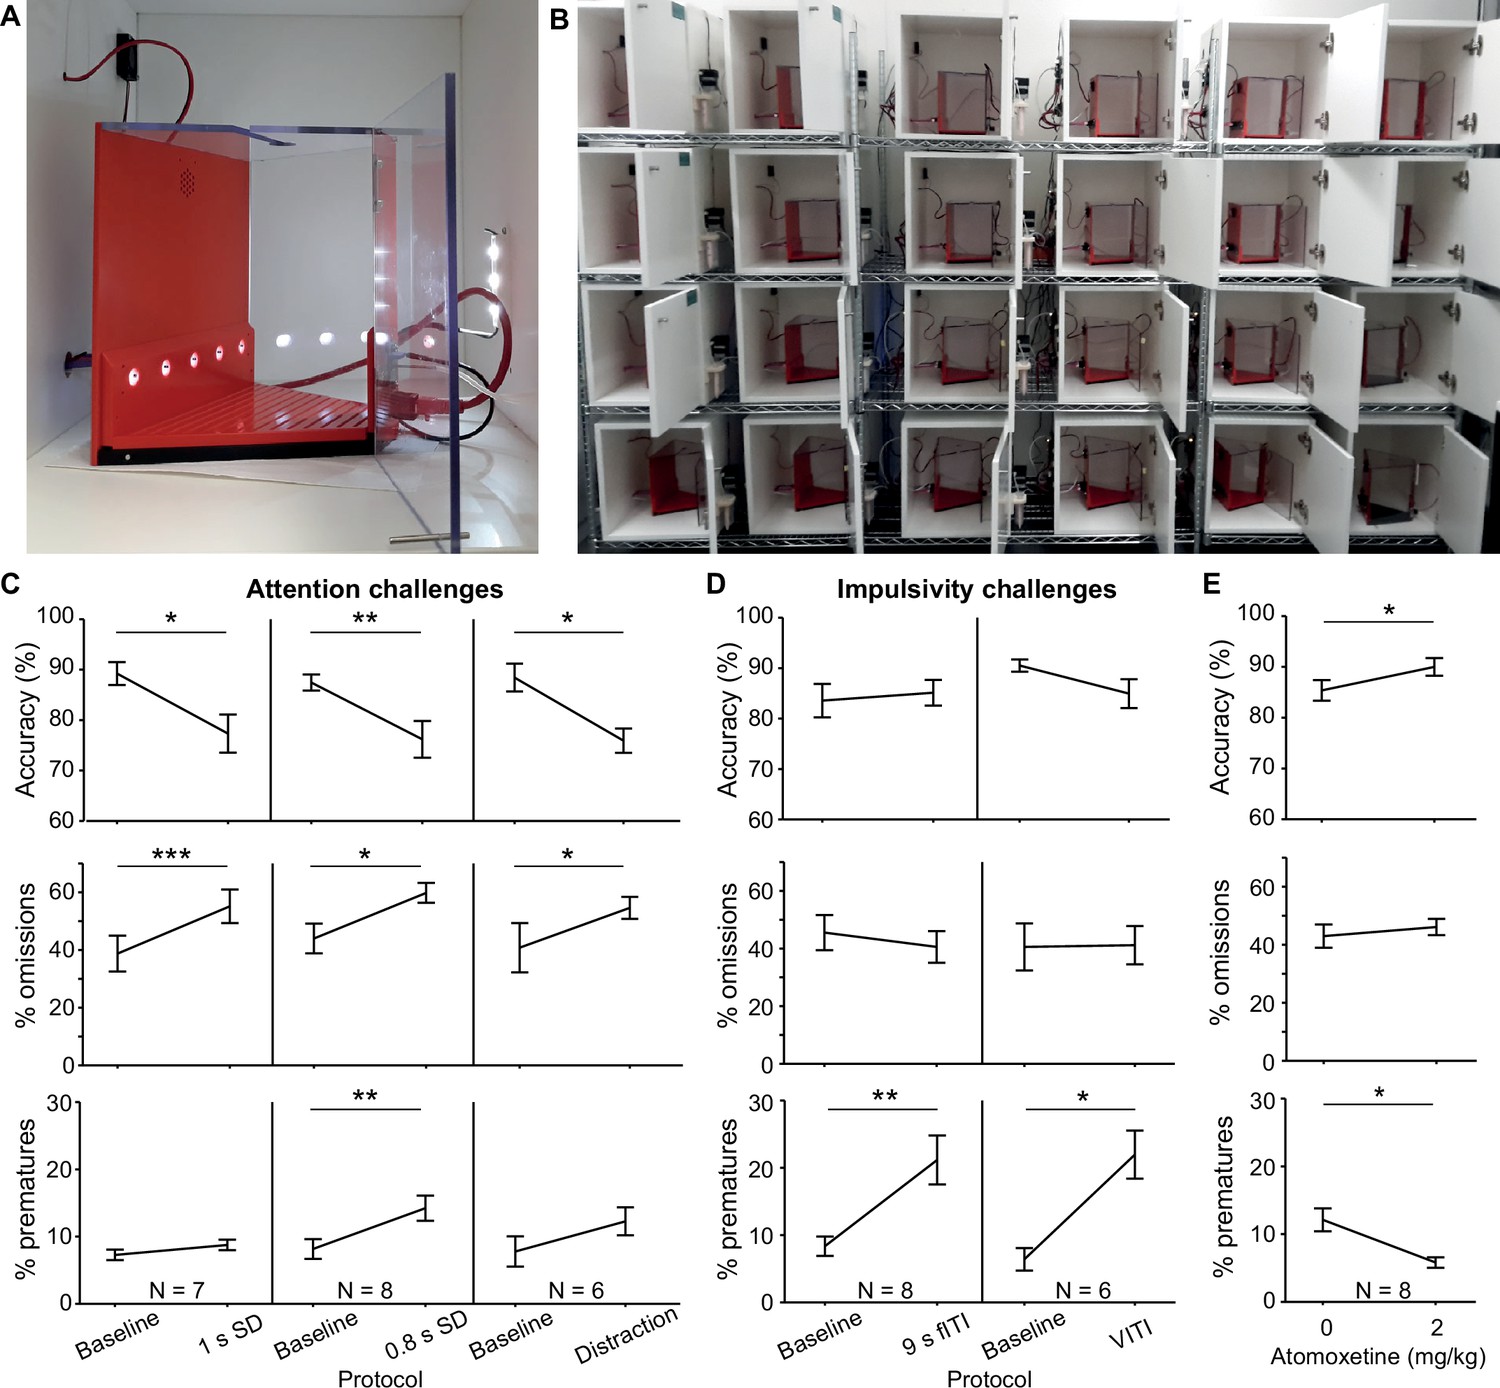
(A) Trapezoidal operant box with 5-choice wall (poke-holes shown illuminated) within a sound-attenuated cubicle. (B) High-throughput training setup comprising 24 operant boxes. (C, D) Performance measures on the 5-CSRTT during protocols challenging either sustained attention – by shortening the SD or delivering a sound distraction during the waiting time (C) or motor impulsivity – by extending the inter-trial interval (ITI) to a fixed (fITI) or variable (vITI) length (D). Protocols used are indicated by x-axes. Note the rather selective decrease of attentional performance (accuracy, %omissions) or impulse control (%prematures) achieved by the respective challenges. (E) Validation of the possibility to detect cognitive enhancement in the 5-CSRTT (9s-fITI challenge) by application of atomoxetine, which increased attentional accuracy and decreased premature responding, as predicted. Asterisks in (C–E) indicate significant within-subject comparisons relative to the baseline (2 s SD, 5 s fITI; C, D) or the vehicle (E) condition (paired-samples t-test). *p<0.05, *p<0.01, *p<0.001. Error bars display s.e.m. Note that two mice of the full cohort (N = 8) did not participate in all challenges as they required more training time to reach the baseline stage.
Figure 6—figure supplement 1
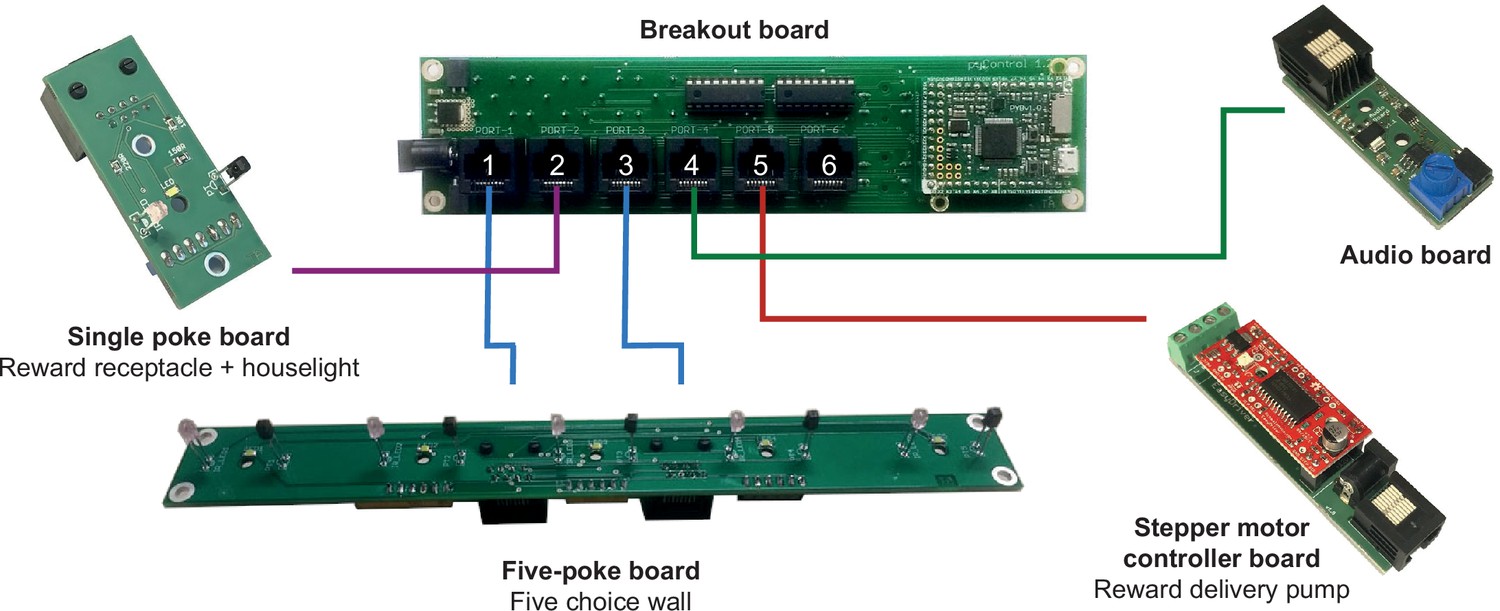
Hardware configuration for 5-choice serial reaction time task (5-CSRTT).
Diagram of hardware modules used to implement the 5-CSRTT. A breakout board is connected to a 5-poke board which integrates the IR beams and LEDs for the ports on the 5-choice wall onto a single PCB controlled from two behaviour ports, a stepper motor controller is used with a custom-made 3D-printed peristaltic pump for reward delivery, a single poke board is used for the reward receptacle with a 12 V LED module used for house light connected to its solenoid output connector, and an audio board for generating auditory stimuli. The hardware definition for this setup is provided in the article’s code repository (https://github.com/pyControl/manuscript/blob/master/Five%20choice%20serial%20reaction%20time%20task/pyControl%20files/5_CSRTT_hardware_definition.py; Akam, 2021).
Figure 7 with 1 supplement
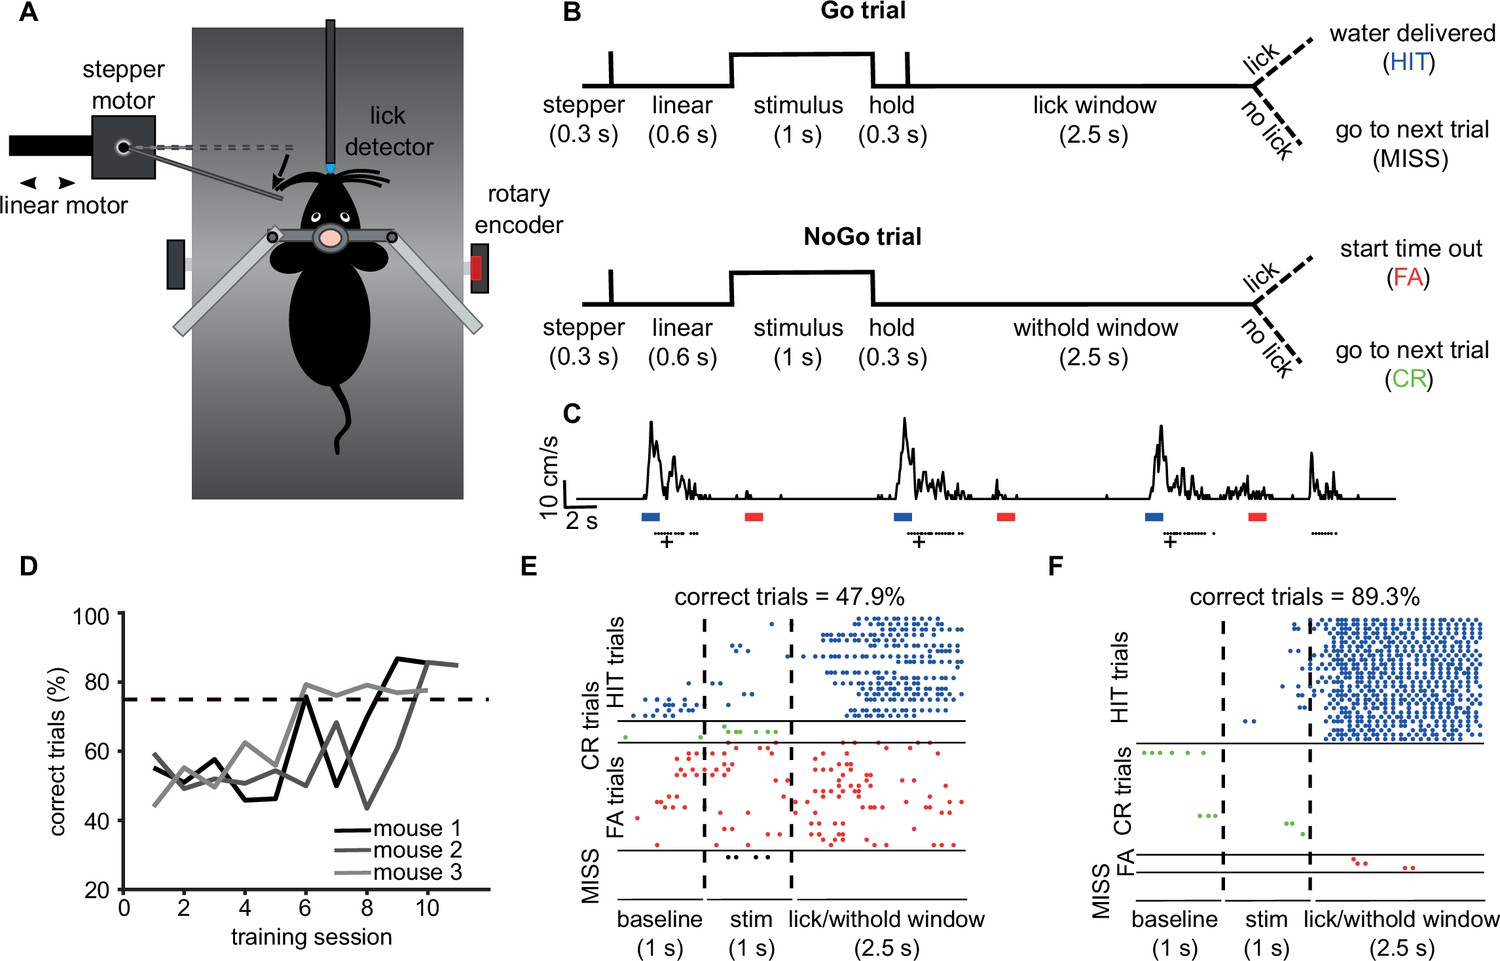
Vibrissae-based object localisation task.
(A) Diagram of the behavioural setup. Head-fixed mice were positioned on a treadmill with their running speed monitored by a rotary encoder. A pole was moved into the whisker field by a linear motor, with the anterior-posterior location controlled using a stepper motor. Water rewards were delivered via a spout positioned in front of the animal and licks to the spout were detected using an electrical lickometer. (B) Trial structure: before stimulus presentation, the stepper motor moved into the trial position (anterior or posterior). Next, the linear motor translated the stepper motor and the attached pole close to the mouse’s whisker pad, starting the stimulation period. A lick window (during Go trials) or withhold window (during NoGo trials) started after the pole was withdrawn. FA, false alarm; CR, correct rejection. (C) pyControl simultaneously recorded running speed (top trace) and licks (black dots) of the animals, as well as controlling stimulus presentation (blue and red bars for Go and NoGo stimuli) and solenoid opening (black crosses). (D) Percentage of correct trials for three mice over the training period. Mice were considered expert on the task after reaching 75% correct trials (dotted line) and maintaining such performance for three consecutive days. (E) Detected licks before, during, and after tactile stimulation, during an early session before the mouse has learned the task, sorted by trial type: hit trials (blue), correct rejection trials (green), false alarm trials (red), and miss trials (black). Each row is a trial, each dot is a detected lick. Correct trials for this session were 47.9% of total trials. (F) As (E) but for data from the same mouse after reaching the learning threshold (correct trials = 89.3% of total trials).
Figure 7—figure supplement 1
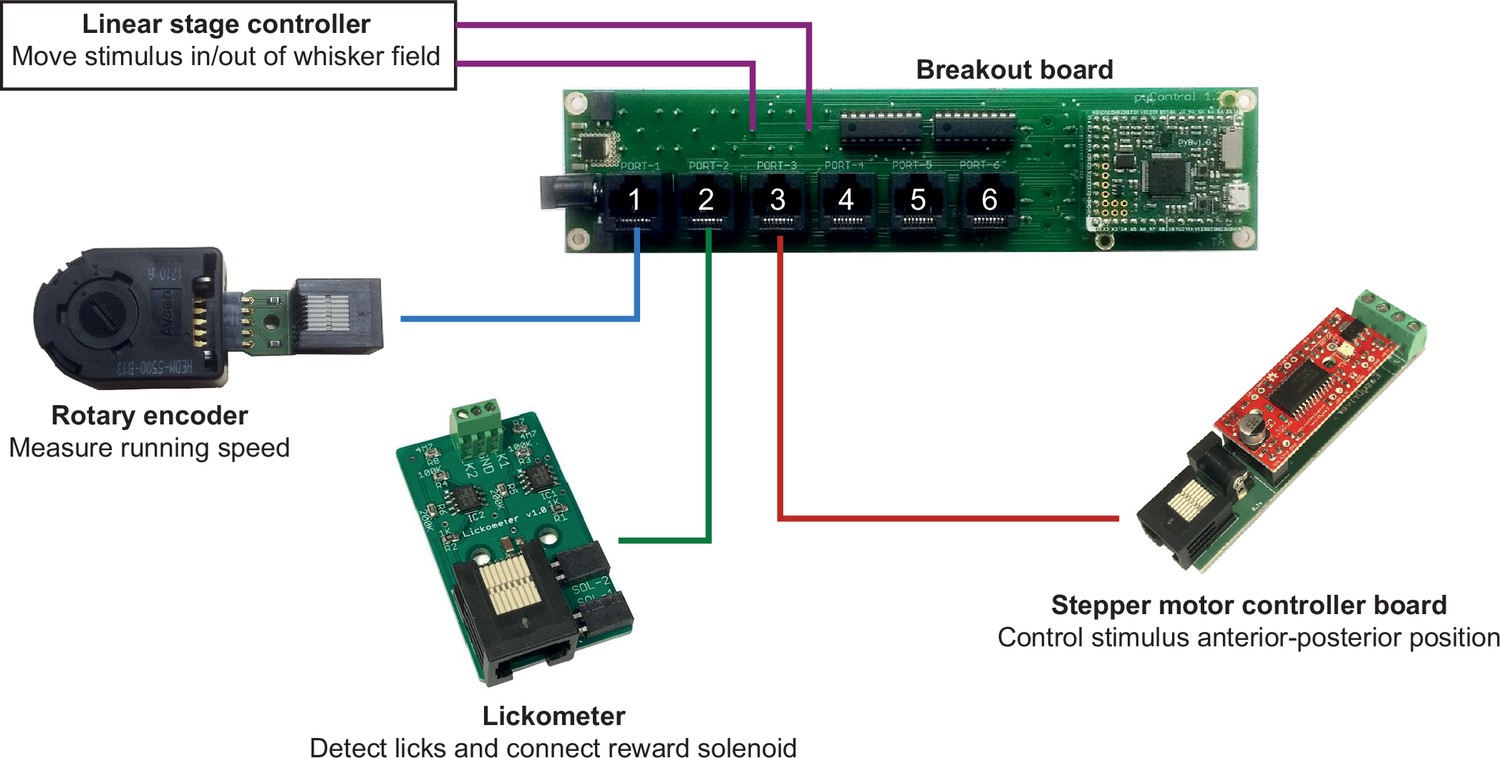
Hardware configuration for vibrissae-based object localisation task.
Diagram of the hardware modules used to implement the head-fixed vibrissae-based object localisation task. A breakout board is connected to a rotary encoder module, used to measure running speed, a lickometer, used to detect licks and control the reward solenoid, a stepper motor controller used to set the anterior-posterior position of the stimulus, and a controller for the linear stage used to move the stimulus in and out of the whisker field. The hardware definition for this setup is provided in the article’s code repository (link).
Figure 8 with 1 supplement
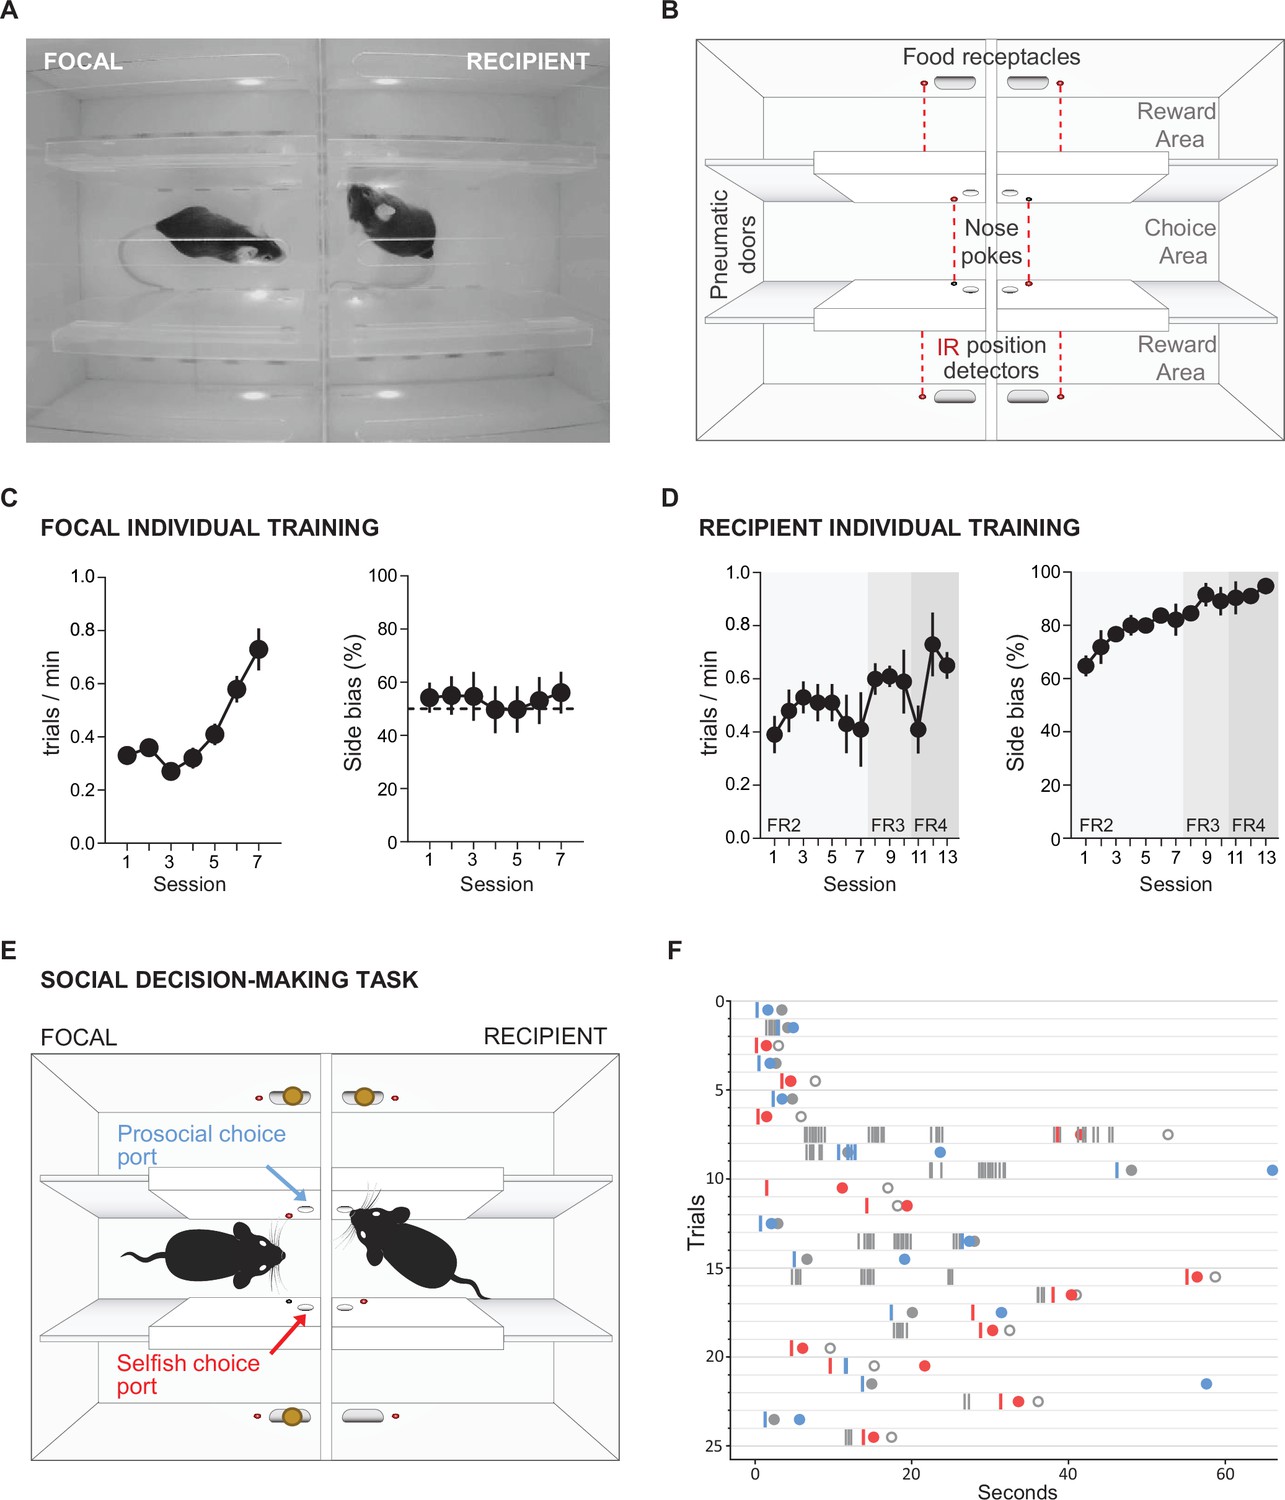
Social decision-making task.
(A) Top view of double T-maze apparatus showing two animals interacting during social decision-making. (B) Setup diagram; in each T-maze, nose-pokes are positioned on either side of the central choice area. Sliding pneumatic doors give access to the side arms of each maze (top and bottom in diagram) where pellet dispensers deliver food rewards. Six IR beams (depicted as grey and red circles connected by a dotted red line) detect the position of the animals to safely close the doors once access to an arm is secured. (C) Focal animal individual training showing the number of trials completed per minute (left panel) and side bias (right panel) across days of training. (D) As (C) but for the recipient animal. (E) Social decision-making task. The trial starts with both animals in the central arm. The recipient animal has learnt in previous individual training to poke the port on the upper side of the diagram to give access to a food pellet in the corresponding reward area. During the social task, the recipient animal’s ports no longer control the doors but the animal can display food-seeking behaviour by repeatedly poking the previously trained port. The focal animal has previously learned in individual training to collect food from the reward areas on both sides (top and bottom of diagram) by poking the corresponding port in the central choice area to activate the doors. During social decision-making, the focal animal can either choose the ‘prosocial’ port, giving both animals access to the side (upper on diagram) of their respective mazes where both receive reward, or can choose the ‘selfish’ port, giving both animals access to the other side (lower on diagram) where only the focal animal receives reward. (F) Raster plot showing behaviour of a pair of animals over one session during early social testing. Nose-pokes are represented by vertical lines, and colour coded according to the role of each mouse and choice type (grey, recipient’s pokes, which are always directed towards the prosocial side; blue, focal’s pokes in the prosocial choice port; red, focal’s pokes in selfish port). Note that latency for focal choice varies depending on the trial, allowing the recipient to display its food-seeking behaviour or not. Circles indicate the moment where each animal visits the food-receptacle in their reward arm. Focal animals are always rewarded, and the colour of the filled circle indicates the type of trial after decision (blue, prosocial choice; red, selfish choice). Grey circles indicate time of receptacle visit for recipients, where filled circles correspond to prosocial trials, where recipient is also rewarded, and open circles to selfish trials, where no pellet is delivered.
Figure 8—figure supplement 1
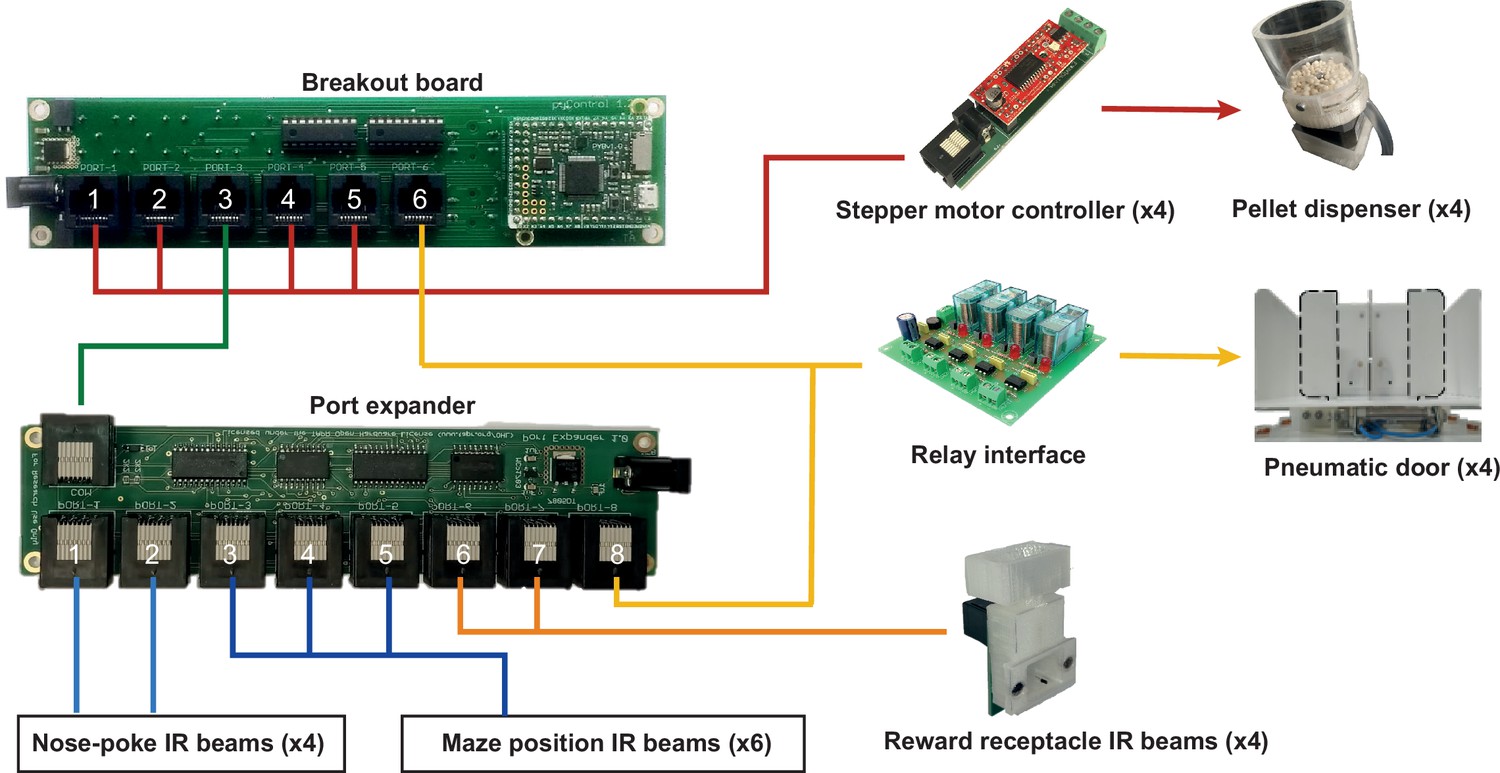
Hardware configuration for social decision-making task.
Diagram of the hardware modules used to implement the double T-maze apparatus for the social decision-making task. A port expander is used to provide additional IO lines for IR beams, stepper motor controller boards are used to control custom made pellet dispensers, and a relay interface board is used to control the solenoids actuating the pneumatic doors. The hardware definition for this setup is provided in the article’s code repository (https://github.com/pyControl/manuscript/blob/master/social%20decision%20making%20task/pyControl%20files/hardware_definition_double_T_maze.py).
Tables
Table 1
Behaviour port pinout.
All behaviour ports support the standard function for each pin, comprising two digital input/output (DIO) lines connected directly to microcontroller pins, two power driver lines connected to low-side MOSFET drivers for switching higher power loads, and +12 V, + 5 V and ground lines. Some behaviour ports support alternate functions on some pins. On breakout board version 1.2, ports 1 and 2 have an additional power driver line (POW C) and ports 3 and 4 have an additional DIO line (DIO C). Some DIO lines support analog input/output (ADC/DAC), serial communication (I2C, UART, or CAN), or decoding of quadrature signals from rotary encoders (ENC).
| Pinout of behaviour port RJ45 connectors | ||
|---|---|---|
| Standard function | Alternate function | Pin |
| Ground | None | 2 |
| +5 V | None | 6 |
| +12 V | None | 8 |
| Digital input/output (DIO) A | Analog input (ADC), I2C-SCL, UART-TX, CAN-RX, ENC | 1 |
| Digital input/output (DIO) B | Analog input (ADC), I2C-SDA, UART-RX, CAN-TX, ENC | 4 |
| Power driver (POW) A | None | 3 |
| Power driver (POW) B | None | 7 |
| None | DIO C, POW C, analog output (DAC), analog input (ADC) | 5 |
| Alternate functions available on each behaviour port of breakout board version 1.2 | ||
| Port | Alternate functions | |
| 1 | POW C, UART 4, ENC 5, ADC (on DIO A and B) | |
| 2 | POW C, CAN 1 | |
| 3 | DIO C, DAC 1, I2C 1, UART 1, ENC 4, ADC (on DIO C) | |
| 4 | DIO C, DAC 2, I2C 2, UART 3, ADC (on DIO C) | |
| 5 | CAN 2 | |
| 6 | ADC (on DIO A and B) | |
Key resources table
| Reagent type (species) or resource | Designation | Source or reference | Identifiers | Additional information |
|---|---|---|---|---|
| Software, algorithm | pyControl | https://github.com/pyControl/code | RRID:SCR_021612 | Repository containing pyControl GUI and framework code |
| Other | pyControl hardware | https://github.com/pyControl/hardware | RRID:SCR_021612 | Repository containing pyControl hardware designs |
| Other | pyControl Docs | https://pycontrol.readthedocs.io;a PDF version of the docs is included in supplementary material | RRID:SCR_021612 | pyControl documentation |
Table 2
5-choice serial reaction time task (5-CSRTT) training and challenge stages.
The parameters stimulus duration (SD) and inter-trial interval (ITI, waiting time before stimulus) are listed for each of the five training stages (S1–5) and the subsequent challenge protocols on which performance was tested for 1 day each (C1–5). For the training stages, performance criteria which had to be met by an animal on two consecutive days to move to the next stage are listed on the right. See Materials and methods for the definition of these performance parameters.
5-CSRTT training | ||||||||
|---|---|---|---|---|---|---|---|---|
| Task parameters | Criteria for stage transition (two consecutive days) | |||||||
| Stage | SD (s) | ITI (s) | # correct | % correct | % accuracy | %omissions | ||
| S1 | 20 | 2 | ≥30 | ≥40 | - | - | ||
| S2 | 8 | 2 | ≥40 | ≥50 | - | - | ||
| S3 | 8 | 5 | ≥80 | ≤50 | ||||
| S4 | 4 | 5 | ≥80 | ≤50 | ||||
| S5 | 2 | 5 | ≥80 | ≤50 | ||||
| Challenges | ||||||||
| C1 | 2 | 9 | Impulsivity challenge | |||||
| C2 | 1 | 5 | Attention challenge 1 | |||||
| C3 | 0.8 | 5 | Attention challenge 2 | |||||
| C4 | 2 | 5 | Distraction: 1 s white noise within 0.5–4.5 s of ITI | |||||
| C5 | 2 | 7, 9, 11, 13 | Variable ITI: pseudo-random, equal distribution | |||||
Additional files
Download links
A two-part list of links to download the article, or parts of the article, in various formats.
Downloads (link to download the article as PDF)
Open citations (links to open the citations from this article in various online reference manager services)
Cite this article (links to download the citations from this article in formats compatible with various reference manager tools)
Open-source, Python-based, hardware and software for controlling behavioural neuroscience experiments
eLife 11:e67846.
https://doi.org/10.7554/eLife.67846


