Genetically engineered mice for combinatorial cardiovascular optobiology
- Department of Biomedical Sciences, Cornell University, United States
- Department of Biomedical Engineering, Cornell University, United States
- Department of Physiology, University of Maryland School of Medicine, United States
- Departments of Physiology and Membrane Biology, University of California, Davis School of Medicine, United States
- Department of Pharmacology, University of California, Davis, United States
Figures
Figure 1 with 1 supplement
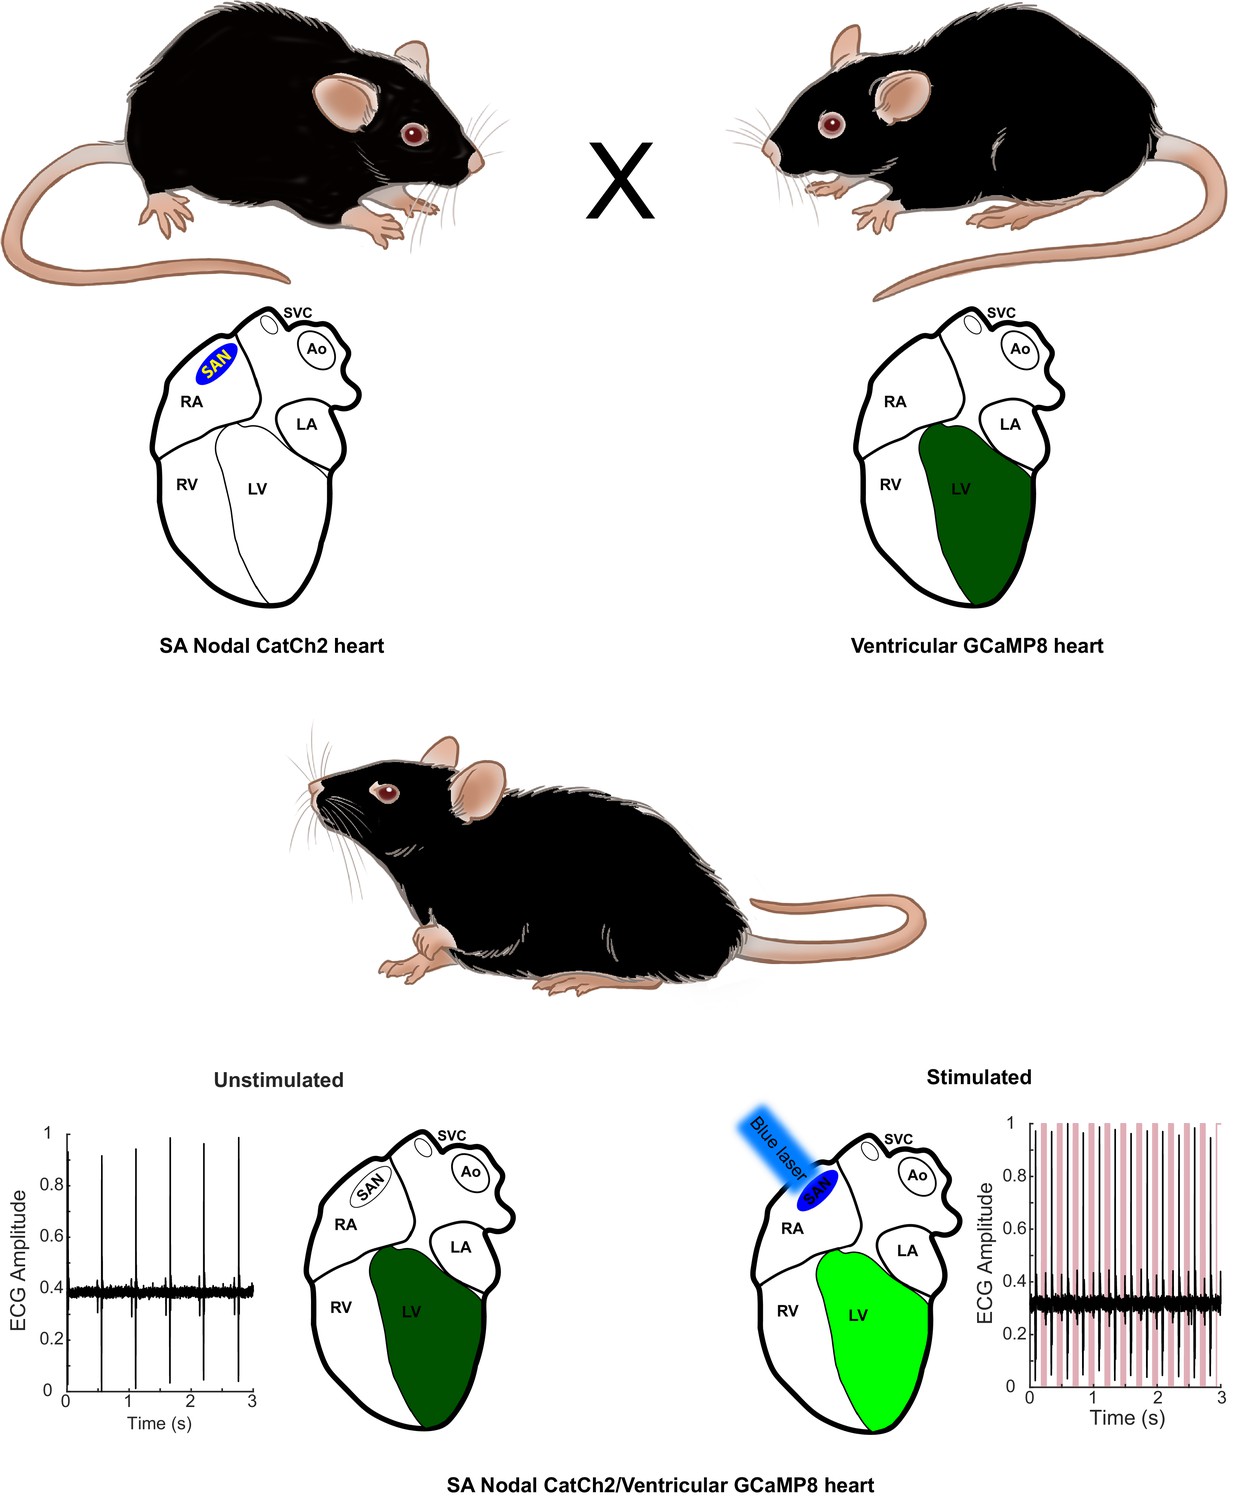
Combinatorial optogenetic mice.
The figure illustrates the general paradigm of tissue-specific cellular activation and simultaneous response decoding with tissue-specific optical sensors. Here, a biallelic SA nodal CatCh2/cardiomyocyte-GCaMP8 mouse is generated from a single cross of isogenic (C57BL/6J), hemi-allelic effector/sensor mice, as in Figure 2H. Mice with specific expression of optoeffectors (cardiac conducting tissue, cardiac and smooth muscle syncytia, endothelium, sympathetic neurons, T cells, and glia) and optosensors (SA nodal tissue, cardiac and smooth muscle, endothelium, ciliated epithelium, and alveolar epithelium) are reported. LA: left atrium; RA: right atrium; RV: right ventricle; LV: left ventricle; Ao: aorta; SVC: superior vena cava; SAN: sinoatrial node.
© 2021, Virginia Greene. Figure adapted from commissioned work by Virginia Greene. This figure is not available under the Creative Commons Attribution License and commercial use requires permission from the copyright holder.
Figure 1—figure supplement 1

Diagram of expression cassettes used in construction of CHROMus mice listed in Table 1.
Transgene expression cassettes are placed in frame with the ATG initiation codon from the desired target gene in the desired BAC molecule using standard BAC recombineering protocols. The optogenetic transgene cassettes contain the coding sequence for the optogenetic protein (optoα1AR, optoß2AR, or CatCh2) and the bacterial LacZ coding sequence separated by an internal ribosome entry sequence (IRES) element. Expression cassettes for fluorescent reporter proteins contain circularly permutated GFP or RFP coding sequence flanked by synthetic M13 peptide and calmodulin coding sequences, 5′ and 3′, respectively. In some cassettes, a fusion protein was created by linking an RFP (mCherry or mVermilion) to the carboxy terminus of the GCaMP protein separated by a spacer peptide. The purified recombinant BACs were microinjected into single-cell zygotes at Cornell University or UC-Irvine as described in Materials and methods.
Figure 2 with 5 supplements
Cardiac conduction system optoeffector and optosensor mice.
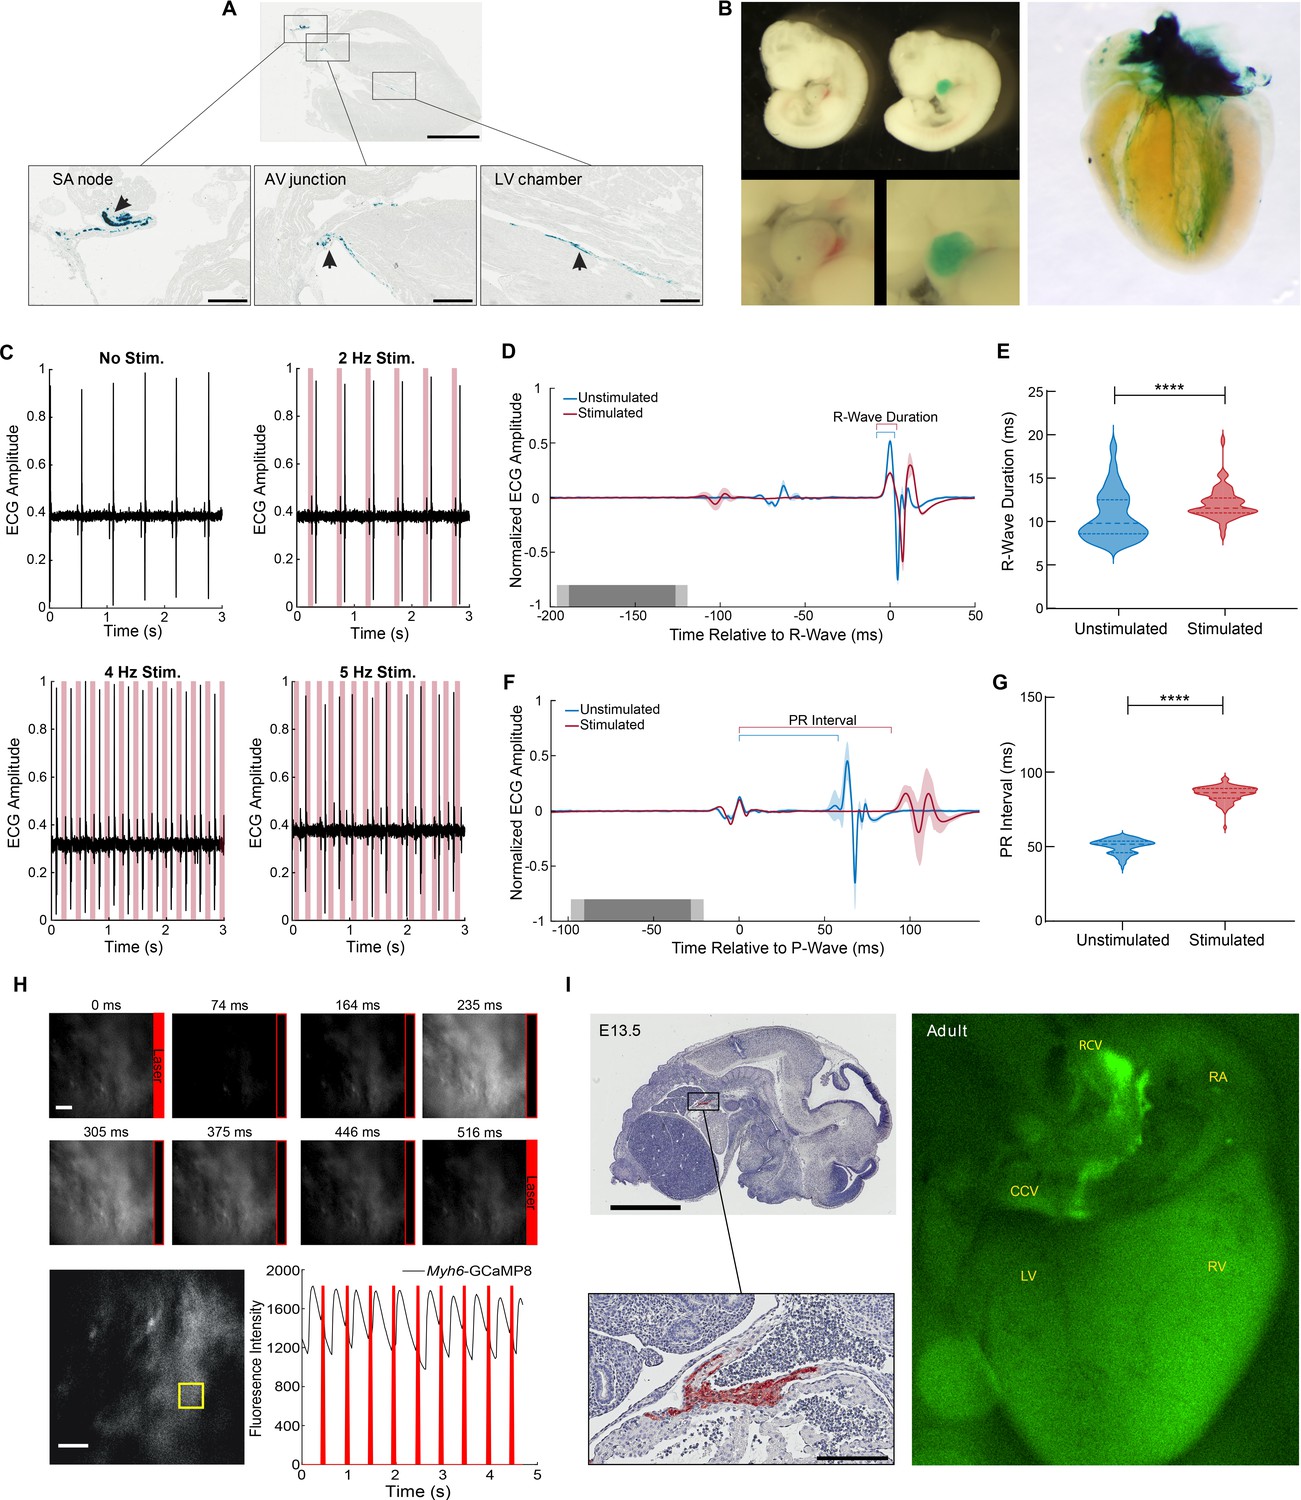
(A) X-gal staining of Hcn4BAC-CatCh2_IRES_lacZ adult heart shows LacZ expression in the sinoatrial (SA) node, AV junction, and the ventricular conduction network (arrows). Scale bars: upper panel, 2 mm, lower panels, 300 µm. (B) Left panel: X-gal staining of wildtype and Hcn4BAC-CatCh2_IRES_lacZ E10.5 embryos; upper images: whole embryo: lower images: cardiac region. Right panel: whole heart X-gal staining of neonatal heart showing staining in the cardiac conduction system including the SA nodal region, atrioventricular junction, and ventricle chambers. (C) ECG recording in an anesthetized Hcn4BAC-CatCh2_IRES_lacZ mouse during intravital pacing with laser illumination. ECG recordings from laser activation of CatCh2 protein demonstrate pacing from 2 to 4 Hz (3 Hz not shown), and pacing maximum. (D) ECG averaged by aligning R-wave peaks during laser-stimulated and unstimulated beats (shading indicates standard deviation, n = 273 stimulated beats, n = 115 unstimulated beats from same mouse as in [E], dark and light gray indicate average and standard deviation of laser pulse onset and offset times). Laser power is 32.2 mW, pulse length is 70 ms. (E) R-wave duration in stimulated and unstimulated beats (****p<0.0001, Mann–Whitney test). Solid lines and dashed lines show median and quartiles. Source data: Figure 2—source data 1. (F) Averaged ECG aligned by P-wave peak during stimulated and unstimulated beats. (G) Quantification of PR interval duration shows elongation in stimulated compared to unstimulated beats (****p<0.0001, Mann–Whitney test). Source data: Figure 2—source data 2. (H) Fluorescent Ca2+ measurement during optical stimulation of SA nodal tissue in Hcn4BAC-CatCh2_IRES_lacZ /Myh6-GCaMP8 perfused mouse heart at 2 Hz shows combination of optogenetic effectors and sensors through optical pacing of the SA node and fluorescent Ca2+ responses from ventricular myocytes. Top: fluorescent images from left ventricle with timing of laser pulses indicated by red box. Bottom: plot of GCaMP8 intensity from left ventricle in the outlined box (left image). Source data: Figure 2—source data 3. Scale bar: 200 µm. (I) Expression of GCaMP8 protein in embryonic and adult hearts from Hcn4BAC-GCaMP8 mice. Left: anti-GFP immunostaining of paraffin section from E13.5 embryo. Scale bars: 2 mm and 200 µm; right: dorsal view of an adult heart showing native GCaMP8 fluorescence in the SA nodal region, the right carotid vein, and the base of common carotid vein. RA: right atrium; CCV: common carotid vein; RCV: right carotid vein; LV: left ventricle; RV: right ventricle. All images shown are representative images from three animals unless otherwise specified. The ECG data are from a single animal.
-
Figure 2—source data 1
R-wave.
- https://cdn.elifesciences.org/articles/67858/elife-67858-fig2-data1-v1.csv
-
Figure 2—source data 2
PR interval.
- https://cdn.elifesciences.org/articles/67858/elife-67858-fig2-data2-v1.csv
-
Figure 2—source data 3
Flourescence.
- https://cdn.elifesciences.org/articles/67858/elife-67858-fig2-data3-v1.csv
Figure 2—figure supplement 1
Hcn4BAC-CatCh2_IRES_LacZ mice.
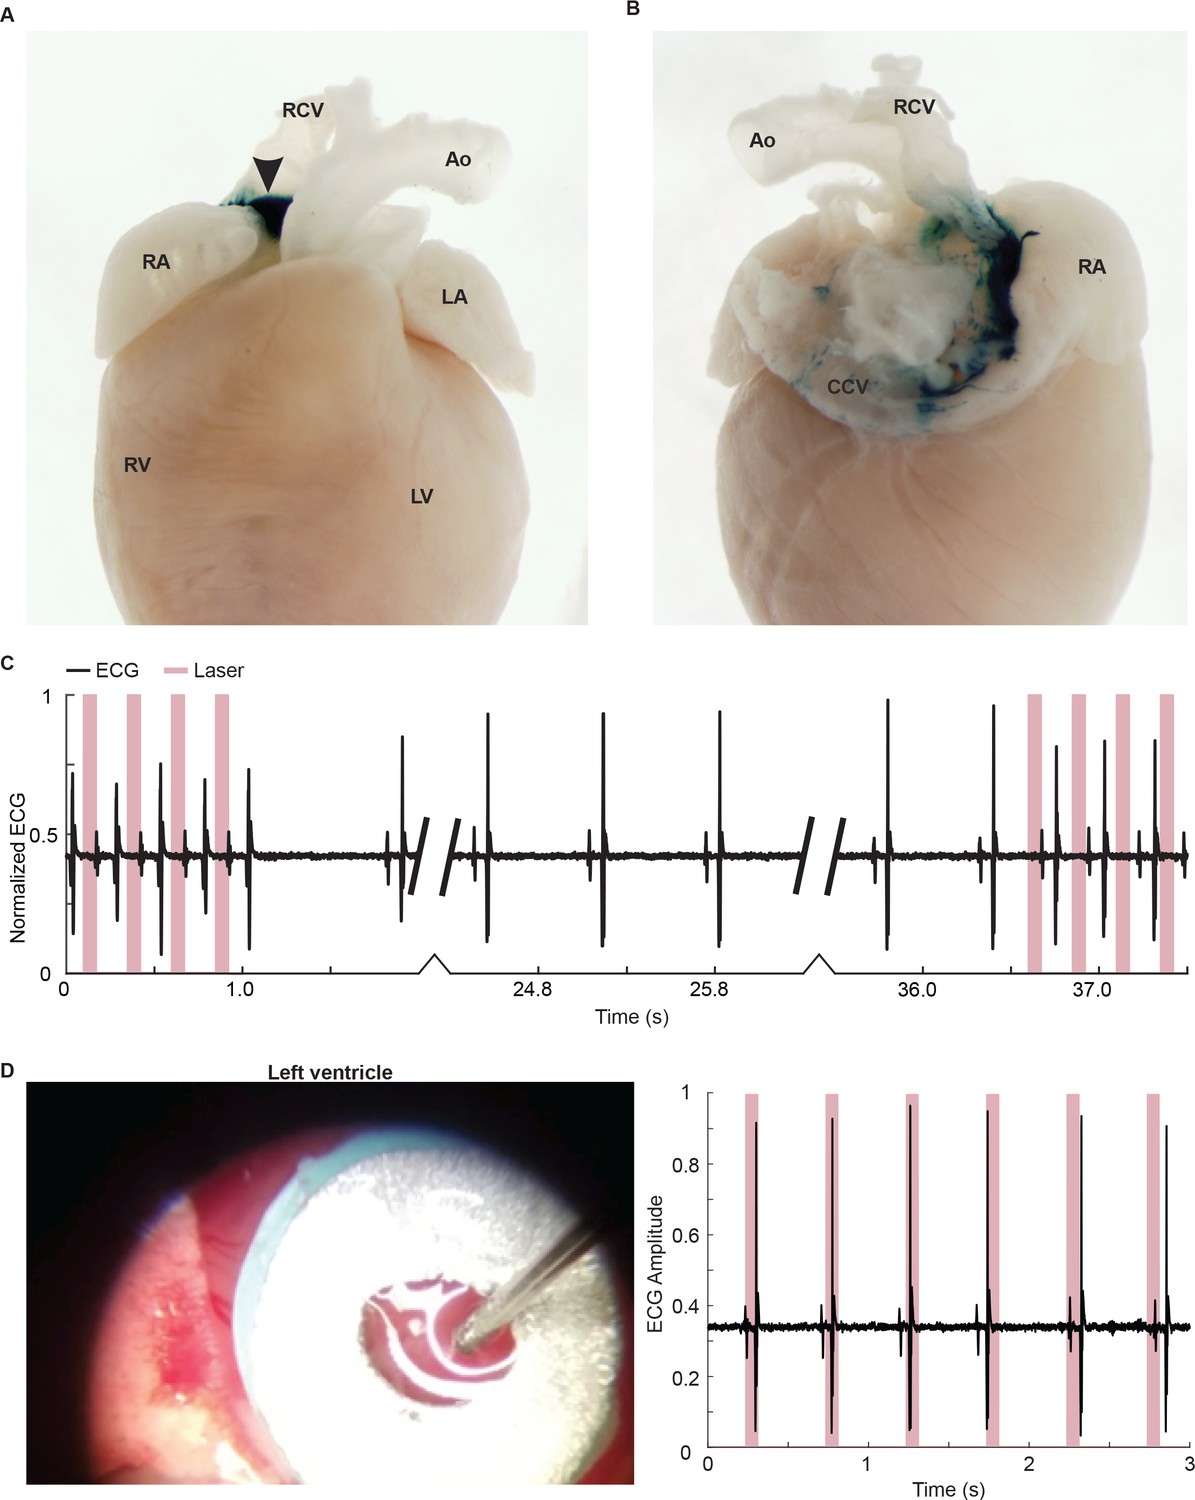
(A) Ventral view of X-gal stained adult whole heart showing LacZ-expressing tissue at the base of the right carotid vein (arrow). (B) Dorsal view showing LacZ expression along the right carotid vein starting at the junction with right atrium and extending to the base of common carotid vein loop. Ao: aorta; RCV: right carotid vein; RA: right atrium; CCV: common carotid vein. (C) ECG pacing at 4 Hz can be reestablished after return to native cardiac rhythm. (D) Laser stimulation of non-CatCh2-expressing tissue does not lead to ECG pacing. All images shown are representative images from three animals unless otherwise specified.
Figure 2—figure supplement 2
GCaMP8 fluorescence in hearts from Hcn4BAC-GCaMP8 mice.
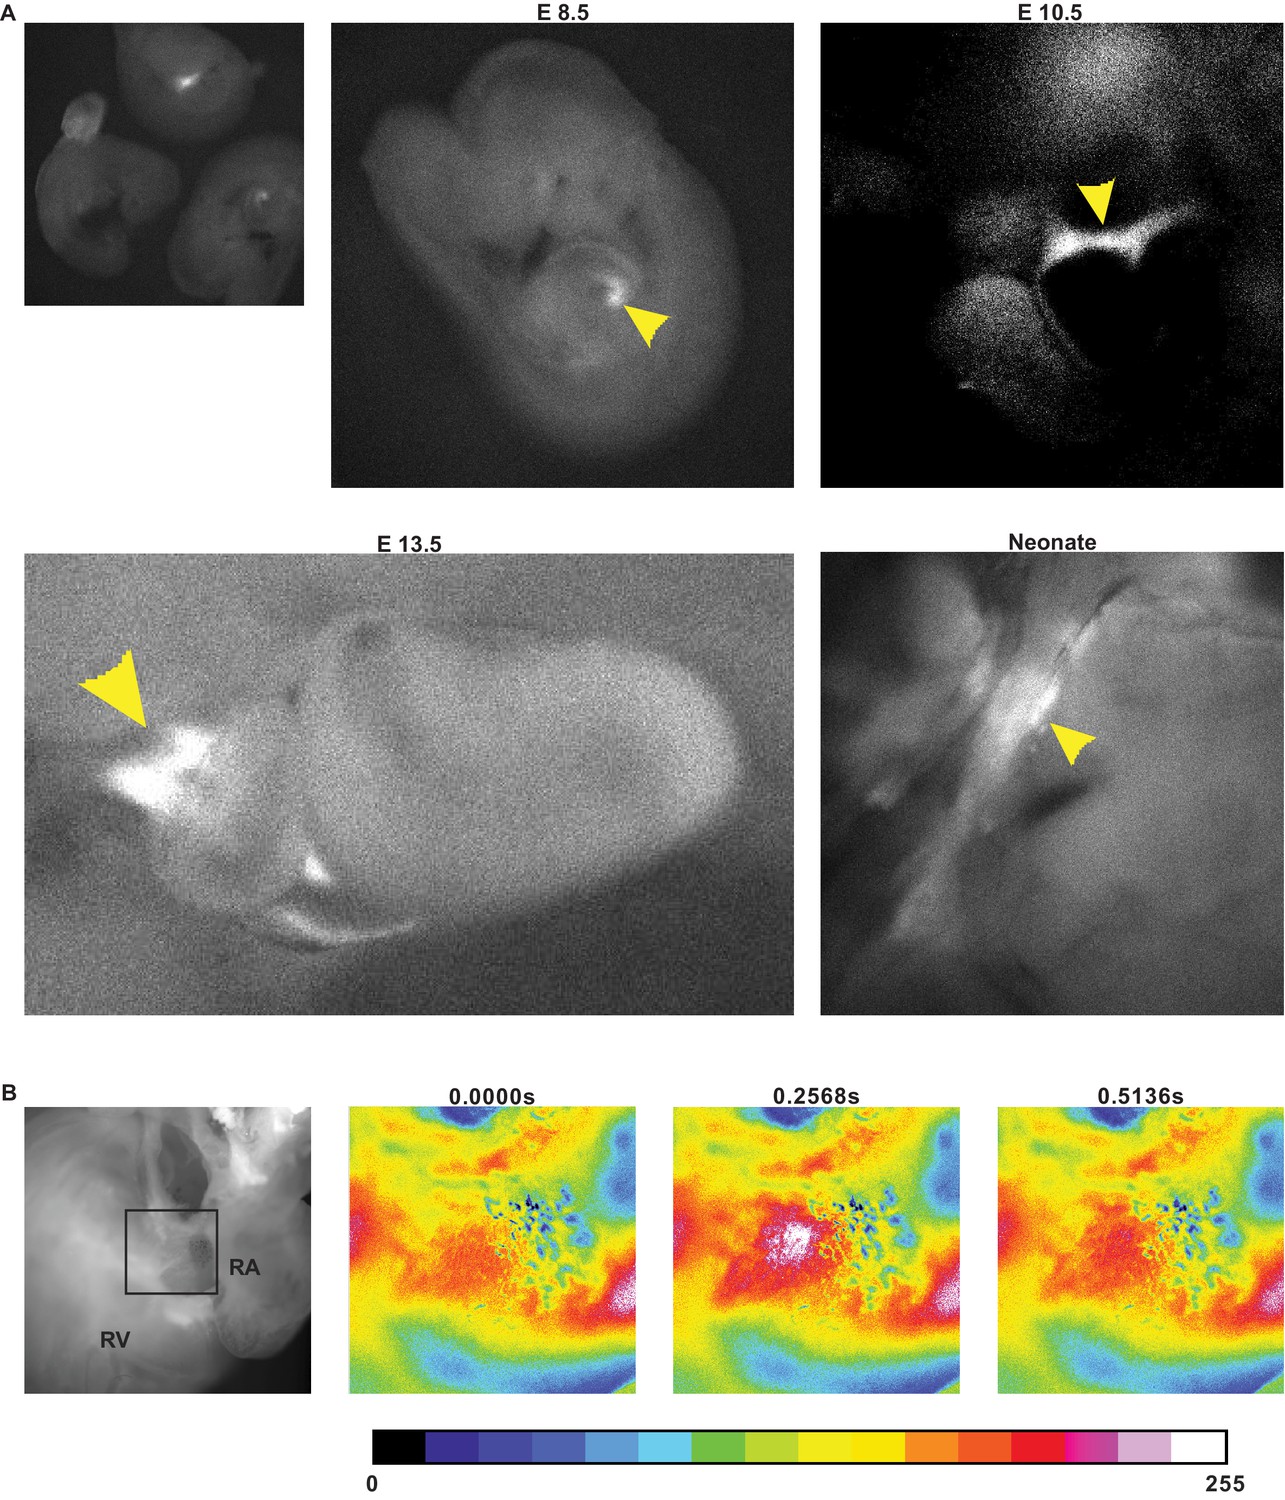
(A) Native fluorescence from sinoatrial (SA) nodal tissue in developing embryos. Left inset: two transgenic embryos and one non-transgenic embryo; arrowhead points to SA nodal tissue with GCaMP8 signal. (B) GCaMP8 activity in the junction between right atrium (RA) and right ventricle (RV) in a single contraction cycle. The outer wall over the junction was removed to expose the internal tissue. Colorization was achieved using the 16-color LUT in Fiji program and the scale is shown below the images. The box denotes the area of enlargement. All images shown are representative images from three animals unless otherwise specified.
Figure 2—video 1
GCaMP8 fluorescence from laser pacing of Hcn4BAC-CatCh2/Myh6-GCaMP8 heart.
Laser stimulation at the sinoatrial (SA) node in the biallelic heart results in pacing of GCaMP8 fluorescence in the left ventricle. The white strip to the right of the ventricle denotes laser pulse.
Figure 2—video 2
GCaMP8 fluorescence in a E13.5 heart from an Hcn4BAC-GCaMP8 mouse.
GCaMP8 fluorescence migrates from the sinoatrial (SA) node to the left ventricle.
Figure 2—video 3
GCaMP8 fluorescence in the atrioventricular junction of Hcn4BAC-GCaMP8 adult heart.
The image was colorized in ImageJ; for color scale, see online Figure 3.
Figure 3 with 2 supplements
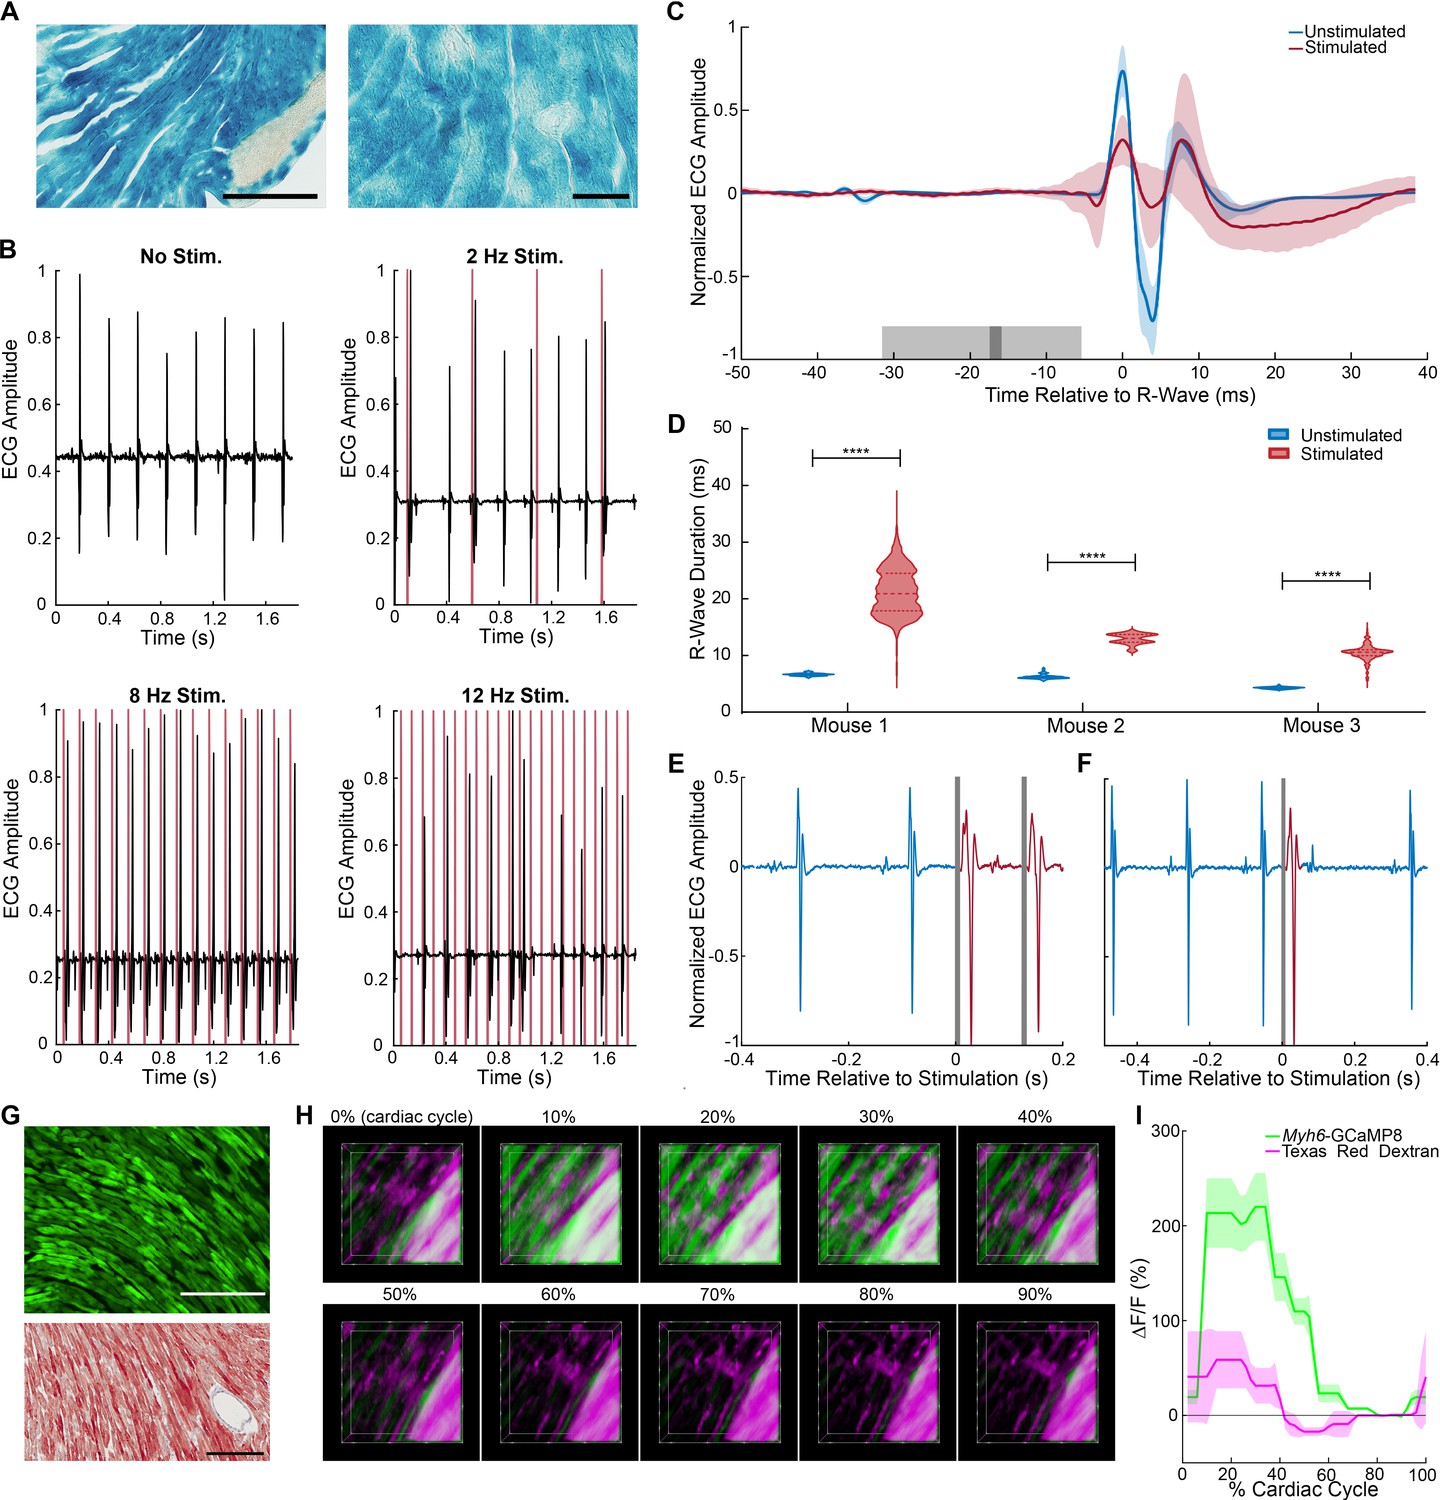
Cardiomyocyte optoeffector and optosensor mice.
(A) X-gal staining of cardiomyocytes in Myh6-CatCh2_IRES_lacZ, scale bar: 200 and 60 µm. (B) ECG recording during intravital laser stimulation of the CatCh2 protein in the left ventricle at various frequencies (laser power is 32.2 mW, average pulse length is 14 ms). (C) R-wave-centered average of all stimulated and unstimulated beats shows R-wave widening (shading indicates standard deviation of ECG signal, dark and light gray indicate average and standard deviation of laser pulse onset and offset times). (D) R-wave durations with and without laser stimulation of the transgenic CatCh2 protein are shown from three different mice (****p<0.0001, Mann–Whitney test). Source data: Figure 3—source data 1 (E) ECG recordings demonstrating transition from autonomous to laser-stimulated conduction. (F) Premature ventricular contractions evoked by laser stimulation of Myh6-CatCh2 ventricular myocytes. (G) Expression of GCaMP8 in the heart of an adult Myh6-GCaMP8 mouse; top: native fluorescence; bottom: anti-GFP immunohistochemistry; scale bars: 200 µm. (H) Intravital two-photon microscopy of the Myh6-GCaMP8 heart. Frames from a three-dimensional reconstruction of Myh6-GCaMP8 fluorescence over a cardiac cycle. Each frame represents a 10% increment of the cardiac cycle defined by the peak of the R-wave. The x-axis is the anterior to posterior direction, the y-axis is the apex to base direction, and the z-axis is the epicardium to endocardium direction of the left ventricle free wall; 166 × 166 × 100 μm (xyz) region shown. GCaMP8 fluorescence in cardiomyocytes (green); vasculature labeled with Texas Red-conjugated dextran (magenta). (I) Average and standard deviation of change in fluorescence intensity of the imaged region demonstrating Ca2+ transients during the cardiac cycle. All images shown are representative images from three animals unless otherwise specified. The ECG data are from three animals.
-
Figure 3—source data 1
R-wave duration.
- https://cdn.elifesciences.org/articles/67858/elife-67858-fig3-data1-v1.csv
Figure 3—figure supplement 1

Laser stimulation of wildtype left ventricle.
ECG recording during intravital laser stimulation of left ventricle from a wildtype control strain at various frequencies (laser power is 32.2 mW, average pulse length is 14 ms).
Figure 3—video 1
Image stack from two-photon imaging of ventricle contraction in Myh6-GCaMP8.
Green: GCaMP8; red: Texas Red dextran in vessels.
Figure 4 with 3 supplements
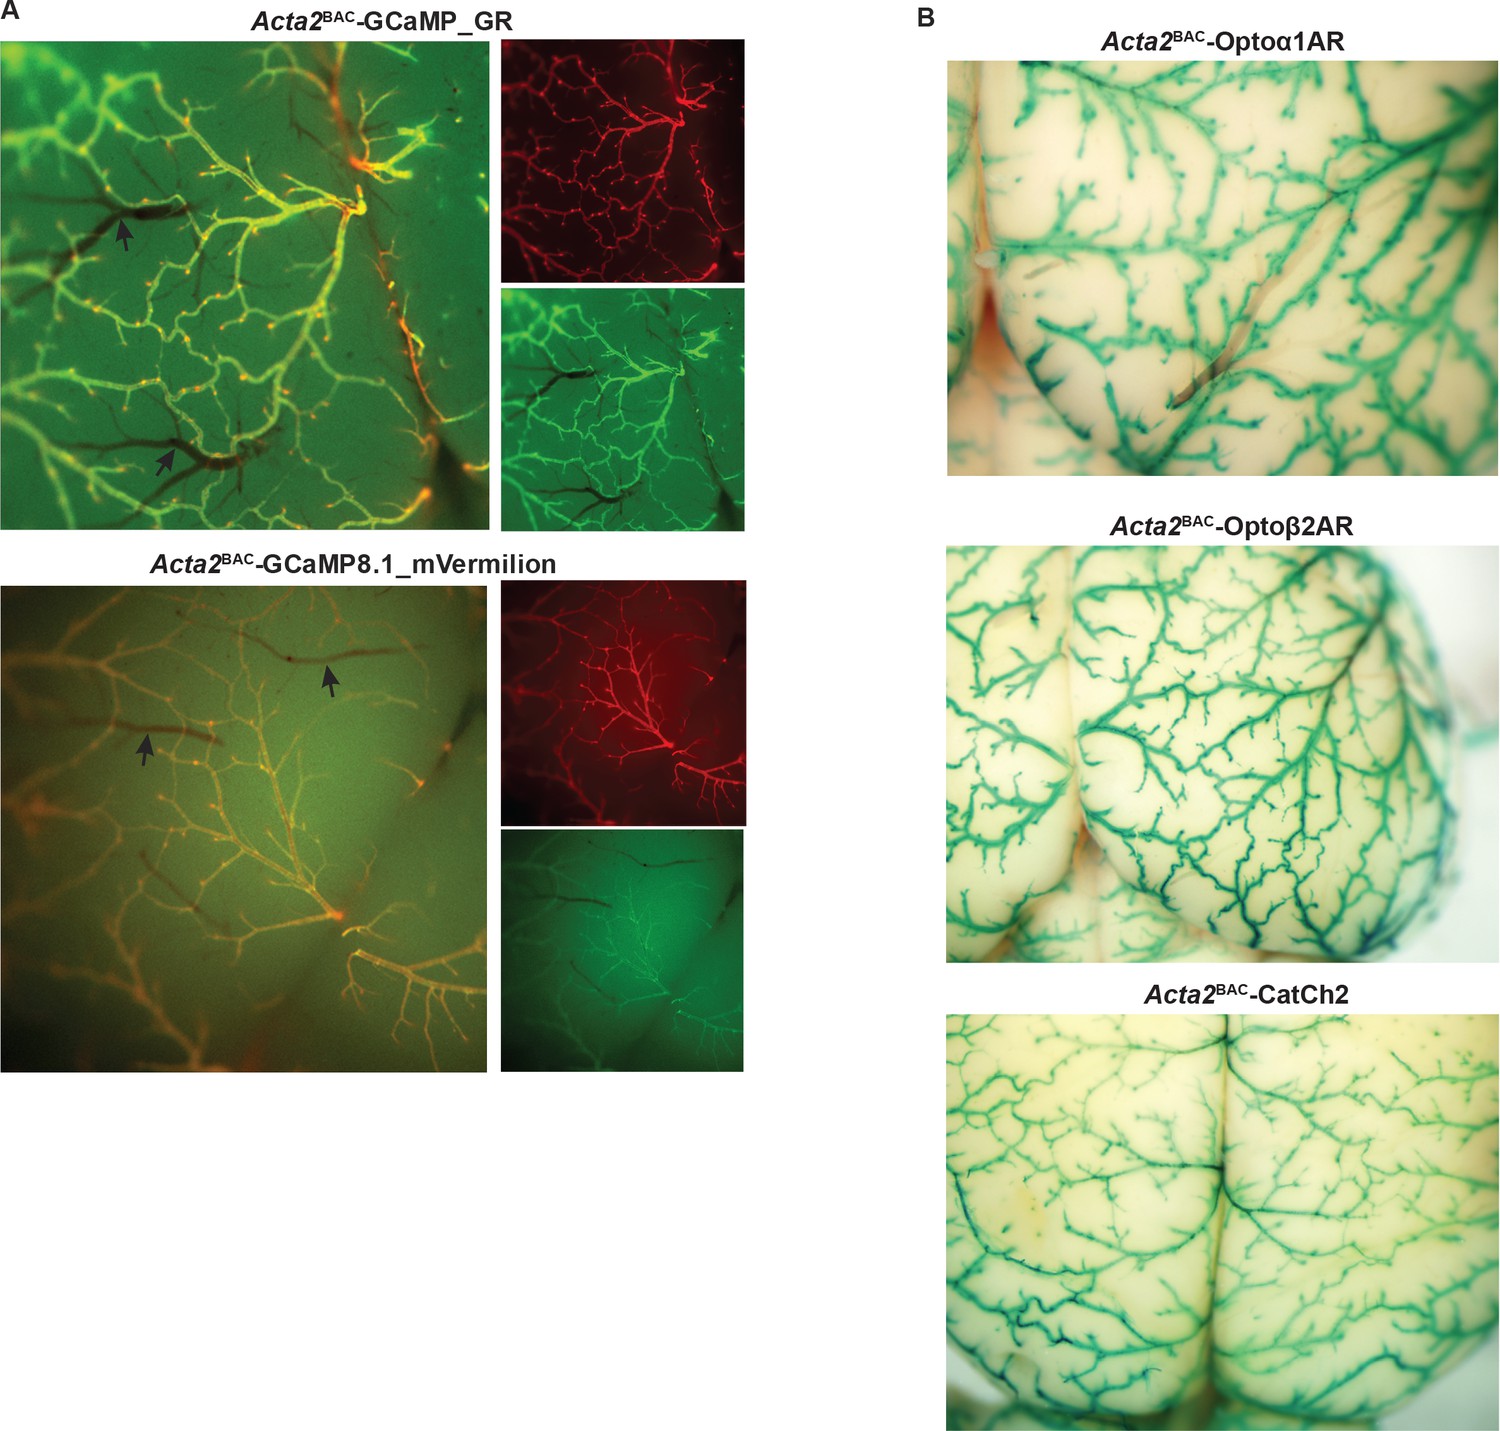
Smooth muscle optoeffector and optosensor expression.
(A) Native fluorescence of surface blood vessels from Acta2BAC-GCaMP_GR (upper) and Acta2BAC-GCaMP8.1_mVermilion brain (lower). Note the absence of fluorescence in veins (arrows). Left panel: overlay; right panels: red and green channels. (B) X-gal staining of brain surface arteries from Acta2 optoeffector mice. All images shown are representative images from three animals unless otherwise specified.
Figure 4—figure supplement 1
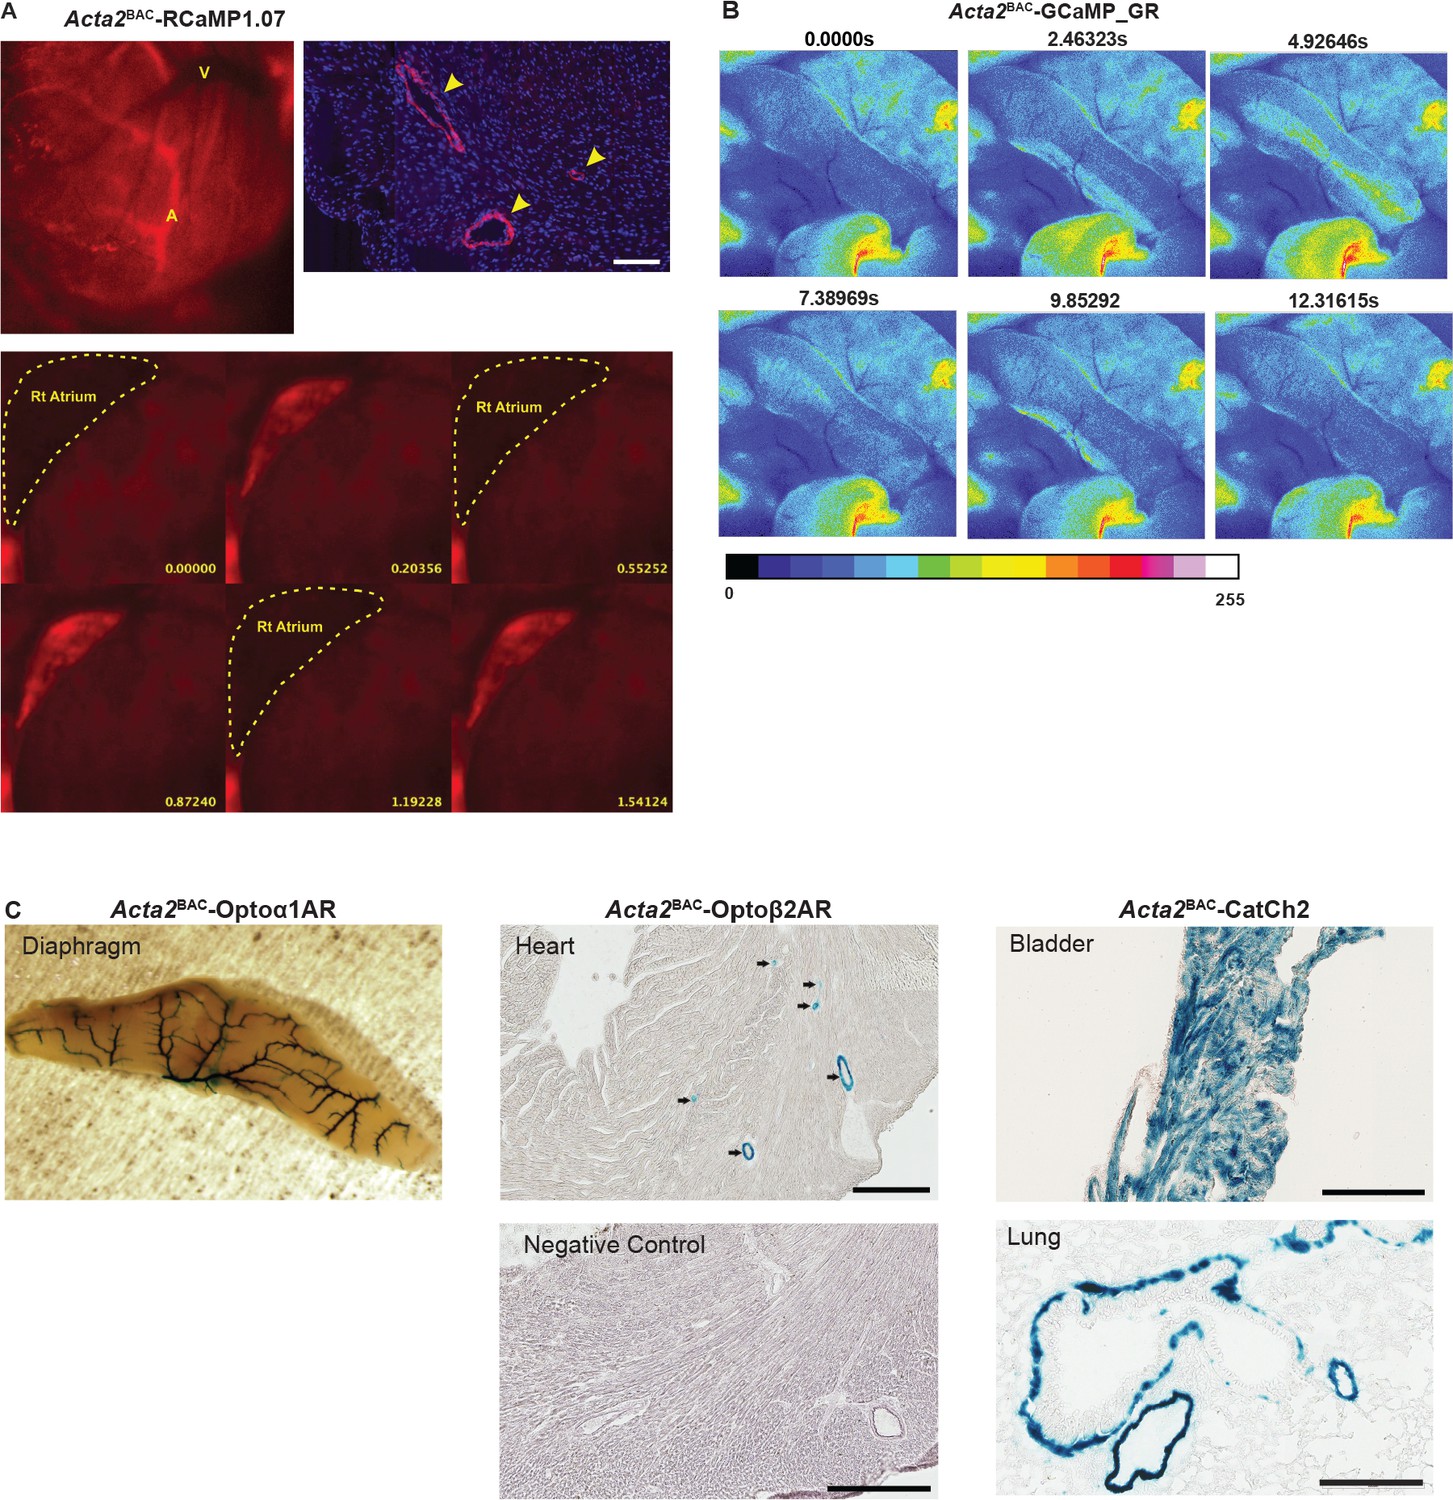
Acta2BAC optogenetic reporter and effector lines.
(A) RFP expression in Acta2BAC-RCaMP1.07. Upper panel: the RCaMP1.07 is expressed in coronary artery (A) but not veins (V). Scale bar: 100 µm. Lower panel: RCaMP1.07 fluorescence signaling in the right atrium (dashed line: right atrium). (B) GCaMP signal in longitudinal muscle of large intestine (taeniae coli) demonstrating intracellular Ca2+ concentration changes with muscle contraction and relaxation. Color scale shown below the images. (C) X-gal staining in various tissues from Acta2BAC effector mice and non-transgenic litter mate. Scale bars; Upper panels: 300 µm; Lower panels: 200 µm. All images shown are representative images from three animals unless otherwise specified.
Figure 4—video 1
RCaMP1.07 fluorescence in right atrium of Acta2BAC-RCaMP1.07.
Figure 4—video 2
GCaMP fluorescence in large intestine of Acta2BAC-GCaMP_GR mouse.
The image was colorized in ImageJ; for color scale, see Figure 4—figure supplement 1.
Figure 5 with 3 supplements
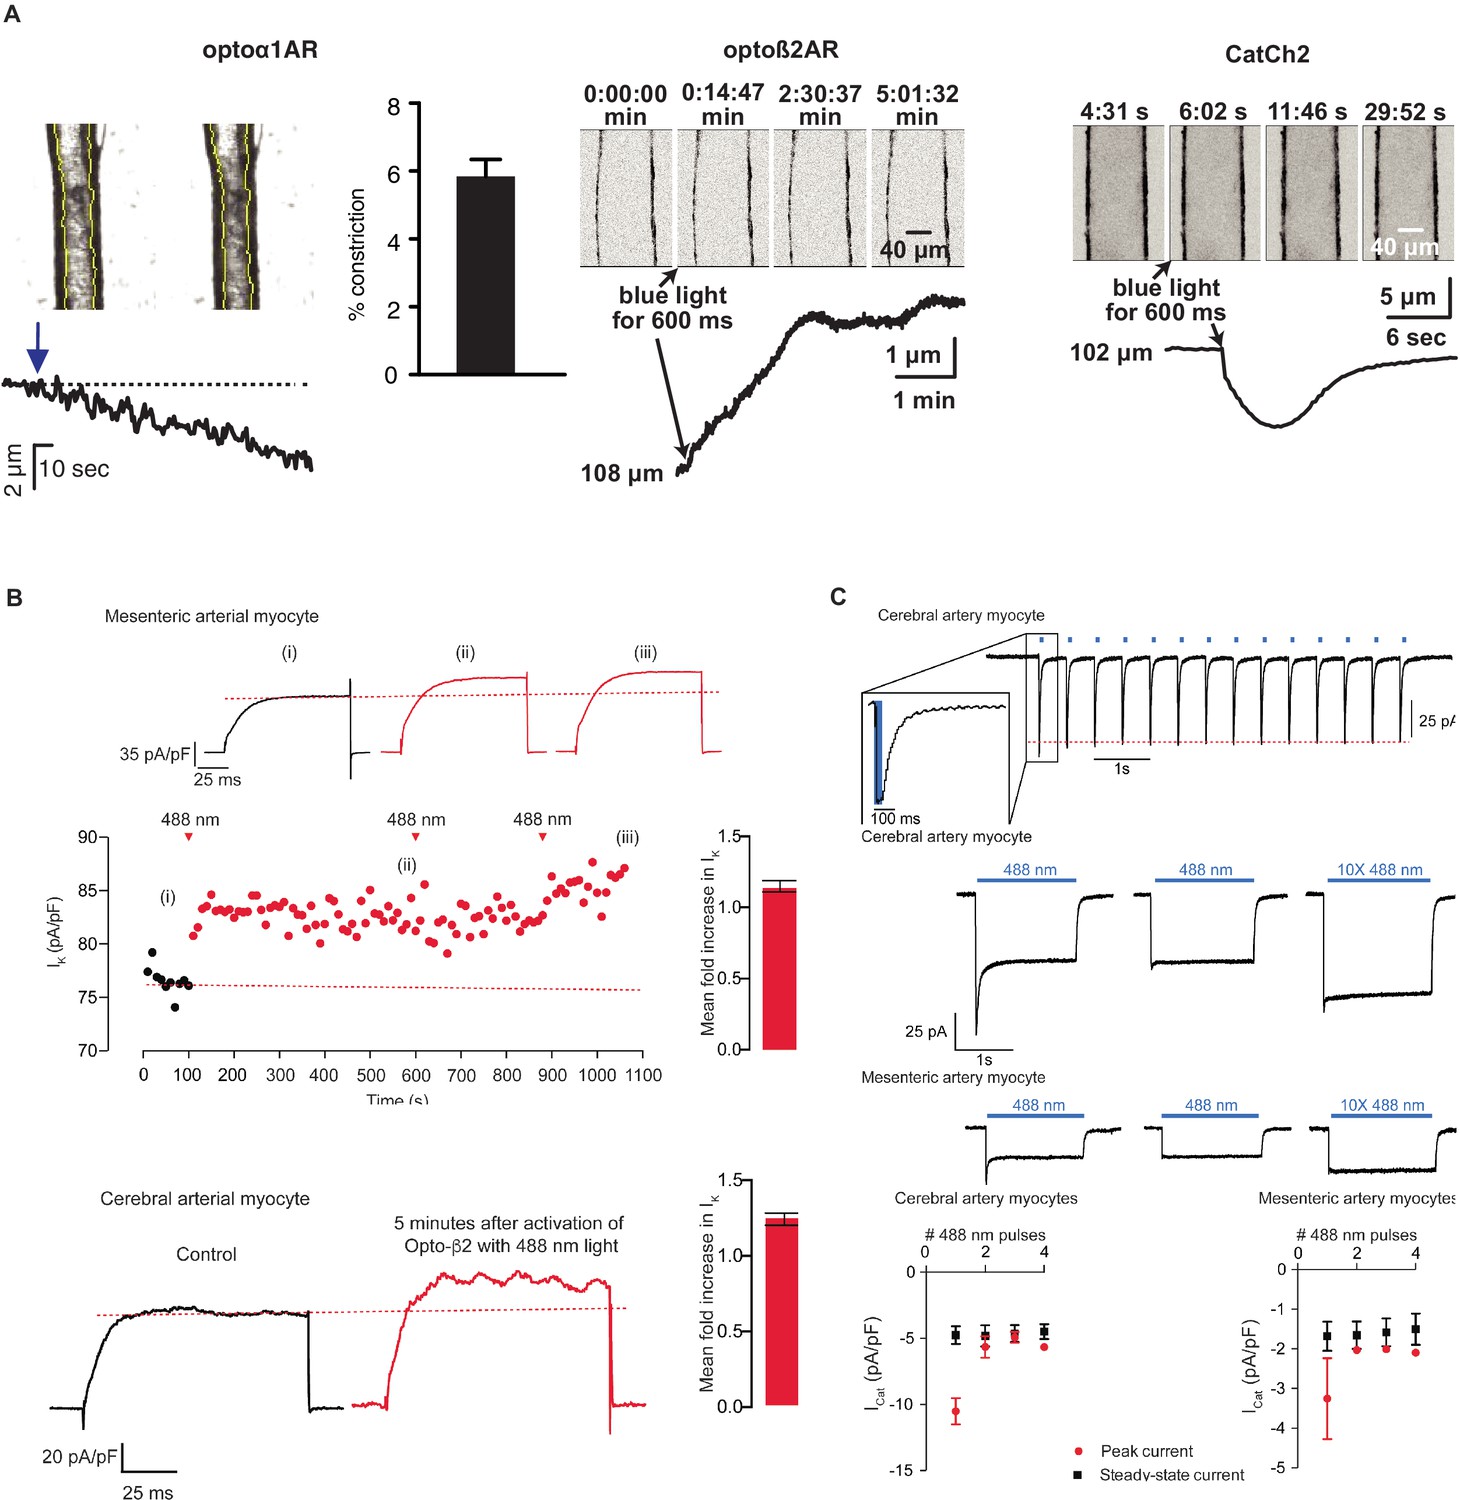
Smooth muscle optoeffector function.
(A) Activation of optogenetic proteins in effector lines results in either vessel contraction (Acta2BAC-Optoα1AR_IRES_lacZ: left panel; Acta2BAC-CatCh2_IRES_lacZ: right panel) or relaxation (Acta2BAC-Optoß2AR_IRES_lacZ: middle panel). Source data: Figure 5—source data 1. (B) Laser activation of transgenic Optoß2AR proteins induces K currents in isolated arterial myocytes. Upper panel: mesenteric myocytes; lower panel: cerebral myocytes. Source data: Figure 5—source data 2. (C) Laser activation of transgenic CatCh2 protein induces inward membrane current. Upper panel: repeated laser pulses result in rapid inward current in cerebral myocytes. Middle panels: long pulses achieve a steady-state inward current in cerebral (upper) and mesenteric myocytes (lower) after an initial spike only on the first pulse. Bottom panel: activation of cerebral myocytes results in higher initial and steady-state current compared to mesenteric myocytes. Optoα1AR and Optoß2AR data were derived from five cells isolated from three mice, and the CatCh2 data were generated from eight cells isolated from five mice.
-
Figure 5—source data 1
Arterial diameter.
- https://cdn.elifesciences.org/articles/67858/elife-67858-fig5-data1-v1.csv
-
Figure 5—source data 2
K currents.
- https://cdn.elifesciences.org/articles/67858/elife-67858-fig5-data2-v1.csv
Figure 5—figure supplement 1
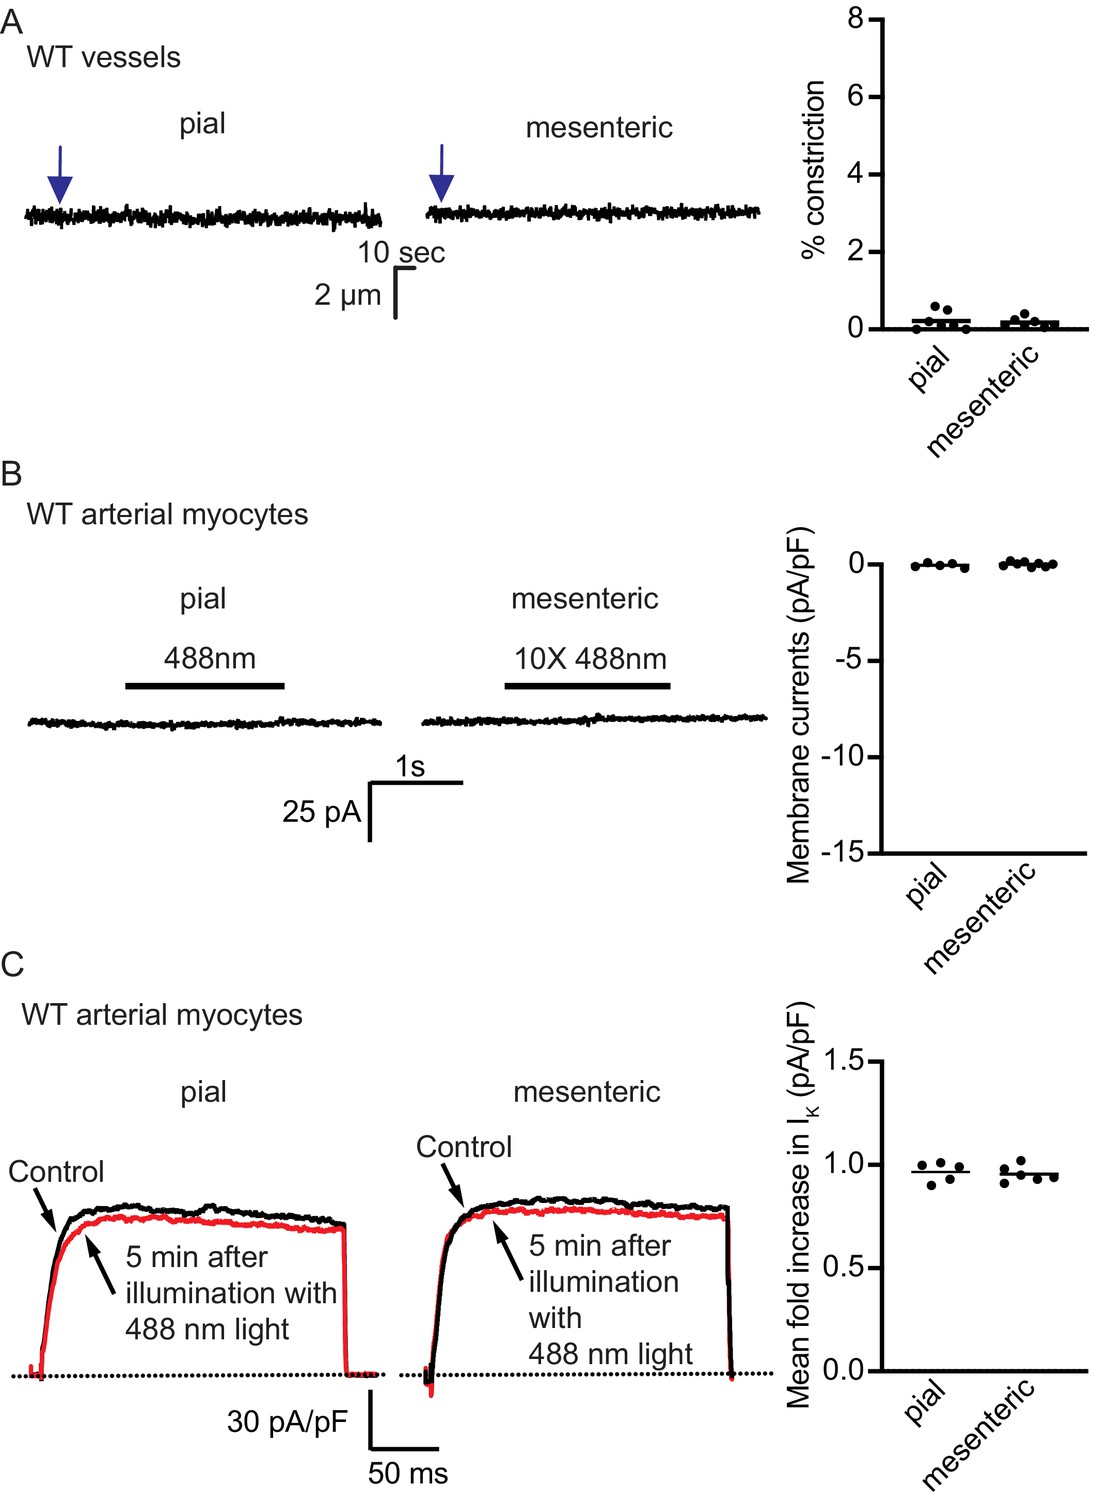
Light activation of wildtype control strains.
(A) Representative arterial diameter records from pressurized WT pial (right) and mesenteric (center) vessels before and after (arrow) illumination with 488 nm light. The scatter plot to the left summarizes the % constriction from seven WT mesenteric and seven pial arteries after 488 nm light exposure (from three mice). Laser intensity was similar to the one used for the experiments in Figure 5. (B) Exemplar membrane current records from isolated WT pial (left) and mesenteric (center) arterial myocytes before and after successive low- and high-power (10×) illumination with 488 nm light. The scatter plot to the left summarizes the magnitude of the current change during 10 × 488 nm light exposure from WT five mesenteric and eight pial artery myocytes. (C) Kv current traces from representative pial (left) and mesenteric (center) artery myocytes. Currents were evoked with a voltage step from –70 mV to +50 mV before and after 488 nm laser light illumination. The scatter plot to the left summarizes the magnitude of the current change during 488 nm light exposure from WT six mesenteric and five pial artery myocytes.
Figure 5—video 1
Dilation of Acta2BAC-Optoß2AR artery stimulated with blue light.
Figure 5—video 2
Vasoconstriction of Acta2BAC-CatCh2 artery stimulated with blue light.
Figure 6 with 1 supplement
Endothelial cell optoeffector and optosensor expression.
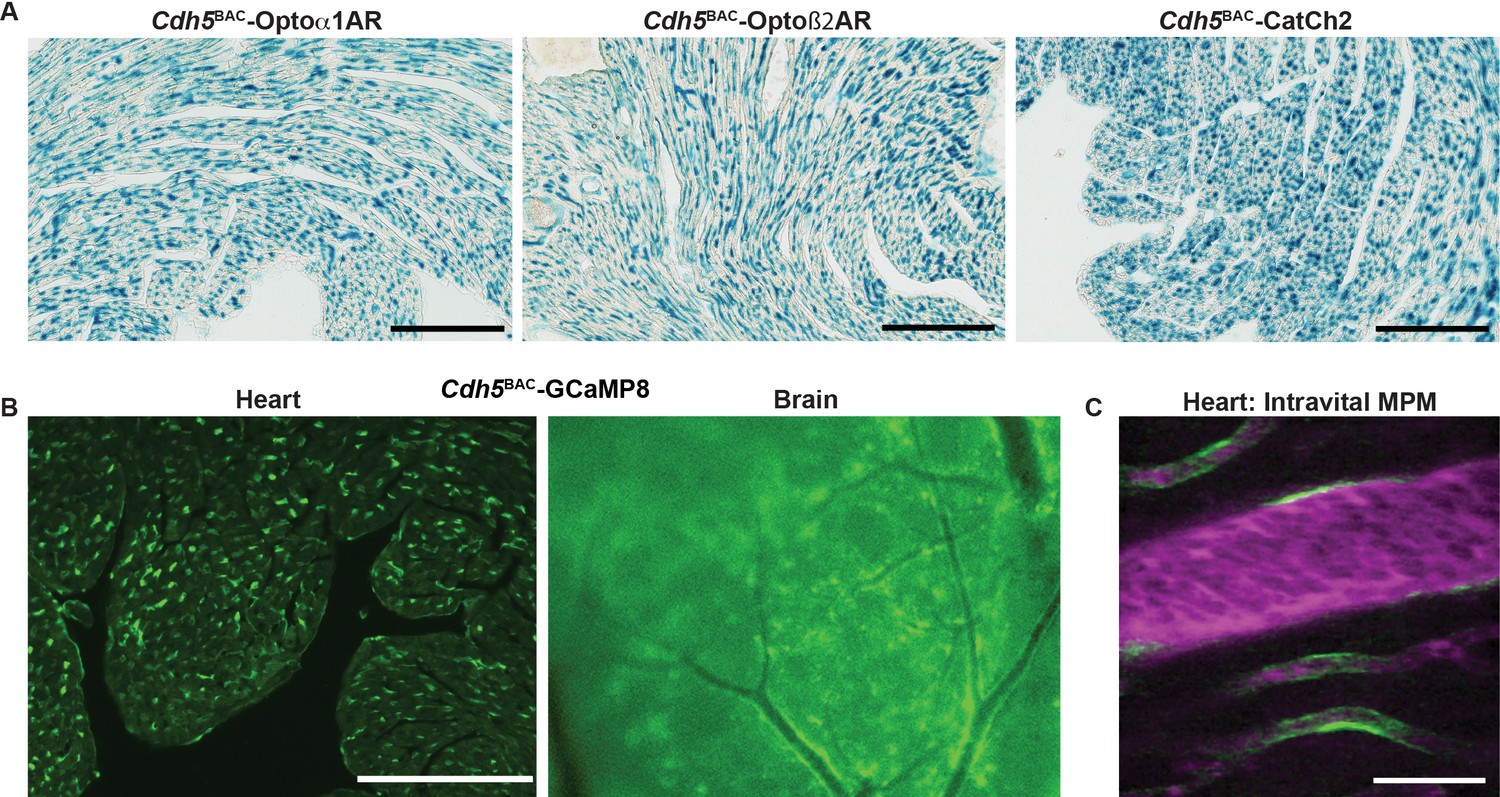
(A) X-gal staining of heart cryosections from Cdh5BAC-Optoα1AR_IRES_lacZ, Cdh5BAC-Optoß2AR_IRES_lacZ, and Cdh5BAC-CatCh2_IRES_lacZ mice. Scale bars: 200 µm. (B) Native fluorescence of GCaMP8 protein in heart cryosection (left panel) and brain dorsal surface (right panel). Scale bar: 200 µm. (C) Intravital two-photon imaging of Cdh5 BAC-GCaMP8 mice shows endothelial GCaMP8 (green) labeling of coronary microvasculature. Intravenous Texas Red-conjugated 70 kDa dextran identifies the vessel lumen (magenta). All images shown are representative images from three animals unless otherwise specified.
Figure 6—figure supplement 1
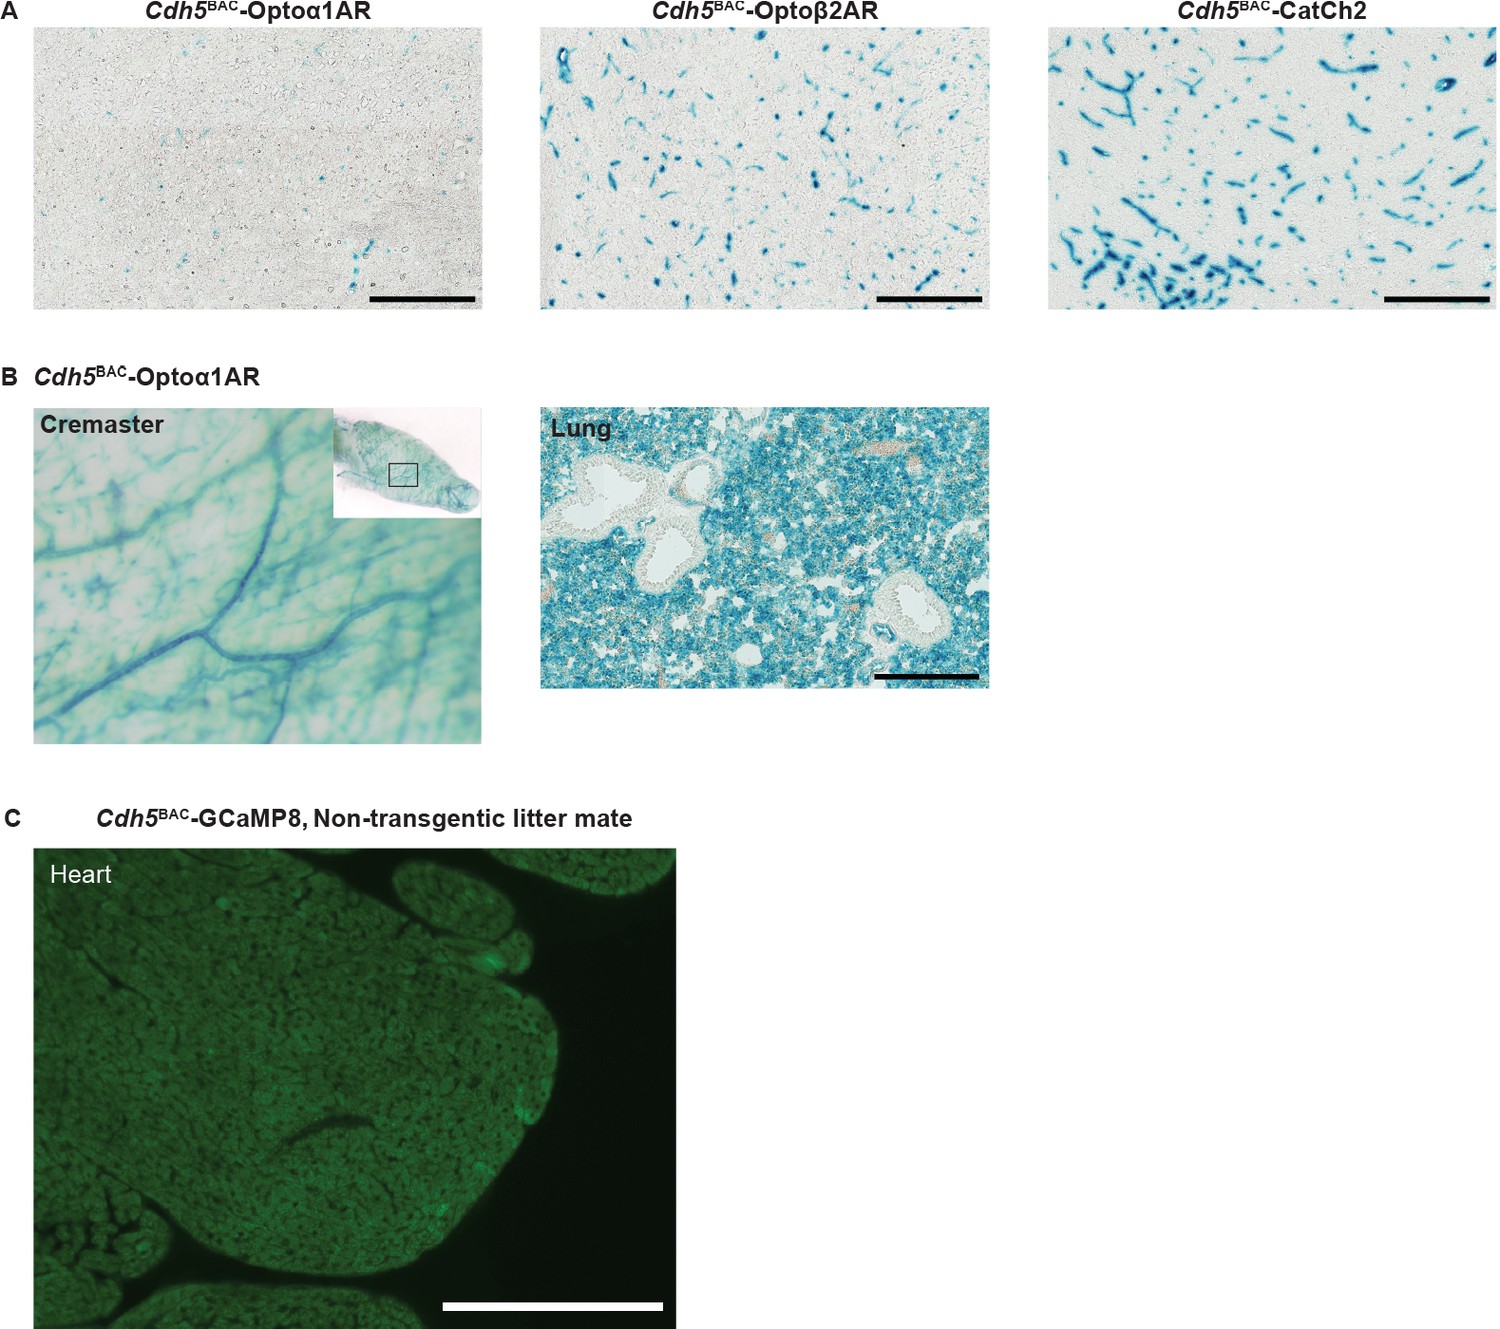
Cdh5BAC lines.
(A) X-gal staining of brain blood vessel from Cdh5 optoeffector mice. (B) X-gal staining of vasculature in cremaster muscle and lung cryosection from Cdh5BAC-Optoα1AR mouse. Left panel: cremaster staining; right panel: staining of lung vasculature. Scale bar: 200 µm. (C) Native fluorescence image from a non-transgenic litter mate shows no GCaMP8 fluorescence compared to transgenic litter mate in Figure 6B. Scale bar: 200 µm. All images shown are representative images from three animals unless otherwise specified.
Figure 7 with 1 supplement
Endothelial cell optoeffector function.
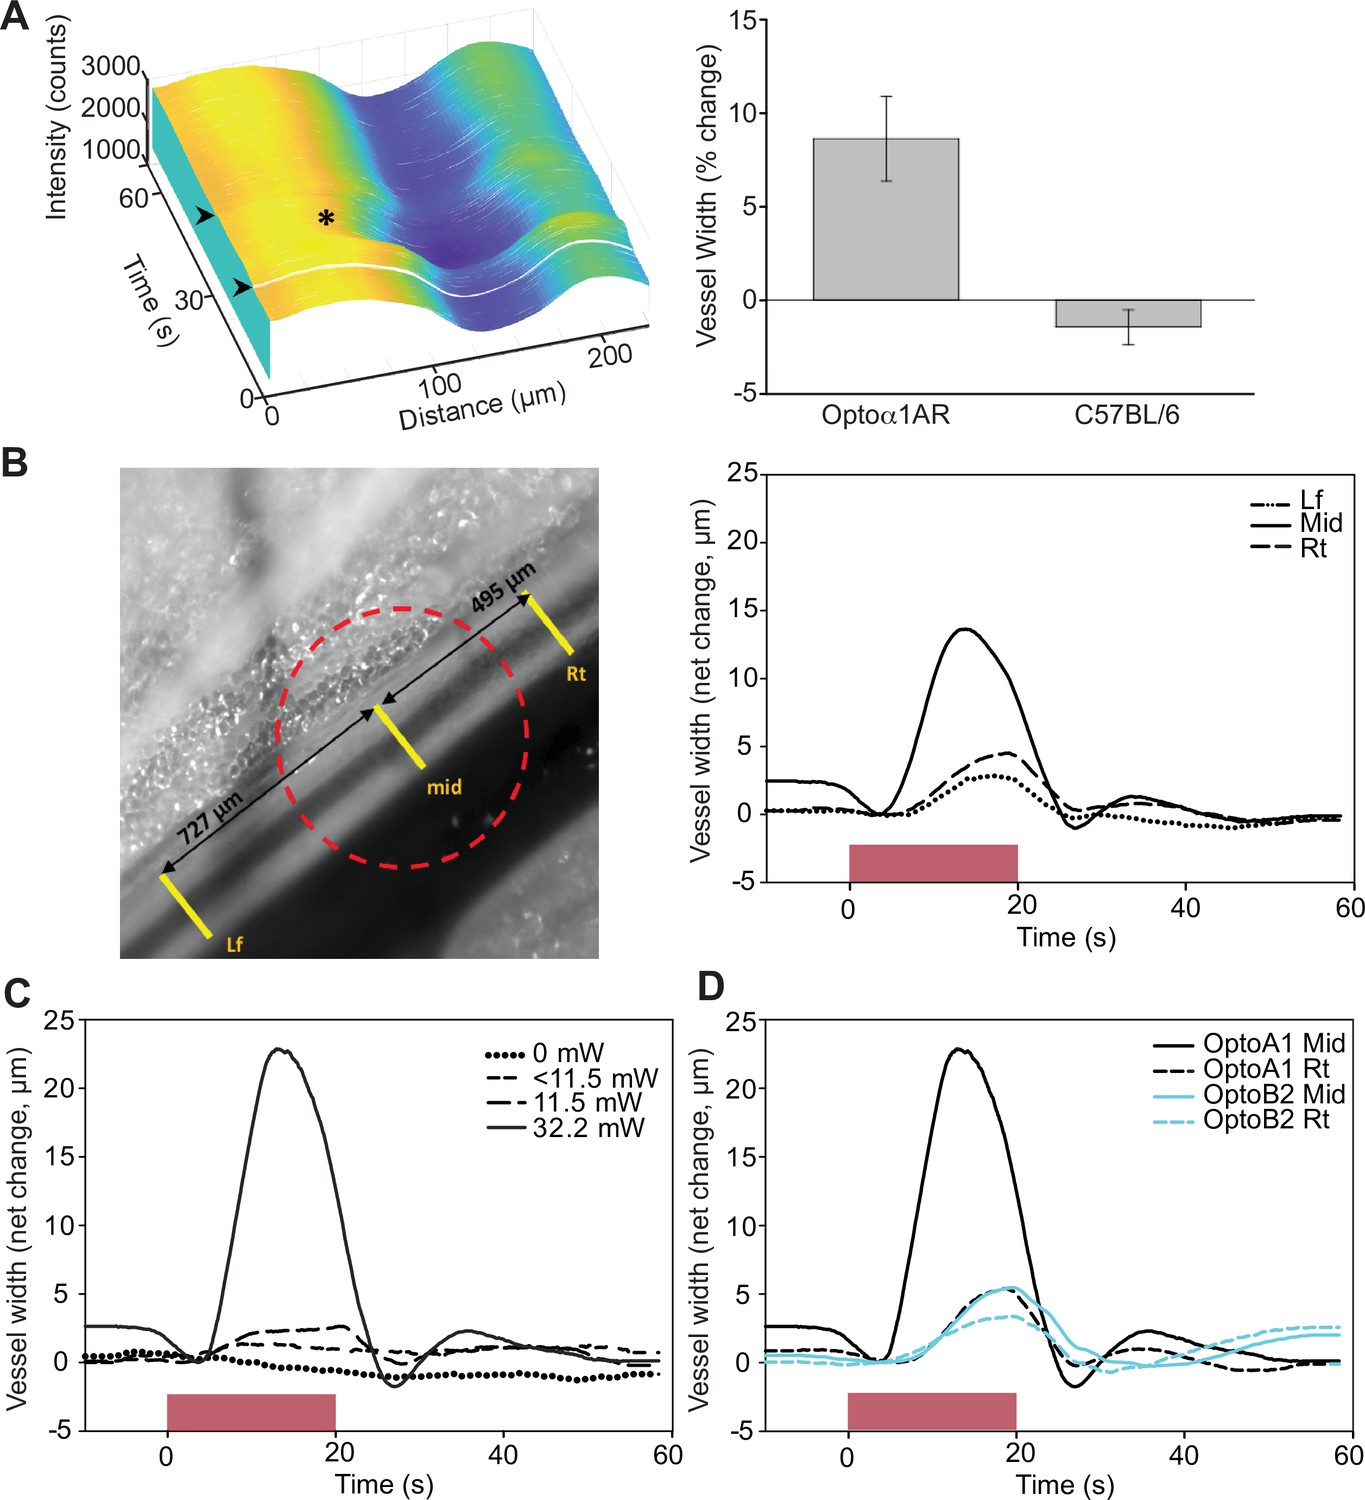
(A) Laser stimulation of femoral artery in Cdh5BAC-Optoα1AR induces vasodilation. Left panel: MATLAB-generated 3D rendering of vessel width and intensity over time. The arrowheads mark the start and end of laser activation, and the asterisk marks dilation of the artery. Right panel: comparison of peak change in vessel width between Cdh5BAC-Optoα1AR_IRES_lacZ and C57BL/6J control mice. ***p=0.003, Holm–Sidak (± SE). Optoα1AR data were derived from five femoral arteries from five animals, and the C57BL/6J data were derived from five femoral arteries from three animals. Source data: Figure 7—source data 1. (B) Activation of Optoα1AR protein results in migration of vasodilation away from the laser irradiation point. Left panel: brightfield image of the femoral artery with positions of the mid, right (Rt), and left (Lf) analysis positions indicated. Red dashed circle indicates laser irradiation spot on the vessel. Right panel: change in vessel width over time. Source data: Figure 7—source data 2. (C) Vessel relaxation is dependent on laser intensity. Source data: Figure 7—source data 3. (D) Comparison of vasodilation induced by Optoα1AR and Optoß2AR proteins with laser power at 32.2 mW. Source data: Figure 7—source data 4. The data in (B–D) represent experiments with three animals.
-
Figure 7—source data 1
Arterial diameter.
- https://cdn.elifesciences.org/articles/67858/elife-67858-fig7-data1-v1.csv
-
Figure 7—source data 2
Arterial diameter.
- https://cdn.elifesciences.org/articles/67858/elife-67858-fig7-data2-v1.csv
-
Figure 7—source data 3
Arterial diameter.
- https://cdn.elifesciences.org/articles/67858/elife-67858-fig7-data3-v1.csv
-
Figure 7—source data 4
Arterial diameter.
- https://cdn.elifesciences.org/articles/67858/elife-67858-fig7-data4-v1.csv
Figure 7—figure supplement 1
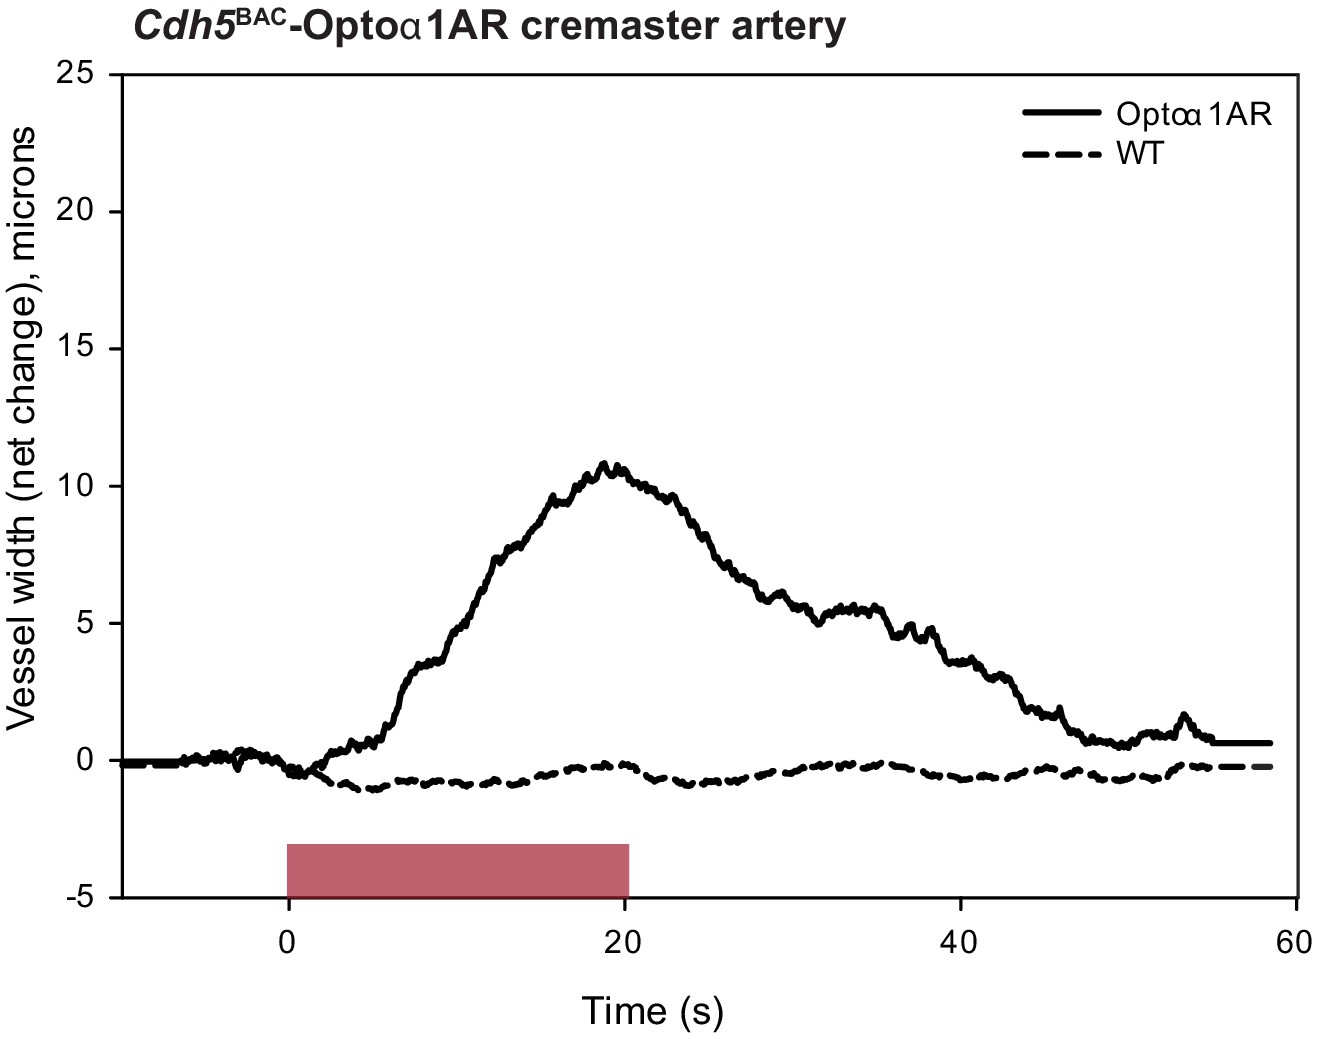
Laser activation of cremaster artery from Cdh5BAC-Optoα1AR leads to vessel dilation.
Source data: Figure 7—figure supplement 1—source data 1.
-
Figure 7—figure supplement 1—source data 1
Arterial diameter.
- https://cdn.elifesciences.org/articles/67858/elife-67858-fig7-figsupp1-data1-v1.csv
Figure 8 with 1 supplement
Characterization of other CHROMus mouse lines.
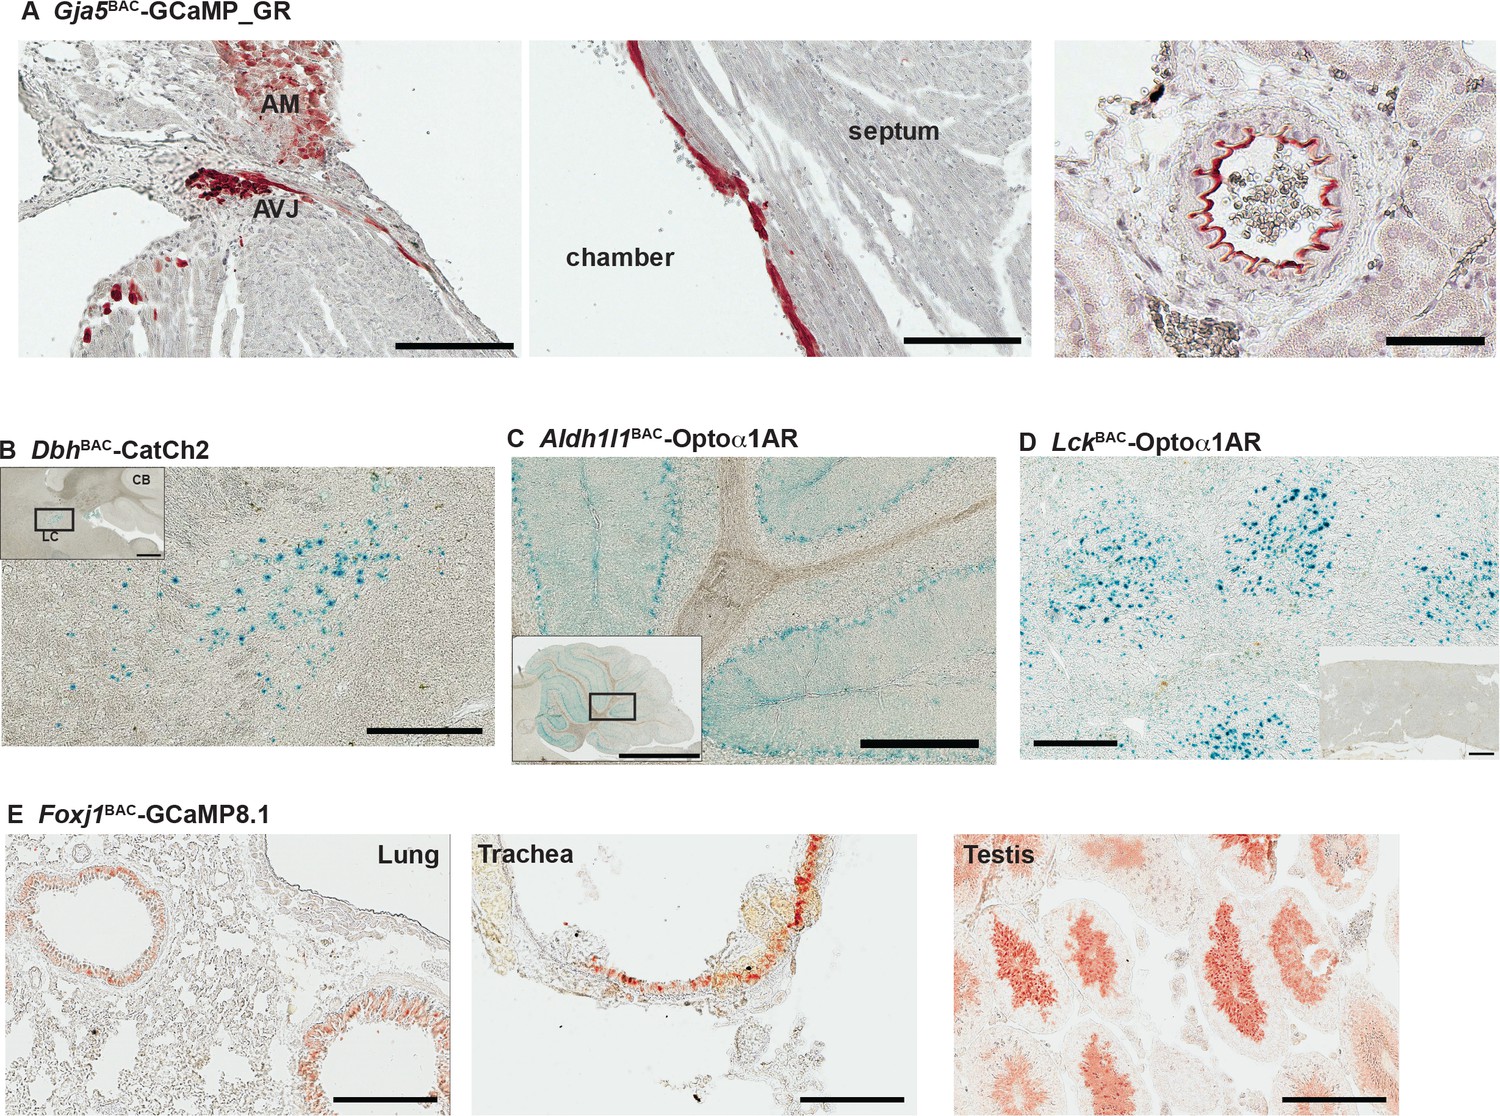
(A) Anti-GFP immunohistochemistry (IHC) of Gja5BAC-GCaMP_GR mouse. The modified GCaMP3 protein is expressed in the atrioventricular junction (AVJ) region, atrial myocytes (AM) (left panel) and cells lining the endocardium in the adult heart (middle panel; scale bars: 200 µm) and the renal artery (right panel; scale bar: 60 µm). (B) X-gal staining of adult brain sagittal section from DbhBAC-CatCh2_IRES_lacZ mouse showing LacZ expression in the locus coeruleus region. Box outlines area of enlargement. CB: cerebellum; LC: locus coeruleus. Scale bars; top panel: 500 µm; bottom panel: 200 µm. (C) X-gal staining of cerebellar region from Aldh1l1BAC-Optoα1AR_IRES_lacZ mouse. Box outlines area of enlargement. Scale bars; top panel: 2 mm; bottom panel: 200 µm. (D) X-gal staining of spleen from LckBAC-Optoα1AR_IRES_lacZ mouse. Inset image shows X-gal staining from a wildtype littermate control. Scale bars: 300 µm; inset: 600 µm. (E) Anti-GFP IHC of lung, trachea, and testis tissues from Foxj1BAC-GCaMP8.1 mouse. Scale bars: 200 µm. All images shown are representative images from three animals unless otherwise specified.
Figure 8—figure supplement 1
Transgene expression in other CHROMus lines.
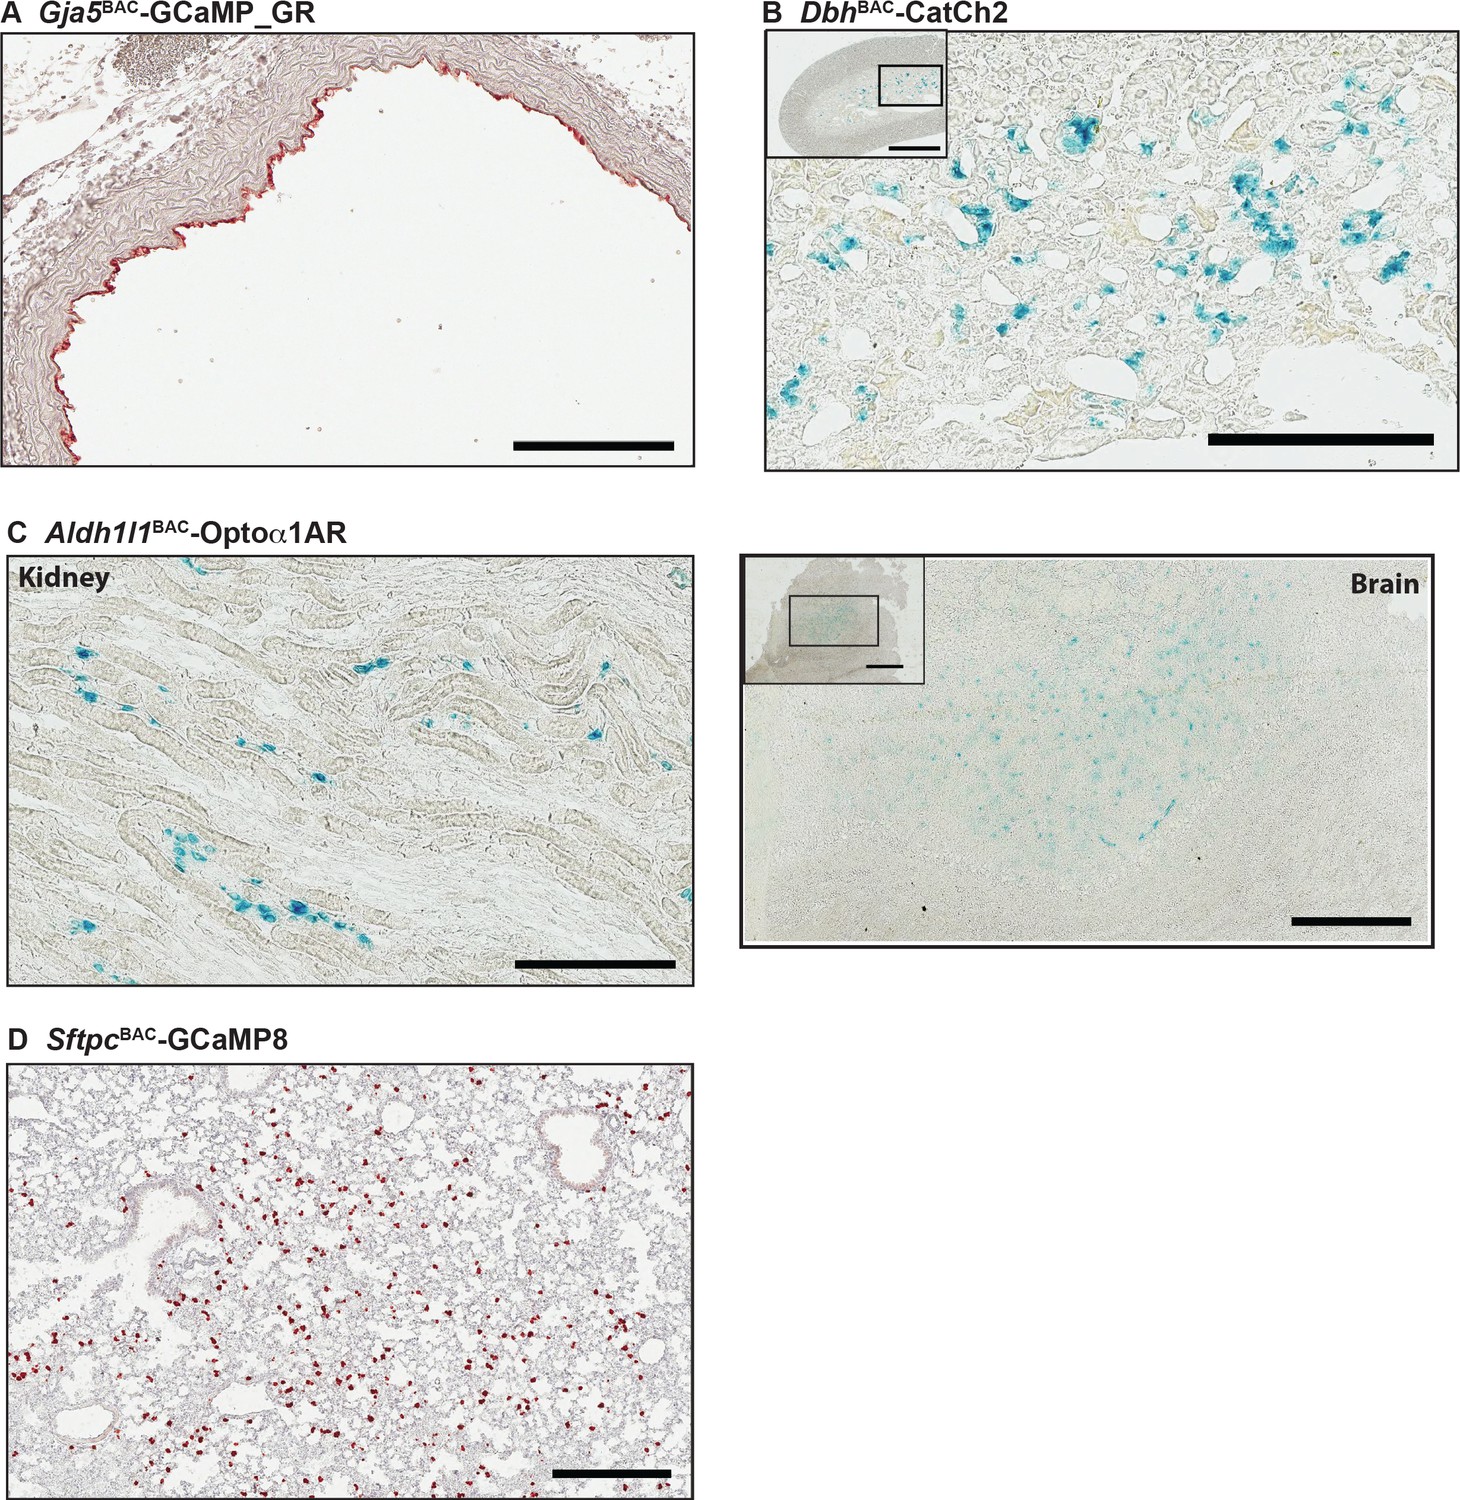
(A) Anti-GFP immunohistochemistry (IHC) of aorta from Gja5BAC-GCaMP_GR mouse demonstrates endothelial GCaMP5 expression. Scale bar: 200 µm. (B) X-gal staining of adrenal gland from a DbhBAC-CatCh2_IRES_lacZ mouse showing LacZ expression in the adrenal medulla. Box indicates area of enlargement. Scale bars: left panel , 500 µm; right panel, 200 µm. (C) X-gal staining of kidney (left panel) and olfactory lobe (right panels) from Aldh1l1BAC-Optoα1AR_IRES_lacZ mouse. Box indicates area of enlargement. Scale bars: upper panel, 200 µm; lower panels, 600 and 300 µm. (D) GCaMP8 expression in lung from SftpcBAC-GCaMP8 mice consistent with a type II alveolar cell pattern. Scale bar: 300 µm. All images shown are representative images from three animals unless otherwise specified.
Tables
Table 1
List of BACs and PCR primers for CHROMus mice.
| CHROMus ID | Transgenic line | Tissue/sensor type (effector [E] or sensor [S]) | Promoter or BAC | Genotyping primer 1 | Genotyping primer 2 |
|---|---|---|---|---|---|
| B3 | Acta2BAC-RCaMP1.07 | Smooth muscle – S | RP23-370F21 | GCTTGTCTGTAAGCGGATGCC | TGCTGCTGCCACTCTAGTGAGAAA |
| B4 | Myh6-GCaMP8 | Cardiac muscle – S | Addgene 55594 | AAGGGCGAGGAGCTGTTCA | CGATCTGCTCTTCAGTCAGTTGGT |
| B5 | Myh6-CatCh2_IRES_lacZ | Cardiac muscle – E | Addgene 55594 | GGAGATCTATGTGTGCGCTATC | CCAGCAGTTCTTCGACATCA |
| B6 | Acta2BAC-Optoα1AR_IRES_lacZ | Smooth muscle – E | RP23-370F21 | GGGTTGGTCCCGCTATATTC | GAAGGCAGGGATGGTCATAAA |
| B7 | Acta2BAC-Optoß2AR_IRES_lacZ | Smooth muscle – E | RP23-370F21 | ATAGCTCTCAGCAACCTGTTGGGT | TTCAACACGGTTTGGAGGCG |
| B8 | Acta2BAC-CatCh2_IRES_lacZ | Smooth muscle – E | RP23-370F21 | GGAGATCTATGTGTGCGCTATC | CCAGCAGTTCTTCGACATCA |
| B10 | Hcn4BAC-GCaMP8 | Cardiac conduction – S | RP23-281H22 | AAGGGCGAGGAGCTGTTCA | CGATCTGCTCTTCAGTCAGTTGGT |
| B14 | Acta2BAC-GCaMP_GR | Smooth muscle – S | RP23-370F21 | AAGGGCGAGGAGCTGTTCA | CGATCTGCTCTTCAGTCAGTTGGT |
| B15 | Gja5BAC-GCaMP_GR | Endothelium – S | RP24-255O4 | AAGGGCGAGGAGCTGTTCA | CGATCTGCTCTTCAGTCAGTTGGT |
| B16 | DbhBAC-CatCh2_IRES_lacZ | Sympathetic – E | RP23-354N13 | GGAGATCTATGTGTGCGCTATC | CCAGCAGTTCTTCGACATCA |
| B17 | Hcn4BAC-CatCh2_IRES_lacZ | Cardiac conduction – E | RP23-281H22 | GGAGATCTATGTGTGCGCTATC | CCAGCAGTTCTTCGACATCA |
| B19 | Acta2BAC-GCaMP2 | Smooth muscle – S | RP23-370F21 | AAGGGCGAGGAGCTGTTCA | CGATCTGCTCTTCAGTCAGTTGGT |
| B20 | Cdh5BAC-GCaMP8 | Endothelium – S | RP23-453P1 | AAGGGCGAGGAGCTGTTCA | CGATCTGCTCTTCAGTCAGTTGGT |
| B22 | LckBAC-Optoα1AR_IRES_lacZ | T cells – E | RP24-159E19 | GGGTTGGTCCCGCTATATTC | GAAGGCAGGGATGGTCATAAA |
| B23 | SftpcBAC-GCaMP8 | Alveolar – S | RP23-247J9 | AAGGGCGAGGAGCTGTTCA | CGATCTGCTCTTCAGTCAGTTGGT |
| B26 | Cdh5BAC-Optoα1AR_IRES_lacZ | Endothelium – E | RP23-453P1 | GGGTTGGTCCCGCTATATTC | GAAGGCAGGGATGGTCATAAA |
| B27 | Cdh5BAC-Optoß2AR_IRES_lacZ | Endothelium – E | RP23-453P1 | AACCTTGGAGGCTGGAAAGTAG | TTCAACACGGTTTGGAGGCG |
| B28 | Cdh5BAC-CatCh2_IRES_lacZ | Endothelium – E | RP23-453P1 | GGAGATCTATGTGTGCGCTATC | CCAGCAGTTCTTCGACATCA |
| B34 | Acta2BAC-GCaMP8.1_mVermilion | Smooth muscle – S | RP23-370F21 | AAGGGAGAGGAGCTGTTCA | CGATCTGCTCCTCTGTCAGCTGGT |
| B35 | Foxj1BAC-GCaMP8.1 | Ciliated epithelia – S | RP23-294J17 | AAGGGAGAGGAGCTGTTCA | CGATCTGCTCCTCTGTCAGCTGGT |
| B36 | Aldh1l1BAC-Optoα1AR_IRES_lacZ | Glia – E | RP23-7M9 | GGGTTGGTCCCGCTATATTC | GAAGGCAGGGATGGTCATAAA |
Key resources table
| Reagent type (species) or resource | Designation | Source or reference | Identifiers | Additional information |
|---|---|---|---|---|
| Antibody | Rabbit polyclonal anti-GFP | Santa Cruz | RRID:AB_641123 | IHC (1:500) |
| CHROMus ID and strain name | Jackson # | Jackson Laboratory strain name | ||
| Genetic reagent (Mus musculus) | B3-Acta2BAC-RCaMP1.07 | 28345 | MGI:5750184 | Tg(RP23-370F21-RCaMP1.07)B3-3Mik/J |
| Genetic reagent (M. musculus) | B4-Myh6-GCaMP8 | 33341 | RRID:IMSR_CHROMUS:B4 | Tg(Myh6-GCaMP8)B4-10Mik/J |
| Genetic reagent (M. musculus) | B5-Myh6-CatCh2_IRES_lacZ | 30334 | RRID:IMSR_CHROMUS:B5 | Tg(Myh6-COP4*L132C,-lacZ)B5-7Mik/J |
| Genetic reagent (M. musculus) | B6-Acta2BAC-Optoa1AR_IRES_lacZ | 28346 | RRID:IMSR_CHROMUS:B6 | Tg(Acta2-RHO/ADRA1,-lacZ)B6-1Mik/J |
| Genetic reagent (M. musculus) | B7-Acta2BAC-Optoß2AR_IRES_lacZ | 28347 | RRID:IMSR_CHROMUS:B7 | Tg(Acta2-RHO/Adrb2,-lacZ)B7-5Mik/J |
| Genetic reagent (M. musculus) | B8-Acta2BAC-CatCh2_IRES_lacZ | 28348 | RRID:IMSR_CHROMUS:B8 | Tg(Acta2-COP4*L132C,-lacZ)B8-3Mik/J |
| Genetic reagent (M. musculus) | B10-Hcn4BAC-GCaMP8 | 28344 | MGI:5750171 | Tg(Hcn4-GCaMP8)B10-3Mik/J |
| Genetic reagent (M. musculus) | B14-Acta2BAC-GCaMP_GR | 25406 | MGI:5693405 | Tg(RP23-370F21-GCaMP3*/mCherry)1Mik/J |
| Genetic reagent (M. musculus) | B15-Gja5BAC-GCaMP_GR | 30333 | MGI:6281638 | Tg(Gja5-GCaMP3*/mCherry)B15-2Mik/J |
| Genetic reagent (M. musculus) | B16-DbhBAC-CatCh2_IRES_lacZ | 32666 | MGI:6361520 | Tg(Dbh-COP4*L132C,-lacZ)B16-4Mik/J |
| Genetic reagent (M. musculus) | B17-Hcn4BAC-CatCh2_IRES_lacZ | 33344 | RRID:IMSR_CHROMUS:B17 | Tg(Hcn4-COP4*L132C,-lacZ)B17-2Mik/J |
| Genetic reagent (M. musculus) | B19-Acta2BAC-GCaMP2 | 25405 | MGI:5693385 | Tg(RP23-370F21-GCaMP2)6Mik/J |
| Genetic reagent (M. musculus) | B20-Cdh5BAC-GCaMP8 | 33342 | RRID:IMSR_CHROMUS:B20 | Tg(Cdh5-GCaMP8)B20-6Mik/J |
| Genetic reagent (M. musculus) | B22-LckBAC-Optoa1AR_IRES_lacZ | 33705 | MGI:6361523 | Tg(Lck-RHO/ADRA1,-lacZ)B22-1Mik/J |
| Genetic reagent (M. musculus) | B23-SftpcBAC-GCaMP8 | 32885 | RRID:IMSR_CHROMUS:B23 | Tg(Sftpc-GCaMP8)B23-5Mik/J |
| Genetic reagent (M. musculus) | B26-Cdh5BAC-Optoa1AR_IRES_lacZ | 33343 | MGI:6294081 | Tg(Cdh5-RHO/ADRA1,-lacZ)B26-1Mik/J |
| Genetic reagent (M. musculus) | B27-Cdh5BAC-Optoß 2AR_IRES_lacZ | 32889 | MGI:6324937 | Tg(Cdh5-RHO/Adrb2,-lacZ)B27-3Mik/J |
| Genetic reagent (M. musculus) | B28-Cdh5BAC-CatCh2_IRES_lacZ | 33345 | MGI:6324934 | Tg(Cdh5-COP4*L132C,-lacZ)B28-2Mik/J |
| Genetic reagent (M. musculus) | B34-Acta2BAC-GCaMP8.1_mVermilion | 32887 | MGI:6324943 | Tg(Acta2-GCaMP8.1/mVermilion)B34-4Mik/J |
| Genetic reagent (M. musculus) | B35-Foxj1BAC-GCaMP8.1 | 32888 | MGI:6324940 | Tg(Foxj1-GCaMP8.1)B35-3Mik/J |
| Genetic reagent (M. musculus) | B36-Aldh1l1BAC-Optoa1AR_IRES_lacZ | 33706 | MGI:6361527 | Tg(Aldh1l1-RHO/ADRA1,-lacZ)B36-3Mik/J |
Additional files
Download links
A two-part list of links to download the article, or parts of the article, in various formats.
Downloads (link to download the article as PDF)
Open citations (links to open the citations from this article in various online reference manager services)
Cite this article (links to download the citations from this article in formats compatible with various reference manager tools)
Genetically engineered mice for combinatorial cardiovascular optobiology
eLife 10:e67858.
https://doi.org/10.7554/eLife.67858


