A functional genetic toolbox for human tissue-derived organoids
- Wellcome Trust/CRUK Gurdon Institute, University of Cambridge, United Kingdom
- Developmental Biology and Cancer Development, University College London, United Kingdom
- University of Cambridge, United Kingdom
- École Polytechnique Fédérale de Lausanne (EPFL), Switzerland
Figures
Figure 1 with 2 supplements

The Organoid Easytag workflow for gene targeting in human organoids.
(a) Schematic of the Organoid Easytag workflow. ssRNP and a circular plasmid repair template are nucleofected into dissociated cells at day 0. By day 3, cells have proliferated to become tiny colonies and are removed from the Matrigel and dissociated for selection by flow cytometry. EGFP+ cells are re-plated sparsely (~1000–1500 cells/well of a 24-well plate) and grown until day 15 when organoids reach a sufficient size to be manually picked under a fluorescent microscope. Typically, 10–40 organoid colonies formed per ~1000 cells seeded. Organoids are picked into individual wells and passaged until sufficient cells are obtained for both genotyping and freezing down the line. Cells with red nuclei represent incorrectly targeted cells. Cells with white nuclei denote correctly targeted cells. (b) Schematic of repair template design for N terminal fusion mEGFP-ACTB gene targeting and the final product. Arrow shows the position of gRNA. E1, exon 1; E2, exon 2; 5′HA, 5′ homology arm; 3′HA, 3′ homology arm. (c) Representative flow cytometry results showing the percentage of EGFP cells 72 hr after nucleofection is performed. (d) Representative image showing mEGFP-ACTB organoid. DIC channel on the left and EGFP channel on the right. (e) Immunofluorescence of mEGFP-ACTB organoids. Blue: DAPI (nuclei); green: EGFP (ACTB fusion protein); red: SOX9 (lung progenitor marker). (f) Schematic of the AAVS1 targeting repair template design and the final product. E1, exon 1, E2, exon 2. Arrow indicates the position of the gRNA. (g) Immunofluorescence of AAVS1-EF1a-mTagRFP-T organoids. Blue: DAPI (nuclei); red: mTagRFP-T (membrane localised reporter); white: SOX2 (lung progenitor marker). Scale bars in all panels denote 50 μm.
Figure 1—figure supplement 1
Optimisation of DNA delivery and CRISPR cutting.
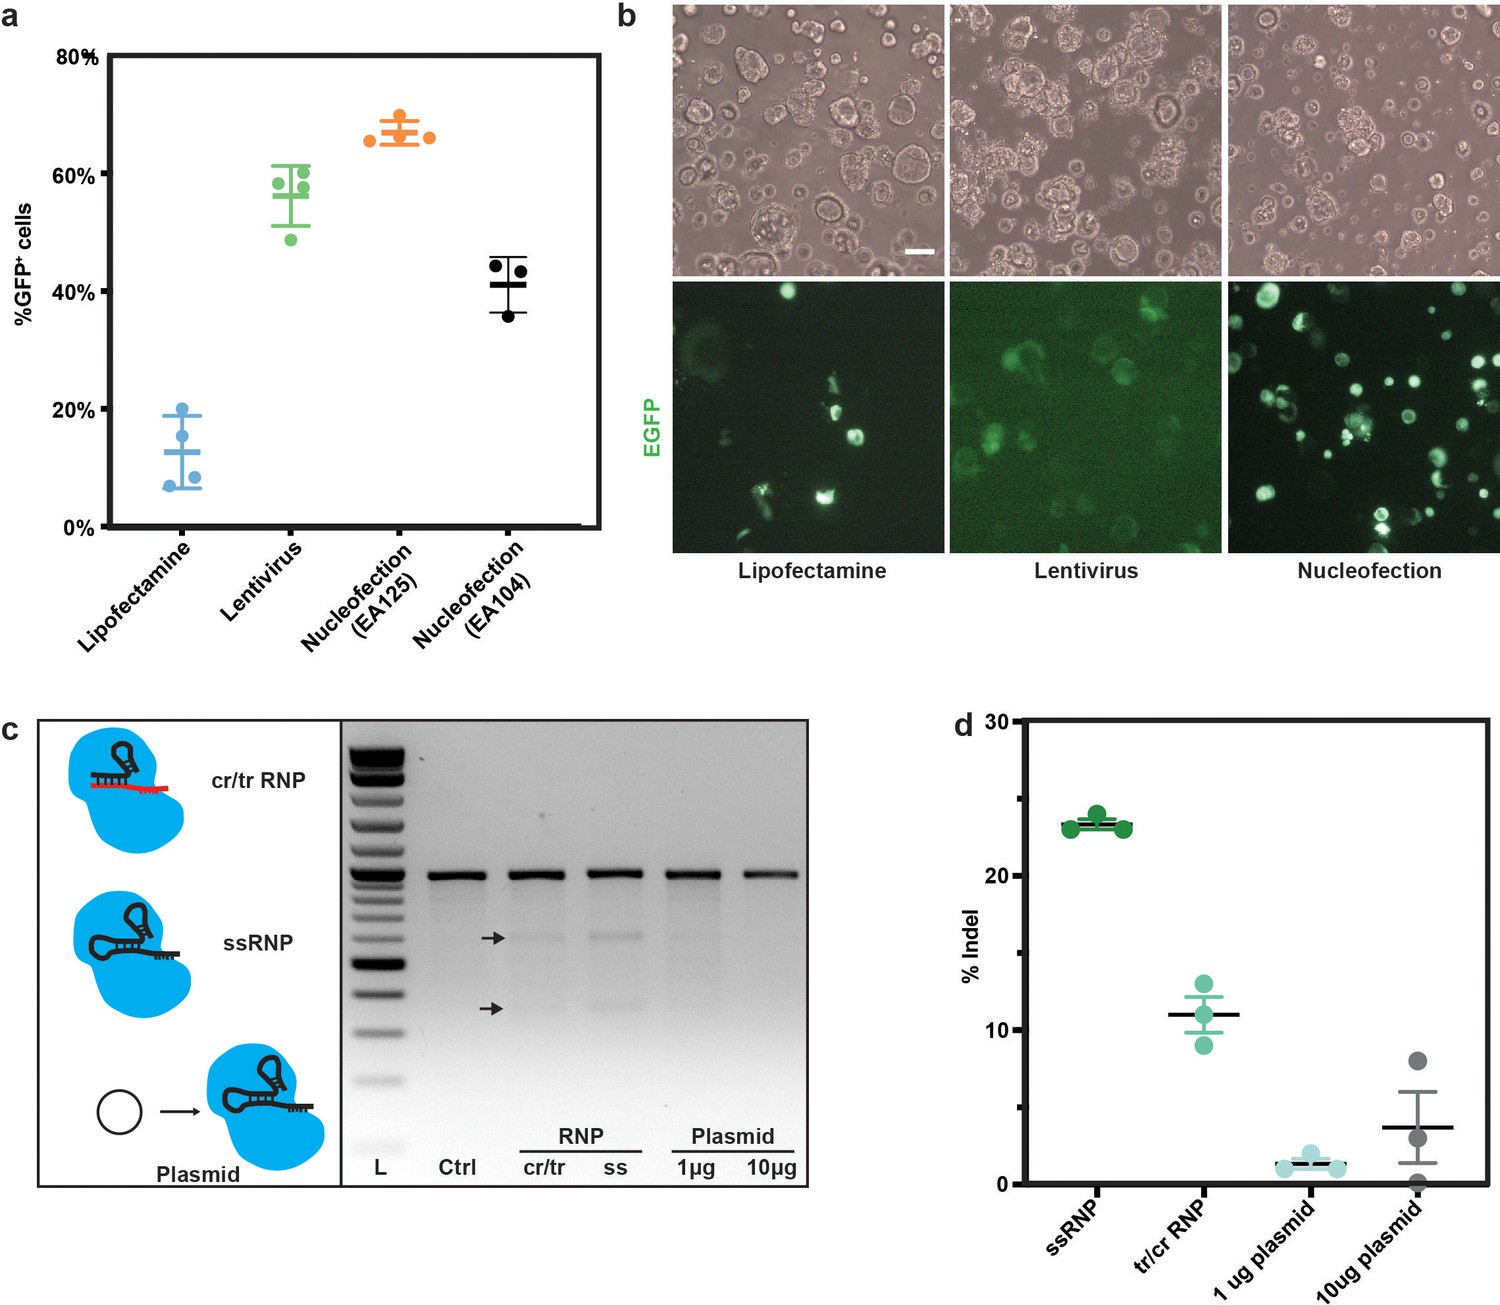
(a) Efficiency quantification of different DNA delivery methods. EGFP-positive cells were quantified by flow cytometry 72 hr after transfection or transduction. N = 4 (or 3 for nucleofection EA104) different organoid lines were used for each condition. Error bars are plotted to show mean ± SEM. (b) Representative images showing DNA delivery efficiencies of different methods 72 hr after transfection/transduction. Top panel: widefield images; bottom panel: GFP channel. Scale bar denotes 100 μm. (c) T7 endonuclease assay showing the DNA cleavage efficiency of different CRISPR methods on the ACTB locus. Arrows denote lower bands generated by T7 endonuclease cutting. Left panel: schematic showing the different methods tested for introducing the Cas9 complex. cr/tr RNP, synthetic crispr/tracer RNA heterodimer with Cas9 RNP; ssRNP, single-strand synthetic guide RNA with Cas9 RNP. (d) Quantification of indels produced by the different CRISPR methods tested using ICE online analysis software (https://ice.synthego.com/). N = 3 different organoid lines were used for each condition. Error bars are plotted to show mean ± SEM.
Figure 1—figure supplement 2

Small molecules did not significantly improve organoid gene targeting efficiency.
(a) Workflow for testing different homology-directed repair (HDR)-enhancing drugs. Organoid cells were treated with DMSO, RS-1, L755507 and SCR-7 for 48 hr after nucleofection for mEGFP-ACTB gene targeting. The percentage of EGFP-positive cells was analysed 72 hr after nucleofection. DMSO treatment was used as a negative control. (b) Summary of percentage of EGFP positive. No significant improvement of targeting efficiency was observed after the drug treatments. N = 3 different organoid lines were used. Error bars are plotted to show mean ± SEM.
Figure 2 with 5 supplements
The Organoid Easytag workflow can be adapted for multiple applications.
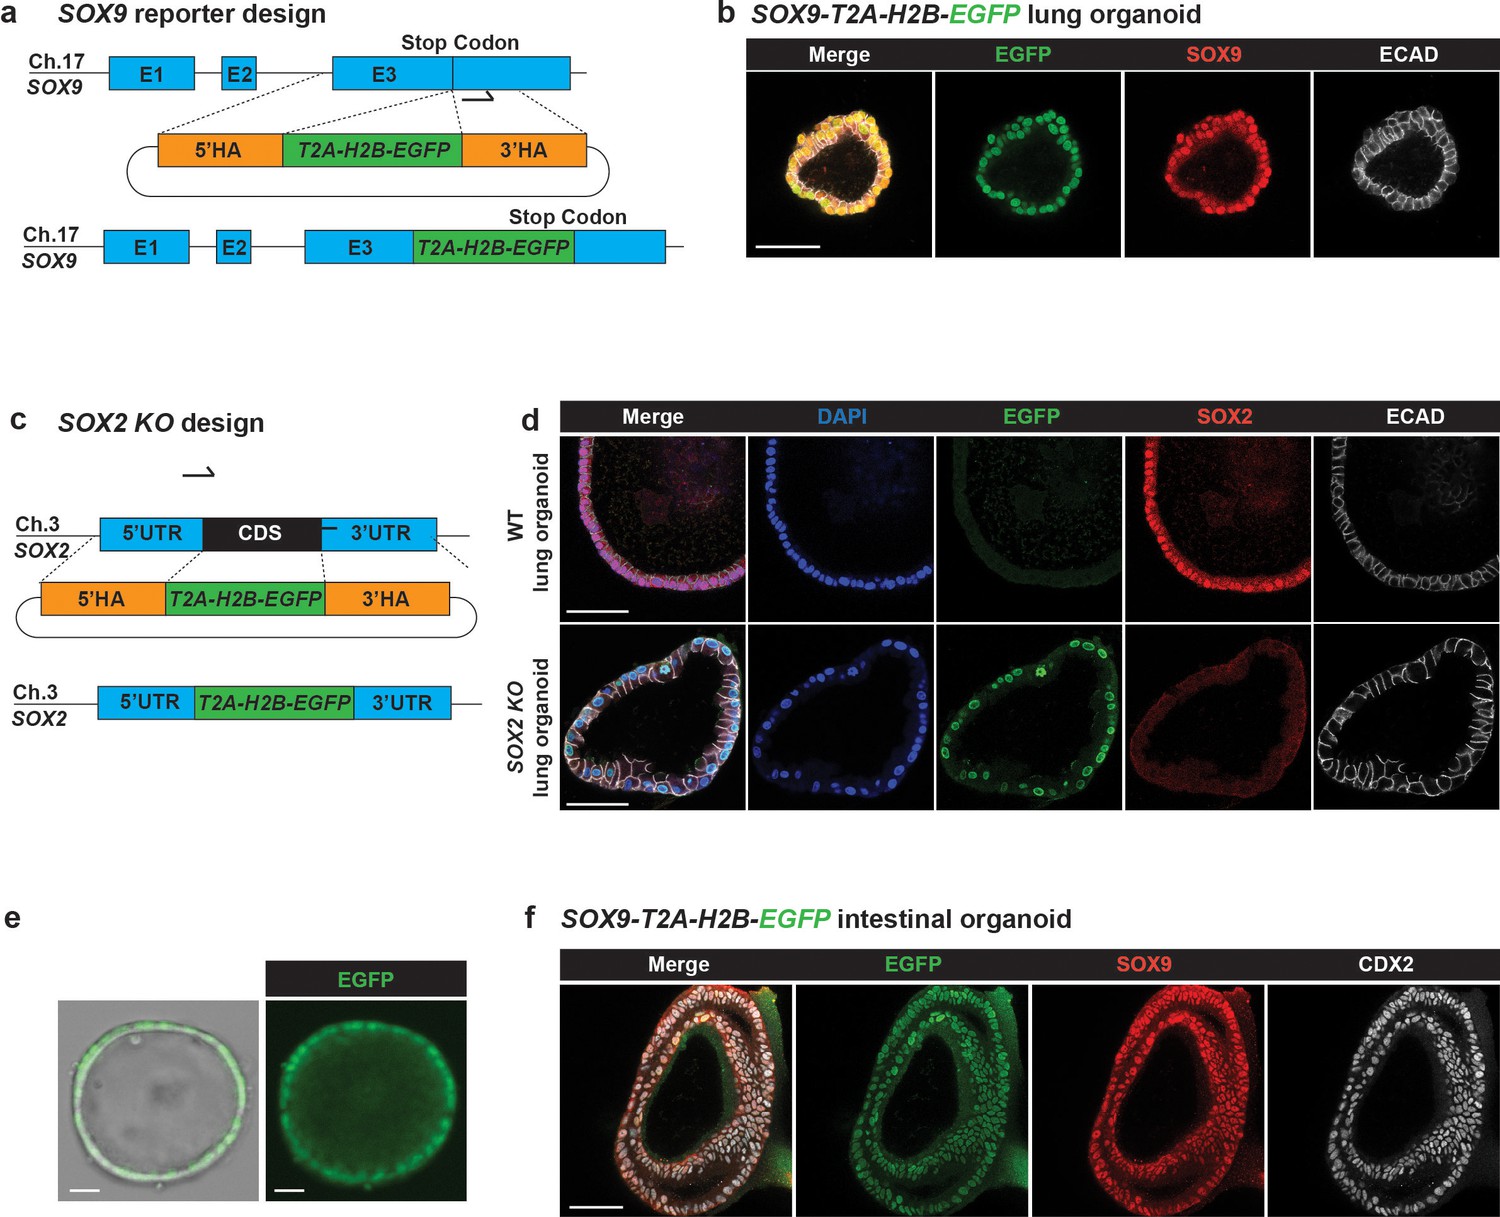
(a) Schematic of the SOX9 locus repair template design and final product. E1, exon 1; E2, exon 2; E3, exon 3; 5′ HA, 5′ homology arm; 3′ HA, 3′ homology arm. Arrow shows the position of the gRNA. (b) Immunofluorescence of SOX9-T2A-H2B-EGFP human foetal lung organoids. Green: EGFP (SOX9 reporter); red: SOX9 (lung progenitor marker); white: ECAD (E-cadherin, basal-lateral junctions). (c) Schematic showing repair template design and final product for the generation of SOX2 knockout organoids using Organoid Easytag. Two gRNA sites were used at the N and C terminal of the SOX2 CDS, respectively. SOX2 CDS was replaced by T2A-H2B-EGFP. (d) Representative immunofluorescence showing that SOX2 protein is completely knocked out. Blue: DAPI (nuclei); green: EGFP (SOX2 transcriptional reporter); red: SOX2 protein (lung progenitor marker); white: ECAD (E-cadherin, basal-lateral junctions). (e) Widefield microscopic images showing SOX9 reporter human foetal intestinal organoid. (f) Immunofluorescence of SOX9-T2A-H2B-EGFP human foetal intestinal lung organoids. Green: EGFP (SOX9 reporter); red: SOX9; white: CDX2 (intestinal lineage marker). Scale bars denote 50 μm.
Figure 2—figure supplement 1
Characterisation of SOX9 targeted colonies.
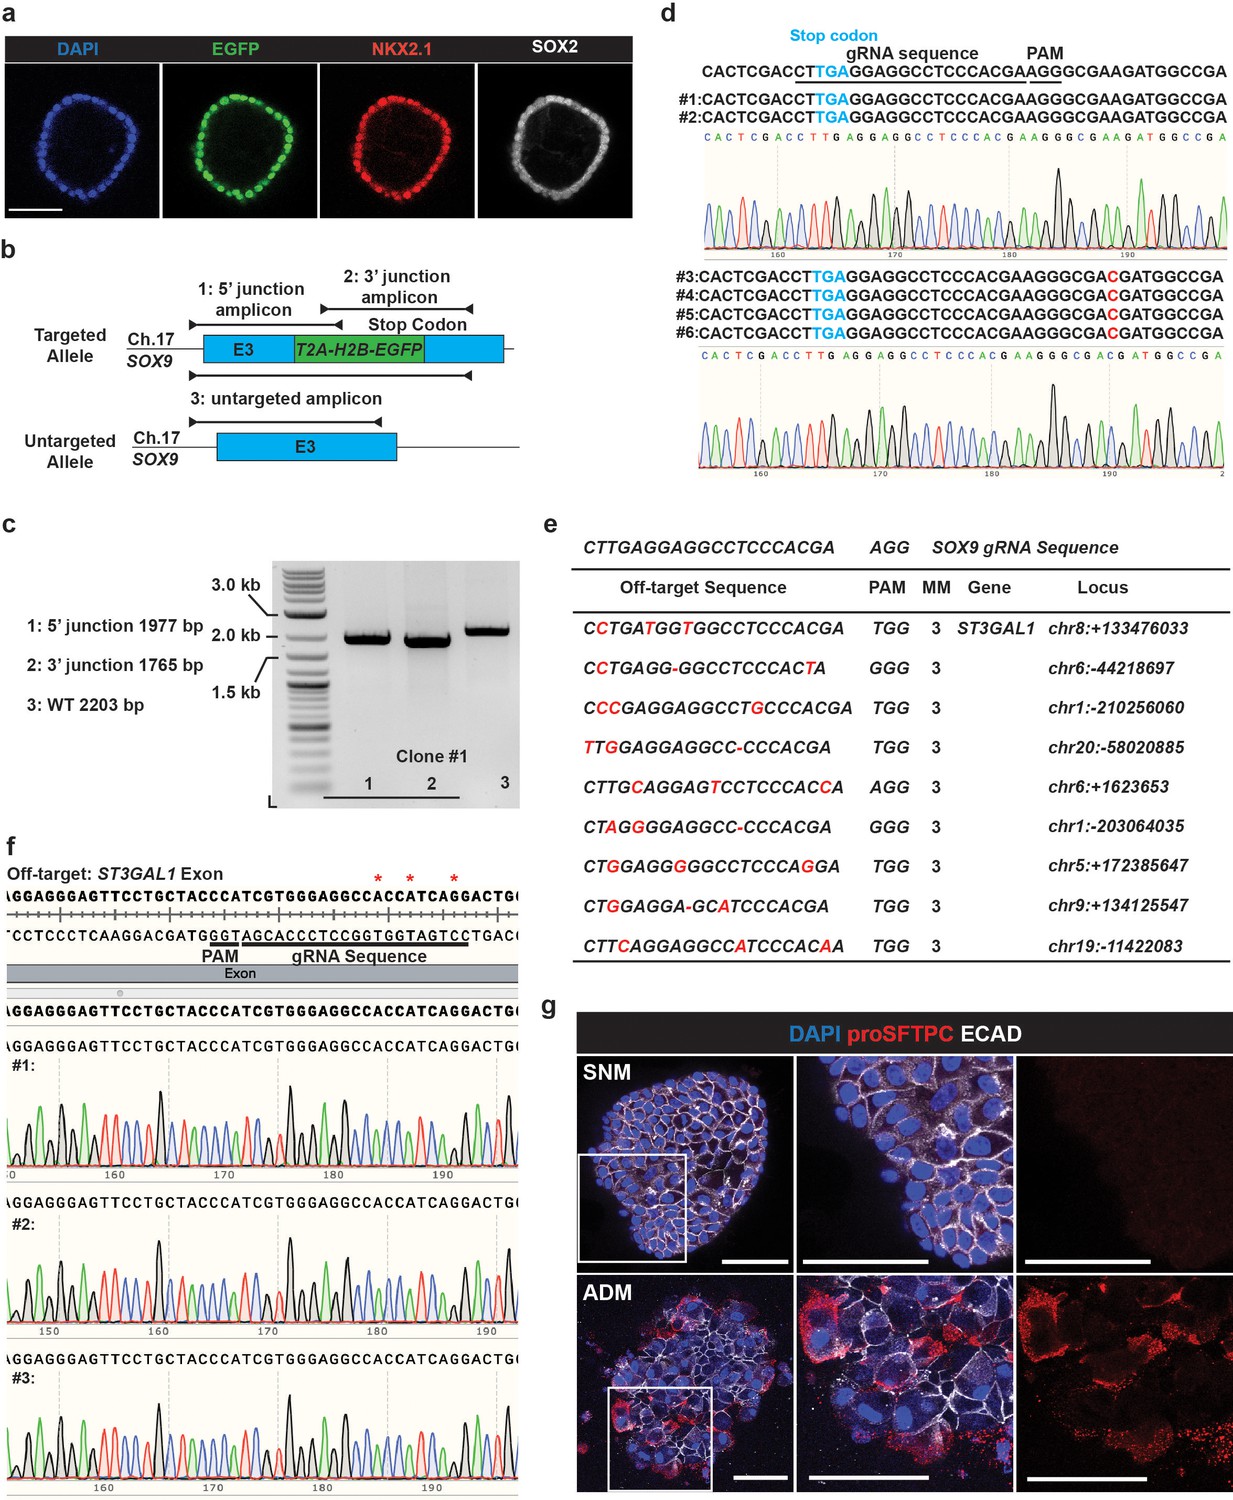
(a) Immunofluorescence of a SOX9-T2A-H2B-EGFP clone. Blue: DAPI (nuclei); green: H2B-EGFP (SOX9 transcriptional reporter); red: NKX2-1 (lung epithelial marker); white: SOX2 (lung progenitor marker). (b) Schematic of the SOX9 genotyping strategy. 5′ and 3′ junction amplicons consist of a primer inside the EGFP sequence and another primer upstream, or downstream, of the homology arm, respectively. (c) Representative gel image showing correct colony genotyping results. (d) Illustration of Sanger sequencing results for SOX9-T2A-H2B-EGFP heterozygous WT allele, focusing on the gRNA cutting sites. A single-point mutation outside the gRNA sequence in the 3′UTR of SOX9 is observed in 4/6 of the clones sequenced (#3–#6). Results were from six colonies, randomly picked from N = 3 different organoid lines. (e) Selected SOX9 gRNA potential off-target sites. Mismatches (MM) are labelled in red. (f) Example of a potential SOX9 gRNA off-target site in the ST3GAL1 exon which contains three mismatches with the SOX9 gRNA indicated by red asterisks. Sanger sequencing traces show that no indels were observed near the gRNA off-target site. N = 3 different SOX9-T2A-H2B-EGFP organoid lines were used. (g) SOX9 reporter human foetal lung organoid differentiation towards the alveolar lineage. SOX9-T2A-H2B-EGFP organoids were cultured in self-renewing medium (SNM) in Matrigel (upper panel) and alveolar differentiation medium (ADM) in PEG gels (lower panel) for 6 days (Gjorevski et al., 2016). proSFTPC-positive cells were observed in ADM PEG gel differentiated organoids. N = 2 SOX9 reporter organoid lines derived from two different parental organoid lines. Red: proSFTPC (pro-surfactant protein C, alveolar lineage marker); white: ECAD (E-cadherin, basal-lateral junctions). Scale bars denote 50 μm.
Figure 2—figure supplement 2
Organoid Easytag to target silent gene, SFTPC locus.
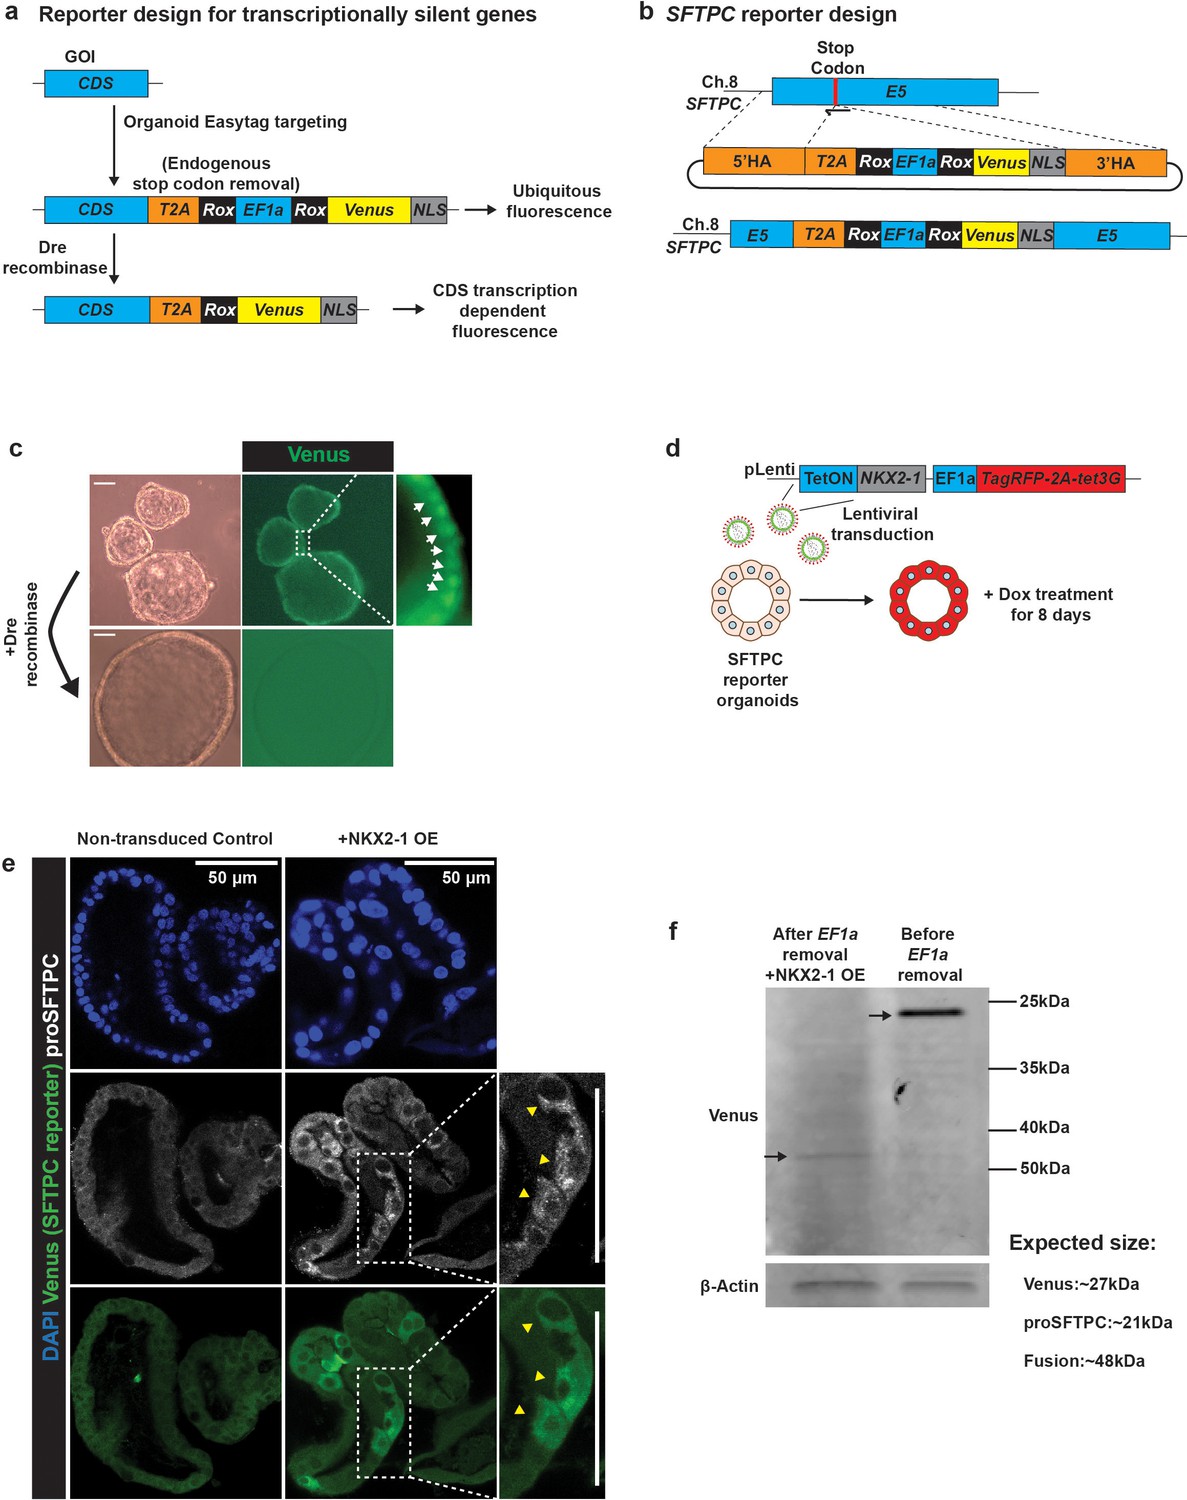
(a) Strategy for targeting transcriptionally silent genes using the Organoid Easytag workflow. First step: knocking-in to the 3’ end of the locus an exogenous EF1a promoter, which is flanked by two Rox sites, driving nuclear-localised Venus expression. A T2A peptide sequence is inserted before the EF1a promoter in order to minimise the influence of the future fluorescent reporter on the gene of interest (GOI). Second step: transient transfection of a plasmid encoding the Dre-recombinase to remove the exogenous EF1a promoter. This results in Venus expression becoming dependent on transcription of the targeted locus. (b) Schematic of the SFTPC locus repair template design and final product. E5, exon 5; 5’ HA, 5’ homology arm; 3’ HA, 3’ homology arm. Arrow indicates the position of the gRNA. Red bar indicates the position of the stop codon. (c) Representative images showing SFTPC-T2A-Rox-EF1a-Rox-Venus-NLS organoids before and after Dre recombinase expression. Upper panel: nuclear-localised Venus fluorescence can be observed under a standard epifluorescent microscope before Dre recombinase expression; bottom panel: Venus fluorescent signal is lost after Dre recombinase expression. Arrows indicate nuclear-localised Venus signal. (d) Schematic of the strategy for testing SFTPC reporter function by NKX2-1 overexpression. SFTPC reporter lines were dissociated and transduced with NKX2-1 conditional overexpression lentivirus. Transduced cells are marked by TagRFP expression which can be enriched via flow cytometry. TagRFP expression is coupled to tet3G which, upon doxycycline (Dox) administration, binds to the tetON promoter and drives NKX2-1 overexpression. (e) Representative immunofluorescence showing that the SFTPC reporter is functional. Blue: DAPI (nuclei); green: Venus (SFTPC reporter); white: proSFTPC protein. (f) Western blot against Venus in the SFTPC reporter revealed a higher molecular weight (MW) band than expected. The expected MW for proSFTPC and Venus are 21 kDa and 27 kDa, respectively, the size of higher MW band (40–50 kDa) correlated well with the predicted size of a fusion protein (~48 kDa), suggesting an inefficient T2A cleavage.
Figure 2—figure supplement 3
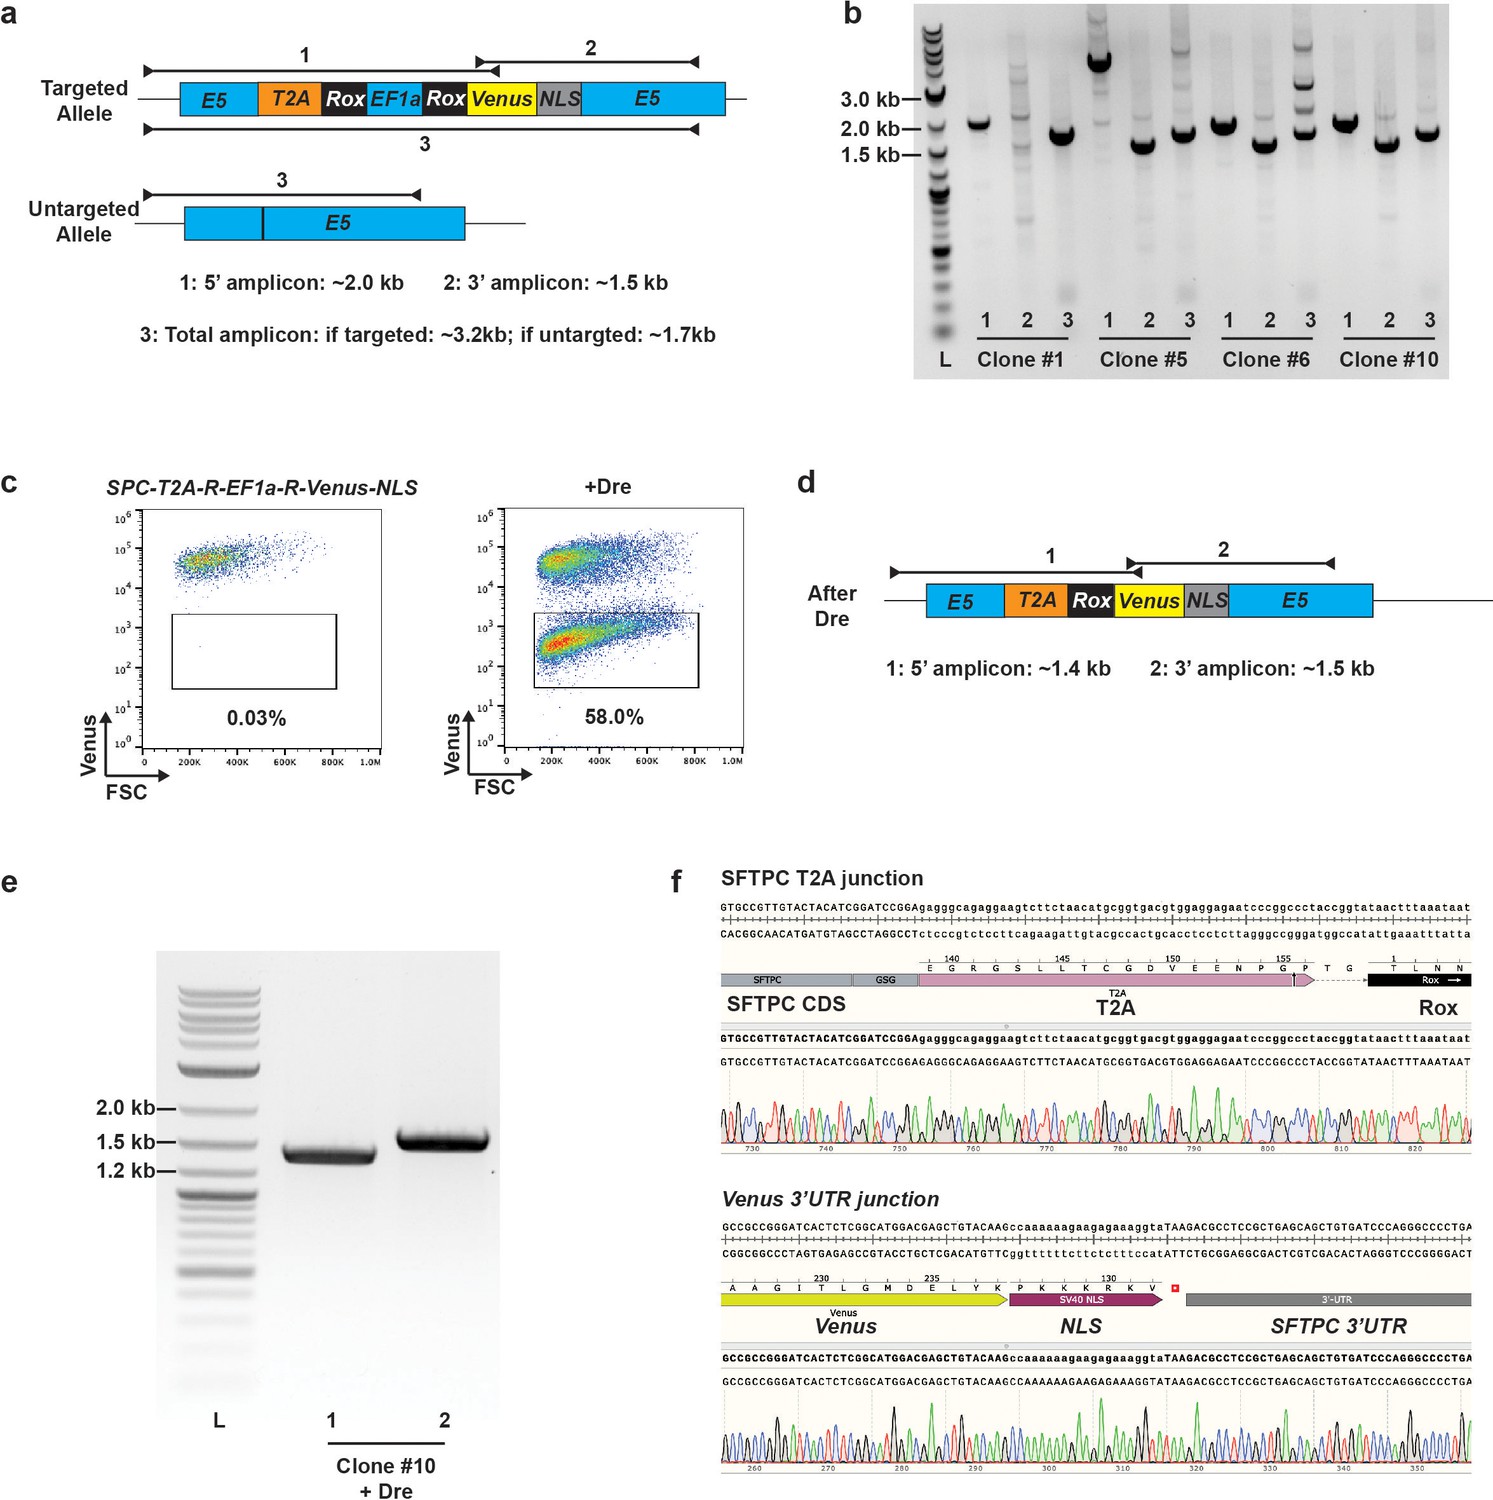
Characterisation of SFTPC reporter organoids.
(a) Schematic of the SFTPC reporter genotyping strategy. 5’ and 3’ junction amplicons consist of a primer inside the Venus sequence and another primer upstream, or downstream, of the homology arm, respectively. (b) Representative gel image showing correct and incorrect colony genotyping results. Clone #10 was correctly targeted; clone #6 appeared correctly targeted by PCR; however, Sanger sequencing revealed a deletion in the T2A sequence. Clones #1 and #5 were incorrectly targeted. (c) Representative flow cytometry results showing loss of the Venus signal after transient expression of Dre recombinase to excise the EF1a promoter. (d) Schematic of the final SFTPC reporter genotyping strategy to validate EF1a removal. 5’ and 3’ junction amplicons consist of a primer inside the Venus sequence and another primer upstream, or downstream, of the homology arm, respectively. (e) Representative gel image showing correct SFTPC reporter colony (after Dre recombinase) genotyping results. (f) Sanger sequencing traces showing the correct SFTPC-CDS-T2A and Venus-SFTPC 3’UTR junctions.
Figure 2—figure supplement 4
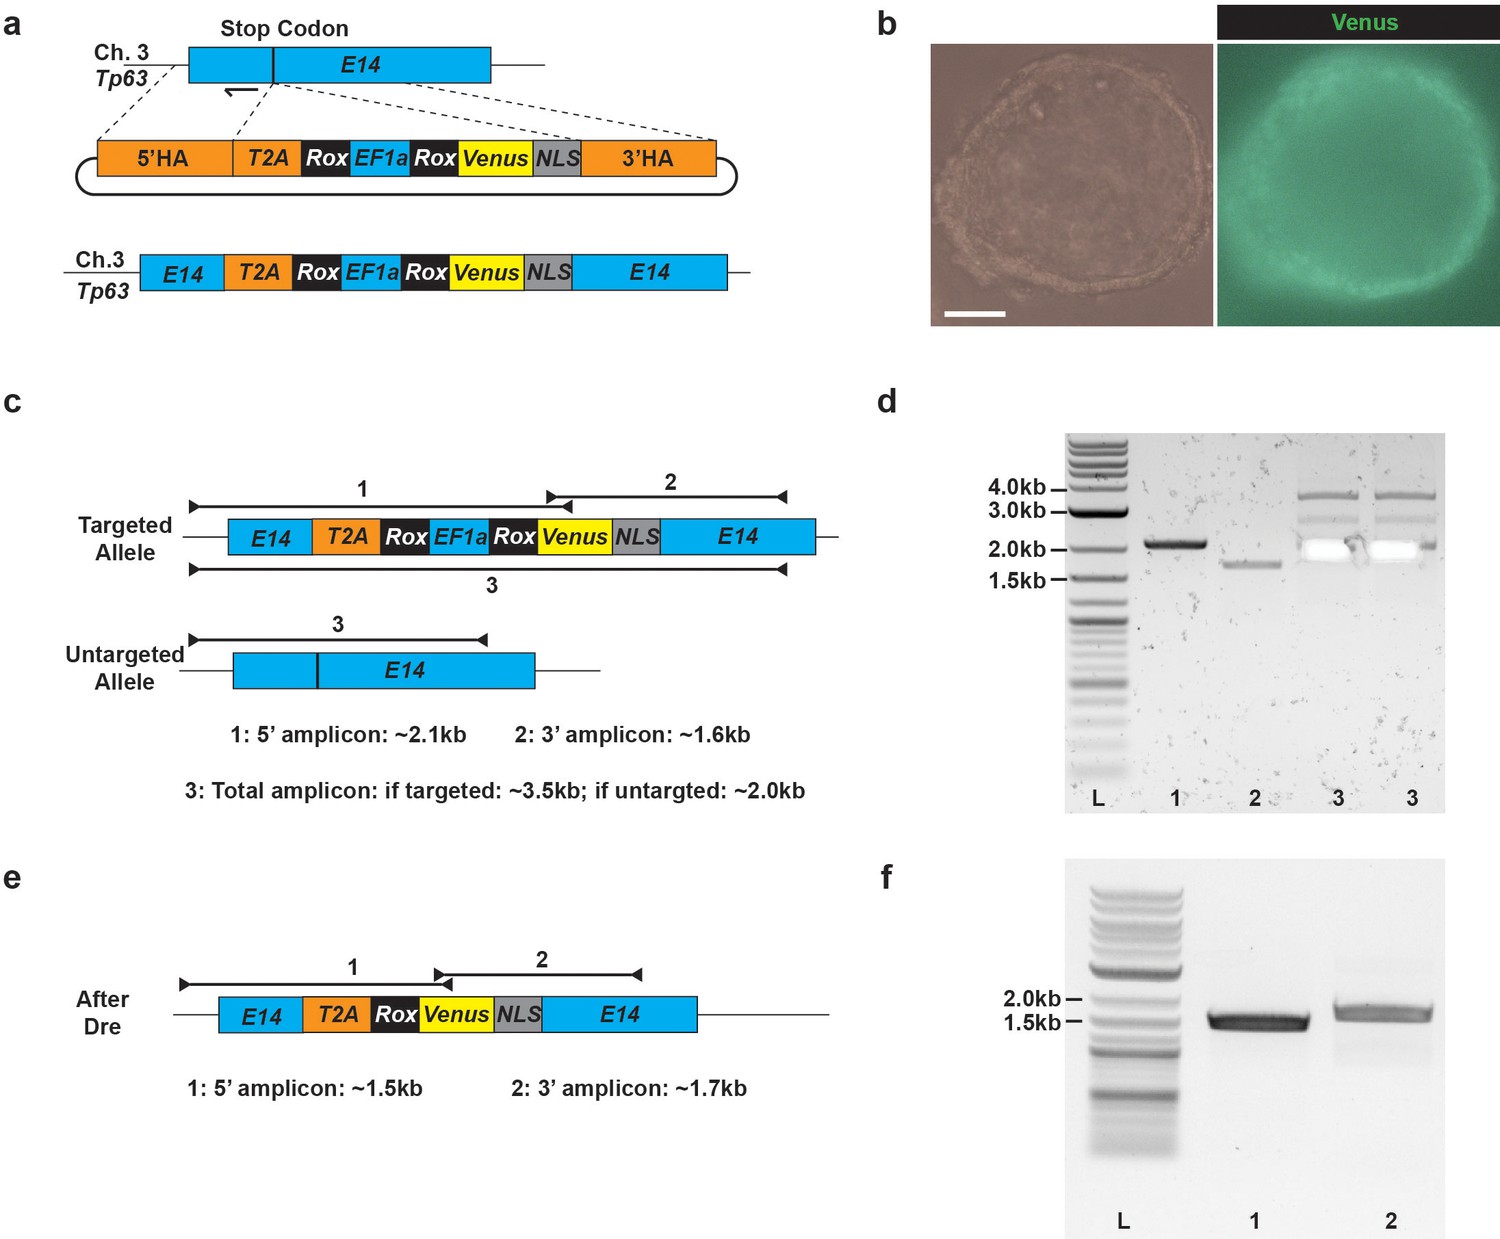
Organoid Easytag to target the TP63 locus.
(a) Schematic of the TP63 locus repair template design and final product. E14, exon 14; 5’ HA, 5’ homology arm; 3’ HA, 3’ homology arm. Arrow indicates the position of the gRNA. (b) Representative images showing TP63-T2A-Rox-EF1a-Rox-Venus-NLS heterozygous organoid. Nuclear-localised Venus fluorescence can be observed under epifluorescent microscope. Scale bar indicates 50 μm. (c) Schematic of the TP63 genotyping strategy. 5’ and 3’ junction amplicons consist of a primer inside the Venus sequence and another primer upstream, or downstream, of the homology arm, respectively. The expected lengths of each amplicon are labelled below the schematic. (d) Representative gel image showing correct colony genotyping results. The WT bands were excised for Sanger sequencing in lane #3. (e) Schematic of the final TP63 reporter genotyping strategy to validate EF1a removal. (f) Representative gel image showing correct colony genotyping results after Dre recombinase.
Figure 2—figure supplement 5
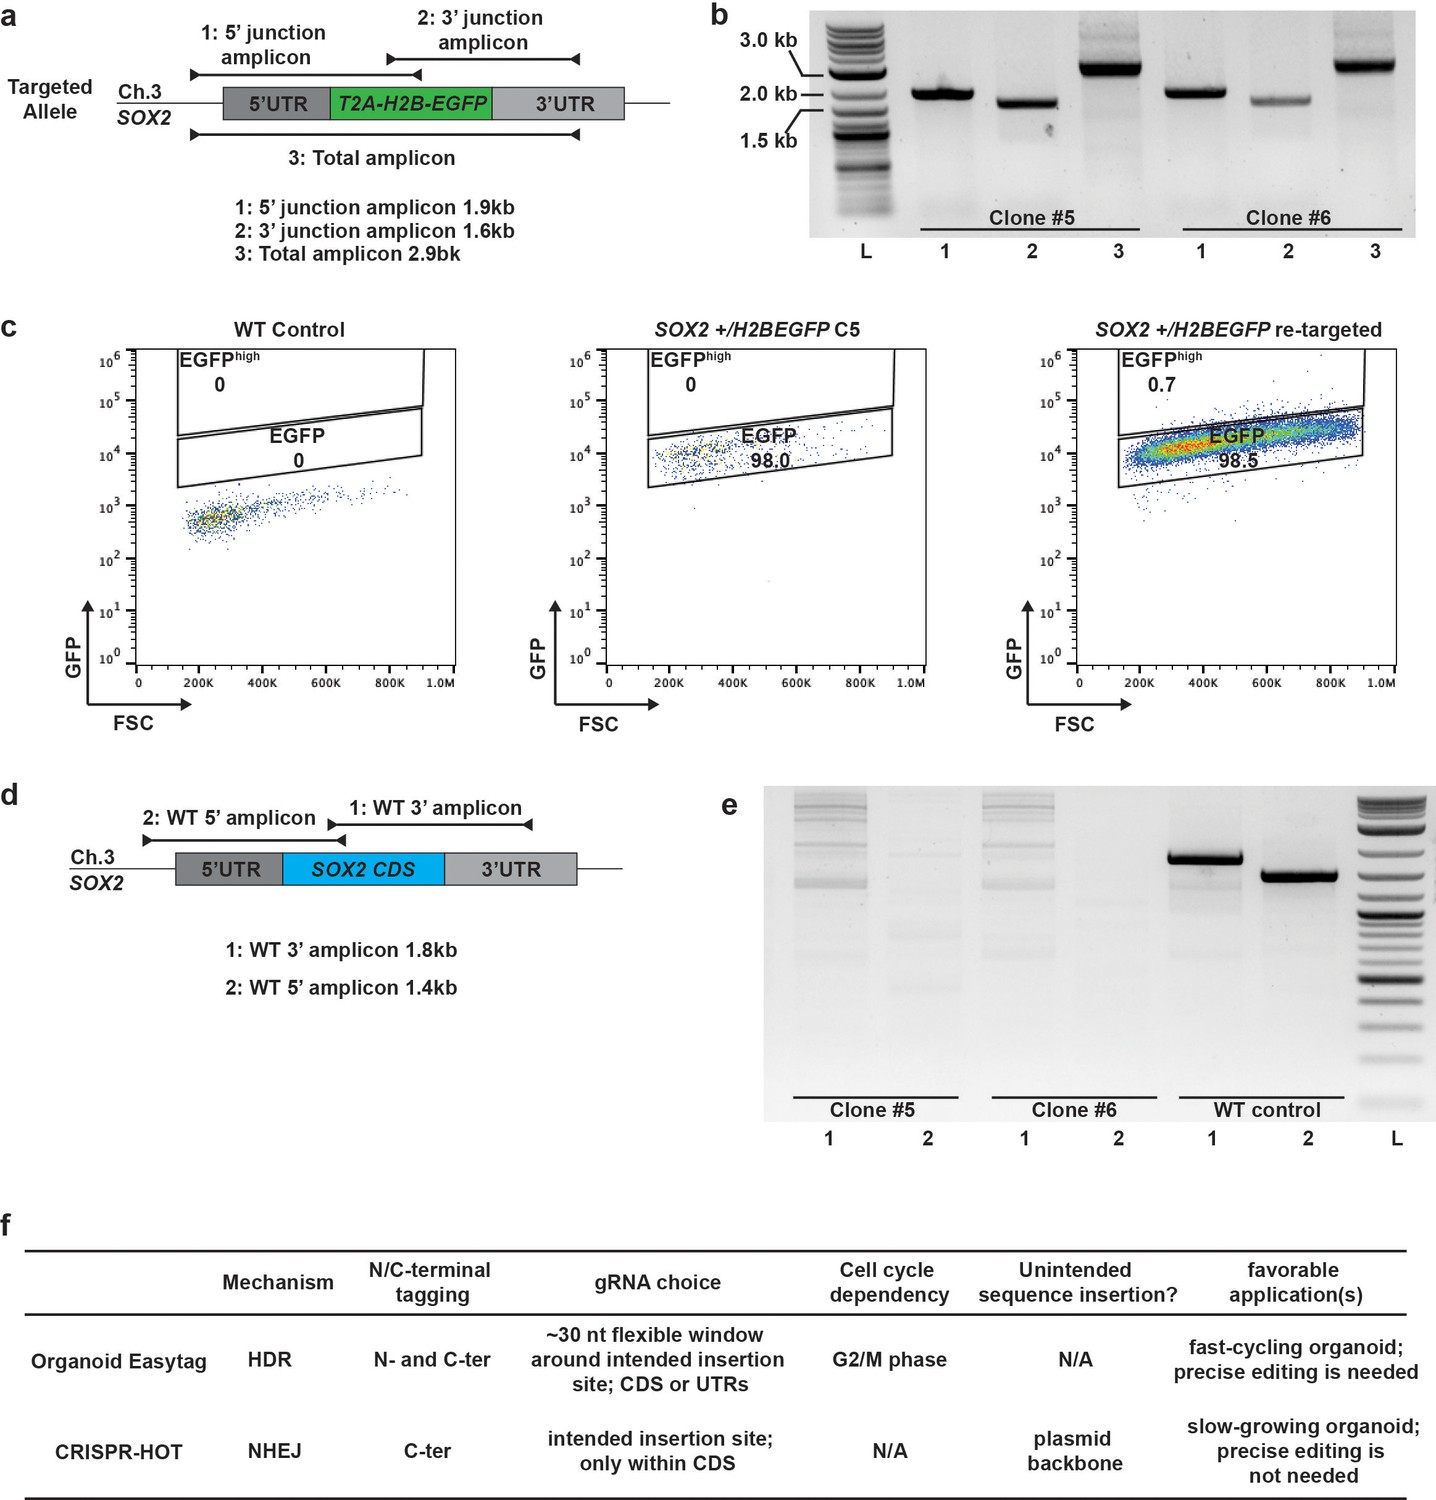
Generation of SOX2 knockout using Organoid Easytag workflow.
(a) Genotyping strategy for SOX2 +/H2B-EGFP heterozygotes. (b) Representative gel image showing correctly targeted colonies. (c) Representative flow cytometry results showing the EGFP signal shift from WT control to SOX2 +/H2BEGFP clone #5 heterozygote and SOX2 +/H2BEGFP clone #5 retargeted to replace the second copy of the SOX2 CDS. (d) Genotyping strategy for testing whether the WT SOX2 CDS is still present. (e) Representative gel image showing correctly targeted colonies (clones #5 and #6) with no amplification for WT SOX2 CDS in contrast to WT control. (f) A comparison of Organoid Easytag and CRISPR-HOT methods (Artegiani et al., 2020).
Figure 3 with 2 supplements

Precise temporal control of CRISPRi in human foetal lung organoids can be achieved via combining the doxycycline (Dox)-inducible system with a protein destabilising domain (DD).
(a) Schematic of lentiviral vector designs for sequential introduction of inducible CRISPRi and gRNAs into human foetal lung organoids. N-terminal KRAB-dCas9 was fused with dihydrofolate reductase (DHFR)-derived DD for stringent control of CRISPRi function. EGFP was fused with a C-terminal CAAX domain to achieve membrane labelling of the transduced cells. (b) Schematic showing how the temporal control of CRISPRi protein is achieved by combining the Dox-inducible system and DD. The Dox-inducible system is somewhat leaky, but in the absence of trimethoprim (TMP), any KRAB-dCas9-DHFR fusion protein produced is degraded. Dox treatment results in high levels of KRAB-dCas9-DHFR fusion protein expression. When TMP is not present, the fusion protein is destabilised, whereas when TMP is supplemented, the fusion protein is stabilised and can exert its gene expression repression function. (c) Workflow for generating gene knockdown (KD) using CRISPRi system. A parental organoid line with inducible CRISPRi was produced via lentiviral transduction followed by sorting for TagRFP-positive cells. Single cells were re-plated (~3000–5000 cells/well of a 24-well plate) and expanded for around 17 days. gRNA lentivirus was then introduced by a second lentiviral transduction event, followed by sorting for TagRFP/EGFP dual-positive cells after 3 days. Cells were re-plated (~2000–3000 cells/well of a 24-well plate) and expanded for another 10 days before treatment with Dox and TMP. 4–6 days after Dox and TMP treatment, gRNA performance was evaluated. (d) Representative flow cytometry results for validation of inducible CRISPRi performance using CD71 as a target. After TMP and Dox administration for 5 days, CD71 protein was successfully downregulated. Grey histogram indicates CD71 expression level for organoids with non-targeting (NT) control gRNA after Dox and TMP treatment for 5 days; blue histogram indicates the CD71 expression level for organoids with CD71 gRNA without Dox or TMP treatment, showing no KD effect; pink histogram indicates the CD71 expression level for CD71 gRNA with Dox and TMP treatment for 5 days. The figures on the graph indicate the percentage of CD71low cells, mean ± SEM. Two independent organoid lines with two different CD71 gRNAs were used. (e) SOX2 can be effectively knocked down using inducible CRISPRi without leaky effects indicated by qRT-PCR. Organoids with Dox and TMP treatment were harvested 5 days after the treatment. Each dot represents an independent experiment. Two independent organoid lines with two different NT control gRNAs and three different SOX2 gRNAs were used. SOX2 expression level was normalised to organoids with NT control gRNAs. Detailed breakdown of these data is shown in Figure 4—figure supplement 1. Error bars are plotted to show mean ± SEM. A two-sided Student’s t-test with non-equal variance was used to compare the means of each group. * indicates p-value < 0.05. n.s. indicates non-significant. (f) Representative western blot results showing SOX2 was effectively knocked down using the inducible CRISPRi system (gRNA7 and gRNA8 are independent guides targeted to SOX2; N = 2 parental organoid lines used). (g–, h) Representative images showing organoid morphology after SOX2 knockdown. Images were taken after 5 days of Dox and TMP treatment. SOX2 knockdown (right panel) did not result in obvious phenotypic changes in organoids compared with NT gRNA control (left panel). Scale bars denote 100 μm.
Figure 3—figure supplement 1
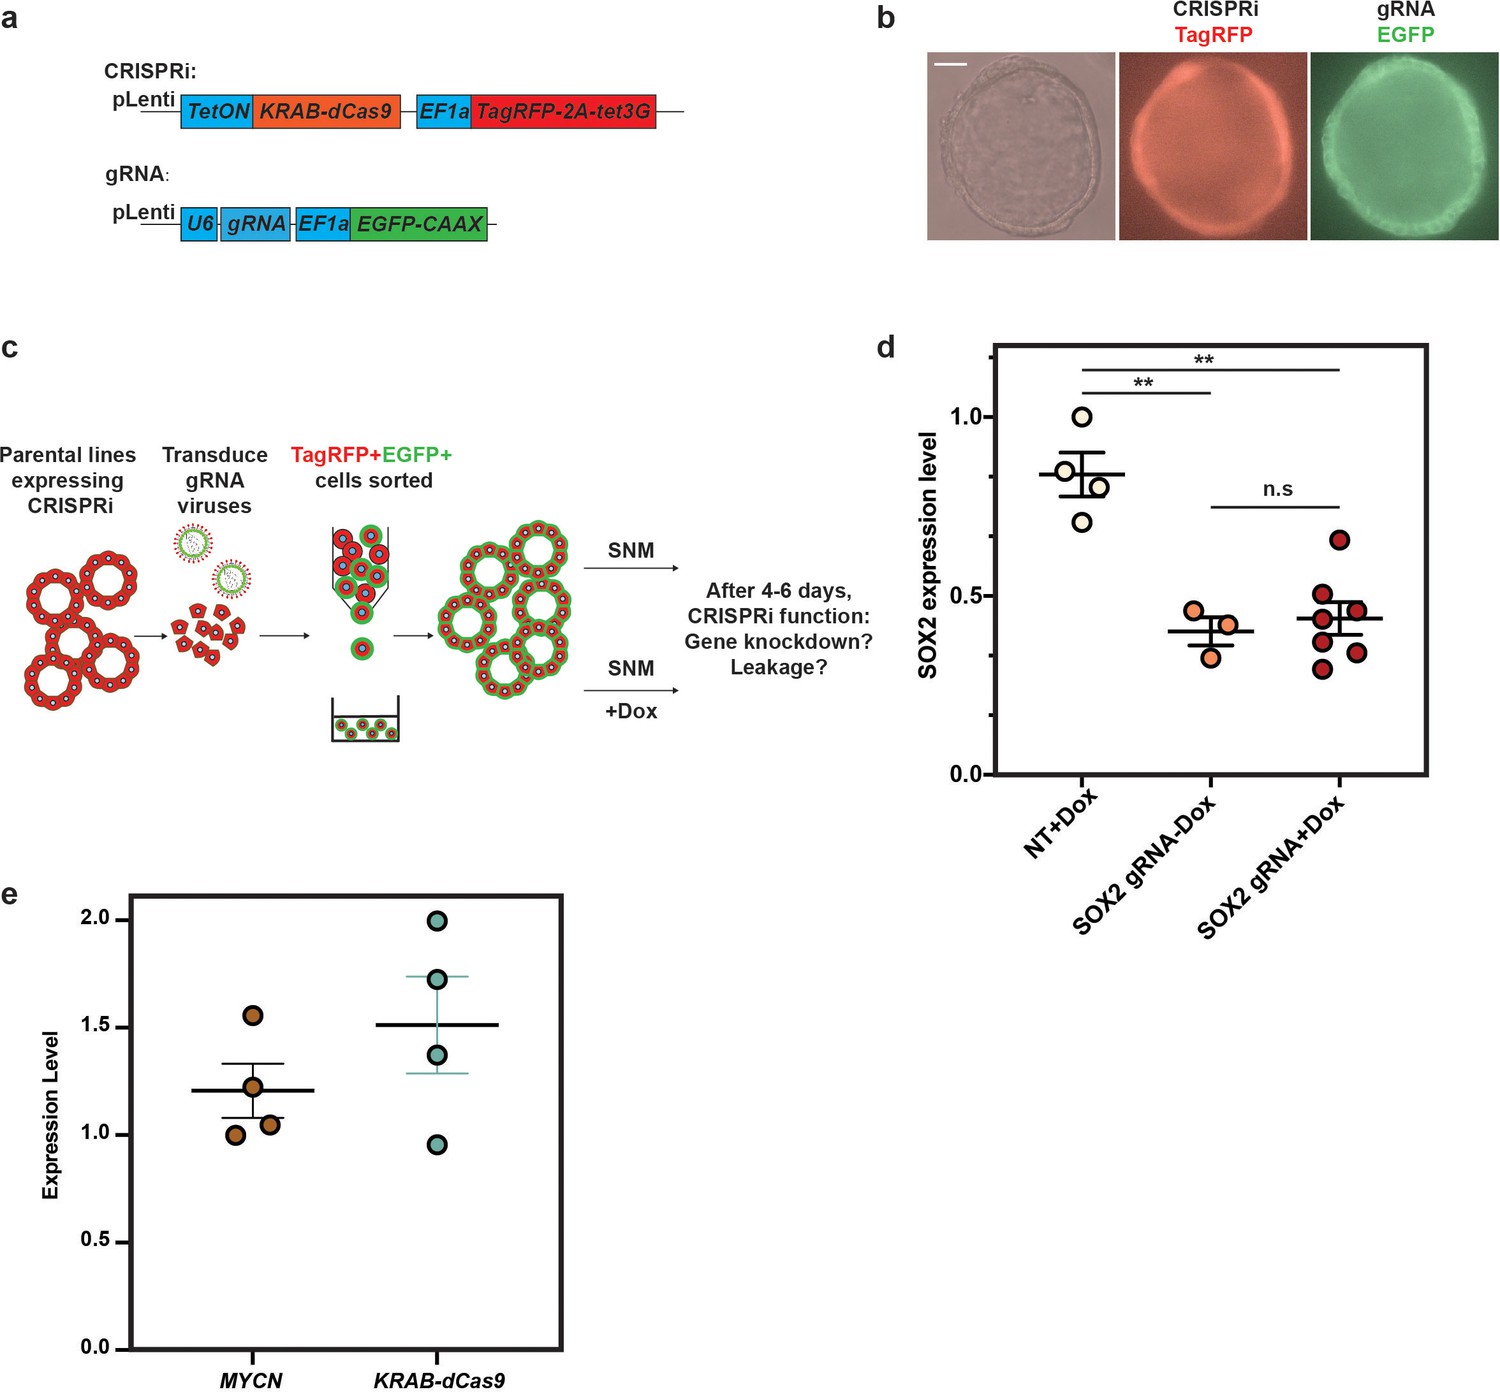
The tetON system alone was not able to tightly control CRISPRi function.
(a) Schematic of lentiviral design for introducing inducible CRISPRi and gRNA into human foetal lung organoids. (b) Representative images showing an organoid colony with both the inducible CRISPRi system and a gRNA. Scale bar denotes 50 μm. (c) Workflow for testing the leakiness of the inducible CRISPRi system. A parental organoid line with inducible CRISPRi was introduced via lentiviral transduction, followed by sorting for TagRFP-positive cells. Single cells were re-plated (~3000–5000 cells/well of a 24-well plate) and expanded for around 17 days. gRNA lentivirus was then introduced by a second lentiviral transduction event, followed by sorting for TagRFP/EGFP dual-positive cells after 3 days. Cells were re-plated again (~2000–3000 cells/well of a 24-well plate) and expanded for another 10 days before treatment with doxycycline (Dox). 4–6 days after Dox treatment, gRNA performance was evaluated. (d) SOX2 can be effectively knocked down by inducible CRISPRi. However, the knockdown effect cannot be tightly controlled. Organoids with Dox were harvested 4–6 days after the treatment. SOX2 was effectively knocked down at the mRNA level. However, a similar effect was observed without Dox treatment. Each dot represents an independent experiment. Two independent organoid lines with two different non-targeting control gRNAs and three different SOX2 gRNAs were used. SOX2 expression level was normalised to organoids with non-targeting control gRNAs. Error bars are plotted to show mean ± SEM. A two-sided Student’s t-test with non-equal variance was used to compare the means of each group. ** indicates p-value < 0.01. n.s. indicates non-significant. (e) RT-qPCR revealed background inducible CRISPRi expression. We detected KRAB-dCas9 expression in organoids with SOX2 gRNAs without Dox administration. KRAB-dCas9 expression level was similar to MYCN, which is a tip progenitor cell-enriched transcription factor (Nikolić et al., 2017). Error bars are plotted to show mean ± SEM.
Figure 3—figure supplement 2

Kinetics and reversibility of the inducible CRISPRi system.
(a) Schematic of the experimental design for testing the kinetics of the inducible CRISPRi system using CD71 knockdown. Doxycycline (Dox) and trimethoprim (TMP) were treated for the first 5 days and organoid cells were harvested every day for analysing CD71 expression levels via flow cytometry. On day 5, Dox and TMP were removed, organoid cells were maintained and harvested on days 6, 8, 10, 14 and 18, respectively, to analyse CD71 expression level via flow cytometry. On day 18, Dox and TMP were added back for a further 5 days to further validate the CRISPRi knockdown effect. Organoid cells were harvested on day 23 to analyse CD71 expression level. (b) Knockdown kinetics and the reversibility of the inducible CRISPRi system on CD71. CD71 knockdown effects were achieved in ~90% of cells by day 5 and reversed to 0.9% knocked down cells after ~2 weeks Dox and TMP removal. Percentage of CD71low cells was labelled with mean ± SEM. Two different organoids and two different CD71 gRNAs were used. (c) Representative flow cytometry results showing that inducible CRISPRi remained fully functional after recovery from the previous round of CRISPRi knockdown. Grey histogram indicates CD71 expression level for organoids with non-targeting control gRNA after Dox and TMP treatment for 5 days; pink histogram indicates the CD71 expression level for CD71 gRNA with Dox and TMP treatment for 5 days. Percentage of CD71low cells was labelled with mean ± SEM. Two different gRNAs for CD71 and two different organoid lines were used. (d) Knockdown kinetics and the reversibility of the inducible CRISPRi system on SOX2. Upper panel: schematic of the experimental design for testing the kinetics and reversibility of the inducible CRISPRi system using SOX2 knockdown. Dox and TMP were treated for the first 5 days and organoid cells were harvested on days 1, 3 and 5 for RT-qPCR analysis of SOX2 expression. On day 5, Dox and TMP were removed, organoid cells were harvested on days 8, 10, 14 and 18 to analyse SOX2 expression level via RT-qPCR. Lower panel: RT-qPCR results showing SOX2 knockdown kinetics and SOX2 expression recovery after Dox and TMP removal. Similar to CD71 expression recovery, SOX2 expression was reversible. Two different gRNAs for SOX2 and two different organoid lines were used.
Figure 4 with 1 supplement
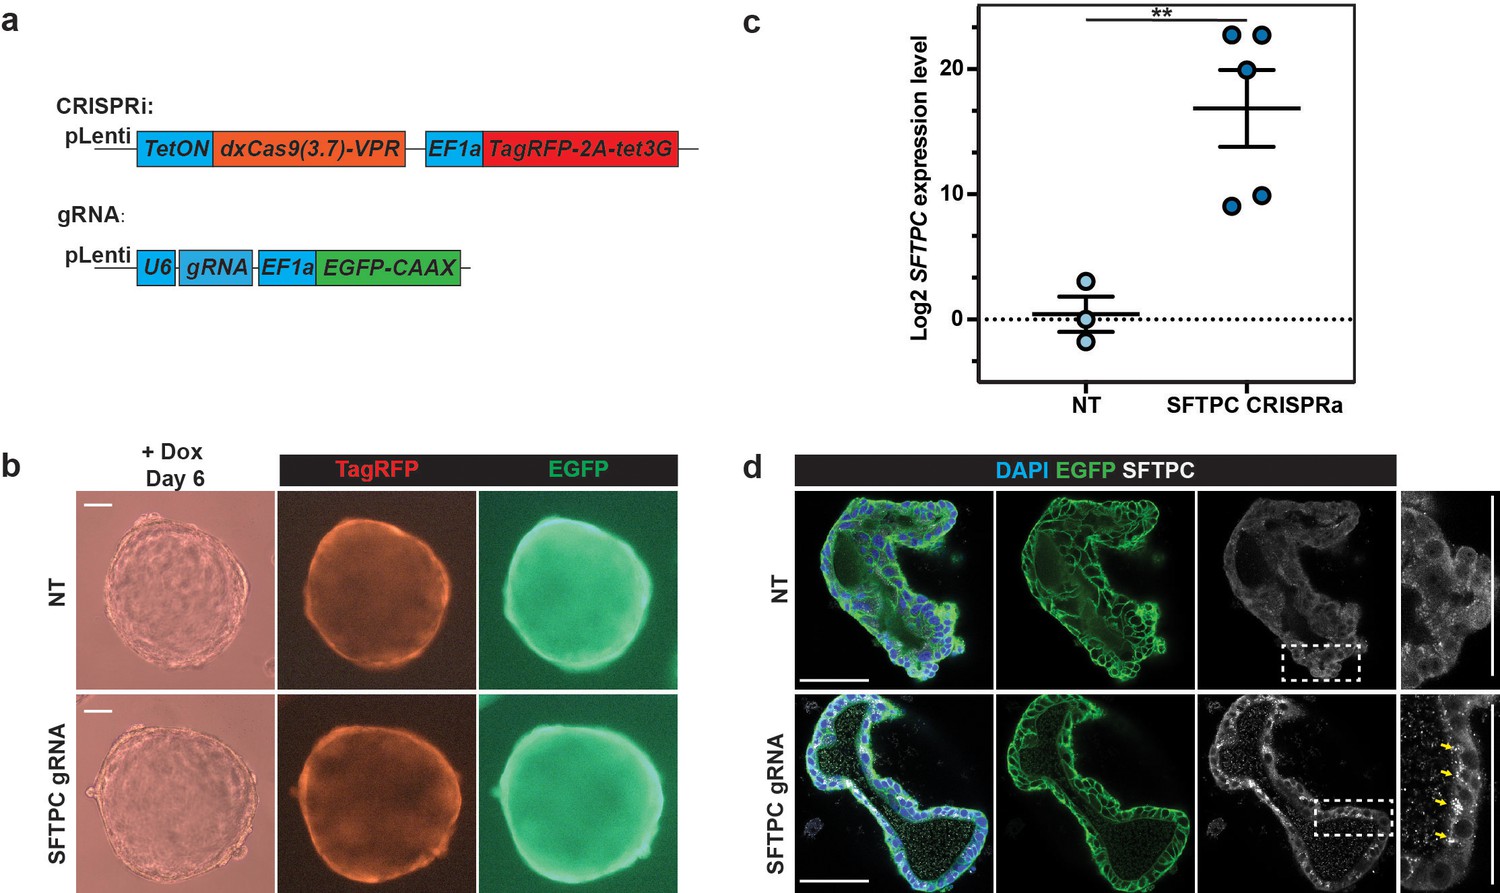
Inducible CRISPRa drove expression of a silent gene, SFTPC, in human foetal lung organoids.
(a) Schematic of lentiviral design for introducing the CRISPRa system and gRNA into human foetal lung organoids. (b) Representative images to show organoid morphology after SFTPC activation after 6 days of doxycycline (Dox) treatment. SFTPC activation (lower panel) did not result in obvious phenotypic changes in organoids compared with non-targeting gRNA control (upper panel). (c) SFTPC can be effectively activated by CRISPRa system indicated by qRT-PCR. Each dot represents an independent experiment. Two independent organoid lines with two different non-targeting control (NT) gRNAs and three different SFTPC gRNAs were used. SFTPC expression level was normalised to organoids with non-targeting control (NT) gRNAs. A detailed breakdown of the results is given in Figure 4—figure supplement 1. Error bars are plotted to show mean ± SEM. A two-sided Student’s t-test with non-equal variance was used to compare the means of each group. ** indicates p-value < 0.01. (d) Representative immunofluorescence showing proSFTPC protein accumulation in organoid cells after CRISPRa activation of SFTPC gene expression. Bright SFTPC protein aggregates accumulated in cells, consistent with the hydrophobic nature of SFTPC protein. Green: EGFP; white: proSFTPC protein. Scale bars denote 100 μm (b) and 50 μm (d).
Figure 4—figure supplement 1
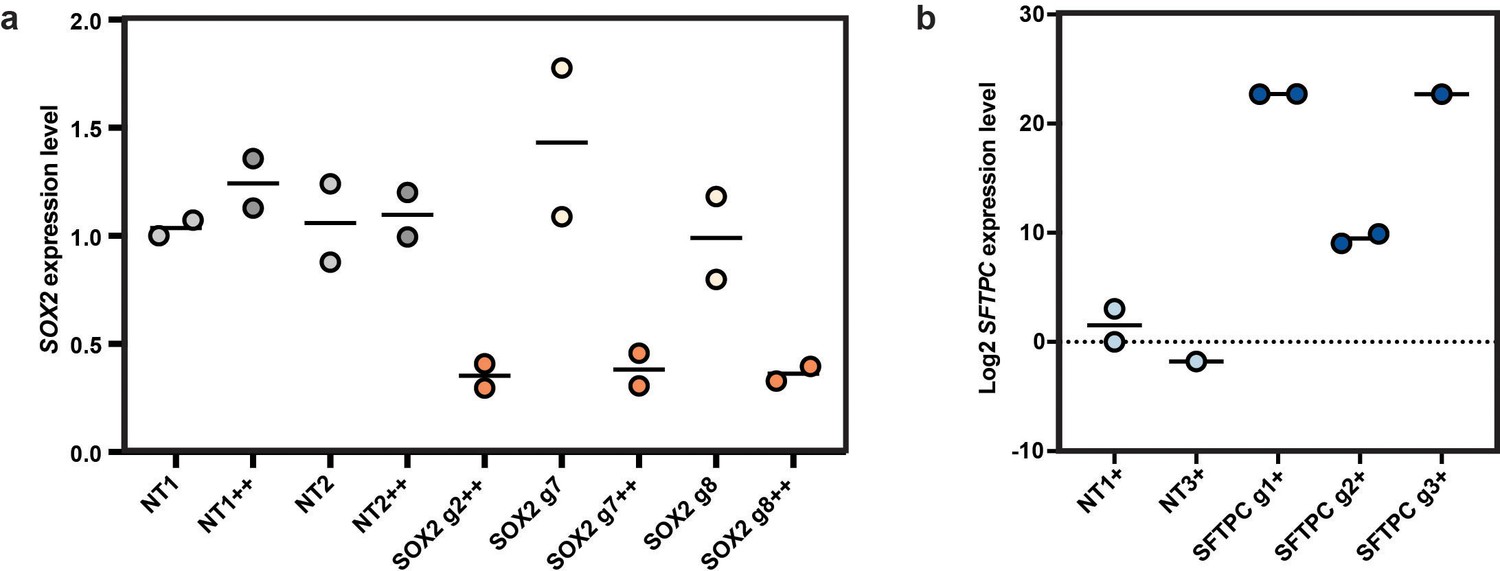
SOX2 CRISPRi and SFTPC CRISPRa results break down.
(a) qRT-PCR result details for Figure 3e. Each dot represents an independent experiment. Two independent organoid lines were used for each gRNA. SOX2 expression levels were normalised to SOX2 expression level in organoids with non-targeting (NT) control gRNA #1. Lines indicate means. (b) qRT-PCR result details for Figure 4 (c). Each dot represents an independent experiment. SFTPC expression levels were normalised to SFTPC expression level in organoids with non-targeting (NT) control gRNA #1. One or two independent organoid lines were used for each gRNA. Lines indicate means.
Additional files
-
Transparent reporting form
- https://cdn.elifesciences.org/articles/67886/elife-67886-transrepform1-v2.pdf
-
Supplementary file 1
Summary of genetic manipulation efficiency in different organoid lines.
- https://cdn.elifesciences.org/articles/67886/elife-67886-supp1-v2.xlsx
-
Supplementary file 2
Primers and gRNA sequences used in this study.
- https://cdn.elifesciences.org/articles/67886/elife-67886-supp2-v2.xlsx
-
Supplementary file 3
Raw quantification data.
Summary of qRT-PCR results, flow cytometry quantification results of DNA delivery efficiency, small-molecule function and CRISPRi kinetics analysis and ICE analysis results.
- https://cdn.elifesciences.org/articles/67886/elife-67886-supp3-v2.xlsx
-
Source data 1
Gels and blots.
- https://cdn.elifesciences.org/articles/67886/elife-67886-supp4-v2.zip
Download links
A two-part list of links to download the article, or parts of the article, in various formats.
Downloads (link to download the article as PDF)
Open citations (links to open the citations from this article in various online reference manager services)
Cite this article (links to download the citations from this article in formats compatible with various reference manager tools)
A functional genetic toolbox for human tissue-derived organoids
eLife 10:e67886.
https://doi.org/10.7554/eLife.67886


