Pathogenic LRRK2 control of primary cilia and Hedgehog signaling in neurons and astrocytes of mouse brain
- Department of Biochemistry, Stanford University School of Medicine, United States
- Aligning Science Across Parkinson’s (ASAP) Collaborative Research Network, United States
- MRC Protein Phosphorylation and Ubiquitylation Unit, University of Dundee, United Kingdom
Figures
Figure 1 with 1 supplement

G2019S LRRK2 striatal cholinergic interneurons have fewer primary cilia.
(A) Confocal images of sections of the dorsal striatum from 13 month wild-type (WT) or G2019S LRRK2 KI mice; Cholinergic Acetyltransferase (ChAT) (green, white outline); Adenylate cyclase 3 (AC3) (magenta, white box), and DAPI (blue). (B) Percentage of ChAT+ neurons containing a cilium. Wild type, light gray; G2019S KI, dark gray as indicated. (C) Quantitation of ChAT+ neuron ciliary length from sections as in A. (D) Confocal images of sections of the dorsal striatum of 10 month WT or G2019S LRRK2 BAC Tg mice; ChAT (green, white outline), AC3 (magenta, white box), and neuron specific nuclear antigen, NeuN (blue). (E) Percentage of G2019S LRRK2 BAC or wild-type ChAT+ interneurons containing a cilium. (F) Quantitation of ChAT+ neuron ciliary length. Scale bar, 10 µm. Significance was determined by t-test; (B) **, p = 0.0016; (E) ***, p = 0.0001. Values represent the data from individual brains, analyzing 4–5 brains per group, 2–3 sections per mouse, and >30 neurons per mouse.
Figure 1—figure supplement 1
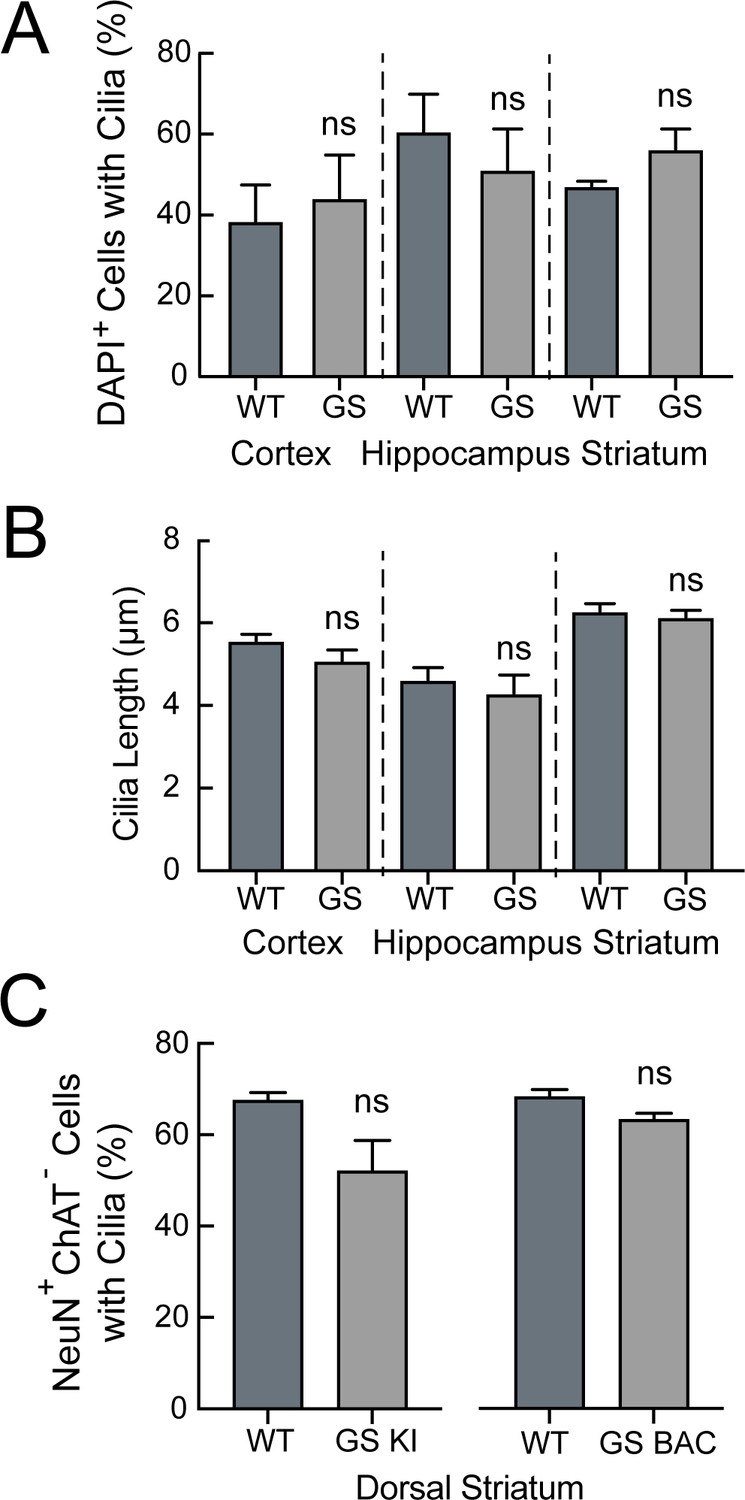
Cilia density and cilia length in G2019S LRRK2 and wild type mice.
(A) Quantitation of cilia density for all cells marked by DAPI staining in the cortex, hippocampus, and striatum of 13 month G2019S LRRK2 KI (GS KI) or WT mice. (B) Quantitation of cilia length for DAPI-stained cells in the cortex, hippocampus and striatum of 13 month GS KI or WT mice. (C) Quantitation of NeuN+ neurons with cilia in the dorsal striatum of 13 month GS KI and WT mice (left bars) or 10 month GS BAC and WT mice (right bars). Significance was determined by t-test for 2–3 tissue sections per genotype; > 50 cells per brain region.
Figure 2
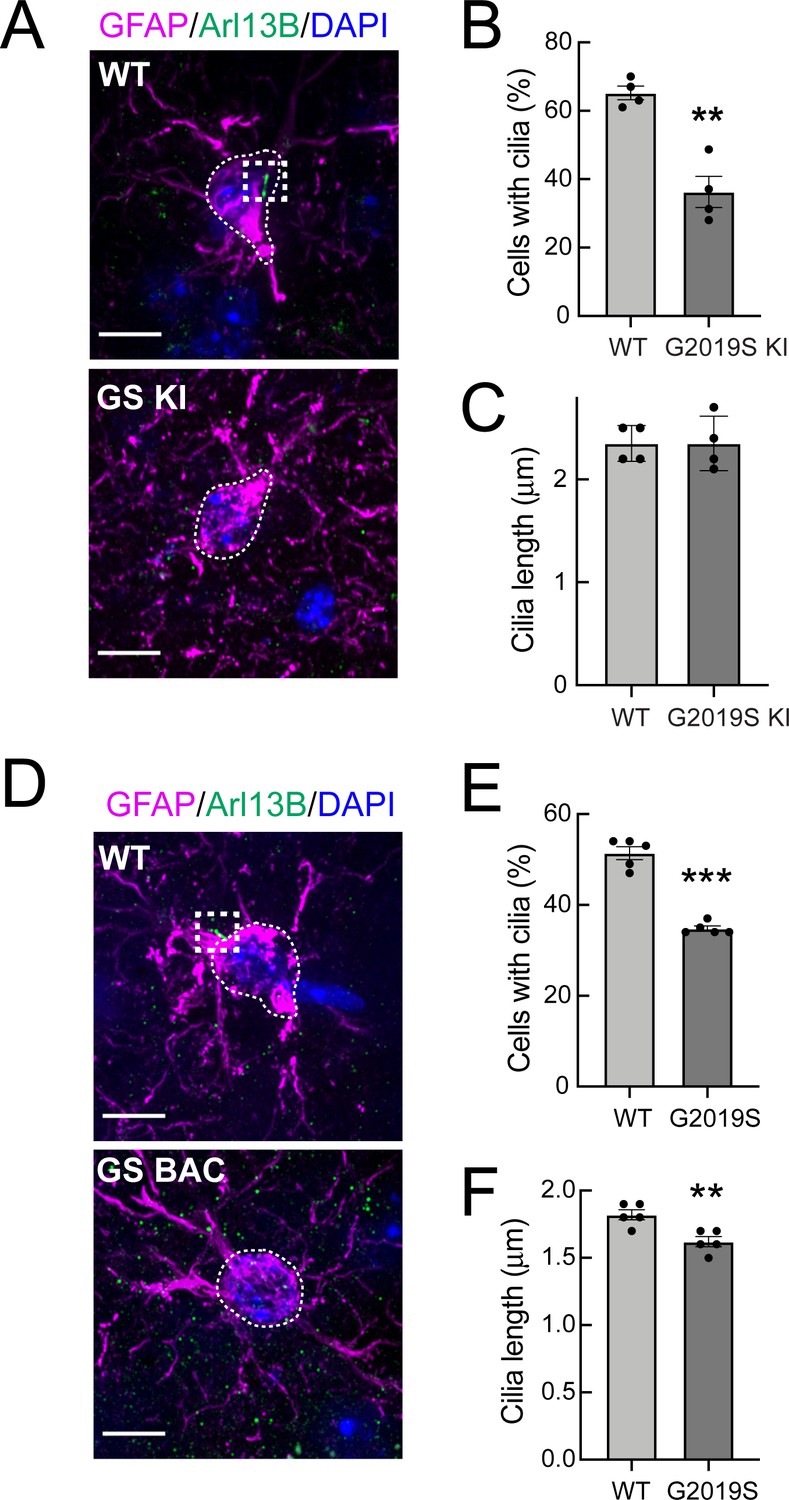
G2019S LRRK2 striatal astrocytes have fewer primary cilia.
(A) Confocal images of sections of the dorsal striatum from 13 month WT or G2019S LRRK2 KI mice; astrocyte marker, Glial fibrillary acidic protein (GFAP) (magenta, white outline), cilia marker, ADP-ribosylation factor-like protein 13B (Arl13B) (green, white box), and DAPI (blue). (B, C) Quantitation of the percentage of astrocytes containing a cilium and astrocyte ciliary length from sections described in A. (D) Confocal images of sections of the dorsal striatum from 10 month G2019S LRRK2 BAC Tg mice, antibody labeled for Glial fibrillary acidic protein (GFAP, magenta, white box), Arl13B (green, white box), and stained with DAPI (blue). (E, F) Quantitation of the percentage of astrocytes containing a cilium and astrocyte ciliary length from sections described in D. Scale bars, 10 µm. Values represent 4–5 brains per group, 2–3 sections per mouse, and >30 astrocytes per mouse. Significance was determined by t-test; B, **, p = 0.0011; E, ** p = 0.0054; F, **** p < 0.0001.
Figure 3
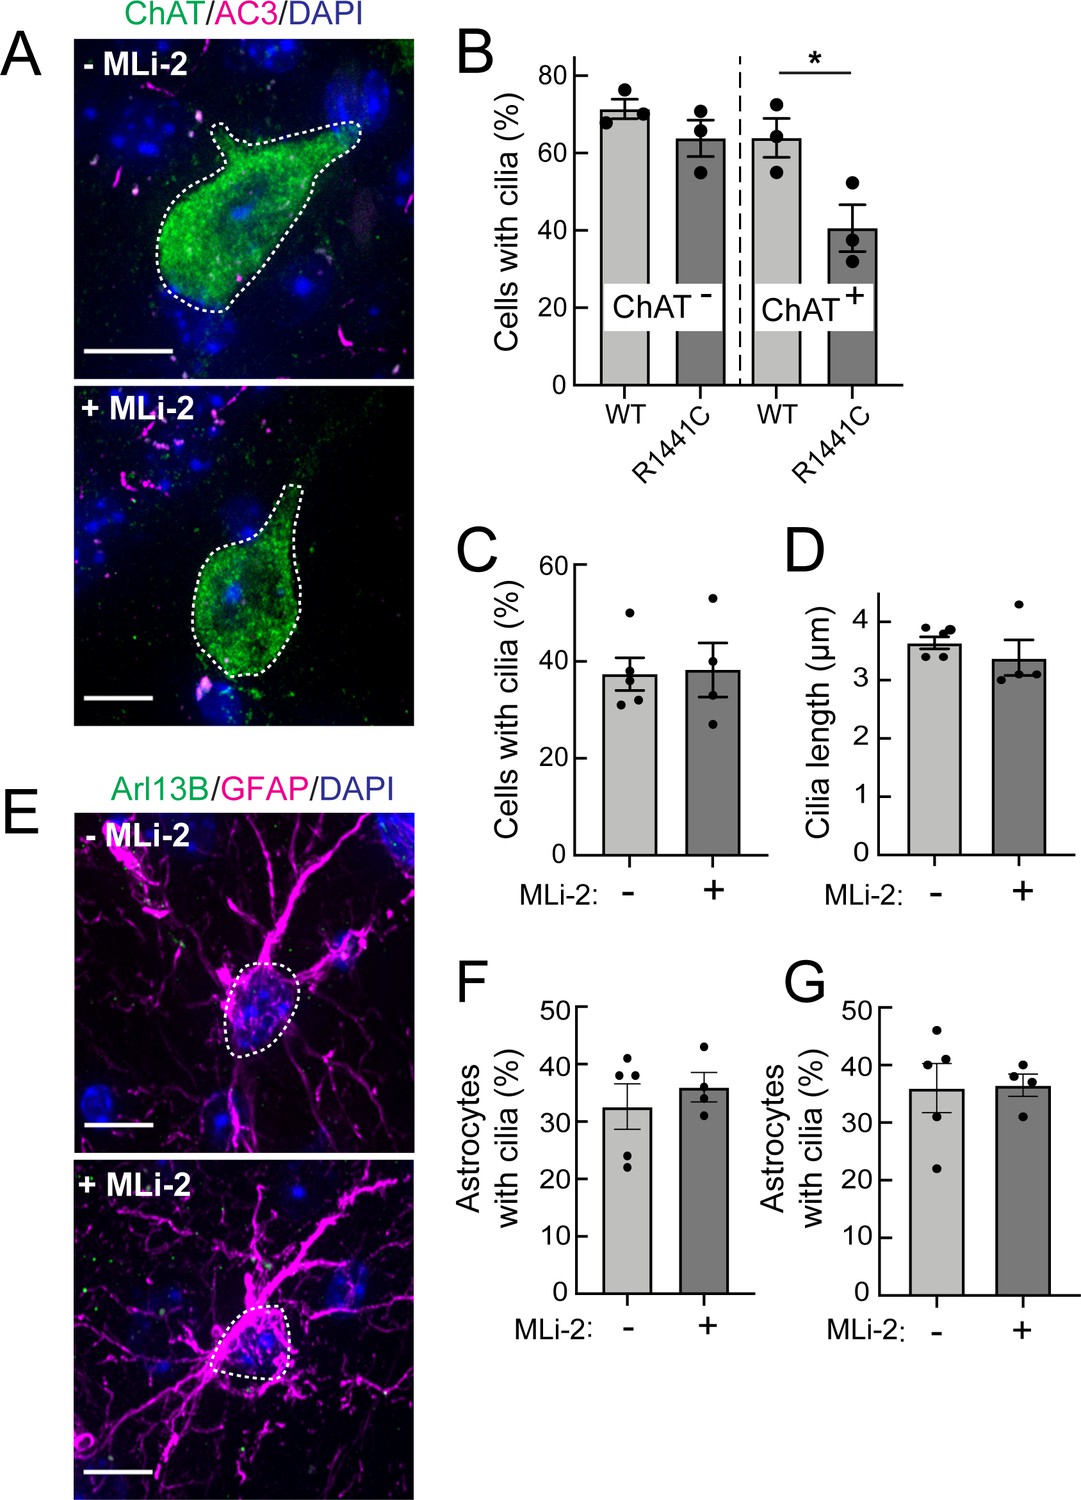
Two weeks MLi-2 treatment does not alter ciliogenesis in R1441C LRRK2 striatal interneurons or astrocytes.
Mice (8 weeks old) were fed MLi-2 LRRK2 inhibitor-containing chow or control chow for 2 consecutive weeks prior to perfusion and staining. (A) Confocal images of sections of the dorsal striatum from 8 week R1441C LRRK2 KI mice; ChAT (green, white outline); Adenylate cyclase 3 (AC3) (magenta), and DAPI (blue). (B) Quantitation of the percentage of ChAT+ and ChAT- neurons containing a cilium. (C) Percentage of ChAT+ neurons containing a cilium± MLI-2. (D) Quantitation of ChAT+ neuron ciliary length. (E) Confocal images of astrocytes identified by antibodies to GFAP (magenta, white outline), Arl13B (green), and DAPI (blue), ± MLi-2. (F, G) Quantitation of the percentage of total astrocytes (F) or GFAP/S100B+ astrocytes (G) containing a cilium. Scale bars, 10 µm. Significance was determined by t-test. B, *, p = 0.0417.
Figure 4
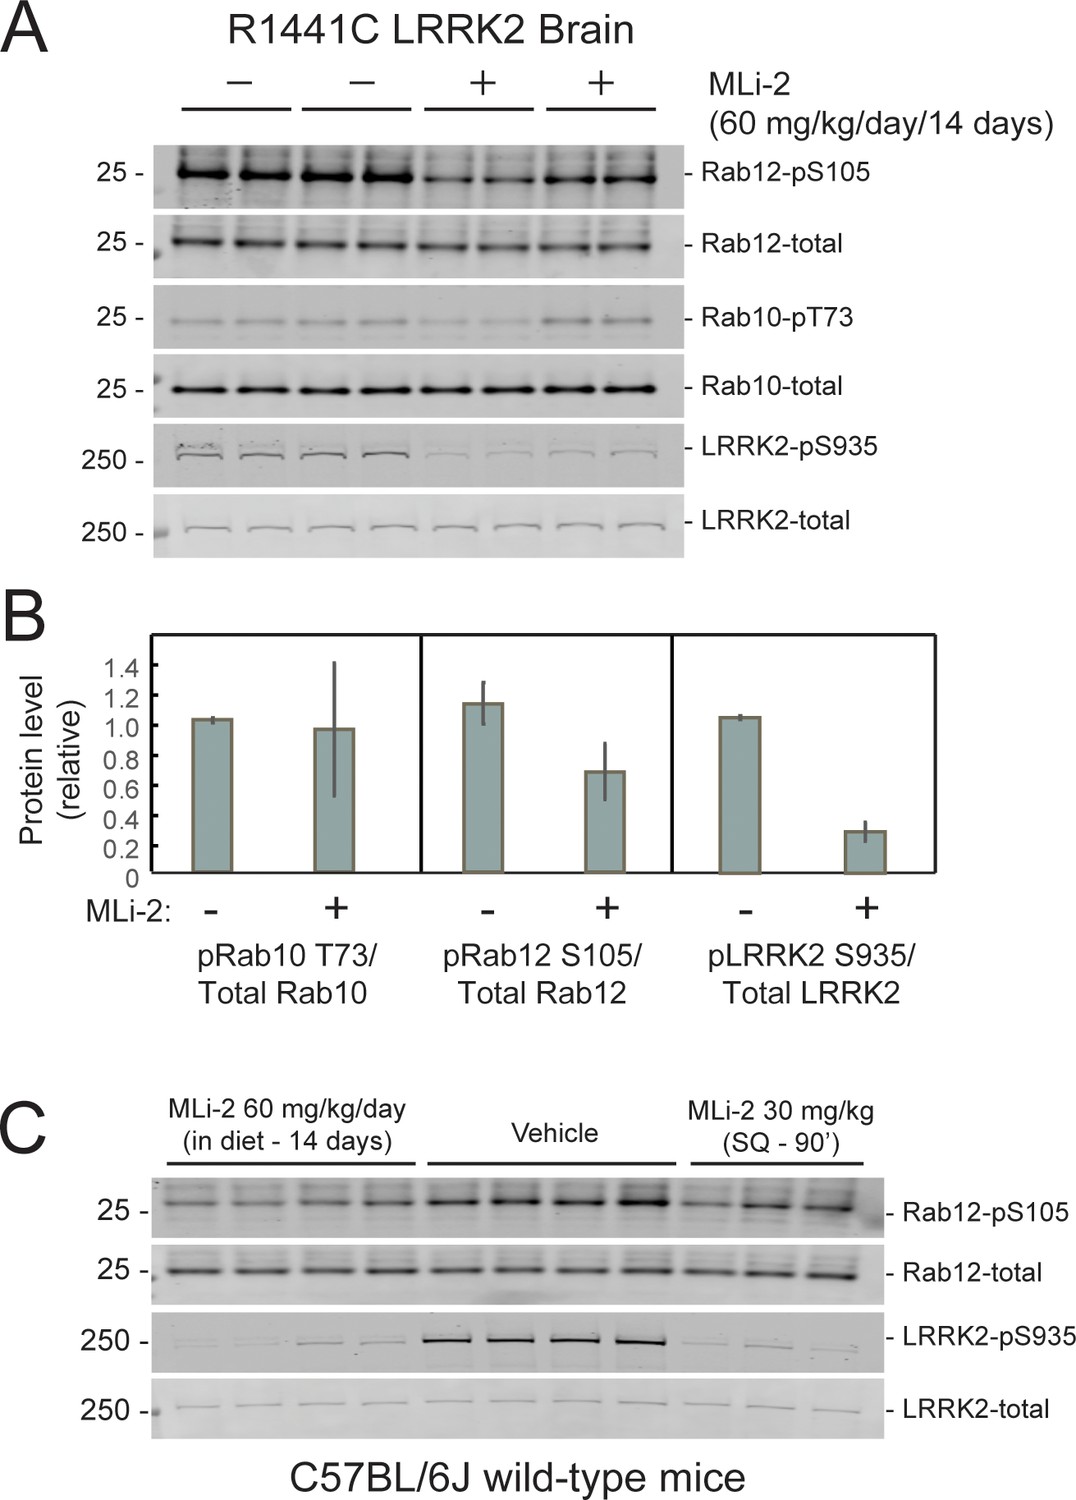
Two weeks of MLi-2 treatment decreases LRRK2 pS935 but does not alter Rab10 phosphorylation in R1441C LRRK2 mouse brain.
(A and B). Littermate- or age-matched LRRK2 R1441C homozygous knock-in mice were fed either a control diet or MLi-2-containing diet for 14 days prior to tissue collection. Two mice from each group were perfused with PBS only; brains collected from these mice were snap frozen in liquid nitrogen and used to monitor inhibition of LRRK2 activity by immunoblotting. (A). 40 μg brain tissue extract was subjected to immunoblot analysis with antibodies specific for the indicated antigens. Duplicate samples were analyzed using the LI-COR Odyssey CLx imaging system. (B). Quantitation of data in A, calculated using Image Studio software (mean ± SD, normalized to control diet-fed animals.) (C). 11 C57BL/6 j wild-type mice received either control diet or diet containing MLi-2, targeted to provide a concentration of 60 mg/kg per day for 14 days. On the last day, 3 mice from the control diet group received 30 mg/kg MLi-2 dissolved in 40 % (w/v) (2-hydroxypropyl)-β-cyclodextrin via subcutaneous injection for 2 hr prior to tissue collection. Forty μg brain tissue extract was subjected to quantitative immunoblotting analysis with the indicated antibodies. Each lane represents a tissue sample from a different animal.
Figure 5 with 1 supplement
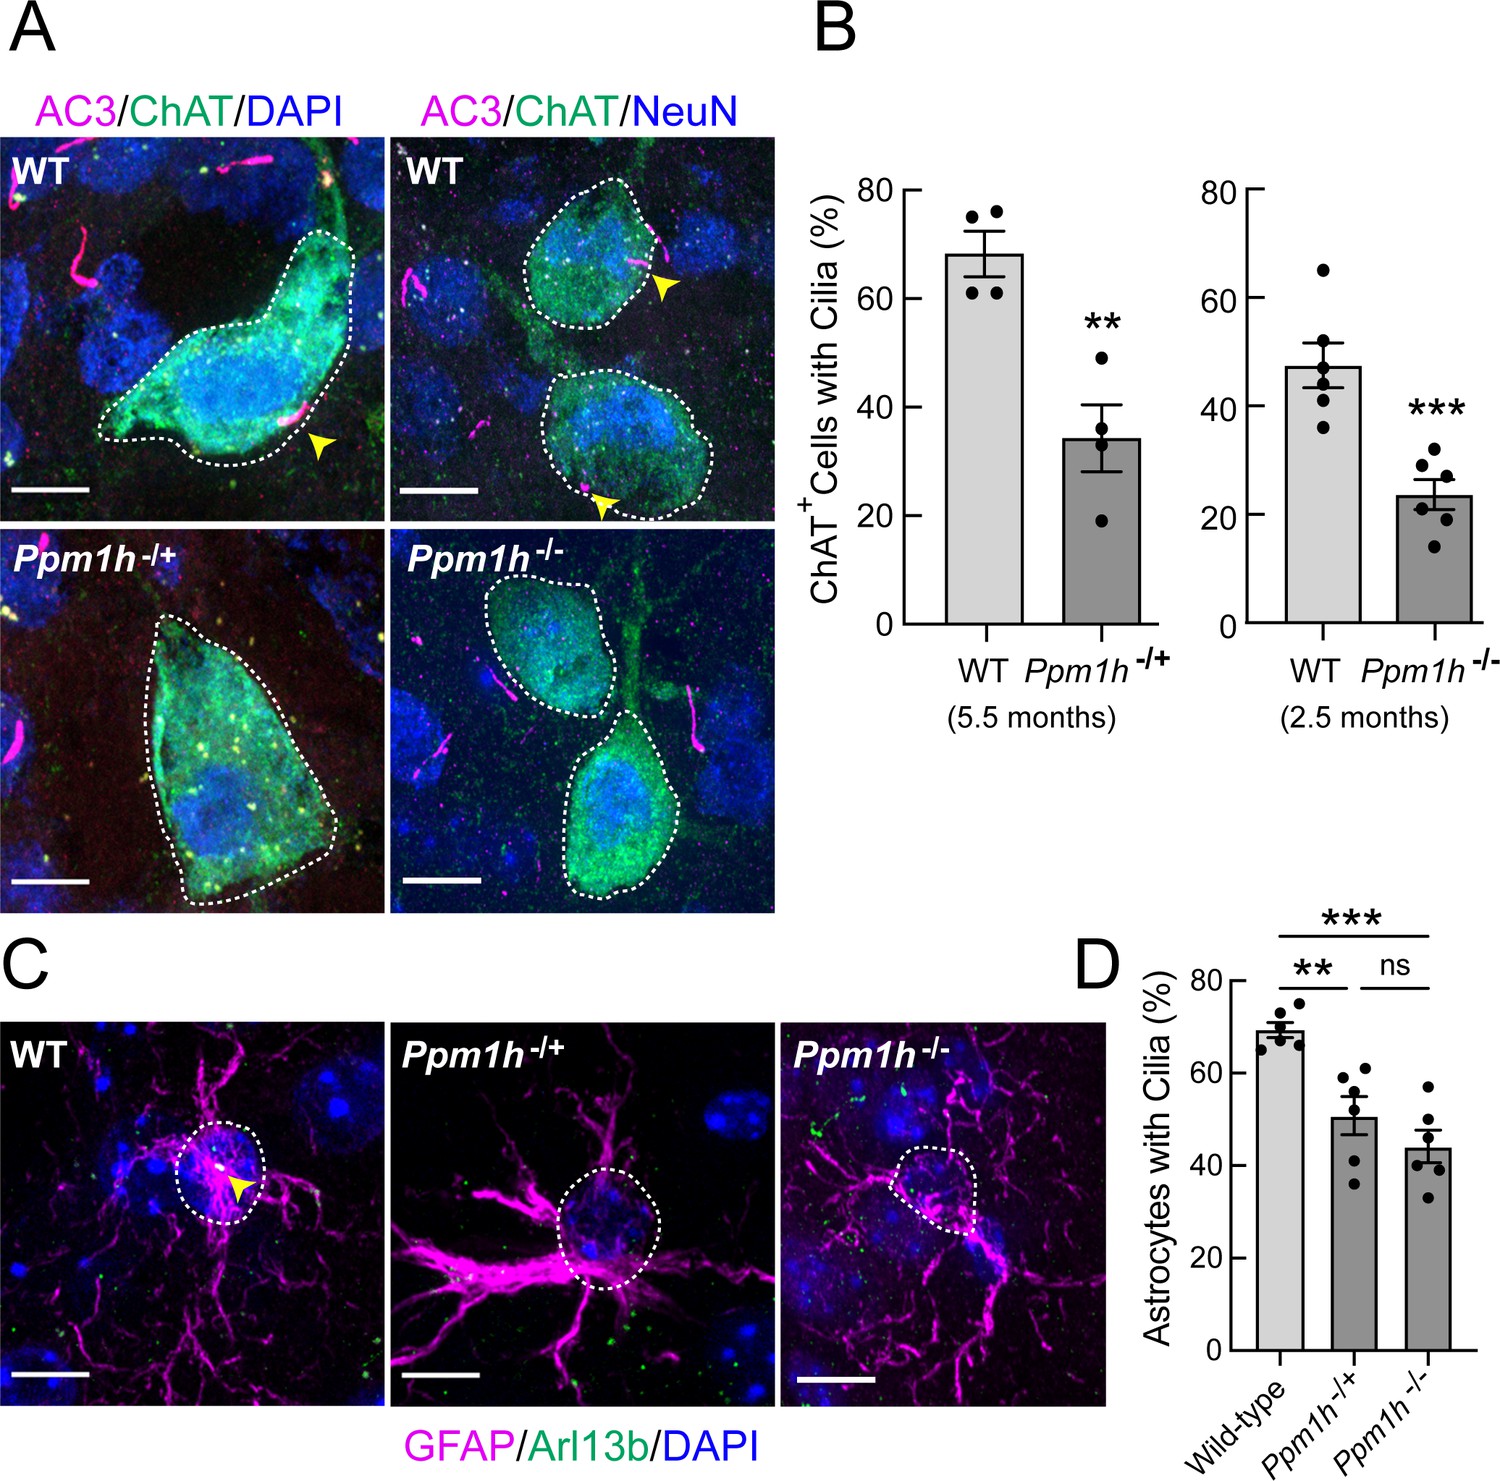
PPM1H mutant striatal cholinergic neurons and astrocytes have fewer primary cilia.
(A) Confocal images of sections from 5.5 month Ppm1h-/+ or 2.5 month Ppm1h-/- mice compared with corresponding age-matched WT mice; ChAT (green, white outline); AC3 (magenta, yellow arrowhead), and DAPI (blue). (B) Percentage of ChAT+ neurons of the indicated genotype containing a cilium. Wild type, light gray; Ppm1h mutant, dark gray as indicated. (C) Confocal images of sections of the dorsal striatum from mice described in A and B as indicated; GFAP (magenta), Arl13B (green, yellow arrowhead), and DAPI (blue). (D) Percentage of GFAP+ astrocytes containing a cilium. Wild-type, light gray; Ppm1h-/+ or Ppm1h-/-, dark gray as indicated. Scale bars, 10 µm. Significance was determined by t-test; (B) WT vs Ppm1h-/+; **, p = 0.0018. (C) WT vs Ppm1h-/-; ***, p = 0.0007. (D) WT vs Ppm1h-/+; **, p = 0.0032. WT vs Ppm1h-/-; ***, p = 0.0002. Ppm1h-/+vs Ppm1h-/-; ns, p = 0.3474. Values represent the data from individual brains, analyzing four brains per group, 2–3 sections per mouse, and >30 cells per mouse. Significance was determined either by student’s t-test or by Ordinary one-way ANOVA using Dunnett’s multiple comparisons test. Scale bars, 10 µm.
Figure 5—figure supplement 1
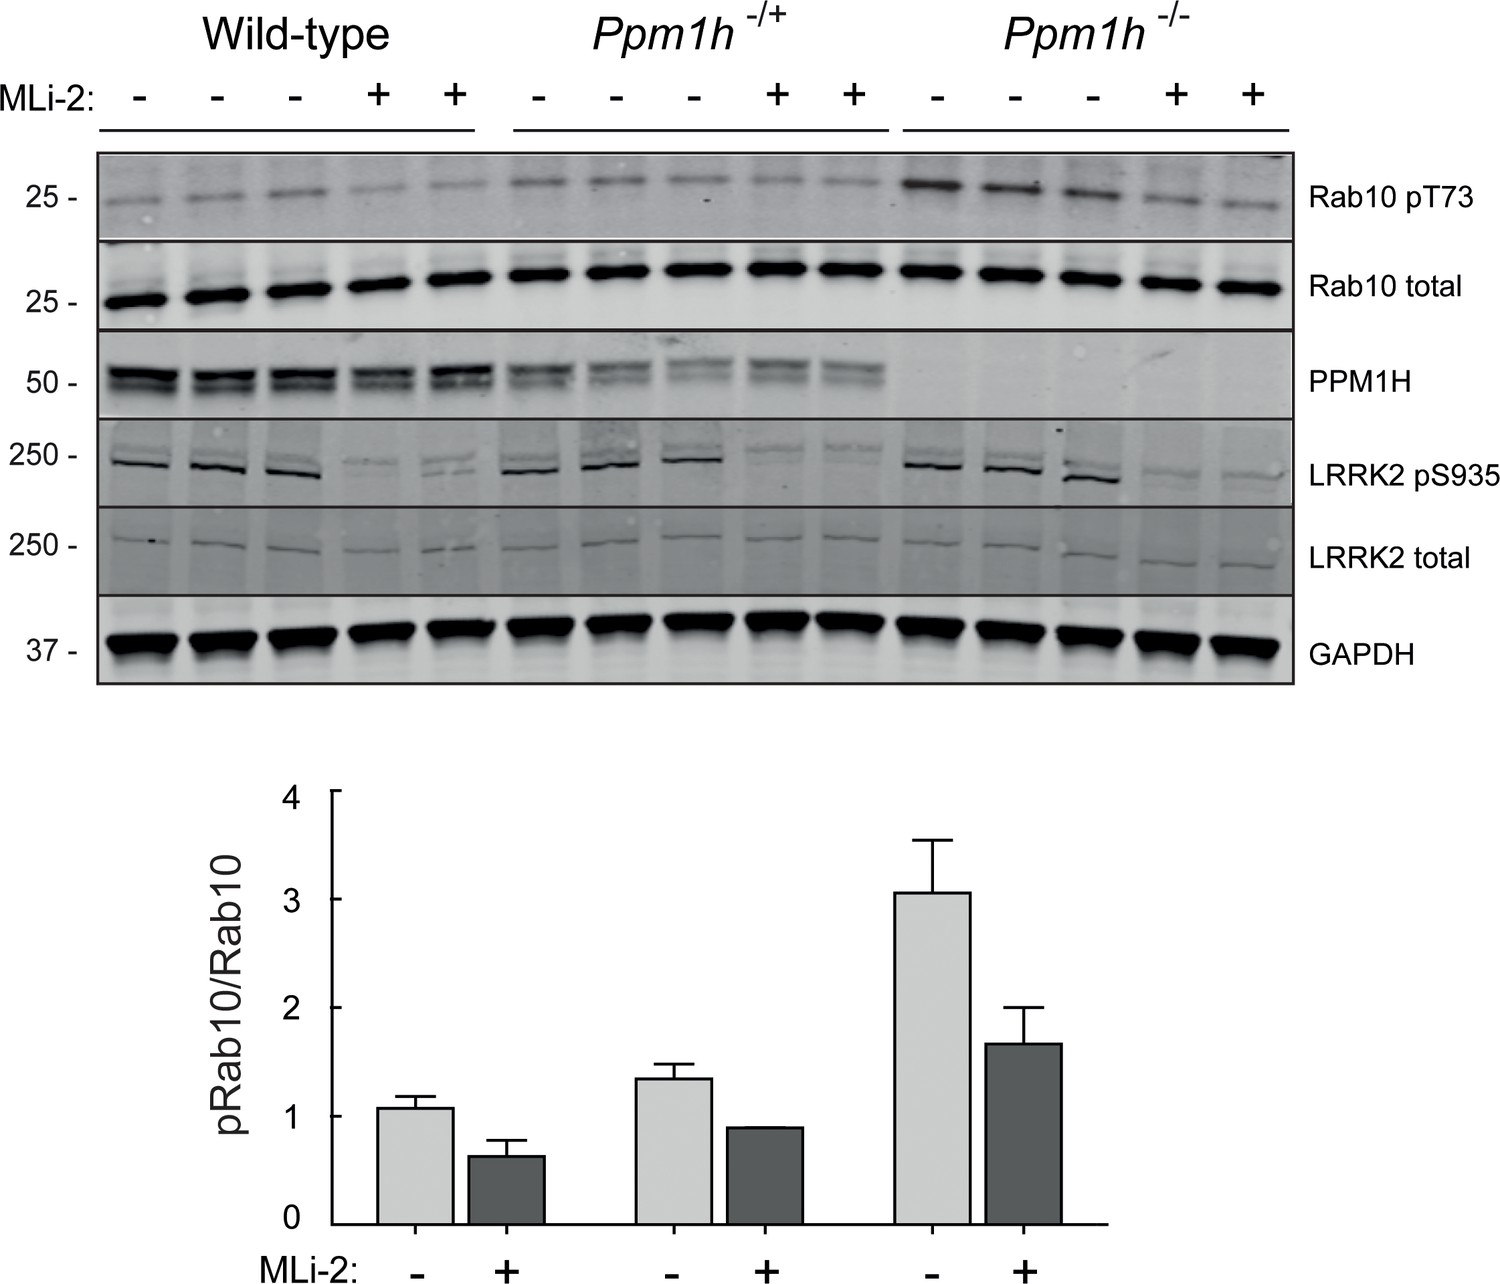
Wildtype and PPM1H heterozygous or homozygous knock-out mice were treated with vehicle (40% (w/v) (2-hydroxypropyl)-β-cyclodextrin) or 30 mg/kg MLi-2 dissolved in vehicle by subcutaneous injection 2 hr prior to tissue collection.
Forty μg brain tissue extract was analyzed by quantitative immunoblotting analysis with the indicated antibodies. Each lane represents extract from a different mouse.
Figure 6

Gli1 expression in R1441C LRRK2 dorsal striatal cholinergic Interneurons is cilia dependent and enhanced.
(A) Ten month WT mouse dorsal striatum was subjected to in situ hybridization using a Gli1 probe (gray dots, highlighted by yellow arrowheads) or a negative control probe. ChAT (green, white outline) and DAPI+ nuclei (blue) were detected by immuno- or chemical staining. (B) Ten month WT or R1441C mouse dorsal striatum was labeled as indicated: ChAT (green, white outline), AC3 (magenta, white arrow), Gli1 mRNA (gray dots, yellow arrowheads), DAPI (blue). (C) Average numbers of Gli1 dots per cell for all cell types in the dorsal striatum. Cell numbers were determined by DAPI staining. Values represent the mean ± SEM from 4 WT and 4 R1441C brains each containing >500 DAPI stained nuclei from 30 regions. p = 0.88. (D) Average numbers of Gli1 dots for cholinergic interneurons with or without primary cilia as indicated. Values represent the mean ± SEM from 4 WT and 5 R1441C brains, each containing 9–32 cells. (E) Histogram of the number of Gli1 dots in ciliated cholinergic interneurons from WT or R1441C mice. p = 0.14 (0), 0.054 (1-2),*,0.015 (3-4), 0.79 (5-). Significance was determined by t-test. Arrows indicate primary cilia for ChAT interneurons. Arrowheads indicate Gli1 mRNA dots. Scale bars, 10 µm.
Figure 7
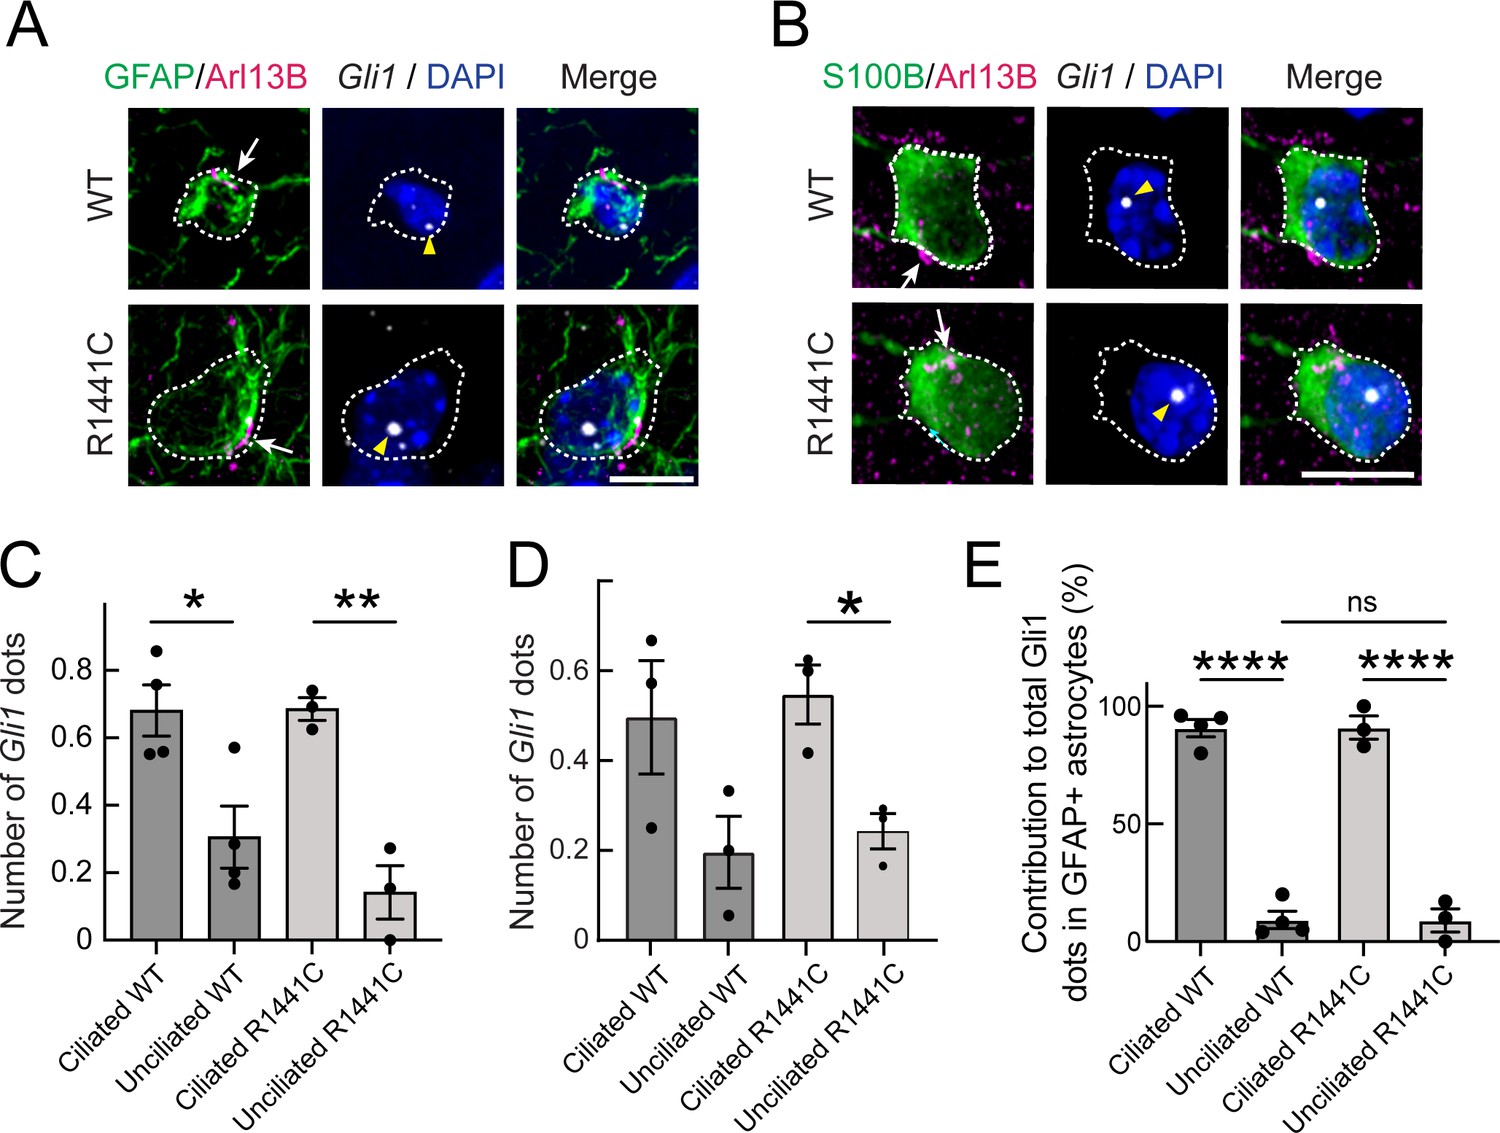
Gli1 expression in astrocytes is cilia dependent.
(A,B) Ten month R1441C LRRK2 KI mouse dorsal striatum was subjected to in situ hybridization using a Gli1 probe (gray dots, highlighted with yellow arrowheads). Astrocytes were detected with (A) anti-GFAP or (B) anti-S100B (green, white outline); primary cilia were detected with anti-Arl13B (magenta, white arrows). (C,D) Average numbers of Gli1 dots from (C) GFAP and (D) S100B+ astrocytes with or without primary cilia. (E) Relative contribution to total Gli1 dots over GFAP+ astrocytes as a function of their ciliation status. Values represent the mean ± SEM from (C) 4 WT and 3 R1441C brains each containing >35 cells or (D) 3 WT and 3 R1441C brains each containing >21 cells. (C) Ciliated WT vs Unciliated WT: *, p = 0.020, Ciliated R1441C vs Ciliated R1441C: **, p = 0.0032. (D) Ciliated WT vs Unciliated WT: p = 0.12, Ciliated R1441C vs Unciliated R1441C: *, p = 0.017. (E) Ciliated WT vs Unciliated WT: ****, p < 0.0001; Ciliated R1441C vs Unciliated R1441C: ****, p < 0.0001; Unciliated WT vs Unciliated R1441C: ns, p > 0.9999. Significance was determined by unpaired t-test. Arrows indicate primary cilia from GFAP or S100B+ astrocytes. Scale bars, 10 µm.
Figure 8
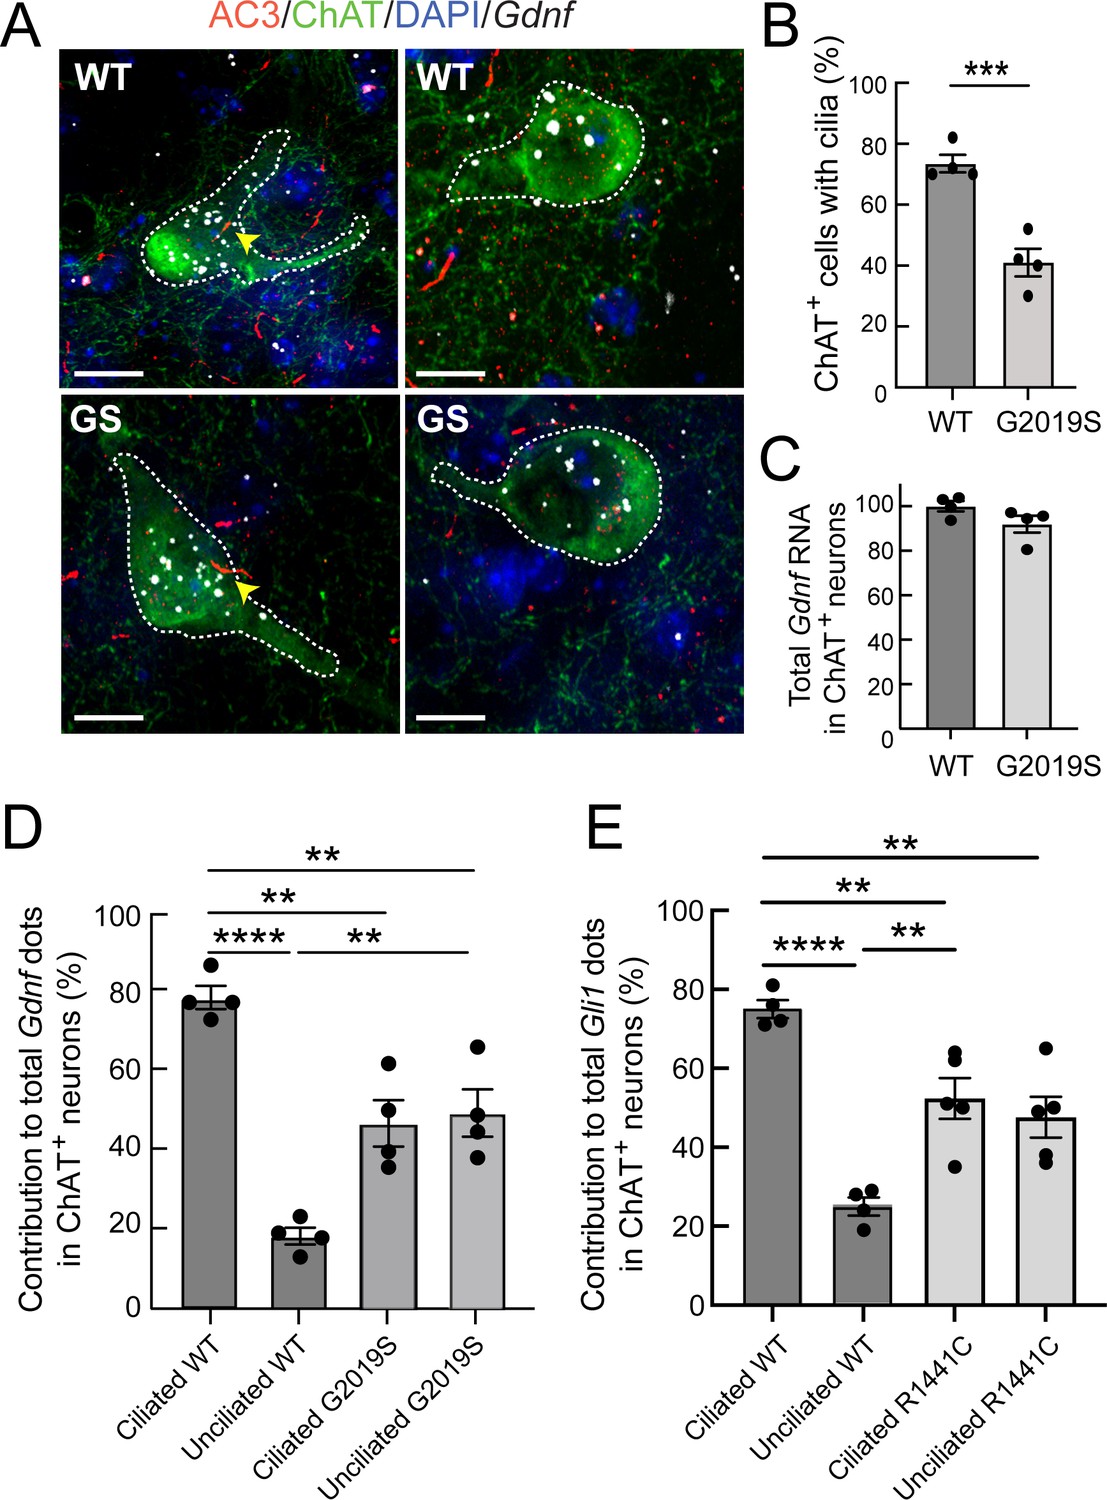
Gdnf expression is cilia dependent and dysregulated in LRRK2 G2019S striatum.
(A) 5.5 month WT or LRRK2 G2019S mouse dorsal striatum was subjected to in situ hybridization using a Gdnf probe (white dots) and immunostained as indicated: ChAT (green, white outline), AC3 (red, yellow arrowheads), DAPI (blue). (B) Percent of cells with cilia. (C). Relative level of total Gdnf RNA in ChAT+ neurons as in A. (D) Relative contribution to total Gdnf dots over cholinergic interneurons as a function of their ciliation status. (E) Relative contribution to total Gli1 dots over cholinergic interneurons as a function of their ciliation status in 10 month WT or R1441C mouse dorsal striatum (as in Figure 7). Values represent the mean ± SEM from 4 WT and 4 G2019S brains each containing ≥33 cells. (B) WT vs G2019S, ***, p = 0.0009. (D) Ciliated WT vs Unciliated WT, ****, p < 0.0001. Ciliated WT vs Ciliated G2019S, **, p = 0.0020. Ciliated WT vs Unciliated G2019S; **, p = 0.0040. Unciliated WT vs Ciliated G2019S; **, p = 0.0040. Unciliated WT vs Unciliated G2019S; **, p = 0.0020. (E) Ciliated WT vs. Unciliated WT, ****, p < 0.0001. Unciliated WT vs Ciliated R1441C, **, p = 0.0029. Unciliated WT vs Unciliated R1441C, **, p = 0080; Ciliated WT vs Ciliated R1441C, **, p = 0.0080. Significance was determined either by student’s t-test or by Ordinary one-way ANOVA using Dunnett’s multiple comparisons test. Scale bars, 10 µm.
Figure 9
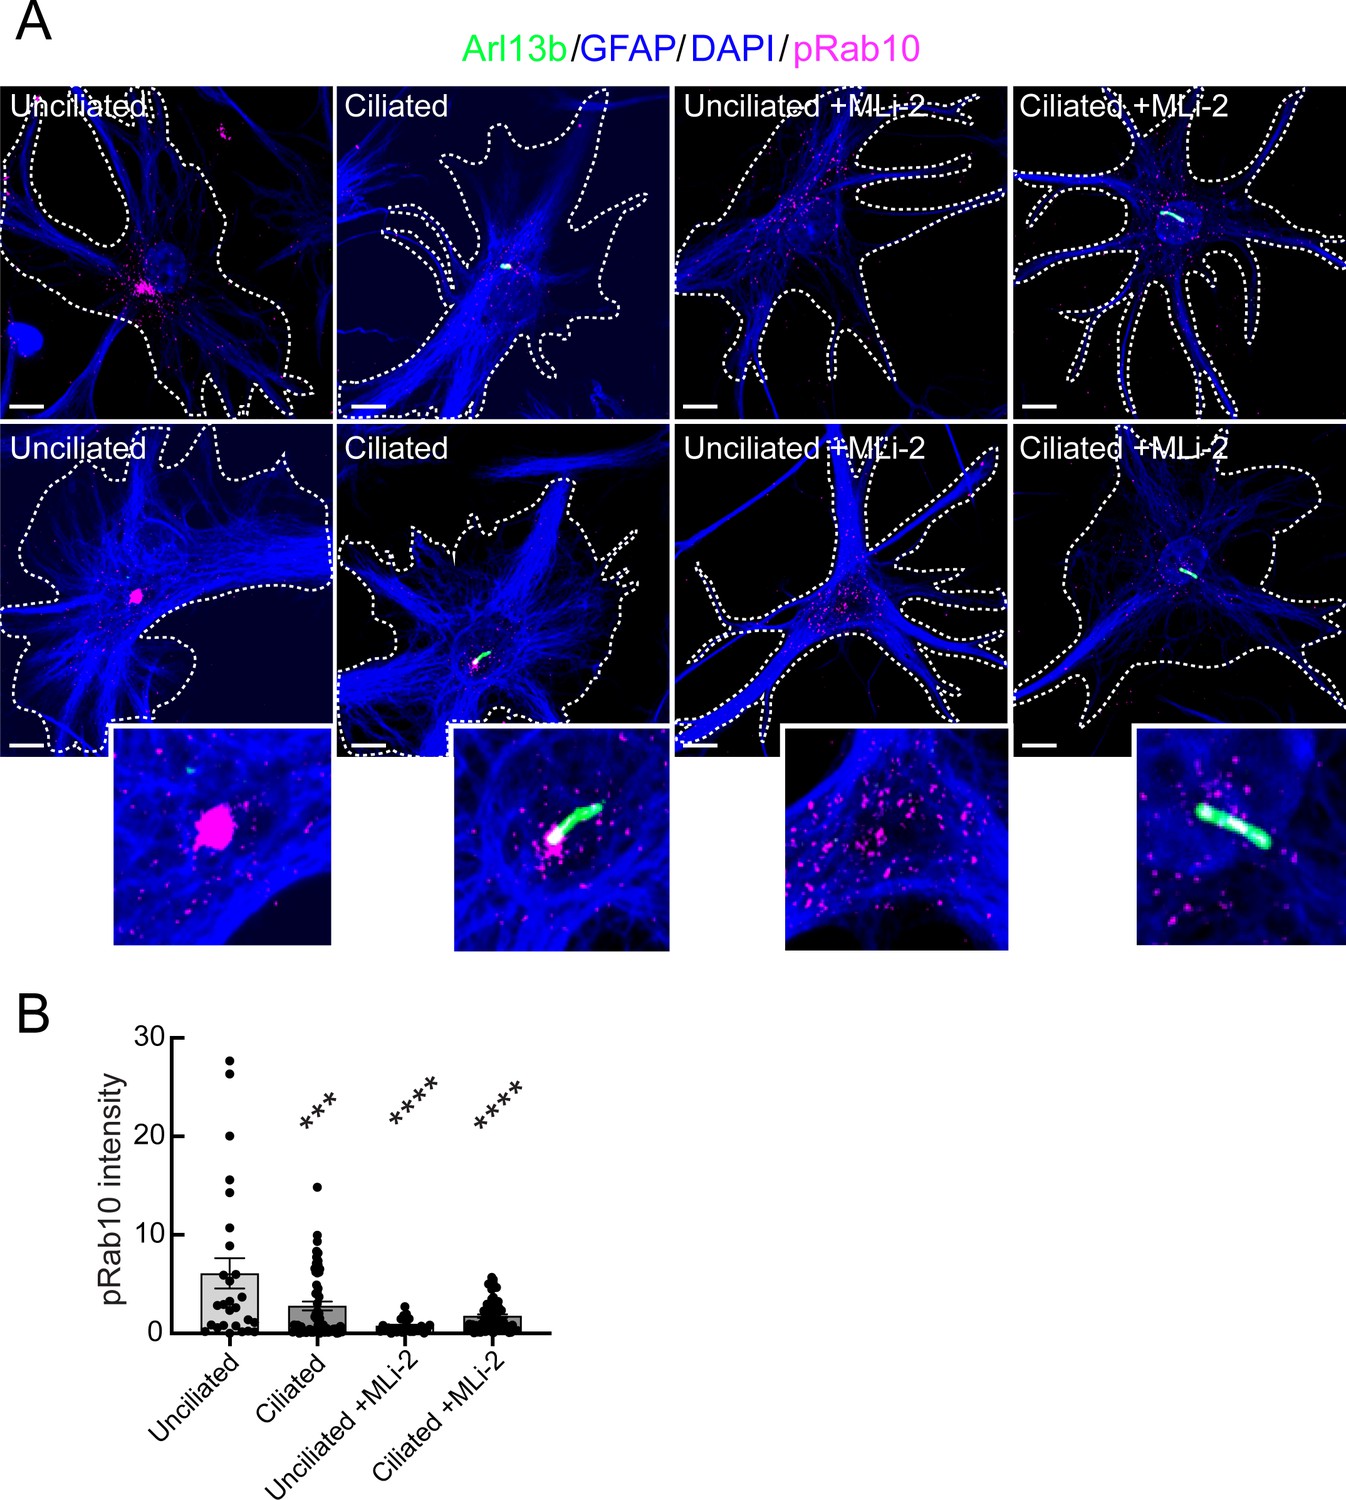
Immuno-panned primary G2019S LRRK2 astrocytes display increased pRab10.
BAC Transgenic G2019S+/- LRRK2 rat astrocytes were dissected from P5 pups and cultured for 1 week ±200 nM MLi-2. (A). Astrocytes were labeled with anti-GFAP and DAPI (blue, white outline); rabbit-anti-phospho-Rab10 (magenta), and anti-Arl13B (green). The central portions of the bottom row images were enlarged and are shown at the lower right. Top row shows additional examples. (B) Quantitation of pRab10 intensity in ciliated or unciliated G2019S+/- astrocytes as in B. Unciliated G2019S+/- vs Ciliated G2019S+/-; ***, p = 0.0009, Unciliated G2019S+/- vs MLi-2 treated Unciliated G2019S+/-; ****, p < 0.0001; Unciliated G2019S+/- vs Ciliated MLi-2 treated; ****, p < 0.0001; ns = not statistically significant. Significance was determined either by student’s t-test or by Ordinary one-way ANOVA using Dunnett’s multiple comparisons test. Scale bars, 10 µm.
Tables
Key resources table
| Reagent type (species) or resource | Designation | Source or reference | Identifiers | Additional information |
|---|---|---|---|---|
| Genetic reagent(Rattus norvegicus) | SA SpragueDawley rat | Taconic | #SD-M | NTac:SD Background |
| Genetic reagent(Rattus norvegicus) | Human LRRK2 G2019S rat | Taconic | #10,681 | NTac:SD Background; BAC Transgene |
| Genetic reagent(Mus musculus) | Tg(LRRK2*G2019S)2AMjf | Jackson Laboratory | #018785 | C57BL/6 Background; BAC Transgene |
| Genetic reagent(Mus musculus) | Constitutive KI Lrrk2tm4.1Arte | Taconic | #13,940 | C57BL/6 Background; G2019S KI |
| Genetic reagent(Mus musculus) | B6.Cg-Lrrk2tm1.1Shn/J | Jackson Laboratory | #009346,RRID:IMSR_JAX:009346 | C57BL/6 Background; R1441C KI |
| Genetic reagent(Mus musculus) | Ppm1h-/- mouse | Taconic | #TF3142 | C57BL/6 Background |
| Antibody | anti-Arl13B(mouse monoclonal) | Neuromab | N295B/66 | (1:1000) |
| Antibody | anti-Adenylate cyclase III(rabbit polyclonal) | Santa Cruz | SC-588 | (1:100) |
| Antibody | anti-Adenylate cyclase III(rabbit polyclonal) | EnCOR | RPCA-ACIII | (1:10000) |
| Antibody | anti-NeuN(mouse monoclonal) | Proteintech | 66836–1-IG | (1:500) |
| Antibody | anti-Choline Acetyltransferase(goat polyclonal) | Millipore | AB144P-1ML | (1:100) |
| Antibody | anti-GFAP(chicken polyclonal) | Novus Biologicals | NBP1-05198 | (1:2000) |
| Antibody | anti-GFAP(chicken polyclonal) | EnCOR | CPCA-GFAP | (1:2000) |
| Antibody | anti-S100B(guinea pig polyclonal) | Synaptic Systems | #287,004 | (1:200) |
| Antibody | anti-phospho-Rab10 (Thr73)(rabbit monoclonal) | Abcam | AB230261 | (1:1000) |
| Antibody | anti-Rab10 (mouse monoclonal) | Nanotools | 0680–100/Rab10-605B11 | (1:1000) |
| Antibody | anti-phospho-Rab12 (Ser105)(rabbit monoclonal) | Abcam | ab256487 | (1:1000) |
| Antibody | anti-Rab12(sheep polyclonal) | MRC PPU Reagents and Services, University of Dundee | SA227 | (1:1000) |
| Antibody | Anti-phospho-LRRK2 (Ser935)(rabbit monoclonal) | MRC PPU Reagents and Services, University of Dundee | UDD2 | (1:1000) |
| Antibody | Anti-LRRK2(mouse monoclonal) | Antibodies Inc./NeuroMab | 75–253 | (1:1000) |
| Antibody | anti-PPM1H(sheep polyclonal) | MRC PPU Reagents and Services, University of Dundee | DA018 | (1:1000) |
| Chemical compound, drug | MLi-2 | MRC PPU Reagents and Services, University of Dundee | ||
| Commercial assay or kit | RNAscopeMultiplexFluorescentReagent Kit v2 | Advanced Cell Diagnostics | #323,100 | |
| Commercial assay or kit | RNAscope 3-plexNegative ControlProbe | Advanced Cell Diagnostics | #320,871 | |
| Commercial assay or kit | RNAscope Probe- Mm-Gli1 | Advanced Cell Diagnostics | #311,001 | |
| Commercial assay or kit | RNAscope Probe- Mm-GDNF | Advanced Cell Diagnostics | #421,951 | 1:10 |
| Commercial assay or kit | OPAL 690 REAGENT PACK | Akoya Biosciences | FP1497001KT | (1:750) |
| Other | Research Diets, Inc. | D01060501 | Untreated diet | |
| Other | Research Diets, Inc. | D01060501 added with 360 mg MLi-2 per kg | Modified diet | |
| Software, Algorithm | FIJI | PMID:29187165 | RRID:SCR_002285 | |
| Software, Algorithm | CellProfiler | PMID:29969450 | RRID:SCR_007358 |
Additional files
Download links
A two-part list of links to download the article, or parts of the article, in various formats.
Downloads (link to download the article as PDF)
Open citations (links to open the citations from this article in various online reference manager services)
Cite this article (links to download the citations from this article in formats compatible with various reference manager tools)
Pathogenic LRRK2 control of primary cilia and Hedgehog signaling in neurons and astrocytes of mouse brain
eLife 10:e67900.
https://doi.org/10.7554/eLife.67900


