Enhanced excitability of cortical neurons in low-divalent solutions is primarily mediated by altered voltage-dependence of voltage-gated sodium channels
- Section of Pulmonary & Critical Care Medicine, VA Portland Health Care System, United States
- Department of Medicine, Division of Pulmonary & Critical Care Medicine, Oregon Health & Science University, United States
- Endocrine Research Unit, Veterans Affairs Medical Center and University of California, San Francisco, United States
Figures
Figure 1 with 2 supplements
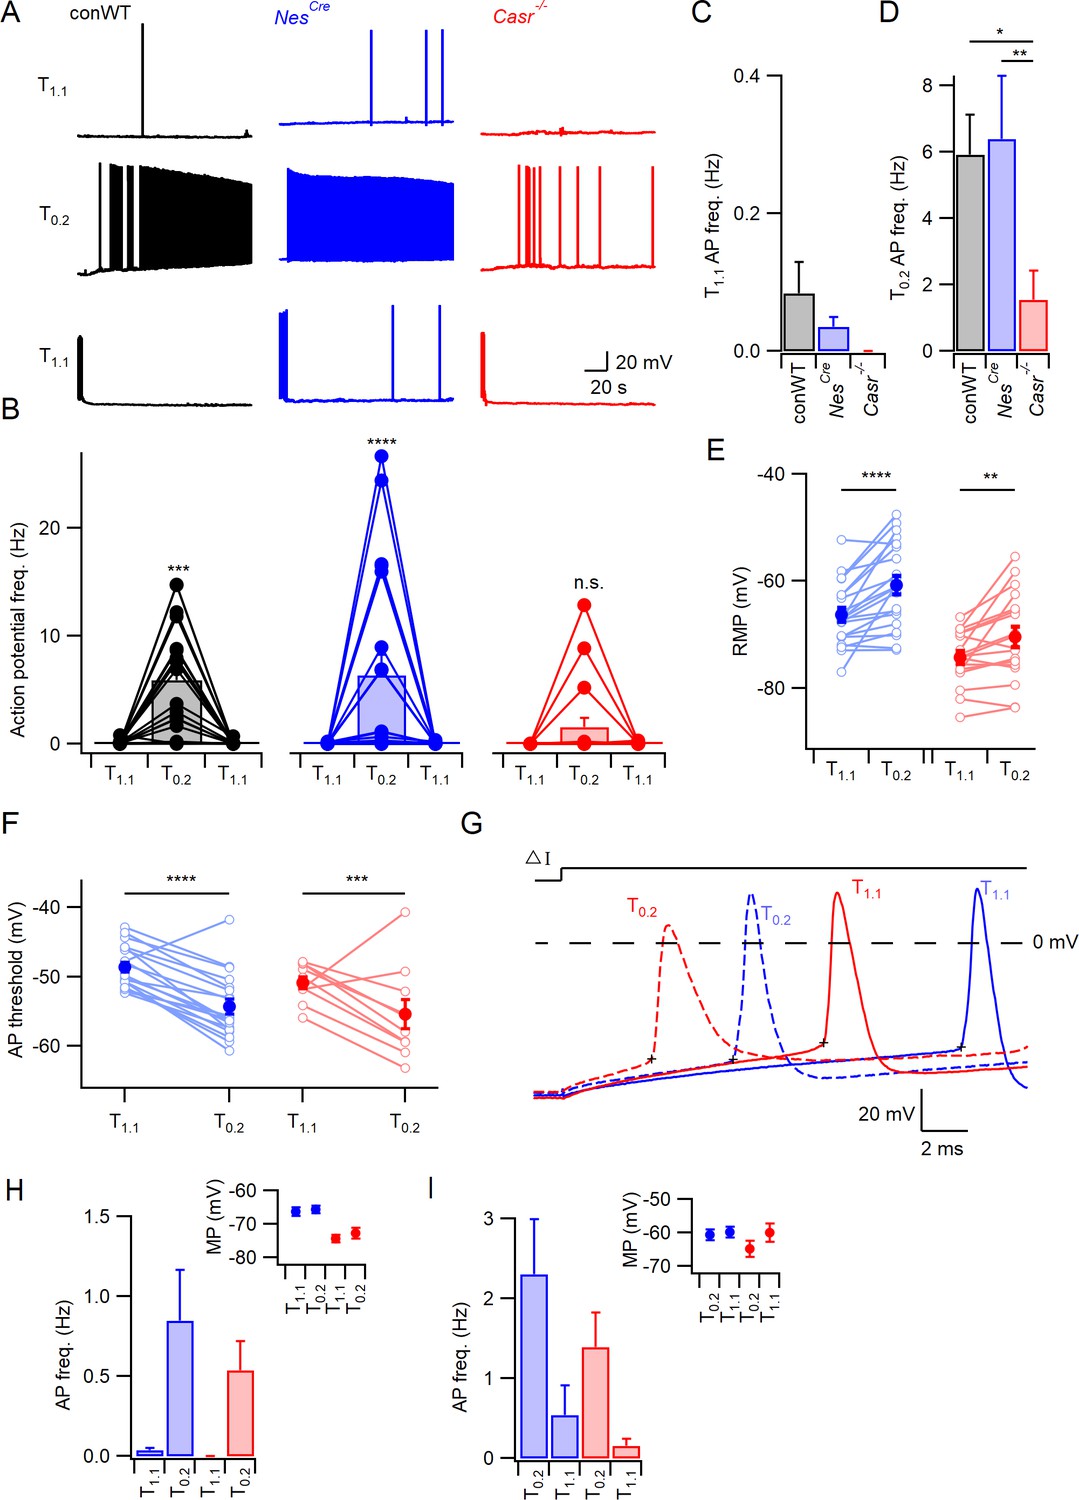
CaSR deletion reduces divalent-dependent excitability.
(A) Spontaneous voltage traces at RMP following the application of solutions with different divalent concentrations (T1.1 (upper traces), T0.2 (middle), and T1.1 recovery (lower)) recorded in three individual neurons with or without CaSR (conWT (black), NesCre (blue) and Casr-/- (red)). Each trace depicts 150 s of continuous acquisition. (B) Histograms of average action potential (AP) frequency (Hz) recorded using the same solutions: T1.1, T0.2, and T1.1 recovery. Individual recordings represented by open circles linked with lines and average is represented with a bar. From left to right graphs depict conWT (n = 18), NesCre (n = 21), and Casr-/- (n = 18). ANOVA: Post-hoc tests (Sidak compensated for multiple comparisons here and in all later figures) showed that action potential frequency increased in conWT (p=0.0009) and NesCre (P, 0.0001), but not Casr-/- (p=0.6697) neurons when changing from T1.1 to T0.2 (Figure 1—source data 1). (C) Baseline average action potential frequency in T1.1. was unaffected by genotype (p>0.999). (D) Average action potential frequency with T0.2 application was the same in conWT and NesCre (p=0.9831) and higher than in Casr-/- neurons (p=0.013 and 0.0033, respectively). (E) Plot of effect of external divalent concentration and CaSR on RMP. Two-way RM ANOVA indicates that increasing [Ca2+]o (F (1, 37)=31.65, p<0.0001) and CaSR deletion (F (1, 37)=19.1, p<0.0001) hyperpolarized the RMP without an interaction (F (1, 37)=1.035, p=0.3155). Post-hoc testing indicated RMP was depolarized with the switch to T0.2 in both NesCre and Casr-/-neurons (p<0.0001 and p=0.0066 for 21 and 18 recordings respectively; Figure 1—source data 1). (F) Plot of average action potential threshold in T1.1 and T0.2 in NesCre and Casr-/- neurons elicited as per panel G. Two-way RM ANOVA indicates that reducing [Ca2+]o hyperpolarized the action potential threshold (F (1, 27)=56.48, p<0.0001) but that genotype had no effect (F (1, 27)=2.284, p=0.1424). [Ca2+]o was highly effective in both NesCre and Casr-/-neurons (p<0.0001 and p=0.0003 for 19 and 10 recordings, respectively). Individual neuron values are represented by open circles linked by lines and averages by filled circles. (G) Exemplar action potentials elicited by current injection in a NesCre (blue) and a Casr-/- neuon (red) in T1.1 (unbroken) and T0.2 (broken). Action potential threshold is indicated by +for the first action potential elicited by current injection (50–200 pA) under the same conditions as panel E. (H) Histogram summarizing effects of divalents on action potential frequency in NesCre and Casr-/- neurons after a current injection to counter divalent-dependent depolarization following T0.2 application. Two-way RM ANOVA indicates that reducing [Ca2+]o increases the action potential frequency (F (1, 35)=11.54, p=0.0017) and that this is significant in the NesCre but not Casr-/-neurons (p=0.0075 and 0.1555 for 21 and 16 recordings, respectively). Inset shows average membrane potential after the current injection. (I) Histogram summarizing effects of divalents on action potential frequency in NesCre and Casr-/- neurons after current injection in T1.1 to depolarize membrane potential to value recorded in T0.2. Two-way RM ANOVA indicates that reducing [Ca2+]o increases the action potential frequency (F (1, 35)=45.09, p=0.0004) and that this is significant in the NesCre but not Casr-/-neurons (p=0.0044 and 0.056 for 21 and 16 recordings, respectively). Inset shows average membrane potential after the current injection.
-
Figure 1—source data 1
Action potential frequency and resting membrane potential in conventional WT, NesCre and Casr-/- neurons in T1.1 or T0.2 with no current injection.
RMP units are mV and each sub-column represents measurements from a single neuron.
- https://cdn.elifesciences.org/articles/67914/elife-67914-fig1-data1-v2.xlsx
Figure 1—figure supplement 1
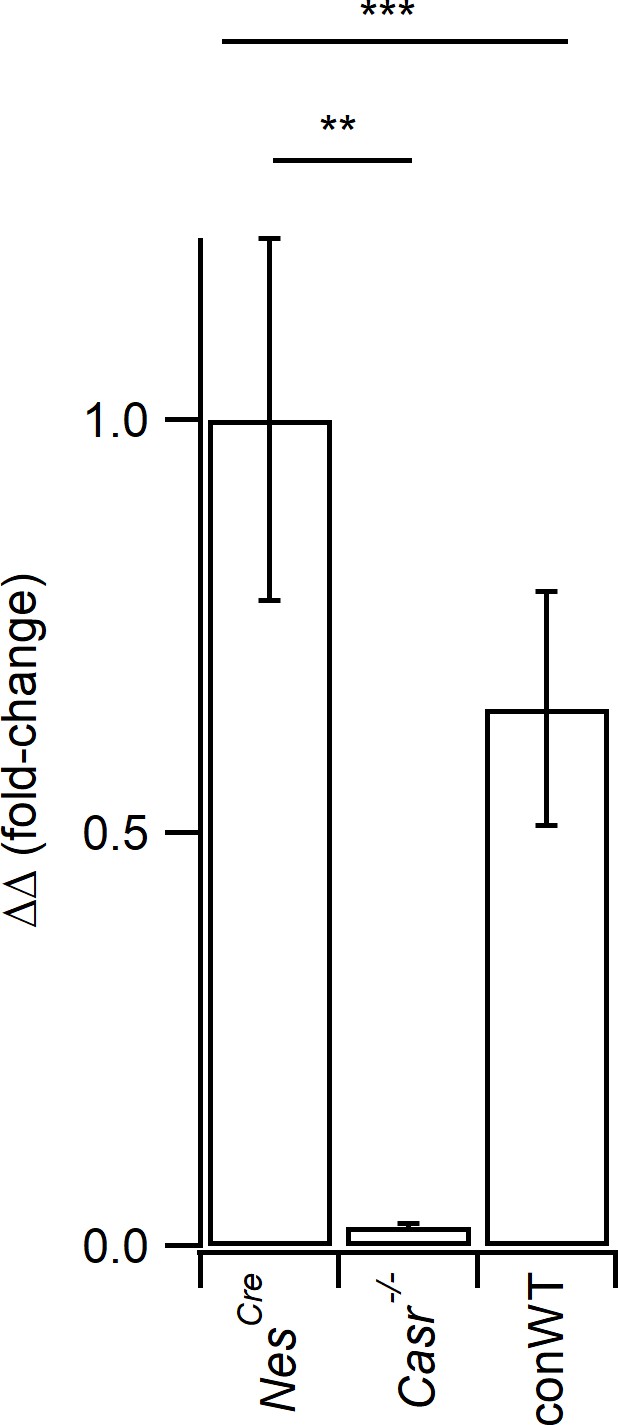
Casr expression levels reduced in Casr-/- neurons.
Casr expression levels shown as delta delta with actin used as normalizing gene. Average values of 1.0, 0.02, and 0.65 for NesCre, Casr-/-, and conWT respectively with each genotype reflecting the average data from six cultures each represented by triplicate samples. The Kruskal-Wallis test indicates differences between genotypes (p=0.0002) with Dunn’s multiple comparison showing Casr expression levels are lower in Casr-/- (p=0.0016), but not conWT (p=0.7739), than in NesCre neocortical cultures.
Figure 1—figure supplement 2

CaSR deletion reduces divalent-dependent excitability following the generation of action potentials elicited by current injections.
(A) The neurons were held at RMP in T1.1 (zero basal current injection) or at the same potential in T0.2 (hyperpolarizing current injection as described in Figure 1H). The current injection is shown in the upper row. The broken horizontal line denotes 0 mV. Reduced divalent concentrations T0.2 increased action potentials in NesCre and Casr-/- neurons. (B) Action potentials were plotted versus the current injection for NesCre neurons (n = 19). (C) Action potentials were plotted versus the current injection for Casr-/- neurons (n = 11).
Figure 2
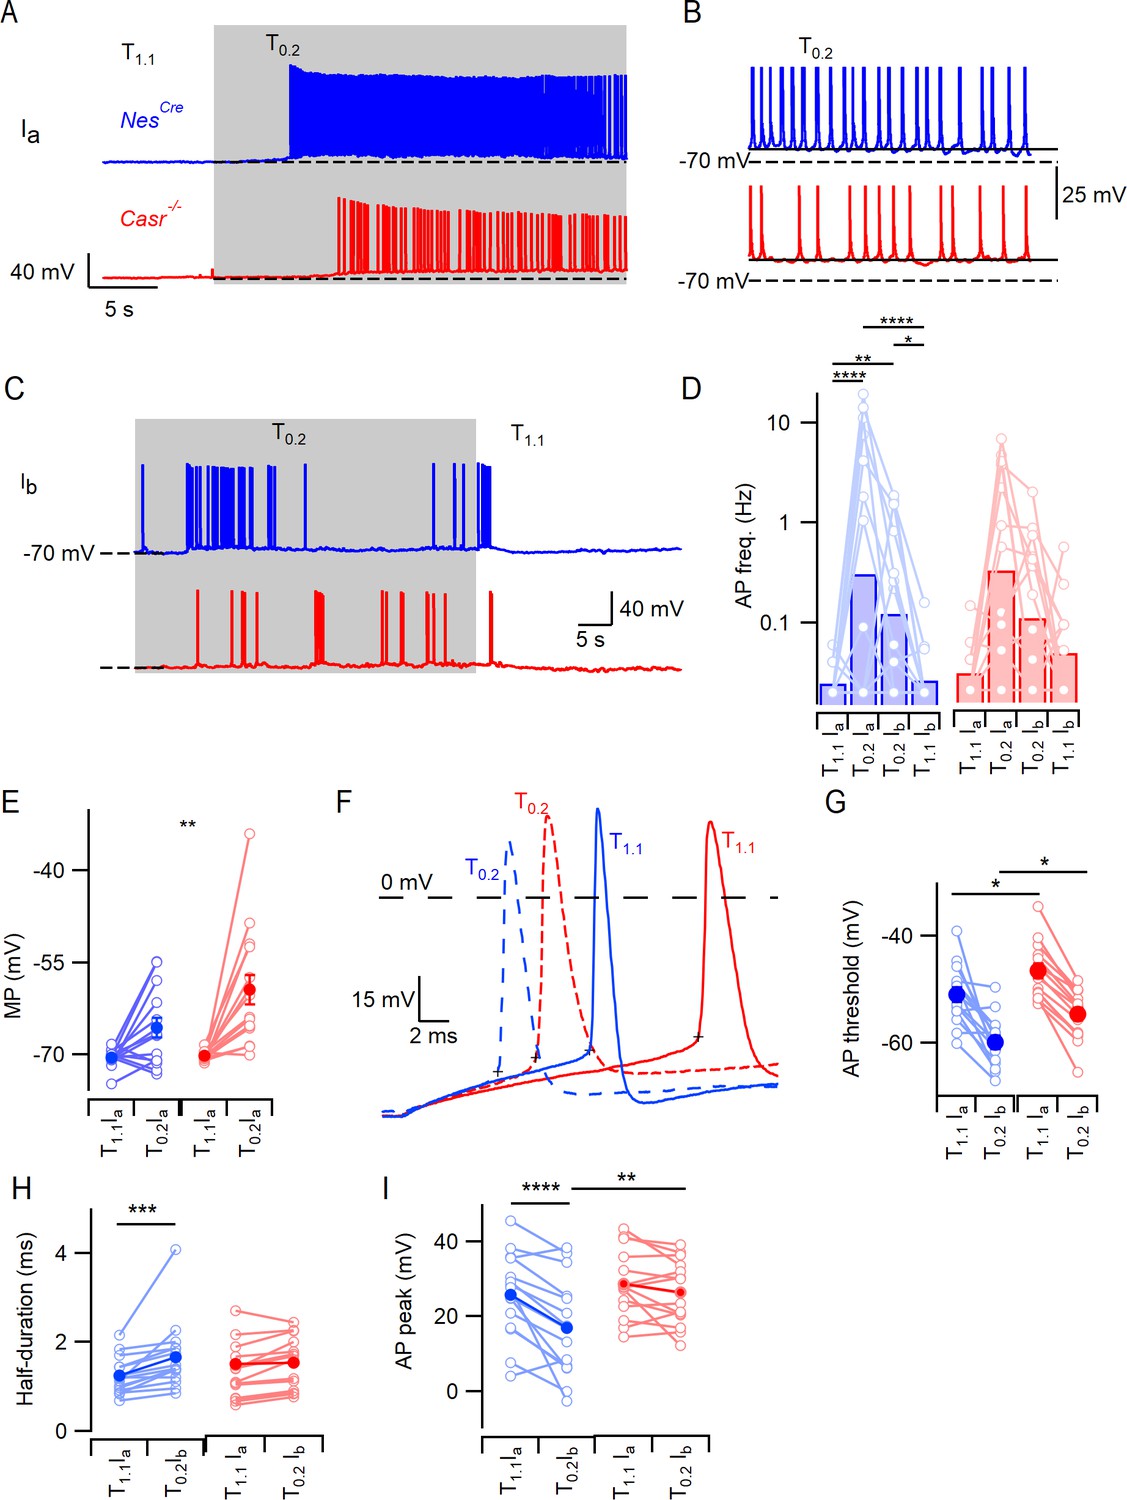
CaSR deletion does not affect divalent-dependent excitability at equivalent membrane potential.
(A) Exemplary traces showing the divalent-dependent increase in neuronal excitability following the switch from T1.1 to T0.2 (change indicated by upper trace) in NesCre (blue) and Casr-/- (red) neurons when initial membrane potentials matched at −70 mV (broken line). (B) Expanded view of the final 5 s of traces in A illustrating sustained depolarization from following T0.2 application. (C) Exemplary traces showing the divalent-dependent decrease in neuronal excitability following the switch from T0.2 to T1.1 (change indicated by upper trace) in NesCre (blue) and Casr-/- (red) neurons when initial membrane potentials matched at −70 mV. Same recordings as A. (D) Histogram of average divalent-dependent changes in action potential frequency (Hz) in NesCre (blue) and Casr-/- (red) neurons when initial voltage is −70 mV in T1.1 (Ia) or T0.2 (Ib). Two-way RM ANOVA performed after logarithmic transformation indicates that reducing [Ca2+]o increases the action potential frequency (F (3, 87)=17.97, p<0.0001) similarly in NesCre and Casr-/- neurons (F (1, 29)=0.2005, p=0.6577; Figure 2—source data 1). Post-hoc tests indicate significant differences between action potential frequency in T1.1 and T0.2 regardless of the holding current but not between action potential frequency recorded at different holding currents and the same solutions (Ia or Ib; Table 7). (E) Membrane potential depolarization following the switch to T0.2 from T1.1. Two-way RM ANOVA indicates that reducing [Ca2+]o (F (1, 29)=29.22, p<0.0001) and CaSR deletion (F (1, 29)=4.874, p=0.0353) significantly depolarized the membrane potential but that there was no interaction (F (1, 29)=4.055, p=0.0534). Post-hoc testing indicate that membrane potentials were matched using current injection in T1.1 (-70.5 ± 0.4 mV and −70.2 ± 0.2 mV for NesCre and Casr-/- neurons respectively, p=0.985) but different in T0.2 (-65.6 ± 1.6 mV and –59.4 ± 2.4 mV, p=0.0083). (F) Exemplar action potentials elicited by current injection from −70 mV in a NesCre (blue) and a Casr-/- neuron (red) in solutions T1.1 (unbroken) and T0.2 (broken). Action potential threshold is indicated by +symbol for the first action potential elicited by current injection (50 to 200 pA). (G) Plot of average action potential threshold in T1.1 and T0.2 in NesCre and Casr-/- neurons, elicited as per panel F here and in subsequent panels. Two-way RM ANOVA indicates that reducing [Ca2+]o hyperpolarized the action potential threshold (F (1, 25)=51.66, p<0.0001), whereas CaSR deletion had the opposite effect (F (1, 25)=10.52, p=0.0033). There was no interaction (Table 9A). Post-hoc tests indicate that the action potential thresholds in solutions T1.1 and T0.2 were depolarized similarly by CaSR deletion (5.3 ± 2.0 mV and 5.5 ± 2.0 mV, p=0.020 and 0.017) in NesCre and Casr-/- neurons, respectively. (H) Plot of average action potential half-duration in T1.1 and T0.2 in NesCre and Casr-/- neurons. Two-way RM ANOVA indicates that reducing [Ca2+]o prolonged the action potential half-duration (F (1, 28)=19.73, p=0.0001). (I) Plot of average action potential peak in T1.1 and T0.2 in NesCre and Casr-/- neurons. The action potential peaks were higher in T1.1 and in Casr-/- neurons (Table 9C).
-
Figure 2—source data 1
Action potential frequency in NesCre and Casr-/- neurons in T1.1 or T0.2 with standing currents Ia and Ib.
The action potential frequency is in log base 10 and each sub-column represents measurements from a single neuron.
- https://cdn.elifesciences.org/articles/67914/elife-67914-fig2-data1-v2.xlsx
Figure 3
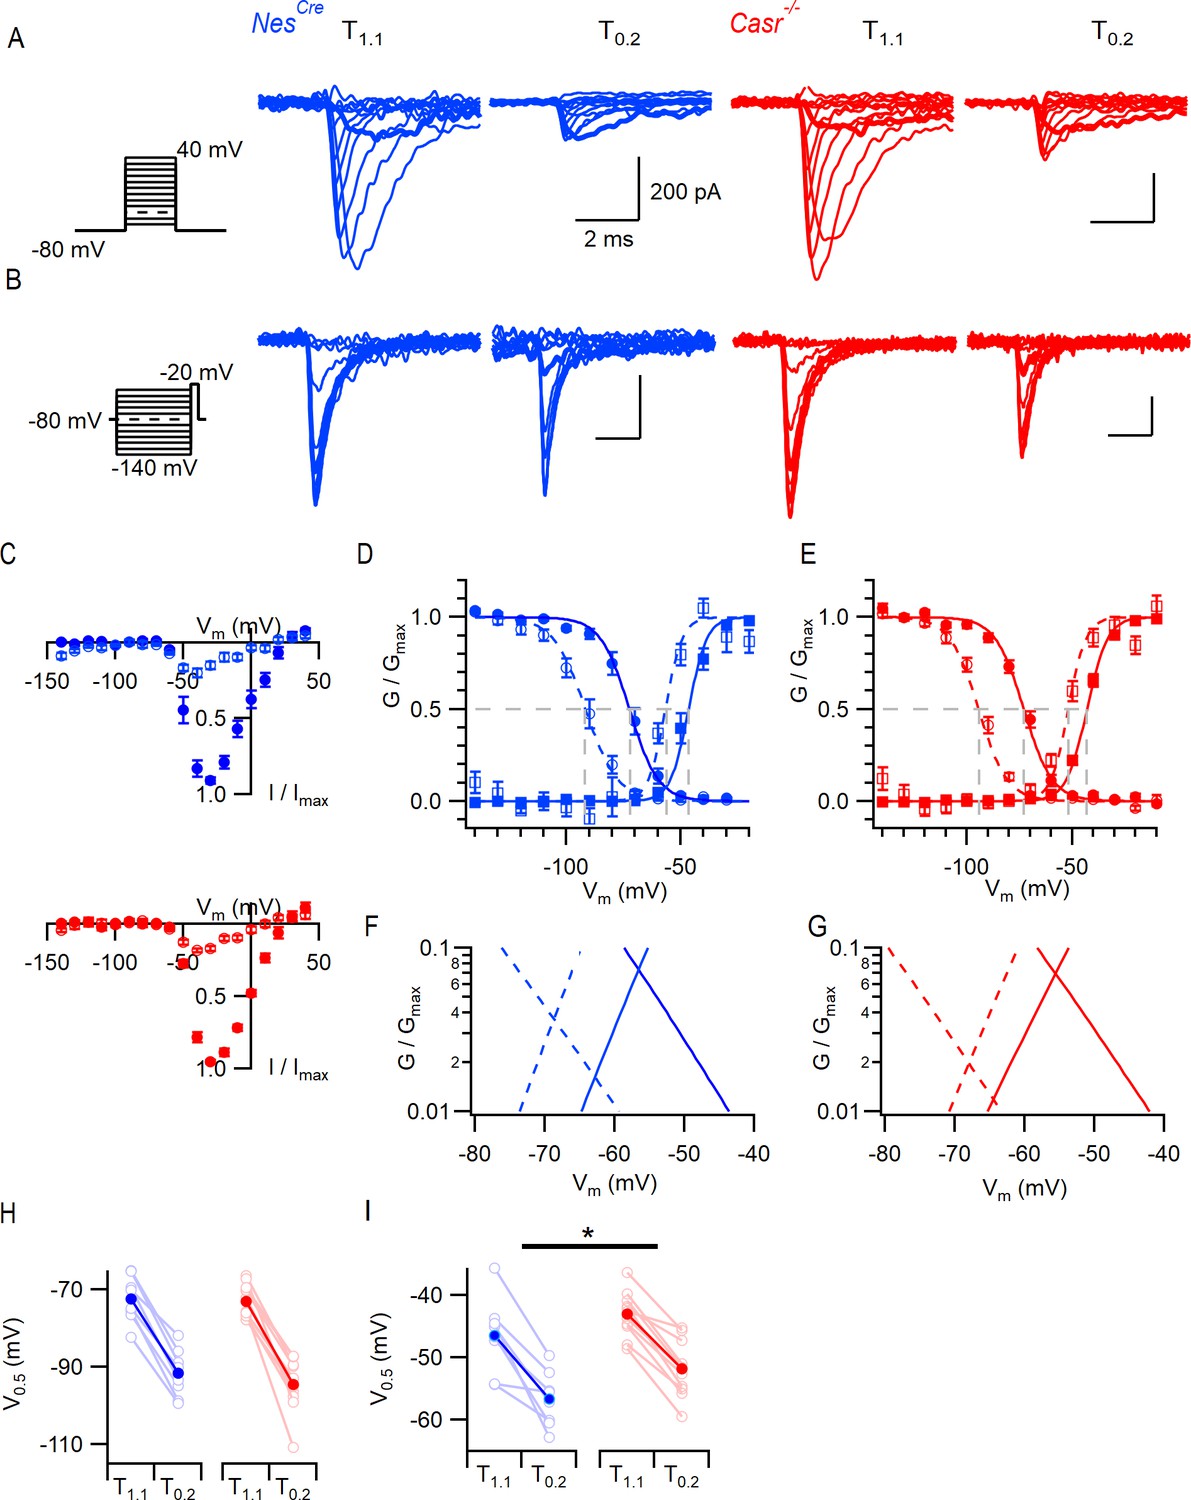
CaSR deletion and external divalent concentration affect VGSC current gating.
(A) Exemplary traces showing VGSC currents activated by voltage steps from −80 in 10 mV increments (left), in nucleated patches isolated from NesCre (blue) and Casr-/- (red) neurons in solutions T1.1 and T0.2. The VGSC currents elicited by 10 ms depolarizations to −50 mV (bold) were greater following the switch to T0.2. (B) Exemplary traces showing VGSC currents activated by voltage steps to −20 mV following a 100 ms conditioning step (left), in the same patches as (A) using solutions T1.1 and T0.2. The VGSC currents elicited following conditioning steps to −80 mV (bold) were smaller following the switch to T0.2. (C) Current-voltage plots of average normalized VGSC currents in nucleated patches from NesCre (n = 8) and Casr-/- (n = 11) neurons in T1.1 (filled circles) and T0.2 (open circles). Currents were normalized using the maximum VGSC current in each recording. (D) Plot of average normalized conductance versus voltage in patches from NesCre neurons for activation (square, n = 8) and inactivation (circle, n = 8) in solutions T1.1 (filled) and T0.2 (open). Boltzmannn curves are drawn using average values from individual fits and gray broken lines indicate V0.5 values for each condition. (E) Plot of average normalized conductance versus voltage in patches from Casr-/- neurons for activation (square, n = 11) and inactivation (circle, n = 12) in solutions T1.1 (filled) and T0.2 (open). Boltzmannn curves are drawn using average values from individual fits and gray broken lines indicate V0.5 values for each condition. Inset shows plot expanded to emphasize voltage dependence of the window currents. (F and G) represent the plots of D and E expanded to emphasize the voltage dependence of the window currents. (H) Histogram showing V0.5 for VGSC inactivation in T1.1 and T0.2 in patches from NesCre and Casr-/- neurons. (I) Histogram showing V0.5 for VGSC activation in T1.1 and T0.2 in patches from NesCre and Casr-/- neurons.
Figure 4
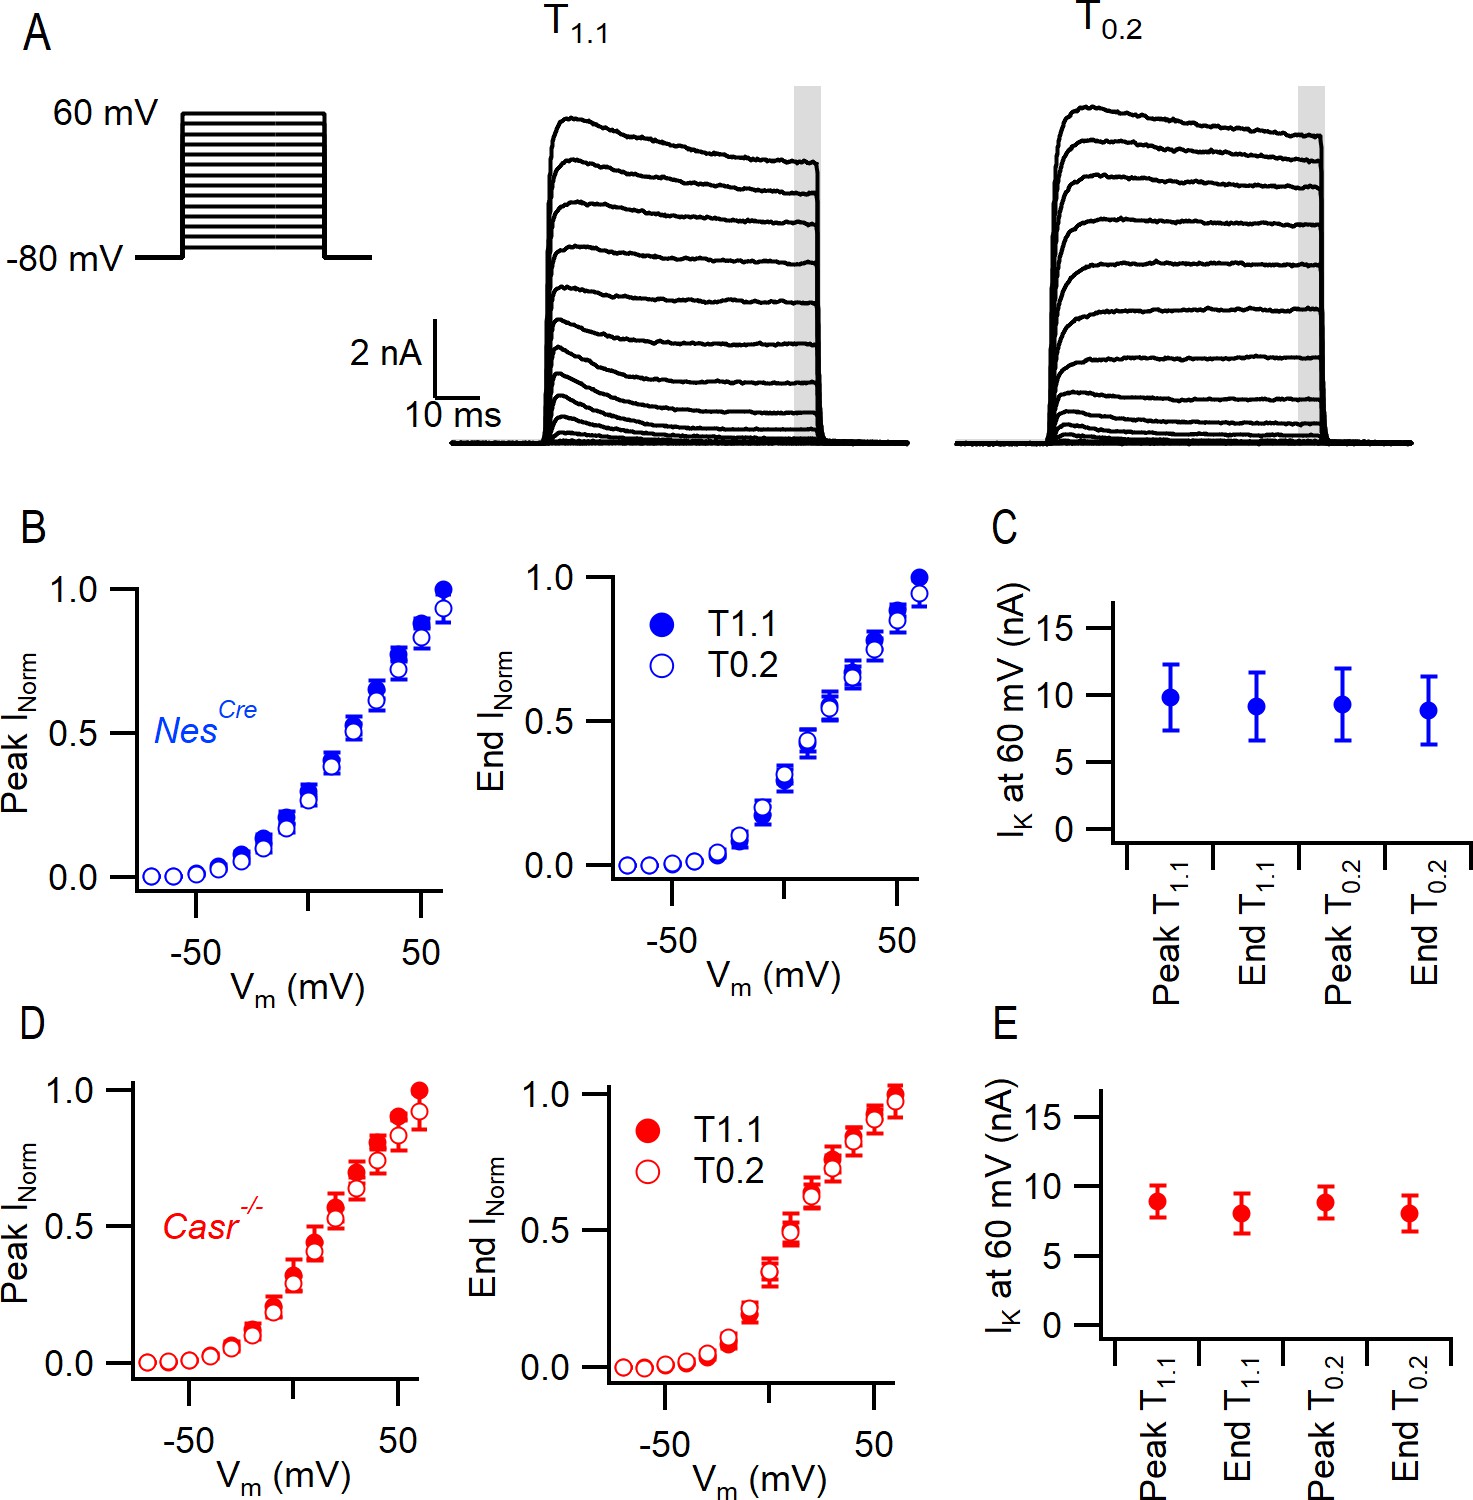
CaSR deletion and external divalent concentration do not significantly affect VGPC current gating.
(A) Exemplary traces showing VGPC currents activated by voltage steps from −80 in 10 mV increments (left), in a NesCre neuron in solutions T1.1 and T0.2. The outward currents elicited by the 50 ms voltage step were measured at peak and at the end of the step (average of last 5 ms indicated by gray bar). (B) Current voltage-plot of average normalized VGPC currents (n = 10) in NesCre neurons in T1.1 (filled circles) and T0.2 (open circles) at peak or end of step. Currents were normalized using the maximum outward current in each condition here and below. (C) Peak and end outward currents at 60 mV elicited in same neurons as B. Two-way RM ANOVA indicates that peak and outward currents were not different in T1.1 or T0.2 ((3, 57)=1.347), p=0.2683 nor were they affected by CaSR deletion (data from E, (1, 19)=1.231, p=0.2811). (D) Current voltage-plot of average normalized VGPC currents (n = 11) in Casr-/- neurons in T1.1 (filled circles) and T0.2 (open circles) at peak or end of step. (E) Peak and end outward currents at 60 mV elicited in same neurons as D.
Figure 5 with 1 supplement

VGSC current activation by decreased external divalent concentration.
(A,B) Plots illustrating the responses of the basal currents in two WT neurons during application of T1.1 and T0.2 before and during TTX or TTX and Gd3+. Average basal currents were measured over 50 ms every 2 s with T1.1 and T0.2 application indicated by vertical shading (gray represents T0.2) and blockers application by horizontal bars and broken vertical lines. (C) Plot of average basal current measurements (filled circles) and individual neurons (open circles) in each solution condition in conWT (n = 13) neurons. Each basal current represents the average value recorded during last 20 s of the specific solution application. (D) Average [Ca2+]o dependent basal currents sensitive to TTX and Gd3+ calculated by subtraction of data in C and the remaining [Ca2+]o dependent current after application of both blockers for conWT neurons. (E) Exemplar traces of currents elicited by 50 ms voltage steps between −100 and −50 mV during application of solutions described in C. (F) Plots of the average currents over the last 5 ms of each voltage step in all six solutions for conWT (n = 13). (G) Plots of the average [Ca2+]o dependent currents derived by subtraction of conWT data (F) resolved as total or control (broken blue), in the presence of TTX (broken red), and in the presence of TTX and Gd3+ (remainder green). The TTX-sensitive (solid red), Gd3+-sensitive (solid blue) and NALCN (dotted line) component currents were obtained by further subtraction. Inset shows expanded view at intercept of TTX-sensitive and NALCN components. (H) Exemplars of the TTX- and Gd3+-sensitive [Ca2+]o-dependent currents. Broken red line represents zero current line.
Figure 5—figure supplement 1
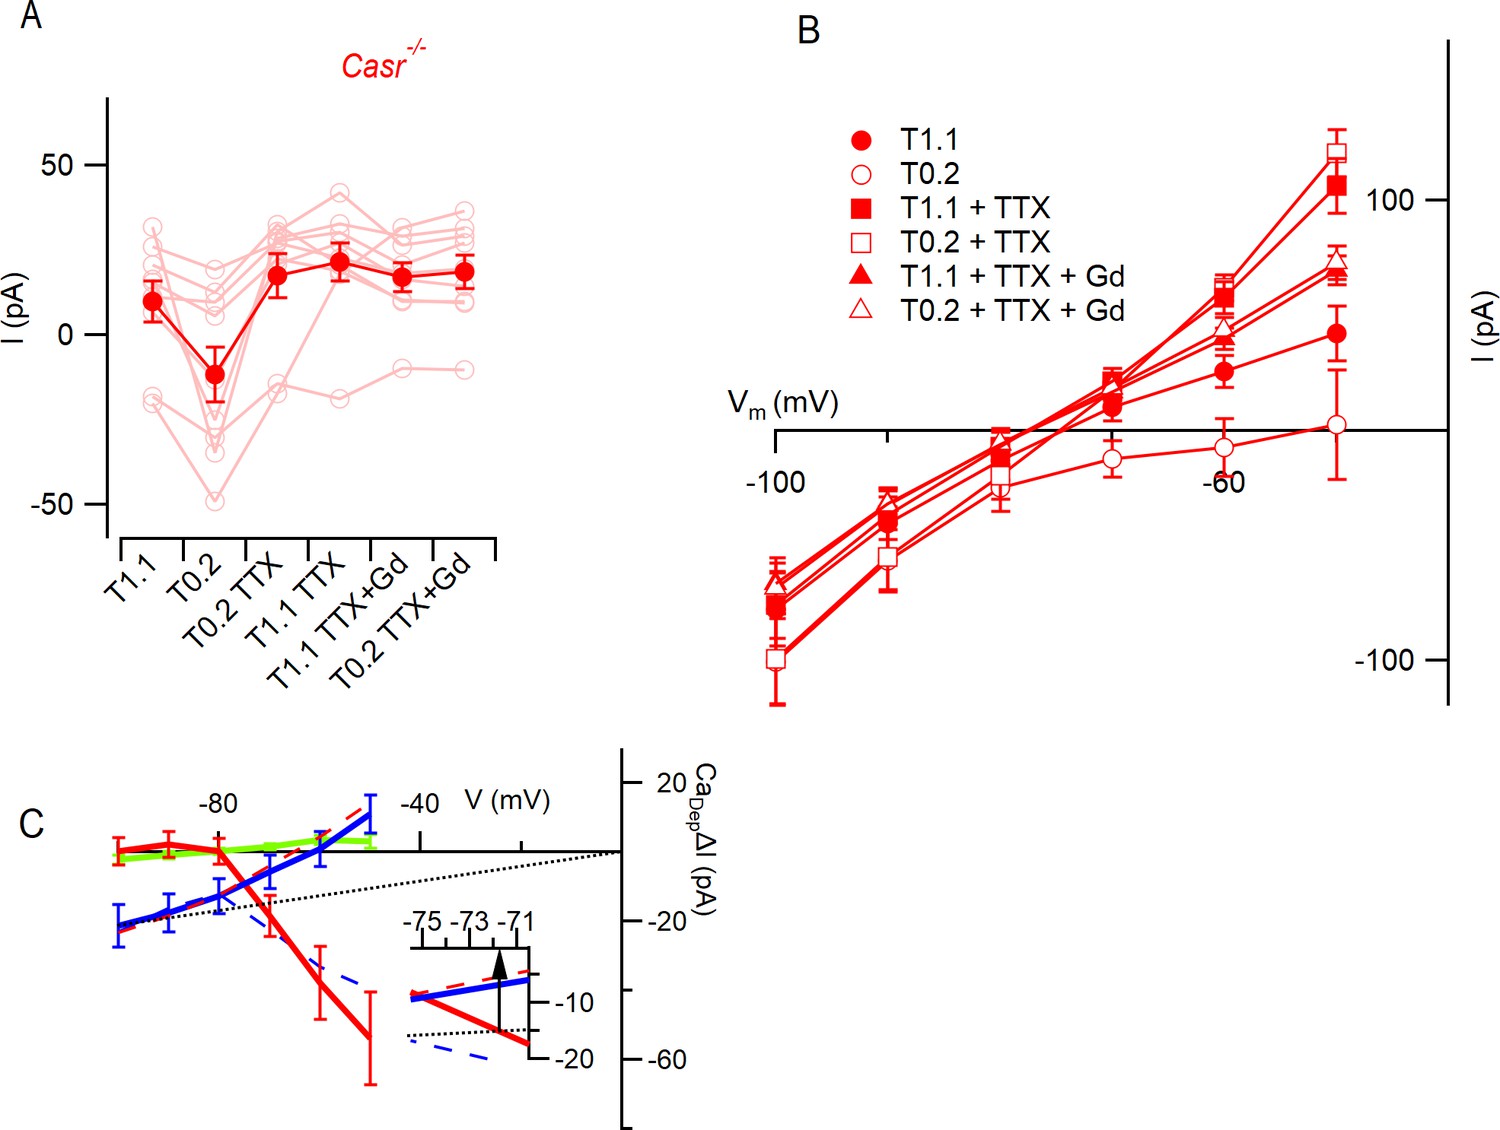
VGSC current activation by decreased external divalent concentrationin Casr-/- neurons.
(A) Plot of average basal current measurements (filled circles) and individual neurons (open circles) in each solution condition in Casr-/- (n = 9) neurons. Each basal current represents the average value recorded during last 20 s of the specific solution application. (B) Plots of average currents versus voltage for Casr-/- (n = 9) neurons as per Figure 5F (C) Plots of the average [Ca2+]o-dependent currents derived by subtraction of Casr-/- data as per Figure 5G.
Figure 6
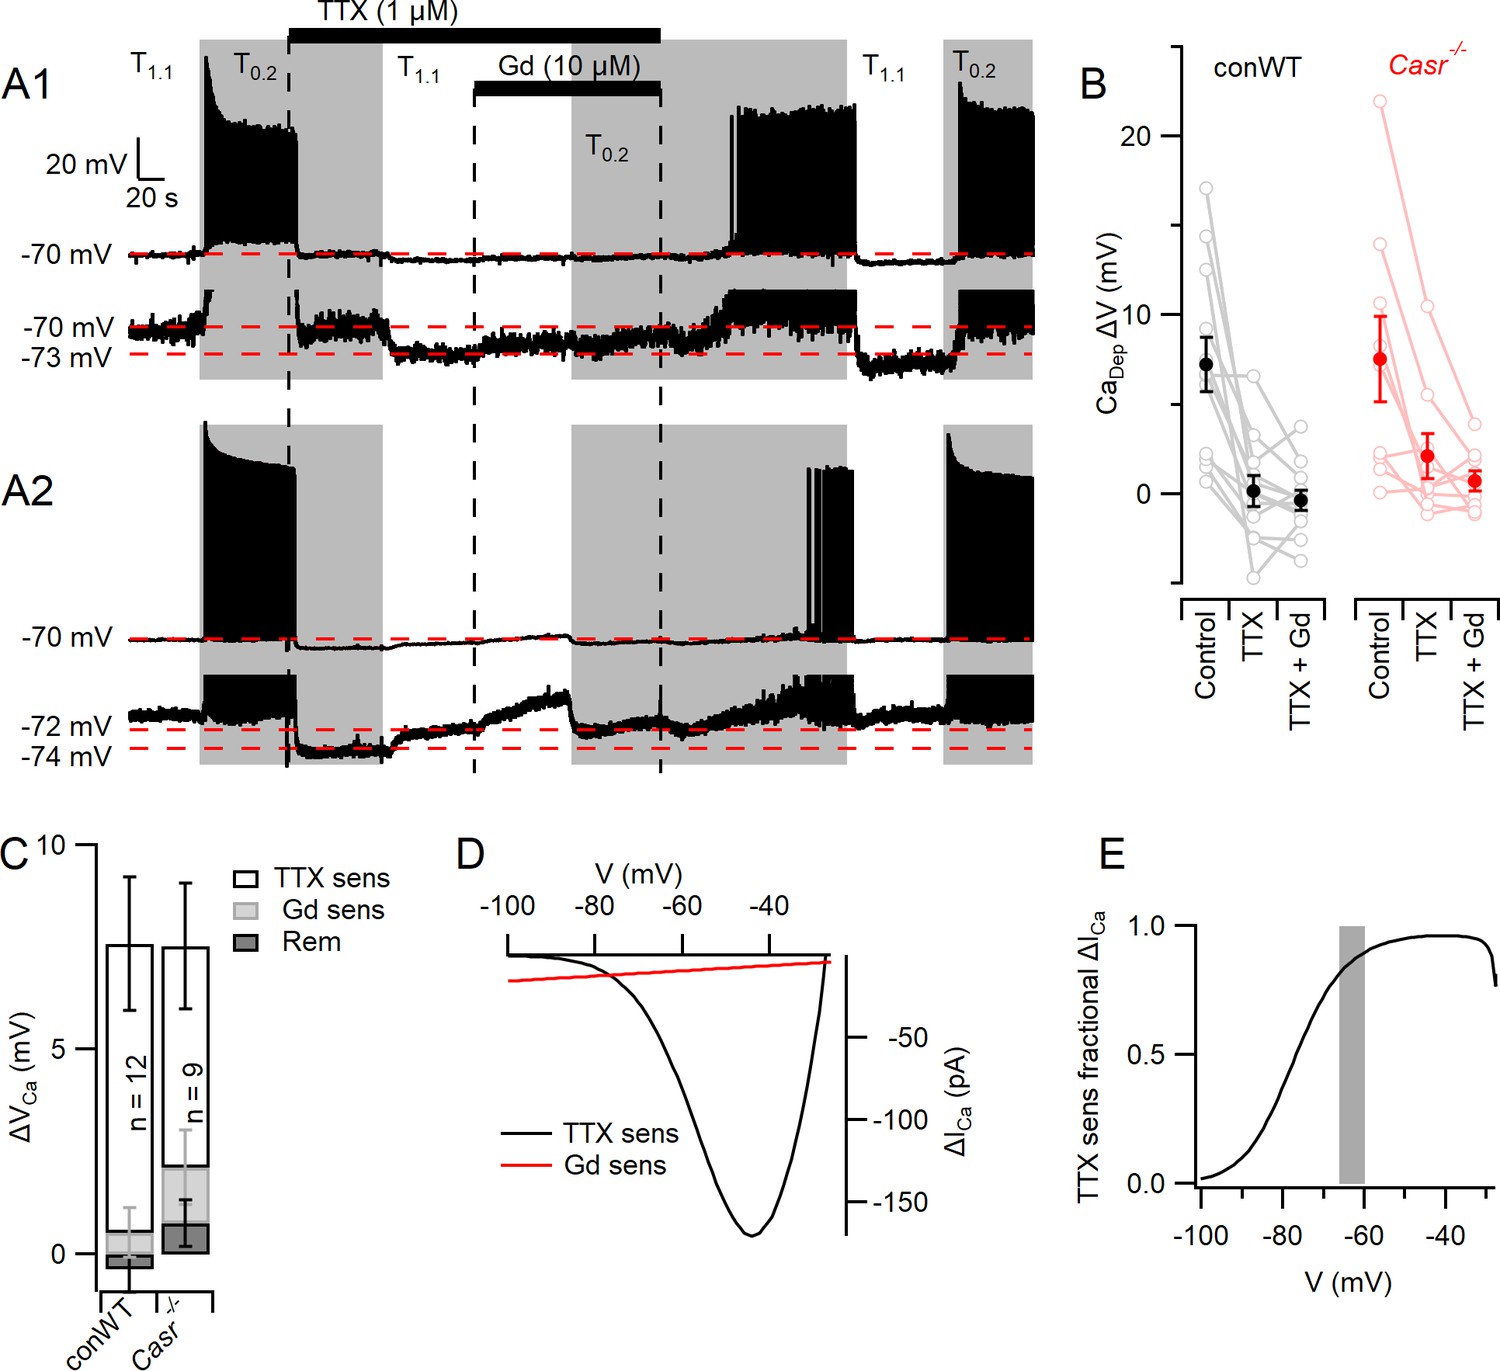
Divalent-dependent depolarization is almost entirely mediated via VGSCs.
(A) The response of the membrane potential in two WT neurons during application of T1.1 and T0.2 before and during TTX or TTX and Gd3+. T1.1 and T0.2 application is indicated by vertical shading (gray represents T0.2) and blocker applications by horizontal bars and broken vertical lines. The broken red line indicates −70 mV. Voltage-expanded view of the trace illustrates that in the presence of TTX, hyperpolarization (A1) and depolarization (A2) may occur following the switch to T1.1. Membrane potential values highlighted by broken red lines. (B) Plot of average (filled circles) and individual (open circles) Ca2+-dependent voltage changes (filled circles) following the switch from T1.1 to T0.2 (by subtraction of average between-spike membrane potential over the last 10 s of each solution application). Each solution applied to conWT (n = 12) and Casr-/- (n = 9) neurons. (C) Average [Ca2+]o dependent voltage changes sensitive to TTX and Gd3+ calculated by subtraction of data in B, and the remaining [Ca2+]o-dependent voltage after application of both blockers (Figure 6—source data 1). (D) Estimates of the average relative size of the external divalent concentration-dependent NALCN and VGSC currents in neocortical neurons between −100 and −30 mV. NALCN values from Figure 5G. The external divalent concentration-dependent VGSC currents were estimated as follows: the products of the VGSC activation and inactivation conductance plots were calculated for T1.1 and T0.2 using the average Boltzmann curves in Figure 3. These were converted to currents (I = driving voltage x conductance), and scaled to match the average TTX-sensitive current at −70 mV. The current generated in T0.2 minus that generated in T1.1 (ΔICa) was plotted against membrane voltage. (E) Plot of the average divalent-dependent depolarizing current carried by VGSC derived from D. The change in average resting membrane potential recorded in Figure 1 is indicated by the gray bar.
-
Figure 6—source data 1
Depolarization elicited by switch from T1.1 to T0.2 that was sensitive to TTX, Gd3+, or resistant to both blockers in conventional WT and Casr-/- neurons.
Depolarization units are volts and each sub-column represents measurements from a single neuron.
- https://cdn.elifesciences.org/articles/67914/elife-67914-fig6-data1-v2.xlsx
Tables
Table 1
Action potential frequency.
| ANOVA table | SS | DF | MS | F (DFn, DFd) | P value |
|---|---|---|---|---|---|
| Interaction | 130.0 | 2 | 64.99 | F (2, 54)=3.193 | p=0.0489 |
| [Ca2+]o on AP count | 594.4 | 1 | 594.4 | F (1, 54)=29.21 | p<0.0001 |
| Genotype | 136.1 | 2 | 68.04 | F (2, 54)=3.368 | p=0.0418 |
| Subjects (matching) | 1091 | 54 | 20.20 | F (54, 54)=0.9925 | p=0.5110 |
| Residual | 1099 | 54 | 20.35 |
Table 2
RMP.
| ANOVA table | SS | DF | MS | F (DFn, DFd) | P value |
|---|---|---|---|---|---|
| Interaction | 14.36 | 1 | 14.36 | F (1, 37)=1.035 | p=0.3155 |
| [Ca2+]o on RMP | 438.9 | 1 | 438.9 | F (1, 37)=31.65 | p<0.0001 |
| Genotype | 1513 | 1 | 1513 | F (1, 37)=19.10 | p<0.0001 |
| Subjects (matching) | 2930 | 37 | 79.19 | F (37, 37)=5.710 | p<0.0001 |
| Residual | 513.2 | 37 | 13.87 |
Table 3
Action potential frequency.
| ANOVA table | SS | DF | MS | F (DFn, DFd) | p Value |
|---|---|---|---|---|---|
| Interaction | 0.3407 | 1 | 0.3407 | F (1, 35)=0.4758 | p=0.4949 |
| [Ca2+]o at hyperpolarizing injection | 8.262 | 1 | 8.262 | F (1, 35)=11.54 | p=0.0017 |
| Genotype | 0.5380 | 1 | 0.5380 | F (1, 35)=0.7309 | p=0.3984 |
| Subjects (matching) | 25.76 | 35 | 0.7360 | F (35, 35)=1.028 | p=0.4679 |
| Residual | 25.06 | 35 | 0.7161 |
Table 4
Action potential frequency.
| ANOVA table | SS | DF | MS | F (DFn, DFd) | p Value |
|---|---|---|---|---|---|
| Interaction | 0.6090 | 1 | 0.6090 | F (1, 35)=0.2048 | p=0.6536 |
| [Ca2+]o at depolarizing injection | 45.09 | 1 | 45.09 | F (1, 35)=15.17 | p=0.0004 |
| Genotype | 5.982 | 1 | 5.982 | F (1, 35)=0.9959 | p=0.3252 |
| Subjects (matching) | 210.2 | 35 | 6.006 | F (35, 35)=2.020 | p=0.0204 |
| Residual | 104.1 | 35 | 2.973 |
Table 5
Action potential threshold.
| ANOVA table | SS | DF | MS | F (DFn, DFd) | p Value |
|---|---|---|---|---|---|
| Interaction | 0.5225 | 1 | 0.5225 | F (1, 27)=0.07478 | p=0.7866 |
| [Ca2+]o on AP threshold | 394.6 | 1 | 394.6 | F (1, 27)=56.48 | p<0.0001 |
| Genotype | 54.34 | 1 | 54.34 | F (1, 27)=2.284 | p=0.1424 |
| Subjects (matching) | 642.5 | 27 | 23.80 | F (27, 27)=3.406 | p=0.0011 |
| Residual | 188.6 | 27 | 6.987 |
Table 6
Action potential frequency.
| ANOVA table | SS | DF | MS | F (DFn, DFd) | p Value |
|---|---|---|---|---|---|
| Interaction | 0.4305 | 3 | 0.1435 | F (3, 87)=0.3481 | p=0.7906 |
| [Ca2+]o and I | 22.23 | 3 | 7.410 | F (3, 87)=17.97 | p<0.0001 |
| Genotype | 0.1341 | 1 | 0.1341 | F (1, 29)=0.2005 | p=0.6577 |
| Subjects (matching) | 19.41 | 29 | 0.6692 | F (29, 87)=1.623 | p=0.0445 |
| Residual | 35.87 | 87 | 0.4123 |
Table 7
Action potential frequency.
| Sidak's multiple comparisons test | Mean diff. | 95% CI of diff. | Significant? | Summary | Adjusted p value |
|---|---|---|---|---|---|
| T1.1 Ia vs. T0.2 Ia | −1.059 | −1.498 to −0.6200 | Yes | **** | <0.0001 |
| T1.1 Ia vs. T0.2 Ib | −0.6203 | −1.059 to −0.1813 | Yes | ** | 0.0016 |
| T1.1 Ia vs. T1.1 Ib | −0.1163 | −0.5554 to 0.3227 | No | ns | 0.9797 |
| T0.2 Ia vs. T0.2 Ib | 0.4387 | −0.0003709 to 0.8778 | No | ns | 0.0503 |
| T0.2 Ia vs. T1.1 Ib | 0.9427 | 0.5037 to 1.382 | Yes | **** | <0.0001 |
| T0.2 Ib vs. T1.1 Ib | 0.5040 | 0.06496 to 0.9431 | Yes | * | 0.0160 |
Table 8
Membrane potential with Ia.
| ANOVA table | SS | DF | MS | F (DFn, DFd) | p Value |
|---|---|---|---|---|---|
| Interaction | 131.7 | 1 | 131.7 | F (1, 29)=4.055 | p=0.0534 |
| [Ca2+]o | 949.2 | 1 | 949.2 | F (1, 29)=29.22 | p<0.0001 |
| Genotype | 162.7 | 1 | 162.7 | F (1, 29)=4.874 | p=0.0353 |
| Subjects (matching) | 968.0 | 29 | 33.38 | F (29, 29)=1.028 | p=0.4711 |
| Residual | 942.0 | 29 | 32.48 |
Table 9
Action potential threshold recorded at −70 mV.
| ANOVA table | SS | DF | MS | F (DFn, DFd) | p Value |
|---|---|---|---|---|---|
| Interaction | 0.06658 | 1 | 0.06658 | F (1, 25)=0.004070 | p=0.9496 |
| [Ca2+]o | 845.1 | 1 | 845.1 | F (1, 25)=51.66 | p<0.0001 |
| Genotype | 391.0 | 1 | 391.0 | F (1, 25)=10.52 | p=0.0033 |
| Subjects (matching) | 929.5 | 25 | 37.18 | F (25, 25)=2.273 | p=0.0225 |
| Residual | 408.9 | 25 | 16.36 | ||
| (B) Action potential threshold recorded at −70 mV | |||||
| Interaction | 2.008e-07 | 1 | 2.008e-07 | F (1, 28)=2.800 | p=0.1054 |
| [Ca2+]o | 1.415e-06 | 1 | 1.415e-06 | F (1, 28)=19.73 | p=0.0001 |
| Genotype | 3.050e-07 | 1 | 3.050e-07 | F (1, 28)=0.4545 | p=0.5057 |
| Subjects (matching) | 1.879e-05 | 28 | 6.710e-07 | F (28, 28)=9.358 | p<0.0001 |
| Residual | 2.008e-06 | 28 | 7.170e-08 | ||
| (C) Action potential threshold recorded at −70 mV | |||||
| Interaction | 0.0001602 | 1 | 0.0001602 | F (1, 28)=6.758 | p=0.0147 |
| [Ca2+]o | 0.0004821 | 1 | 0.0004821 | F (1, 28)=20.34 | p=0.0001 |
| Genotype | 0.001193 | 1 | 0.001193 | F (1, 28)=5.891 | p=0.0219 |
| Subjects (matching) | 0.005669 | 28 | 0.0002025 | F (28, 28)=8.541 | p<0.0001 |
| Residual | 0.0006637 | 28 | 2.370e-005 | ||
Table 10
Voltage-gated sodium channel current V0.5 for inactivation.
| ANOVA table | SS | DF | MS | F (DFn, DFd) | p Value |
|---|---|---|---|---|---|
| Interaction | 12.00 | 1 | 12.00 | F (1, 18)=0.7743 | p=0.3905 |
| [Ca2+]o | 3973 | 1 | 3973 | F (1, 18)=256.2 | p<0.0001 |
| Genotype | 27.49 | 1 | 27.49 | F (1, 18)=0.5632 | p=0.4627 |
| Subjects (matching) | 878.5 | 18 | 48.81 | F (18, 18)=3.148 | p=0.0097 |
| Residual | 279.1 | 18 | 15.50 |
Table 11
Voltage-gated sodium channel current V0.5 for activation.
| ANOVA table | SS | DF | MS | F (DFn, DFd) | p Value |
|---|---|---|---|---|---|
| Interaction | 4.814 | 1 | 4.814 | F (1, 17)=0.5668 | p=0.4618 |
| [Ca2+]o | 834.5 | 1 | 834.5 | F (1, 17)=98.24 | p<0.0001 |
| Genotype | 157.6 | 1 | 157.6 | F (1, 17)=4.813 | p=0.0424 |
| Subjects (matching) | 556.7 | 17 | 32.75 | F (17, 17)=3.855 | p=0.0040 |
| Residual | 144.4 | 17 | 8.494 |
Table 12
Voltage-gated potassium channel currents at 60 mV.
| ANOVA table | SS | DF | MS | F (DFn, DFd) | p Value |
|---|---|---|---|---|---|
| Interaction | 1.226e-018 | 3 | 4.086e-019 | F (3, 57)=0.2271 | p=0.8772 |
| [Ca2+]o and time | 7.270e-018 | 3 | 2.423e-018 | F (3, 57)=1.347 | p=0.2683 |
| Genotype | 6.054e-017 | 1 | 6.054e-017 | F (1, 19)=1.231 | p=0.2811 |
| Subjects (matching) | 9.345e-016 | 19 | 4.919e-017 | F (19, 57)=27.33 | p<0.0001 |
| Residual | 1.026e-016 | 57 | 1.800e-018 |
Table 13
divalent-dependent basal currents at −70 mV.
| ANOVA table | SS | DF | MS | F (DFn, DFd) | p Value |
|---|---|---|---|---|---|
| Treatment | 6.871e-021 | 2 | 3.435e-021 | F (1.495, 17.94)=13.30 | p=0.0007 |
| Individual (between rows) | 5.669e-022 | 12 | 4.725e-023 | F (12, 24)=0.1828 | p=0.9981 |
| Residual (random) | 6.201e-021 | 24 | 2.584e-022 | ||
| Total | 1.364e-020 | 38 |
Table 14
Post hoc testing of divalent-dependent basal currents at −70 mV.
| Sidak's multiple comparisons test | Mean diff. | 95% CI of diff. | Significant? | Summary | Adjusted p value |
|---|---|---|---|---|---|
| TTX sens vs. Gd3+ sens | −2.247e-011 | −4.391e-011 to −1.033e-012 | Yes | * | 0.0392 |
| TTX sens vs. Rem | −3.158e-011 | −4.899e-011 to −1.418e-011 | Yes | *** | 0.0009 |
| Gd3+ sens vs. Rem | −9.111e-012 | −2.146e-011 to 3.240e-012 | No | ns | 0.1789 |
Table 15
divalent-dependent depolarization.
| ANOVA table | SS | DF | MS | F (DFn, DFd) | p Value |
|---|---|---|---|---|---|
| Treatment | 0.0003944 | 2 | 0.0001972 | F (1.219, 13.41)=12.83 | p=0.0022 |
| Individual (between rows) | 0.0001037 | 11 | 9.423e-006 | F (11, 22)=0.6132 | p=0.7982 |
| Residual (random) | 0.0003381 | 22 | 1.537e-005 | ||
| Total | 0.0008361 | 35 |
Table 16
Post hoc testing of blocker sensitive fractions of the divalent-dependent depolarization.
| Sidak's multiple comparisons test | Mean diff. | 95% CI of diff. | Significant? | Summary | Adjusted p value |
|---|---|---|---|---|---|
| TTX sens vs. Gd3+ sens | 0.006528 | 0.001005 to 0.01205 | Yes | * | 0.0215 |
| TTX sens vs. Rem | 0.007428 | 0.002879 to 0.01198 | Yes | ** | 0.0028 |
| Gd3+ sens vs. Rem | 0.0009 | −0.001301 to 0.003101 | No | ns | 0.5311 |
Key resources table
| Reagent type (species) or resource | Designation | Source or reference | Identifiers | Additional information |
|---|---|---|---|---|
| Gene (M. musculus) | Casr | GenBank | Casr | |
| Strain, strain background (M. musculus) | Mouse wild-type strain C57BL/6J × 129×1 | The Jackson Laboratory | RRID:MGI:5652742 | |
| Genetic reagent, strain background (M. musculus) | Mouse expressing Nestin-cre mutation | The Jackson Laboratory as used in Sun et al., 2018 | Stock No. 003771 | C57/BL6J and 129S4 background strain |
| Genetic reagent, strain background (M. musculus) | Mouse with Lox mutation to delete exon 7 of Casr | Laboratory of Dr. Wenhan Chang, UCSF (Chang et al., 2008) | Casrfl/fl | C57/BL6J and 129S4 background strain |
| Sequence-based reagent | Casr | Applied Biosystems | Mm00443377_m1 | Quantitative PCR Mouse probe set |
| Sequence-based reagent | Actb | Applied Biosystems | Mm04394036_g1 | Quantitative PCR Mouse probe set |
| Sequence-based reagent | Nes-Cre1 primer | IDT | GCAAAACAGGCTCTAGCGTTCG | |
| Sequence-based reagent | Nes-Cre2 primer | IDT | CTGTTTCACTATCCAGGTTACGG | |
| Sequence-based reagent | P3U primer | IDT | TGTGACGGAAAACATACTGC | |
| Sequence-based reagent | Lox R primer | IDT | GCGTTTTTAGAGGGAAGCAG |
Additional files
Download links
A two-part list of links to download the article, or parts of the article, in various formats.
Downloads (link to download the article as PDF)
Open citations (links to open the citations from this article in various online reference manager services)
Cite this article (links to download the citations from this article in formats compatible with various reference manager tools)
Enhanced excitability of cortical neurons in low-divalent solutions is primarily mediated by altered voltage-dependence of voltage-gated sodium channels
eLife 10:e67914.
https://doi.org/10.7554/eLife.67914


