Wnt signaling enhances macrophage responses to IL-4 and promotes resolution of atherosclerosis
- Department of Medicine, Leon H. Charney Division of Cardiology, Cardiovascular Research Program, New York University Grossman School of Medicine, United States
- Division of Cardiovascular Medicine, Radcliffe Department of Medicine, University of Oxford, United Kingdom
- Center for Experimental Therapeutics and Reperfusion Injury, Department of Anesthesiology, Perioperative and Pain Medicine, Brigham and Women’s Hospital and Harvard Medical School, United States
- NYU Center for the Prevention of Cardiovascular Disease, New York University Grossman School of Medicine, United States
- Department of Surgery, Mount Sinai School of Medicine, United States
- Cardiovascular Research Center, Department of Medicine, Icahn School of Medicine at Mount Sinai, United States
- Division of Translational Medicine, Department of Medicine, New York University Langone Health, Institute for Systems Genetics, New York University Grossman School of Medicine, United States
- Department of Biomedical Sciences, School of Electrical Engineering and Computer Science, Oregon State University, United States
- The Precision Immunology Institute, Icahn School of Medicine at Mount Sinai, United States
- Department of Microbiology (Parasitology), New York University School of Medicine, United States
- Department of Genetics and Genomic Sciences, Icahn School of Medicine at Mount Sinai, United States
- Acute Vascular Imaging Centre, Radcliffe Department of Medicine, University of Oxford, United Kingdom
- Laboratory of Parasitic Diseases, National Institute of Allergy and Infectious Diseases, National Institutes of Health, United States
- Departments of Cell Biology and Microbiology, New York University Grossman School of Medicine, United States
Figures
Figure 1
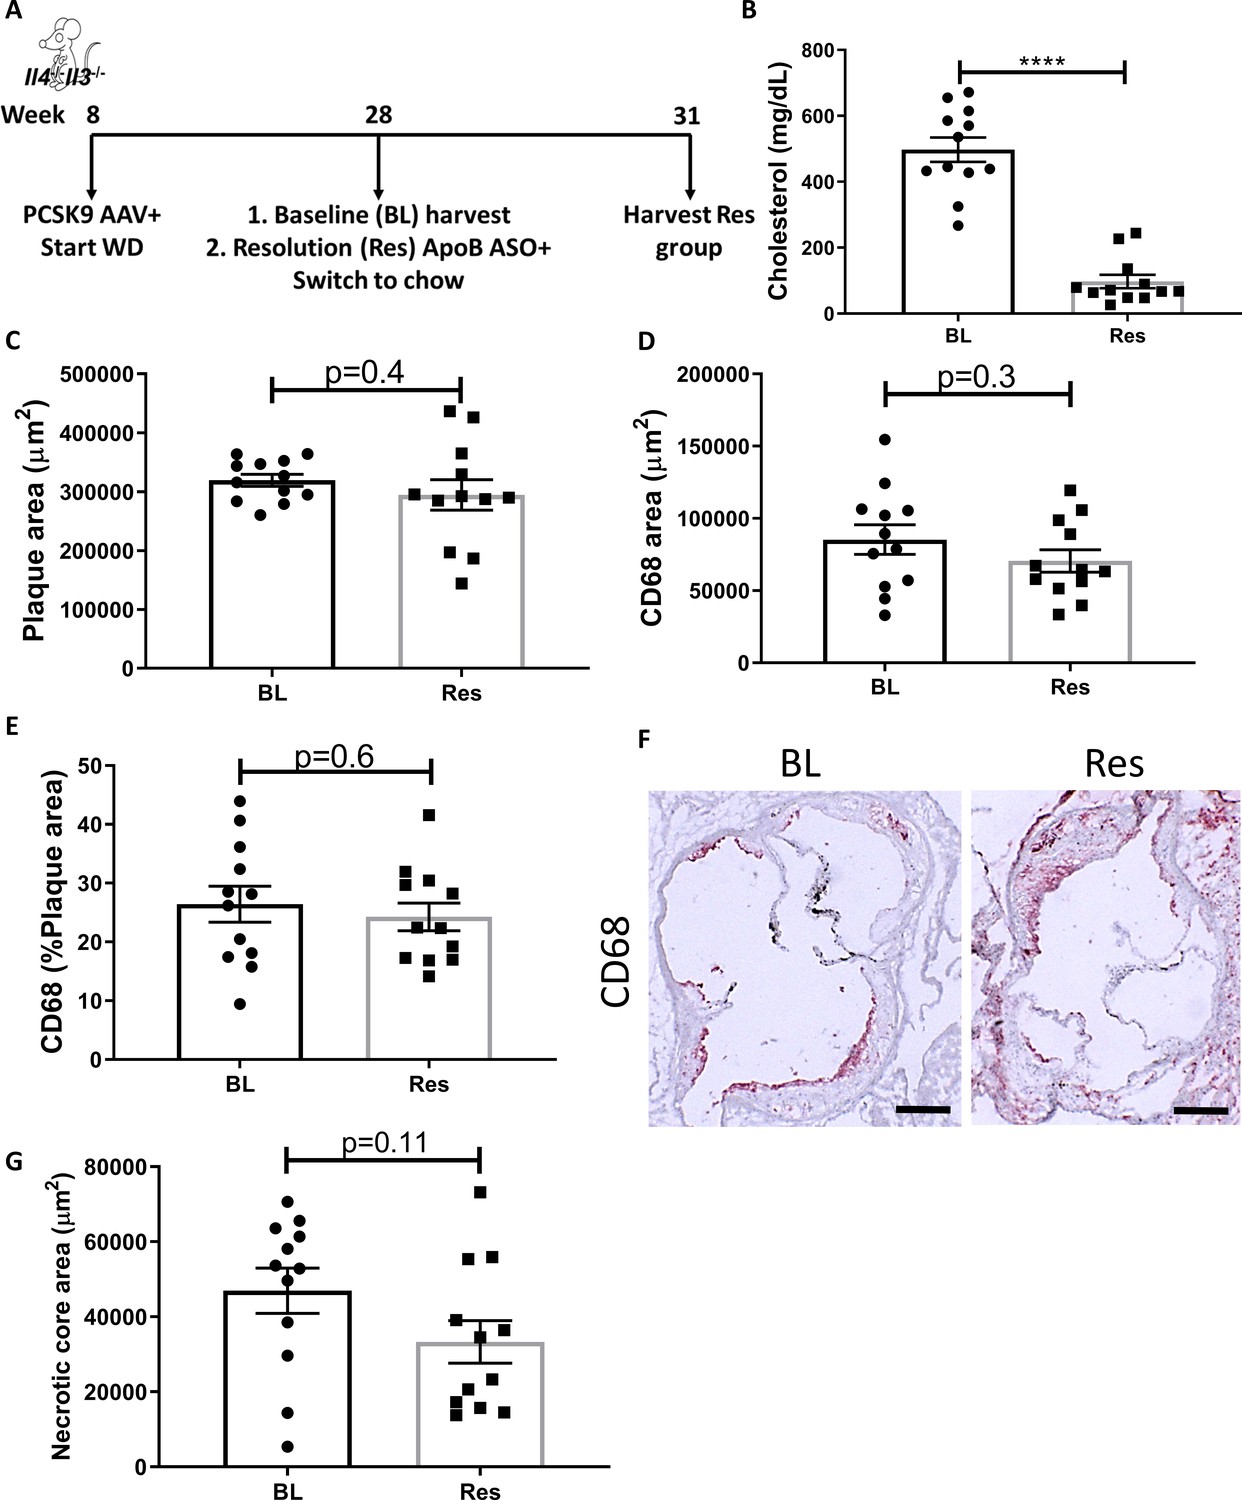
Global IL-4/13 deficiency impairs atherosclerosis resolution.
(A) Experimental design. (B) Plasma cholesterol. Aortic root morphometric analysis for areas of (C) plaque, (D) CD68, (E) % of plaque positive for CD68, (F) representative images (red, CD68; scale bar, 200 µm), and (G) necrotic core. ****p<0.0001, as determined via two-tailed Student's t-test.
Figure 2 with 1 supplement
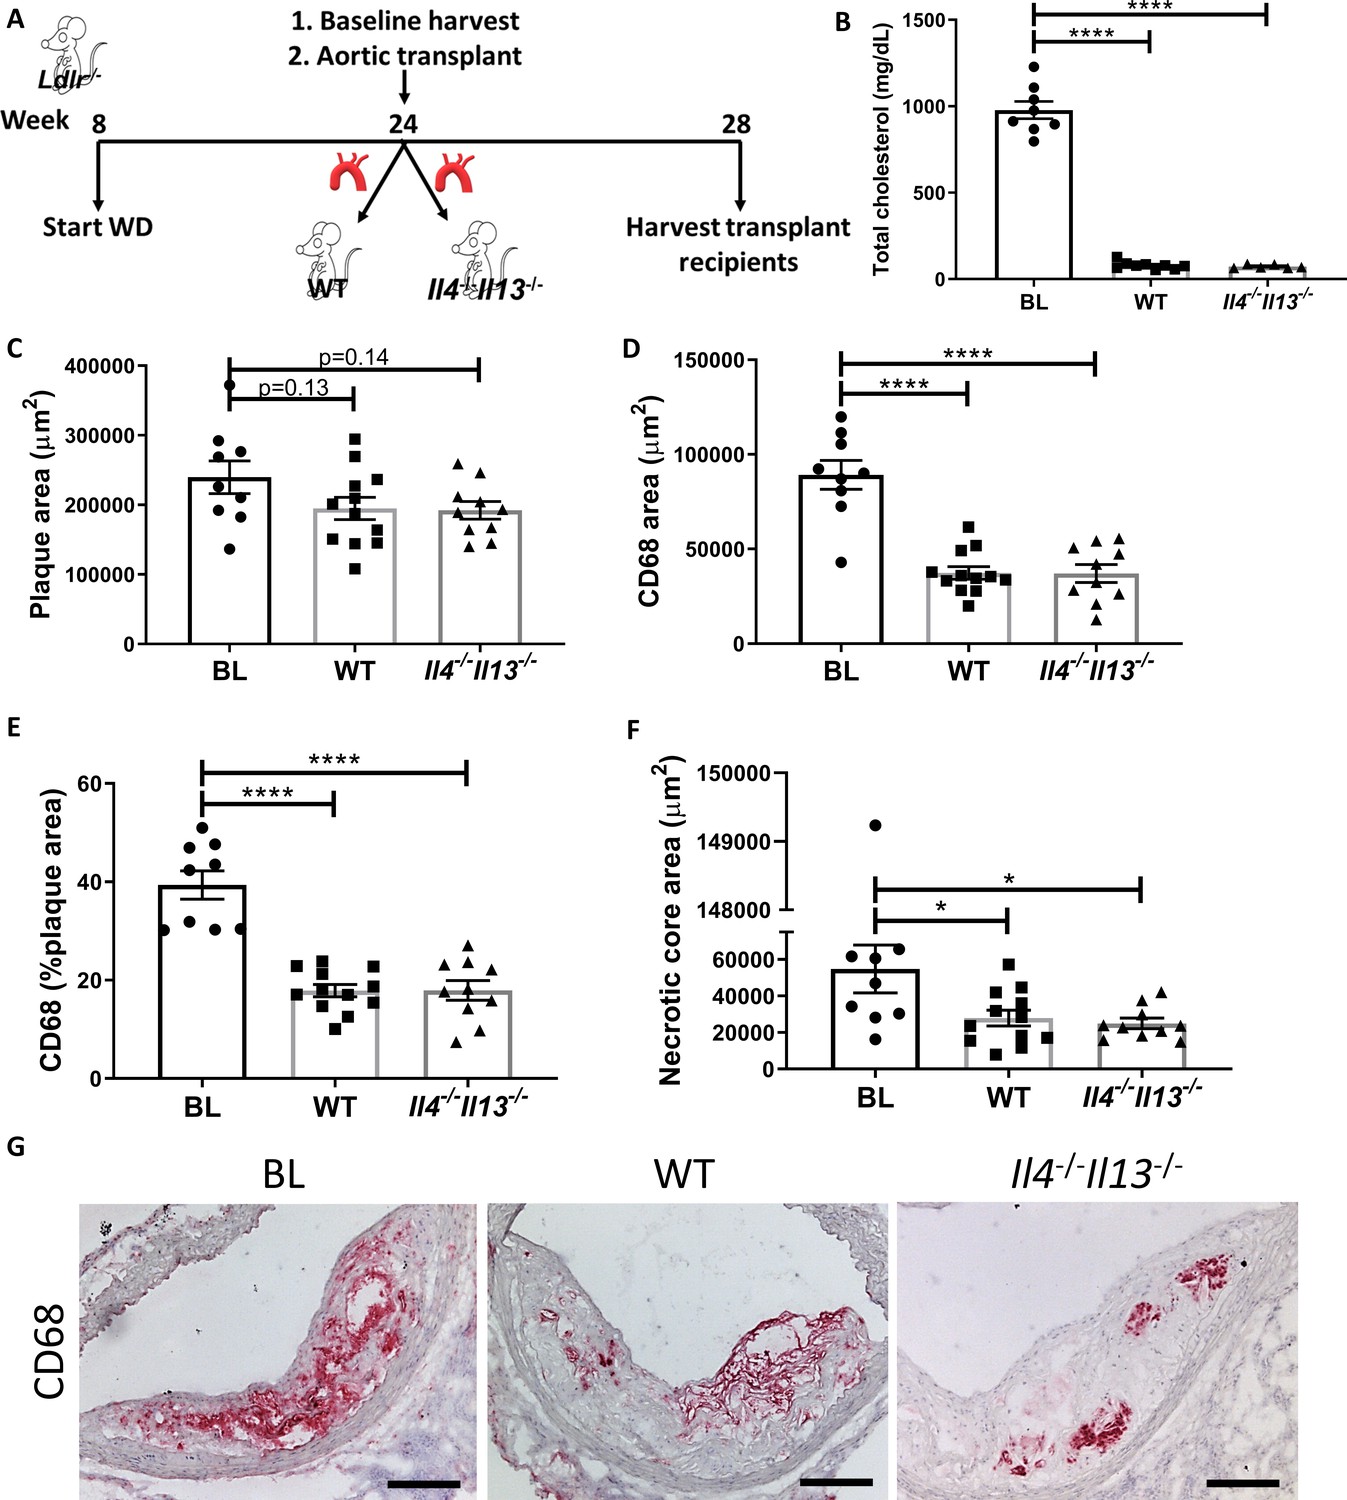
Production of IL-4/13 by newly recruited cells is not required for resolution of atherosclerosis.
(A) Experimental design. (B) Plasma cholesterol. (C–G) Morphometric analysis and representative images of grafted aortic arches for areas of (C) plaque, (D) CD68, (E) % of plaque positive for CD68, and (F) necrotic core. Red, CD68; scale bar, 100 µm. ****p<0.0001 and *p<0.05 compared with the baseline group as determined via one-way ANOVA and Dunnett’s multiple comparison test.
Figure 2—figure supplement 1
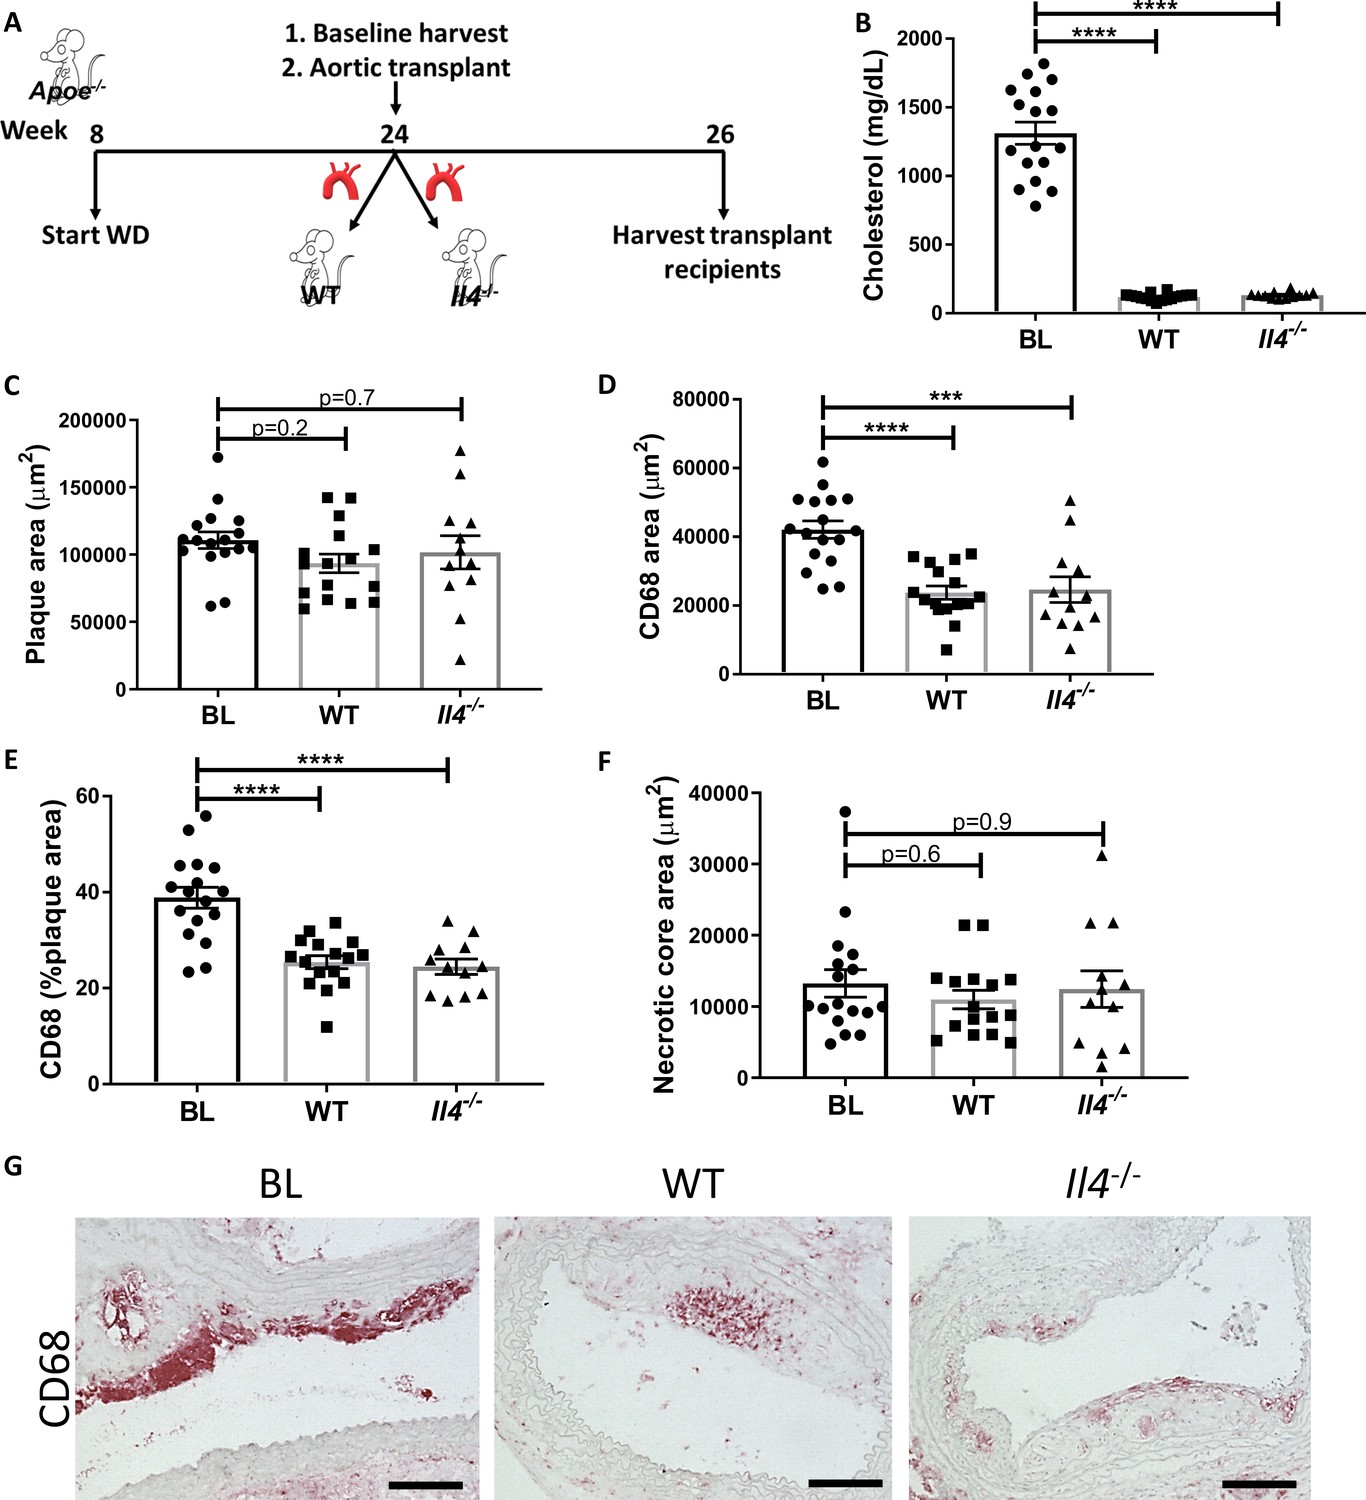
Production of IL-4 by newly recruited cells is not required for resolution of atherosclerosis.
(A) Experimental design. (B) Plasma cholesterol. (C–F) Morphometric analysis, and (G) representative images of grafted aortic arches for areas of (C) plaque, (D) CD68, (E) % of plaque positive for CD68, and (F) necrotic core. Red, CD68; scale bar, 100 µm. ****p<0.0001 and ***p<0.001 compared with the baseline group as determined via one-way ANOVA and Dunnett’s multiple comparison test.
Figure 3 with 1 supplement
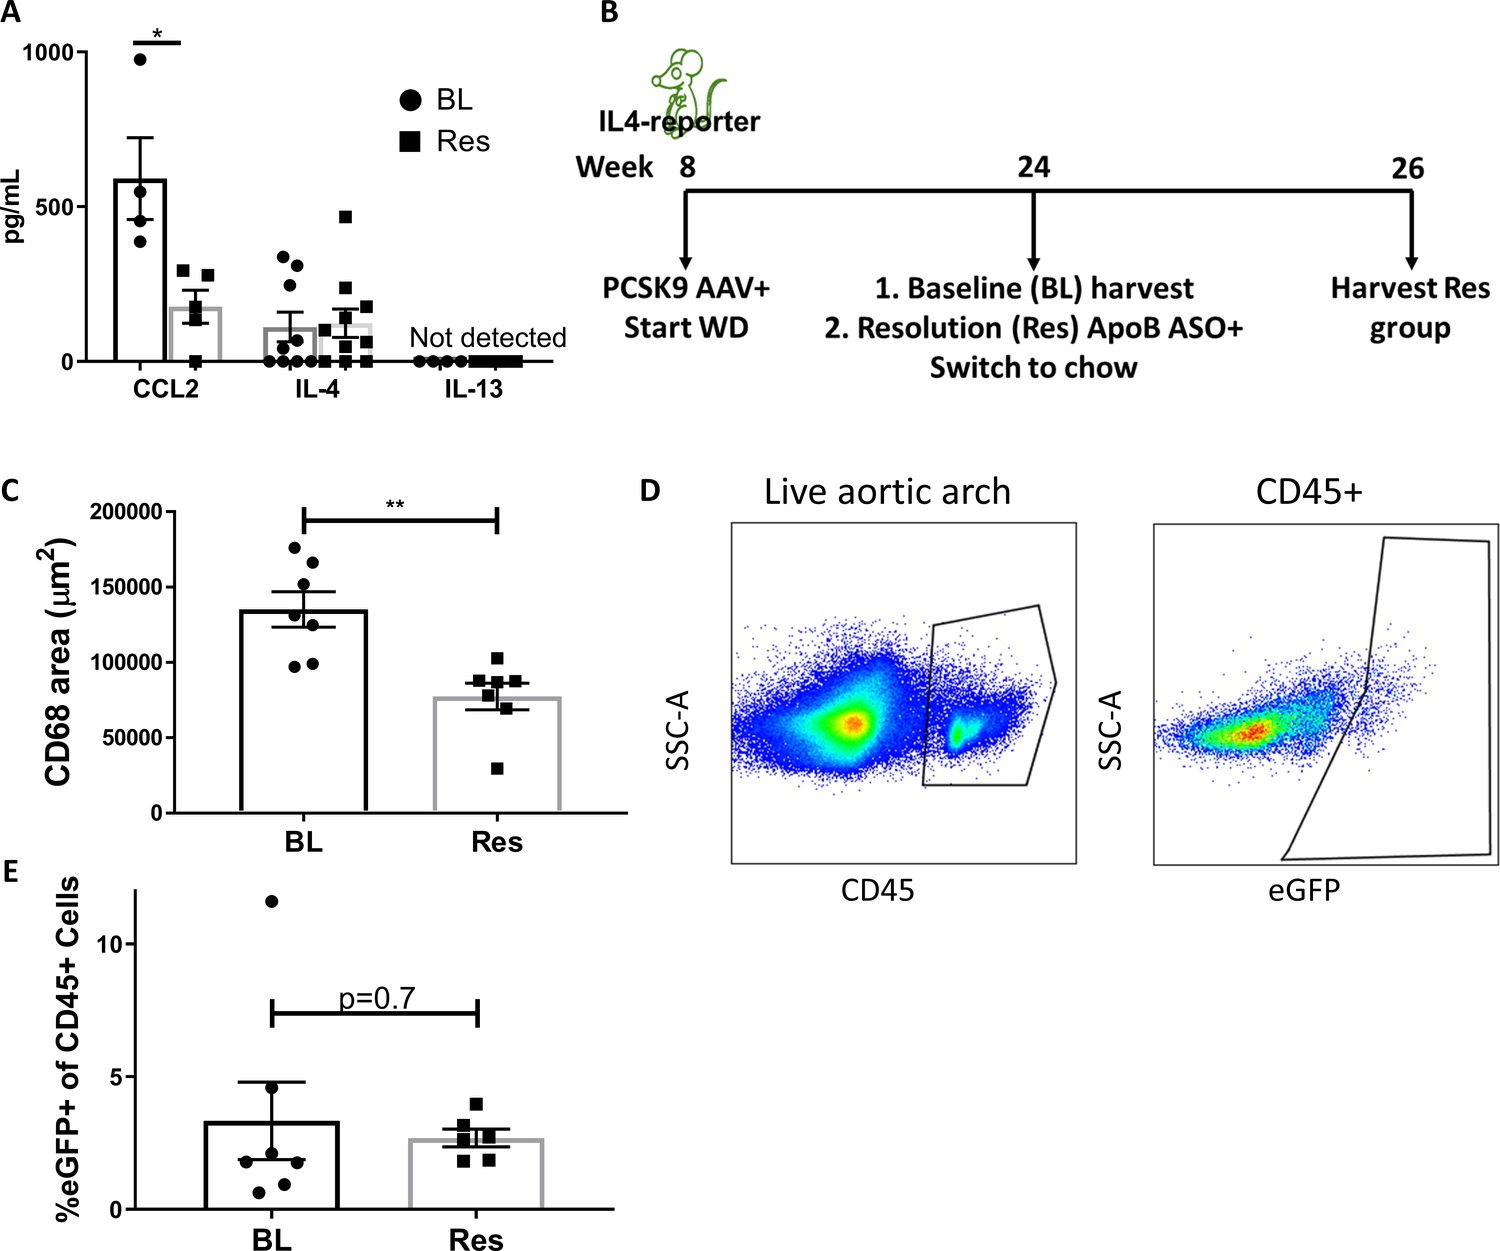
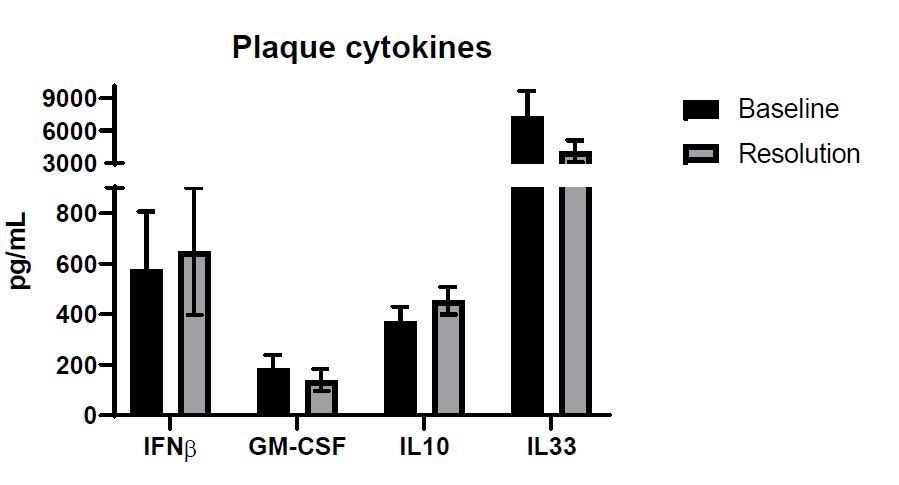
IL-4/13 levels do not change during resolution of atherosclerosis.
(A) Quantification of CCL2, IL-4, and IL-13 protein levels in aortic arch plaques of Ldlr-/- BL mice or further treated for lipid lowering for 3 weeks (Res). (B) Experimental design. (C) CD68-positive area in aortic roots. (D) Gating scheme of aortic arches single-cell suspensions and (E) quantification of IL-4 (eGFP+) producing cells in aortic arches. **p<0.01 and *p<0.05 determined by an unpaired t-test (two-tailed).
Figure 3—figure supplement 1
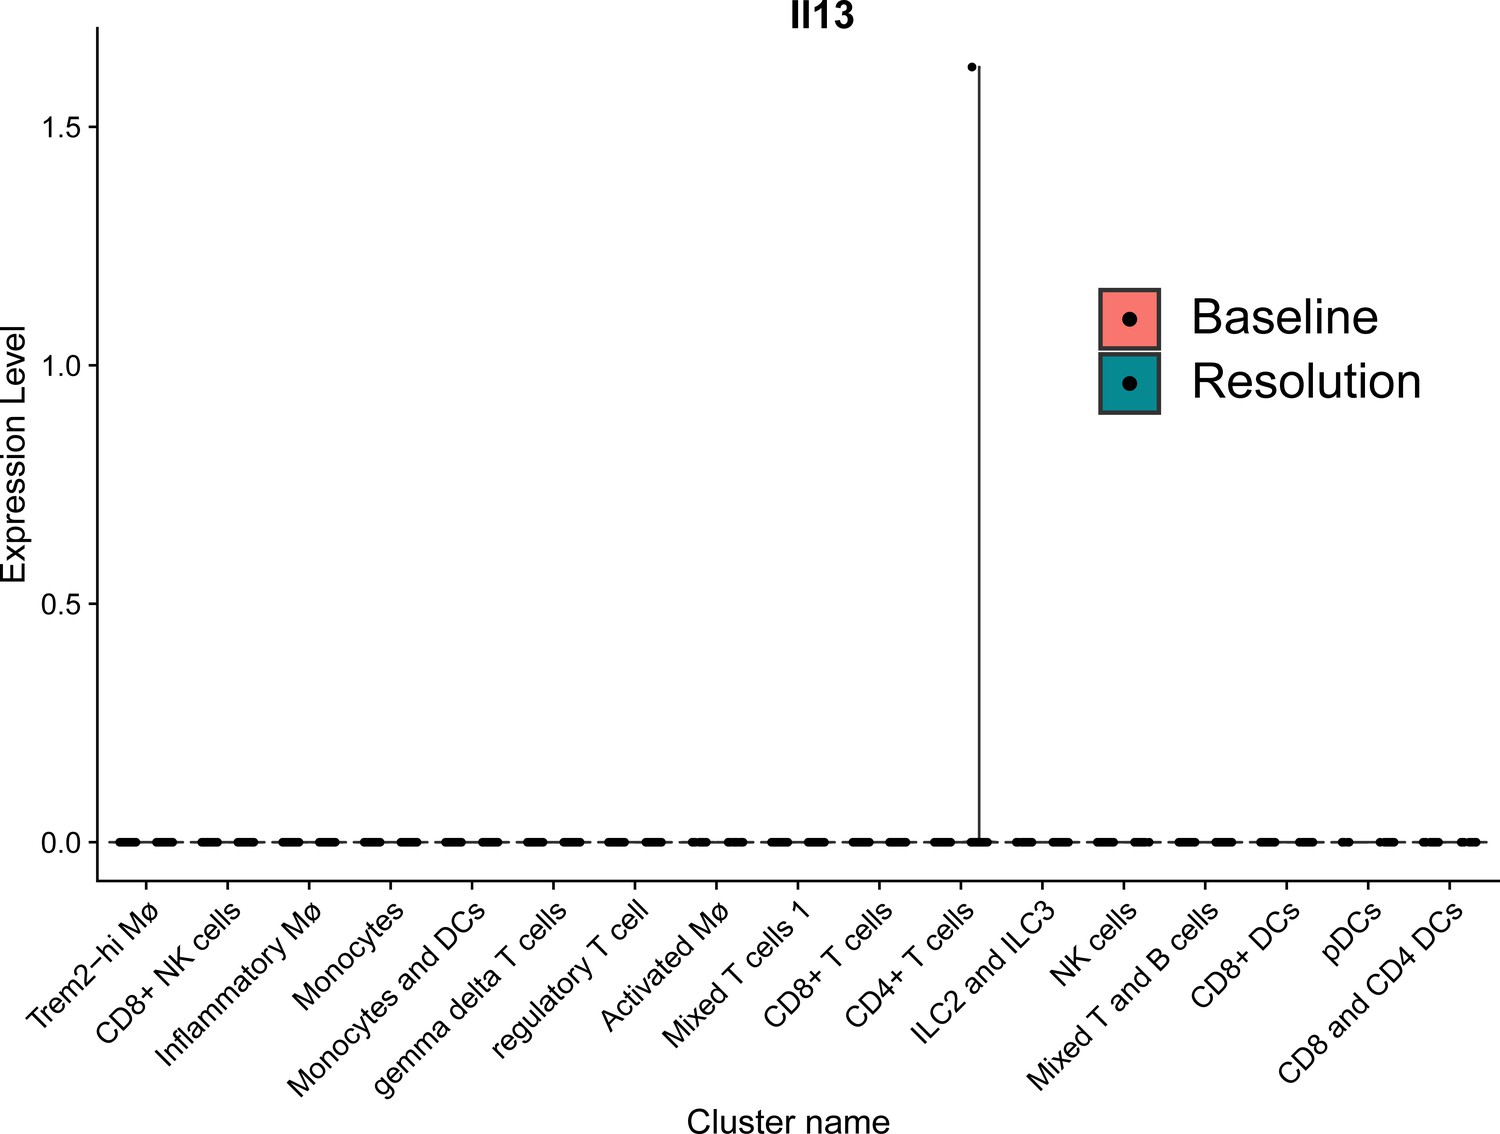
Il13 expression in plaques during disease progression and resolution on a single cell level.
Il13 gene expression in plaque immune cells (from Sharma et al., 2020).
Figure 4
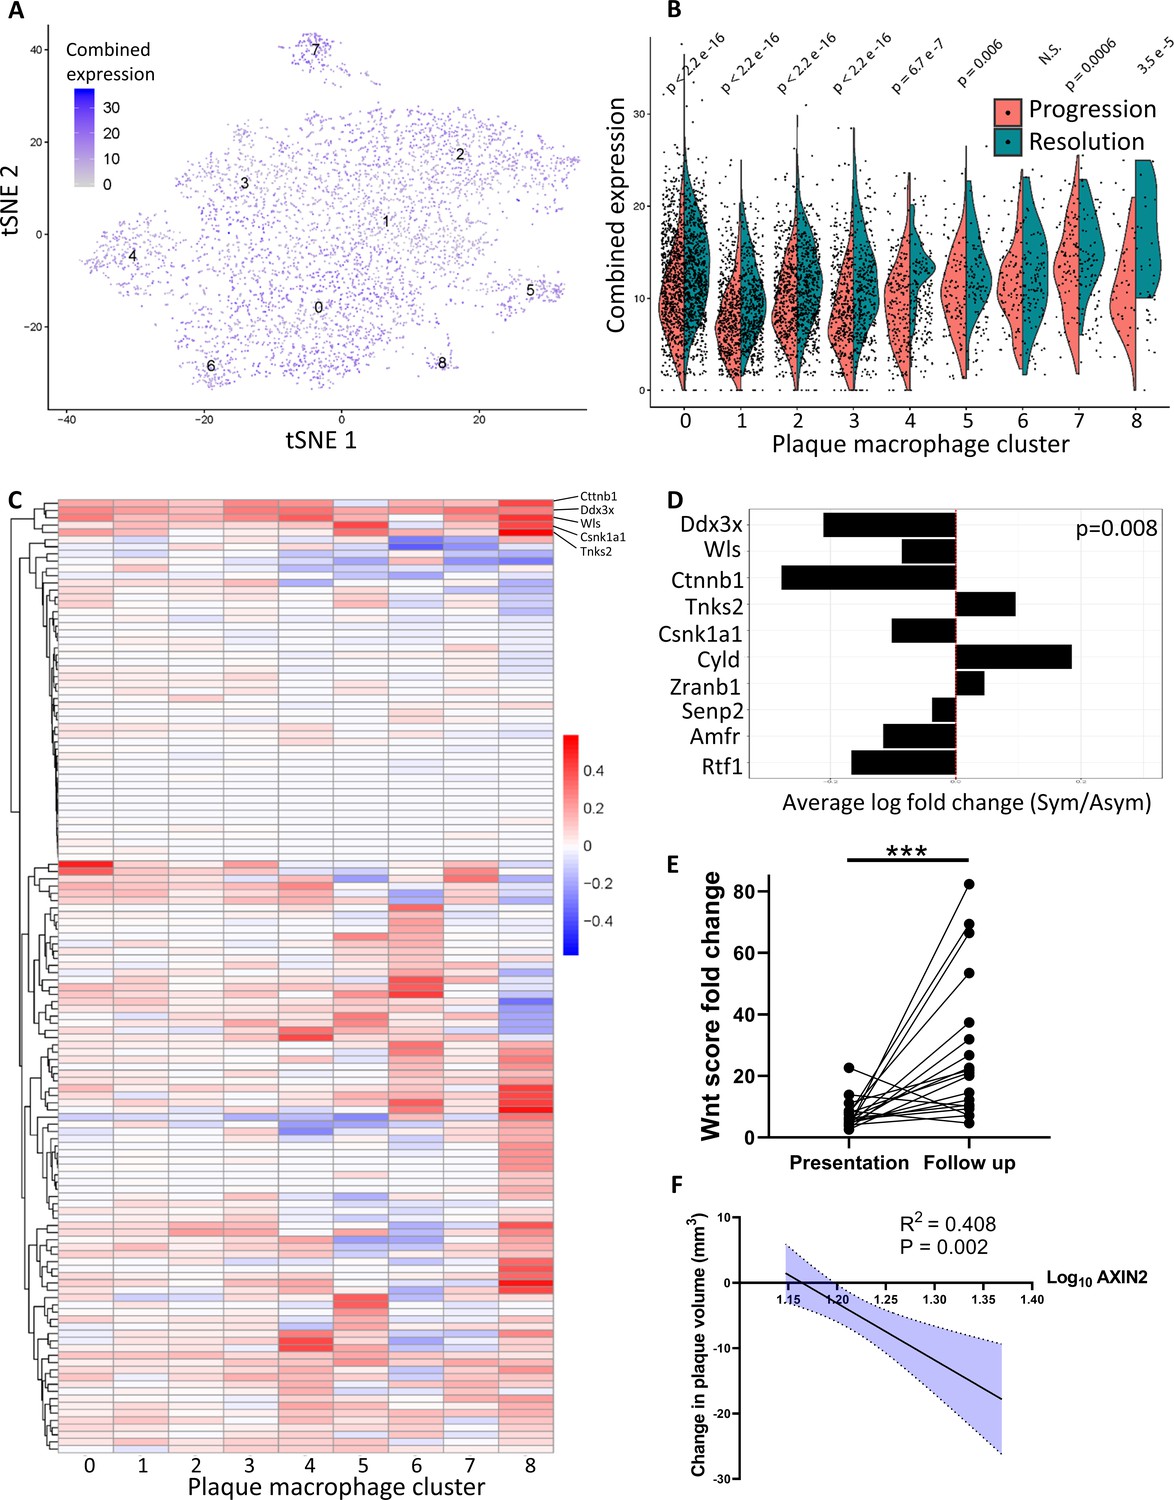
Atherosclerosis severity is associated with decreased responsiveness of plaque macrophages to Wnt signaling in mice and humans.
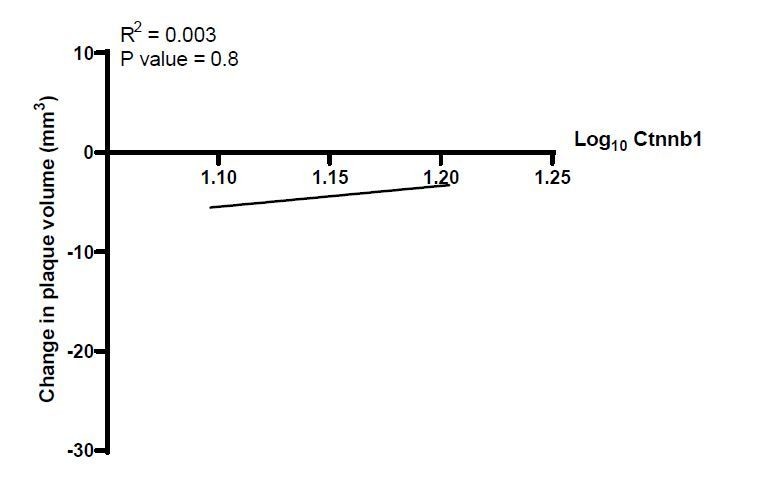
(A–C) Cumulative expression of genes associated with the GO term GO:0016055 of data from Lin et al., 2019 represented in (A) Louvain clusters for both progression and resolution groups and (B) divided by treatment. (C) Individual GO:0016055 gene expression per cluster, comparing treatment groups. Red, higher expression in resolution; blue, higher expression in progression. (D) Human plaque macrophages obtained from endarterectomies (from Fernandez et al., 2019) were examined for their expression of the top 10 most upregulated genes from GO:0016055 in mouse resolving plaque macrophages (from Lin et al., 2019). Relative expression of symptomatic (Sym) versus asymptomatic (Asym) is presented. Permutation tests of Fernandez et al. expressed genes was performed to calculate the probability of 7 or more genes out of 10 to have lower expression in the Sym group, p=0.008. (E) Expression of seven Wnt marker genes (Axin2, Ddx3x, Wls, Senp2, Ctnnb1, Csnk1a1, and Amfr) was measured in peripheral blood mononuclear cells (PBMCs) from statin-naïve patients at presentation of acute coronary syndrome and 3 months intensive atorvastatin treatment follow-up (Alkhalil et al., 2018). (F) Change in the expression of the Wnt hallmark gene, Axin2, in PBMCs obtained from patients was examined in relation to change in plaque volume from presentation to follow-up (Alkhalil et al., 2018).
Figure 5 with 1 supplement
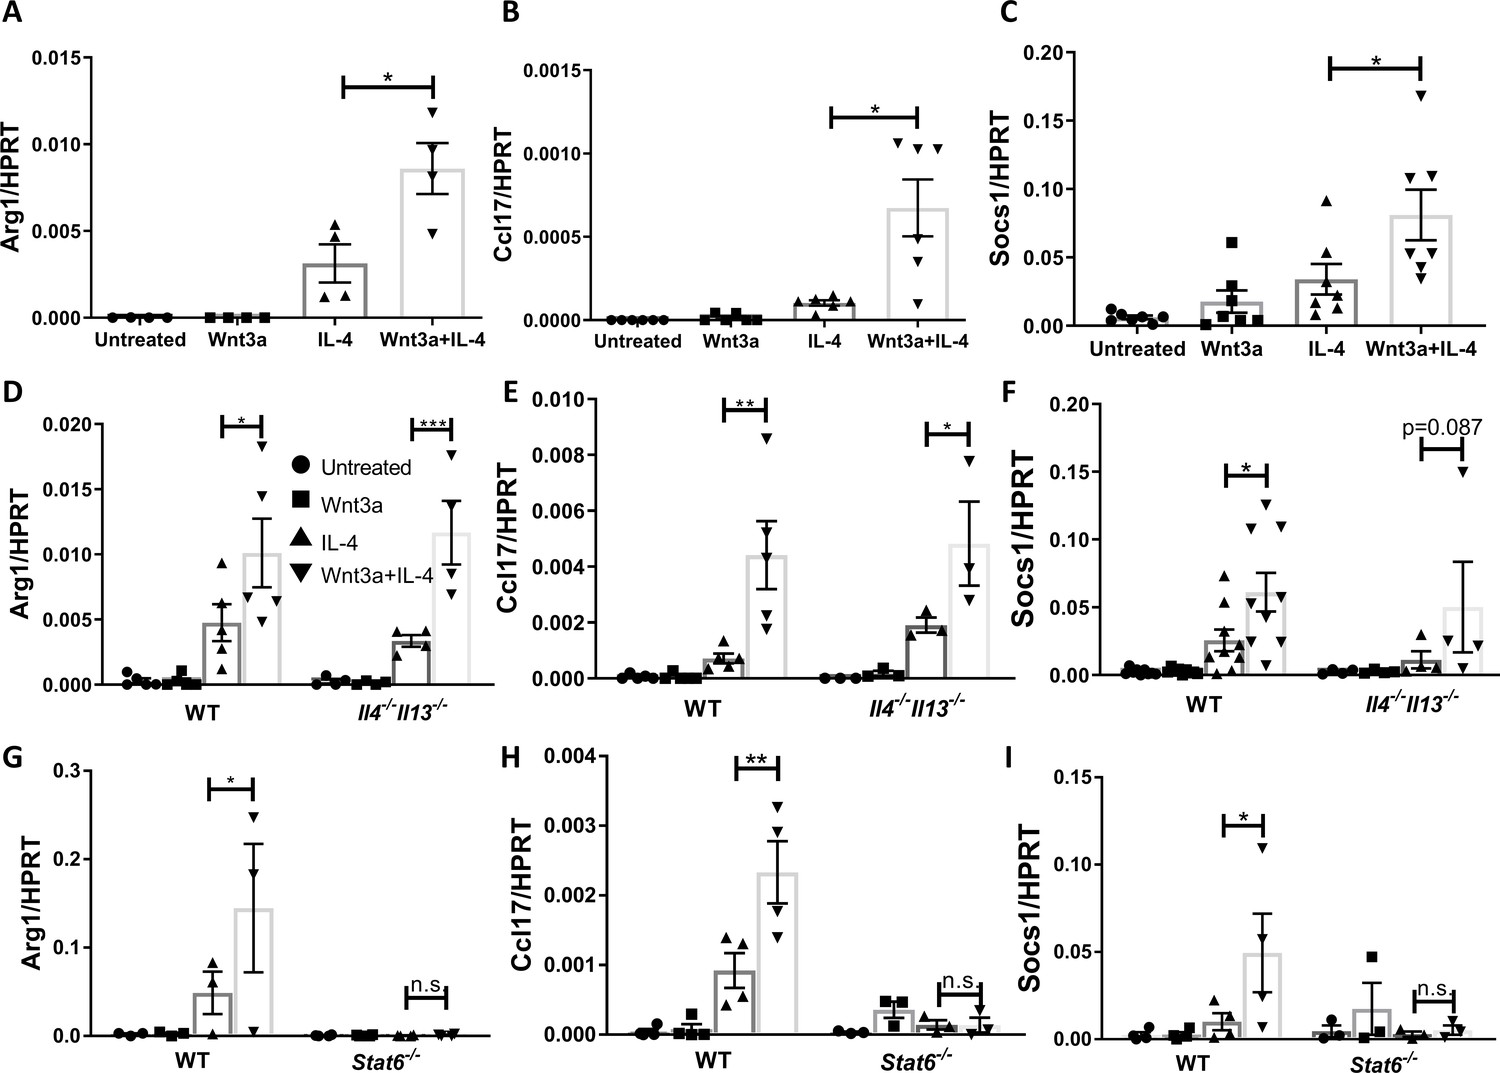
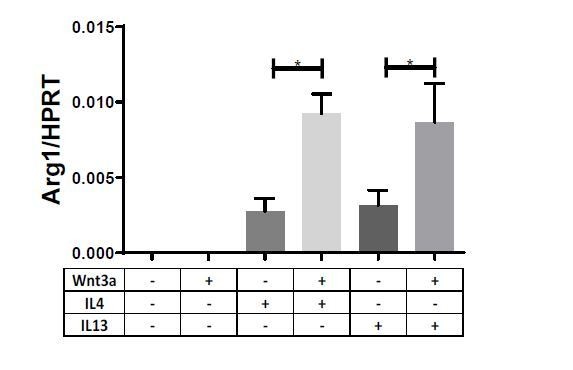
Wnt3a enhances macrophage IL-4-induced gene expression in vitro.
Bone marrow-derived macrophages from WT (A–C), Il4-/-Il13-/- (D–F), or Stat6-/- (G–I) mice were treated with Wnt3a, IL-4, or their combination for 16 hr and expression of (A/D/G) Arg1, (B/E/H) Ccl17, and (C/F/I) Socs1 was determined using qPCR. p-Values were determined via (A–C) one-way ANOVA or (D–I) two-way ANOVA compared with IL-4 treatment and Dunnett’s multiple comparison test (with repeated measurements). *p<0.05; **p<0.01; ***p<0.001.
Figure 5—figure supplement 1
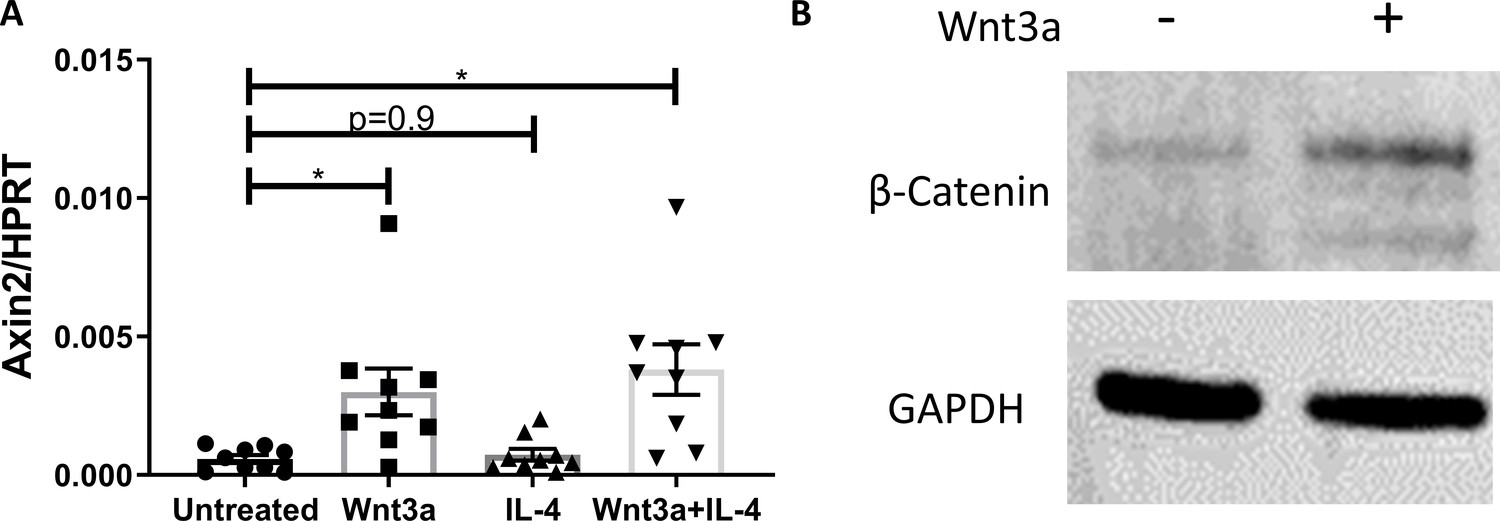
Macrophage responsiveness to Wnt stimulation in vitro.
(A) WT bone marrow-derived macrophages were treated with Wnt3a and IL4 (as in Figure 5) and expression of Axin2 determined with qPCR. *p<0.05 compared with the untreated group as determined via 1-way ANOVA and Dunnett’s multiple comparison test (with repeated measurements). (B) Representative western blot image for β-catenin and GAPDH of bone marrow-derived macrophages treated with Wnt3a for 1 hour (one out of 3 independent experiments).
Figure 6 with 1 supplement
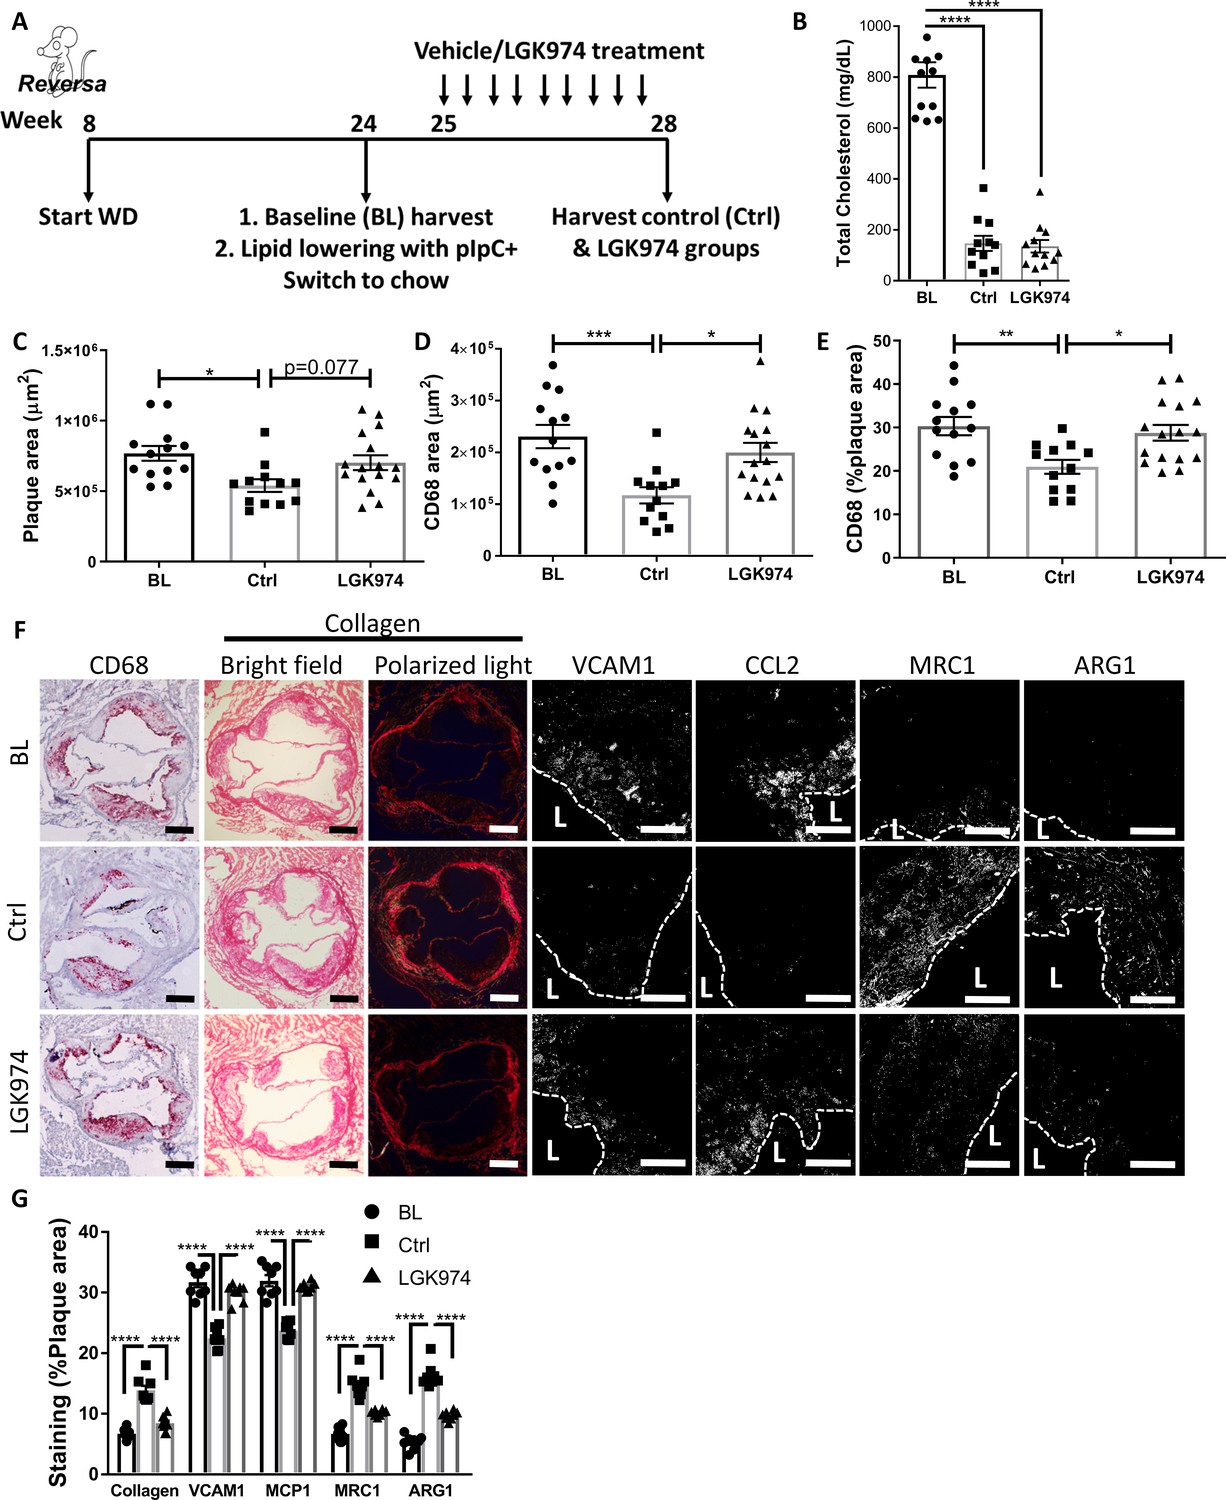
Wnt inhibition impairs atherosclerosis resolution and reparative macrophage polarization.
(A) Experimental design. (B) Plasma cholesterol. Aortic root morphometric analysis for areas of (C) plaque, (D) CD68, and (E) %of plaque positive for CD68. (F) Representative images and (G) quantification of aortic roots stained for (from left to right) CD68, collagen (with picrosirius red, imaged in bright field and under polarized light), vascular cell adhesion molecule 1, C-C motif chemokine ligand 2, mannose receptor 1MRC1, and arginase 1. Scale bar, 200 µm for CD68 and collagen, 50 µm for others. The dashed line demarcates plaque, and L stands for lumen. ****p<0.0001, ***p<0.001, **p<0.01, and *p<0.05 determined via one-way ANOVA comparing each group to the other groups, with Dunnett’s multiple comparison test.
Figure 6—figure supplement 1
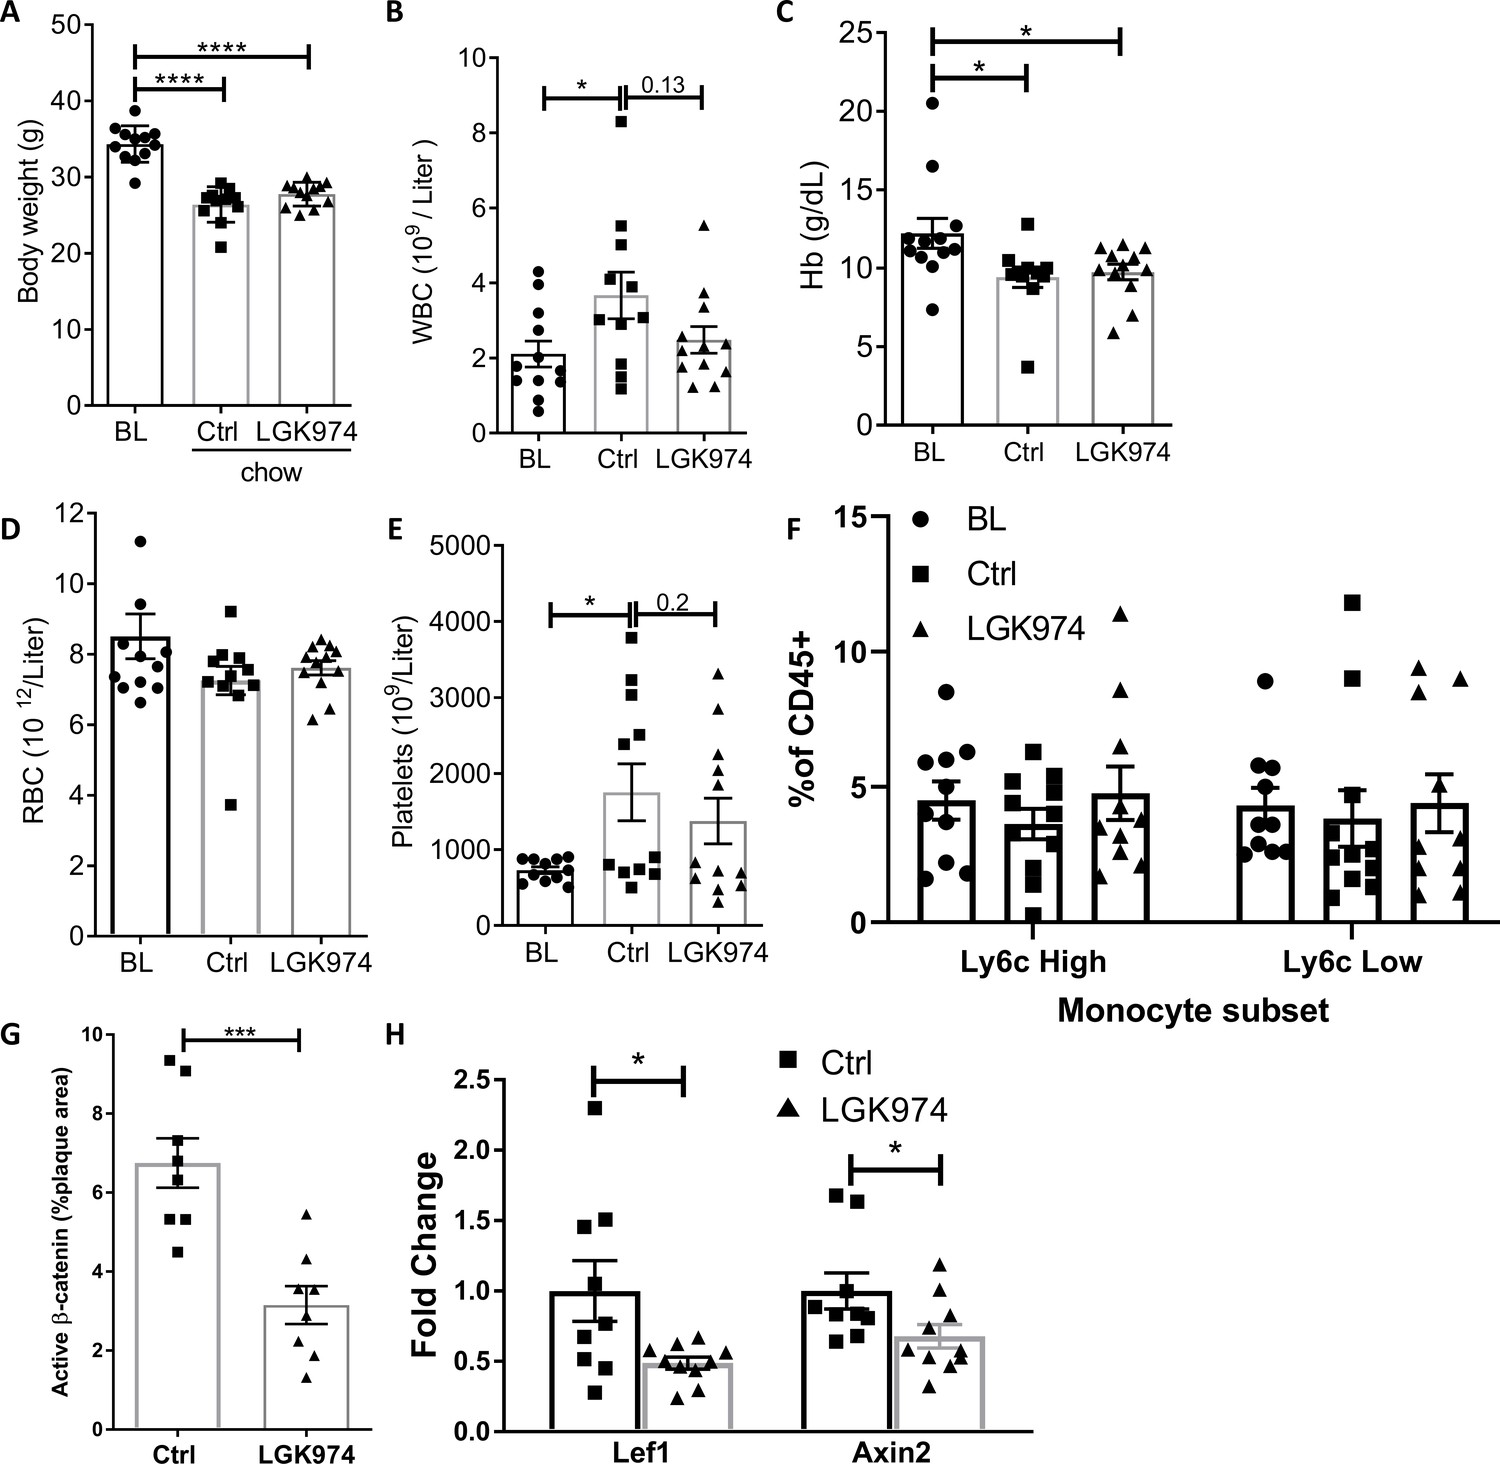
Effects of Wnt inhibition on general physiological parameters.
(A) Body weight and (C–E) hematological parameters on harvest day (experimental design in Figure 6A). p-values were determined via 1-way ANOVA comparing each group to the other 2 groups, with Dunnett’s multiple comparison test. (F) Flow-cytometry analysis of circulating monocyte subsets. (G) Quantification of aortic root lesions stained for active, non-phosphorylated β-catenin. (H) Expression of Lef1 and Axin2 (normalized to Hprt) in LCM excised macrophages determined by qPCR. (G-H) p-values were determined by an unpaired t test (2-tailed), ****p<0.0001, ***p<0.001and *p<0.05.
Figure 7 with 1 supplement
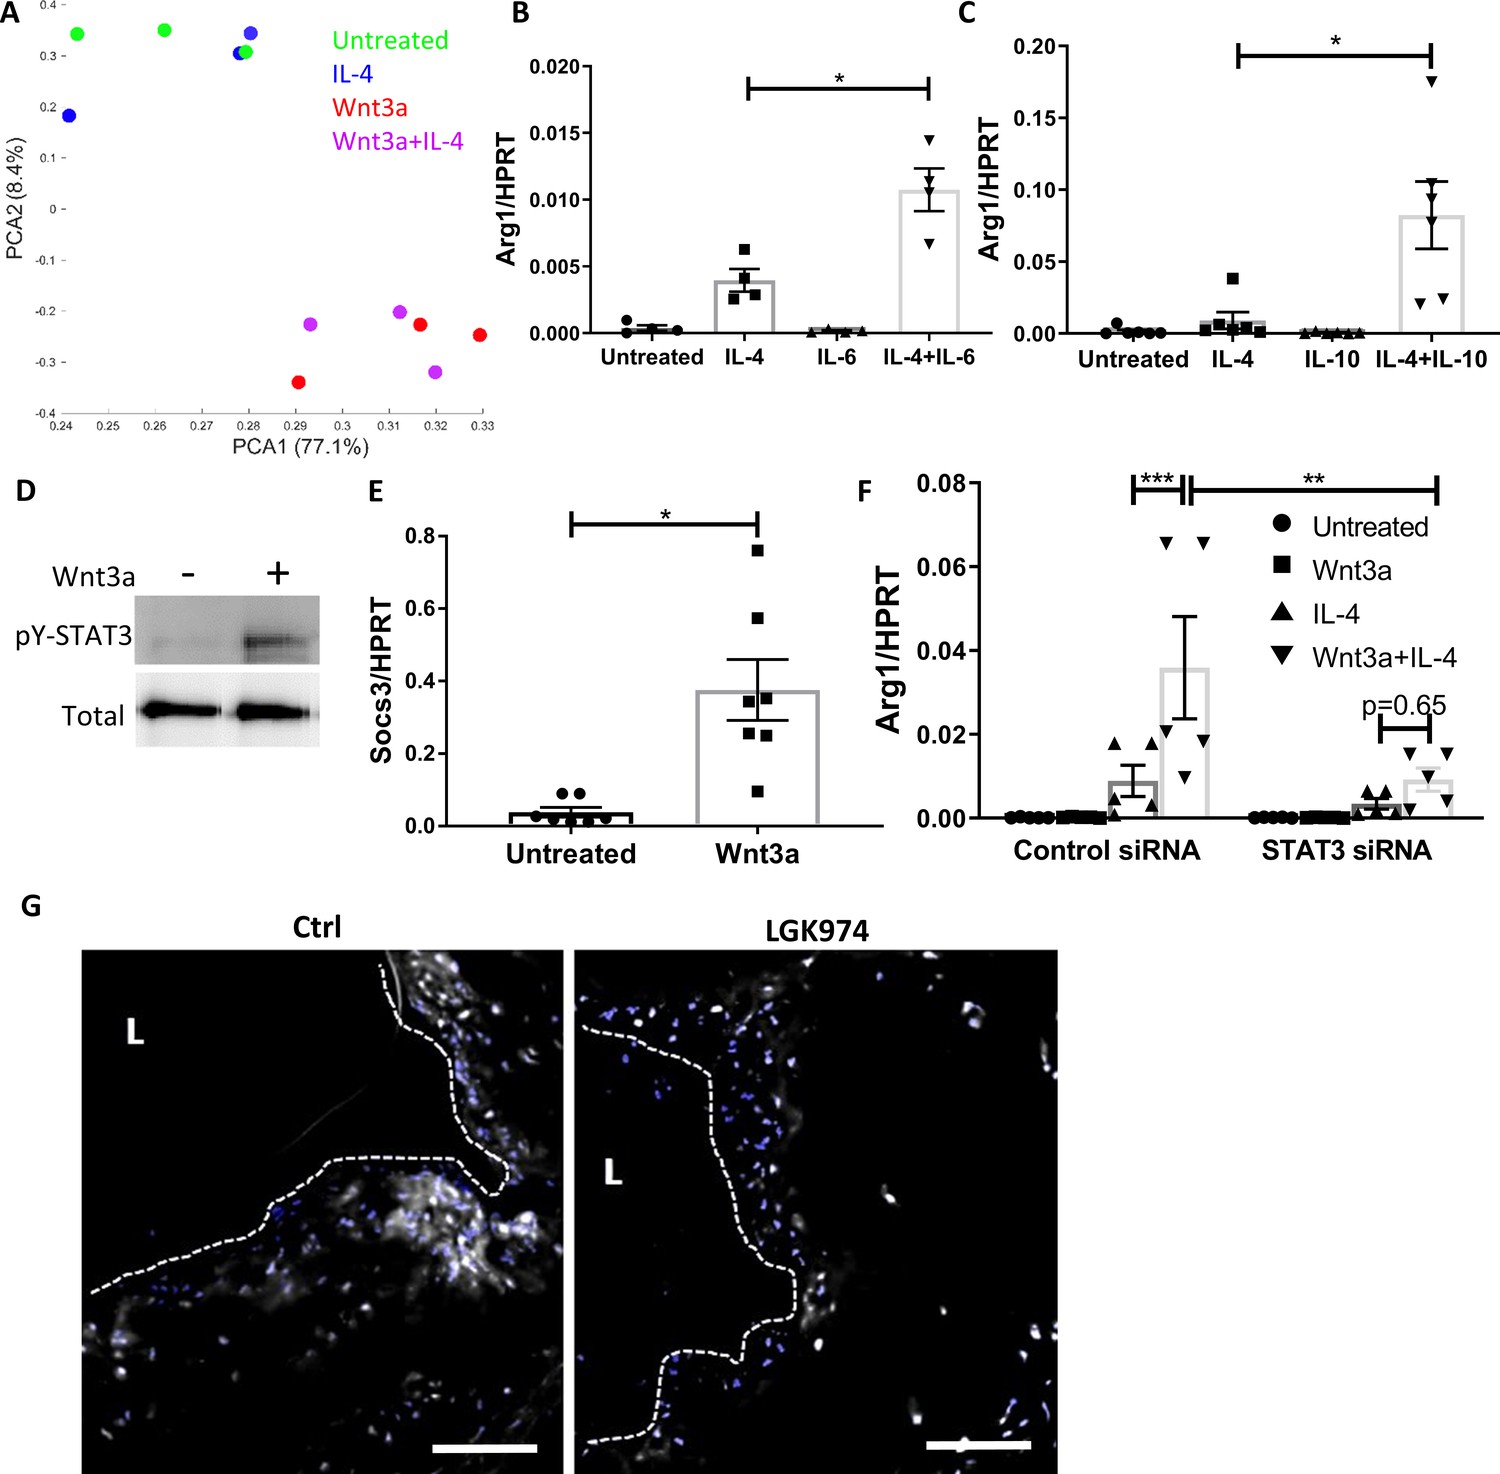
Wnt3a promotes STAT3 activation, which is required for the enhanced pro-resolving phenotype.
(A) Principal component analysis of RNA-seq data acquired from bone marrow-derived macrophages (BMDMs) treated with Wnt3a, IL-4, or their combination. (B, C) Arg1 expression of BMDMs treated with IL-4 and (B) IL-6 or (C) IL-10. (D) Representative western blot image for phosphorylates (pY) and total STAT3 16 hr following treatment of BMDMs with Wnt3a (one out of three independent experiments). (E) BMDMs were treated with Wnt3a for 16 hr, and Socs3 expression was determined using qPCR. p-Value was determined by a paired t-test (two-tailed). (F) BMDMs were treated with control or STAT3 siRNA, followed by treatment with Wnt3a, IL-4, or their combination and Arg1 expression determined using qPCR. p-Values were determined via (B, C) one-way or (F) two-way ANOVA compared with IL-4 treatment. Between siRNA groups, p-values were determined via two-way ANOVA comparing same Wnt3a/IL-4 treatments and Dunnett’s multiple comparison test (with repeated measurements). ***p<0.001, **p<0.01, and *p<0.05. (G). Representative images of aortic roots from control (Ctrl) or LGK974-treated mice (as in Figure 6A) stained for nuclei (blue) and STAT3 (gray). Scale bar, 100 μm.
Figure 7—figure supplement 1
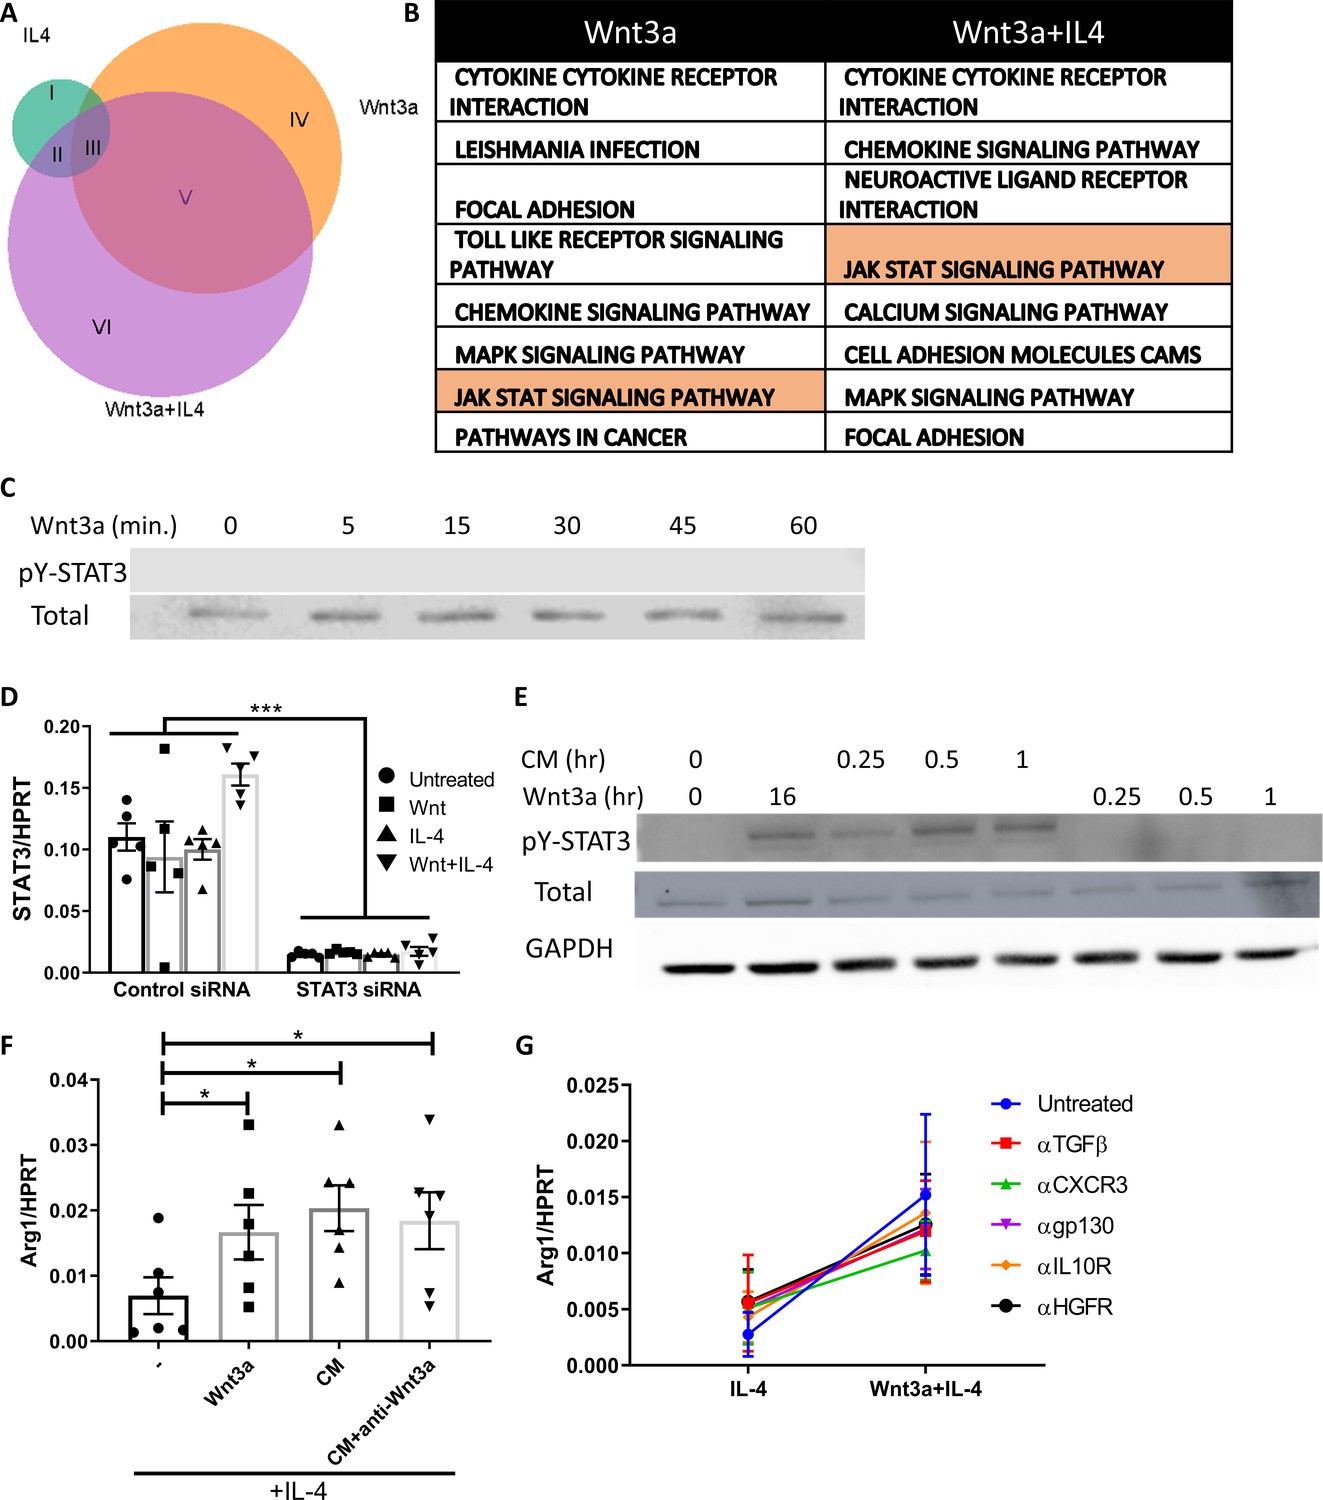
STAT3 involvement in the Wnt3a-mediated enhancement of IL-4 response.
(A) Proportion of differentially expressed genes (using RNA-seq) of bone marrow-derived macrophages (BMDMs) treated with IL-4 (green), Wnt3a (orange), or their combination (purple) compared to untreated cells. (B) Top eight GO terms of differentially expressed genes in Wnt3a and Wnt3a+IL-4-treated BMDMs. (C) Representative western blot image for phosphorylates (pY) and total STAT3 following treatment of BMDMs with Wnt3a for the indicated times (one out of two independent experiments). (D) BMDMs used in Figure 7F were examined for STAT3 expression using qPCR. (E) Representative western blot image for phosphorylates and total STAT3, as well as GAPDH, following treatment of BMDMs with Wnt3a or its conditioned media (CM) for the indicated times (one out of three independent experiments). Wnt CM was produced by treatment of BMDMs with Wnt3a for 16 hr. (F) BMDMs were treated with Wnt3a for 16 hr and added IL-4 for 2.5 hr thereafter, or with CM+IL-4 for 2.5 hr. Some CM was treated for 1 hr with a blocking antibody to Wnt3a prior to their exposure (in combination with IL4) to naïve BMDMs for 2.5 hr. Arg1 expression was determined with qPCR. p-Values were determined via one-way ANOVA, compared with IL-4 treatment, and Dunnett’s multiple comparison test (with repeated measurements). (G) BMDMs were treated with IL-4, with or without Wnt3a, and with blocking antibodies for transforming growth factor β, C-X-C motif chemokine receptor 3, glycoprotein 103, IL-10 receptor, and hepatocyte growth factor receptor for 16 hr, and Arg1 expression was determined using real-time qPCR (n = 2–3 mice per treatment).
Figure 8 with 1 supplement
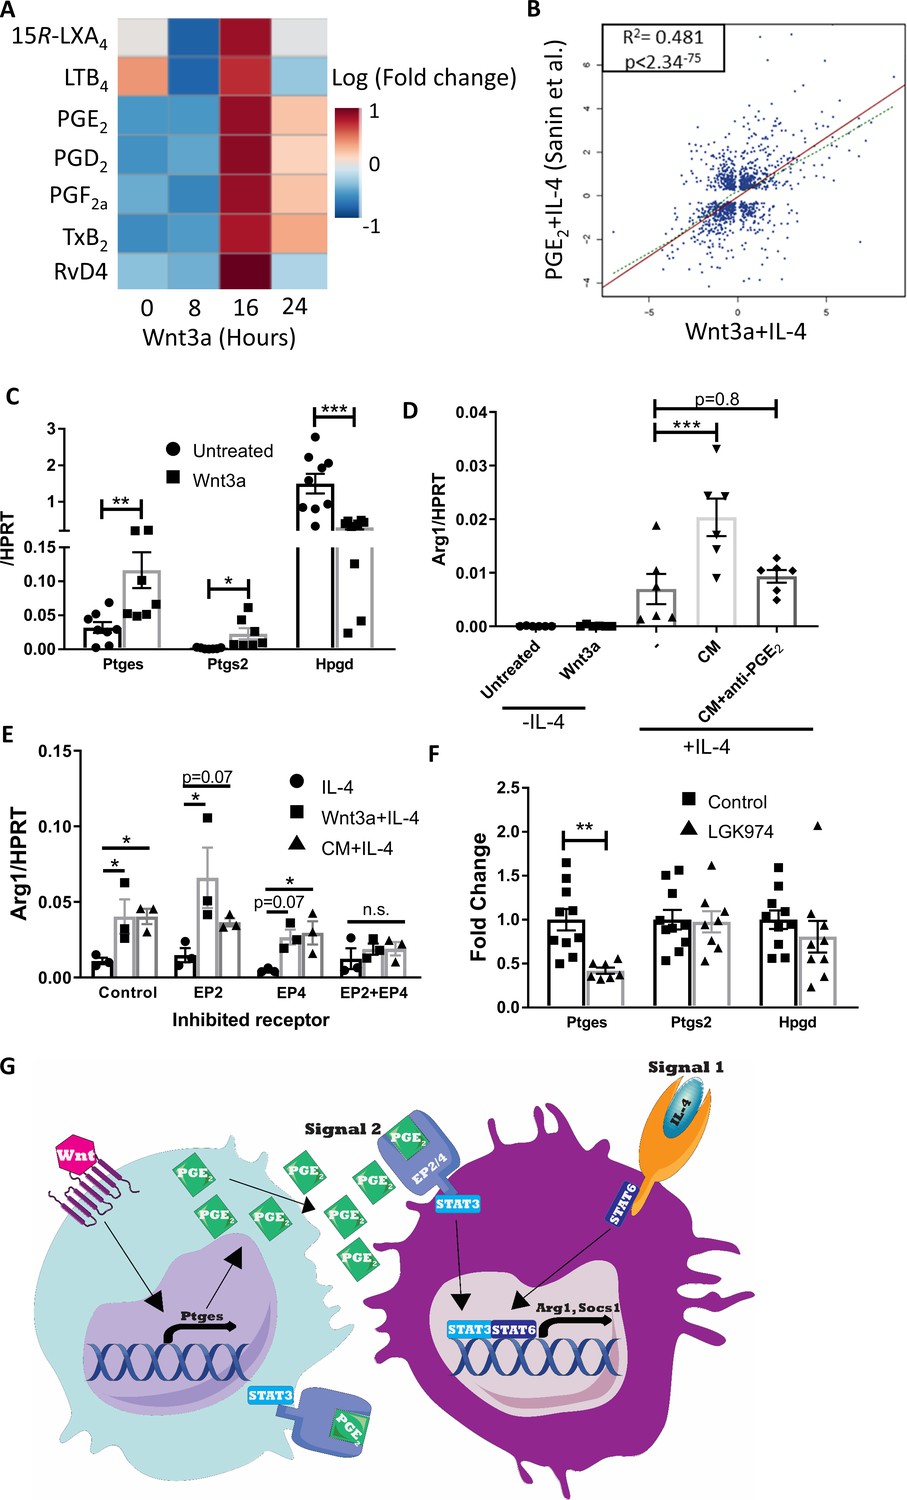
Wnt3a promotes PGE2 production that enhances the response to IL-4.
(A) Bone marrow-derived macrophages (BMDMs) were treated with Wnt3a for the indicated times and conditioned media (CM) analyzed using LC-MS/MS. Relative abundance to untreated cells shown. (B) Correlation between genes differentially expressed (adjusted p-value<0.05) in Wnt3a+IL-4 (from Weinstock et al.) or PGE2+IL-4 (from Sanin et al.). (C) BMDMs were treated with Wnt3a for 16 hr and expression of Ptges, Ptgs2, and Hpgd determined with qPCR. (D) Wnt CM was obtained (same experiment as Figure 7—figure supplement 1F). Naïve BMDMs were treated with IL-4 or CM+IL-4 for 2.5 hr. CM was treated with a PGE2 blocking antibody prior to their exposure (with IL-4) to naïve BMDMs. Arg1 expression was determined. (E) BMDMs were treated with Wnt3a for 16 hr and an additional 2.5 hr with IL-4 or with CM+IL-4 for 2.5 hr. Cells were concomitantly treated with either DMSO (Dimethyl sulfoxide; control), EP2 inhibitor, EP4 inhibitor, or their combination for the duration of treatment with Wnt3a or CM. Arg1 expression was evaluated. p-Values were determined via (D) one-way and (E) two-way ANOVA, compared with IL-4 treatment, and Dunnett’s multiple comparison test (with repeated measurements). (F) Expression of Ptges, Ptgs2, and Hpgd in aortic root plaque macrophages of control (Ctrl) and LGK974 groups (as in Figure 6A). (C, F) p-Values were determined by an unpaired t-test (two-tailed). ***p<0.001, ***p<0.01, and *p<0.05. (G) Schematic model of findings.
Figure 8—figure supplement 1
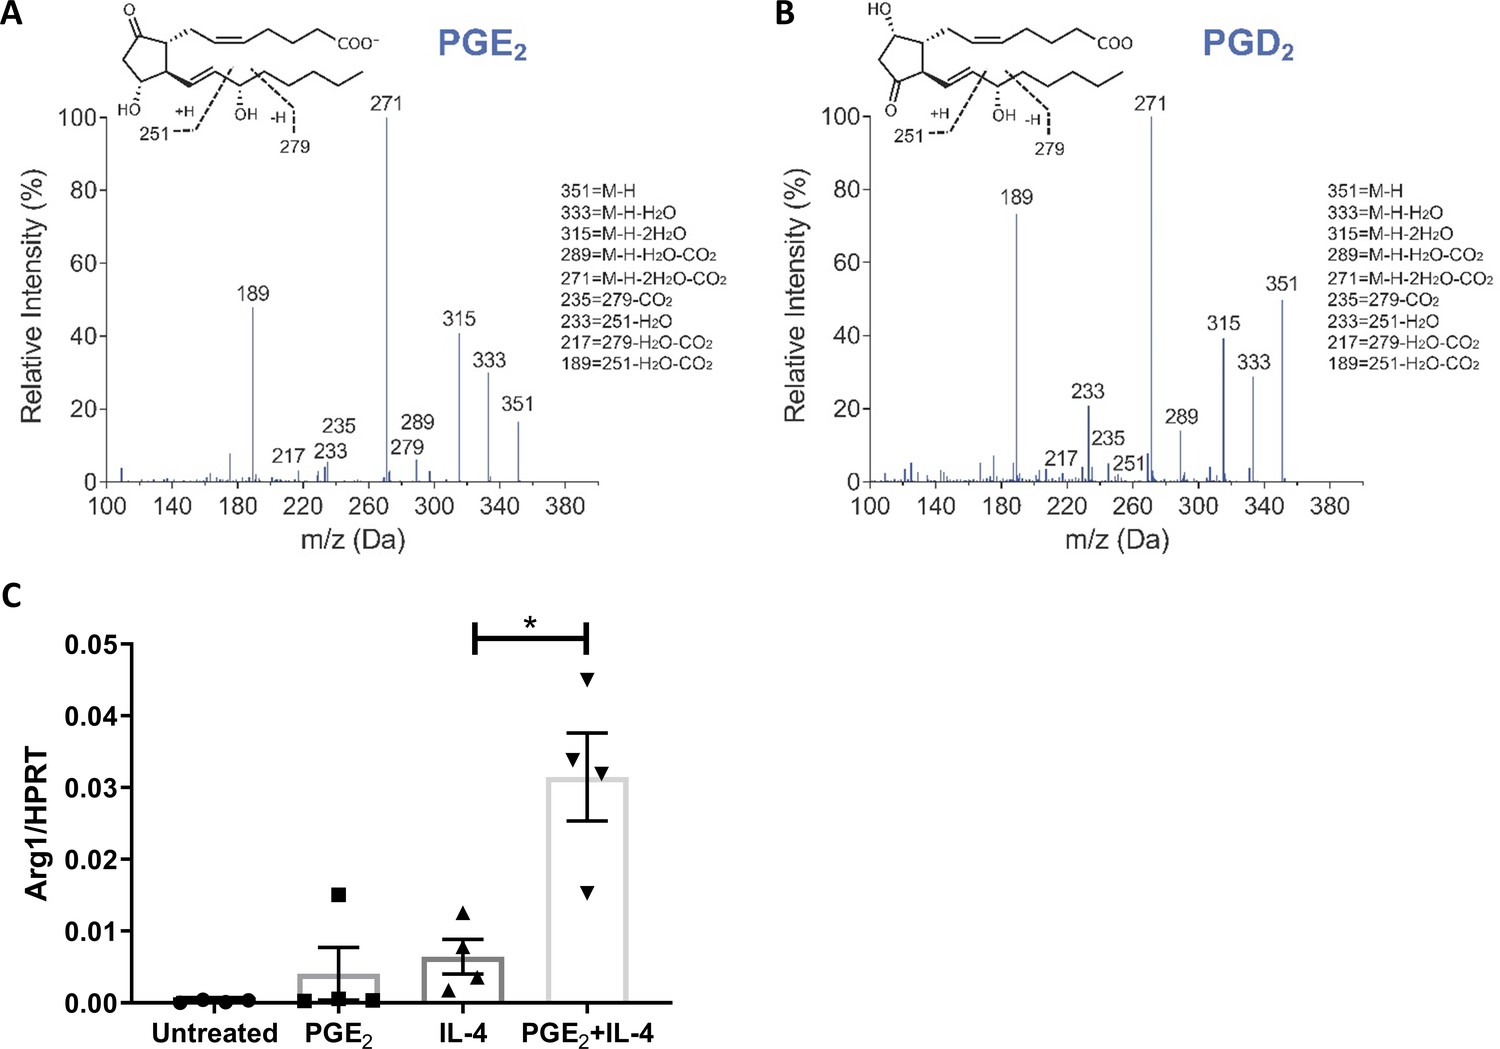
Prostanoids measurements and PGE2 cooperation with IL-4.
(A, B) Representative LC-MS/MS fragmentation spectra used for the identification of (A) PGE2 and (B) PGD2. (C) Bone marrow-derived macrophages were treated with IL-4, PGE2, or their combination for 2.5 hr and examined for Arg1 with qPCR. *p<0.05 was determined via one-way ANOVA, compared with IL-4 treatment, and Dunnett’s multiple comparison test (with repeated measurements).
Author response image 1
Author response image 2
Author response image 3
Additional files
-
Supplementary file 1
qPCR primer sequences.
- https://cdn.elifesciences.org/articles/67932/elife-67932-supp1-v3.docx
-
Transparent reporting form
- https://cdn.elifesciences.org/articles/67932/elife-67932-transrepform-v3.pdf
Download links
A two-part list of links to download the article, or parts of the article, in various formats.
Downloads (link to download the article as PDF)
Open citations (links to open the citations from this article in various online reference manager services)
Cite this article (links to download the citations from this article in formats compatible with various reference manager tools)
Wnt signaling enhances macrophage responses to IL-4 and promotes resolution of atherosclerosis
eLife 10:e67932.
https://doi.org/10.7554/eLife.67932


