Handling of intracellular K+ determines voltage dependence of plasmalemmal monoamine transporter function
- Institute of Pharmacology and the Gaston H. Glock Research Laboratories for Exploratory Drug Development, Center of Physiology and Pharmacology, Medical University of Vienna, Austria
- Division of Neurophysiology and Neuropharmacology, Centre for Physiology and Pharmacology, Medical University of Vienna, Austria
- Center for Brain Research, Medical University of Vienna, Austria
Figures
Figure 1 with 1 supplement
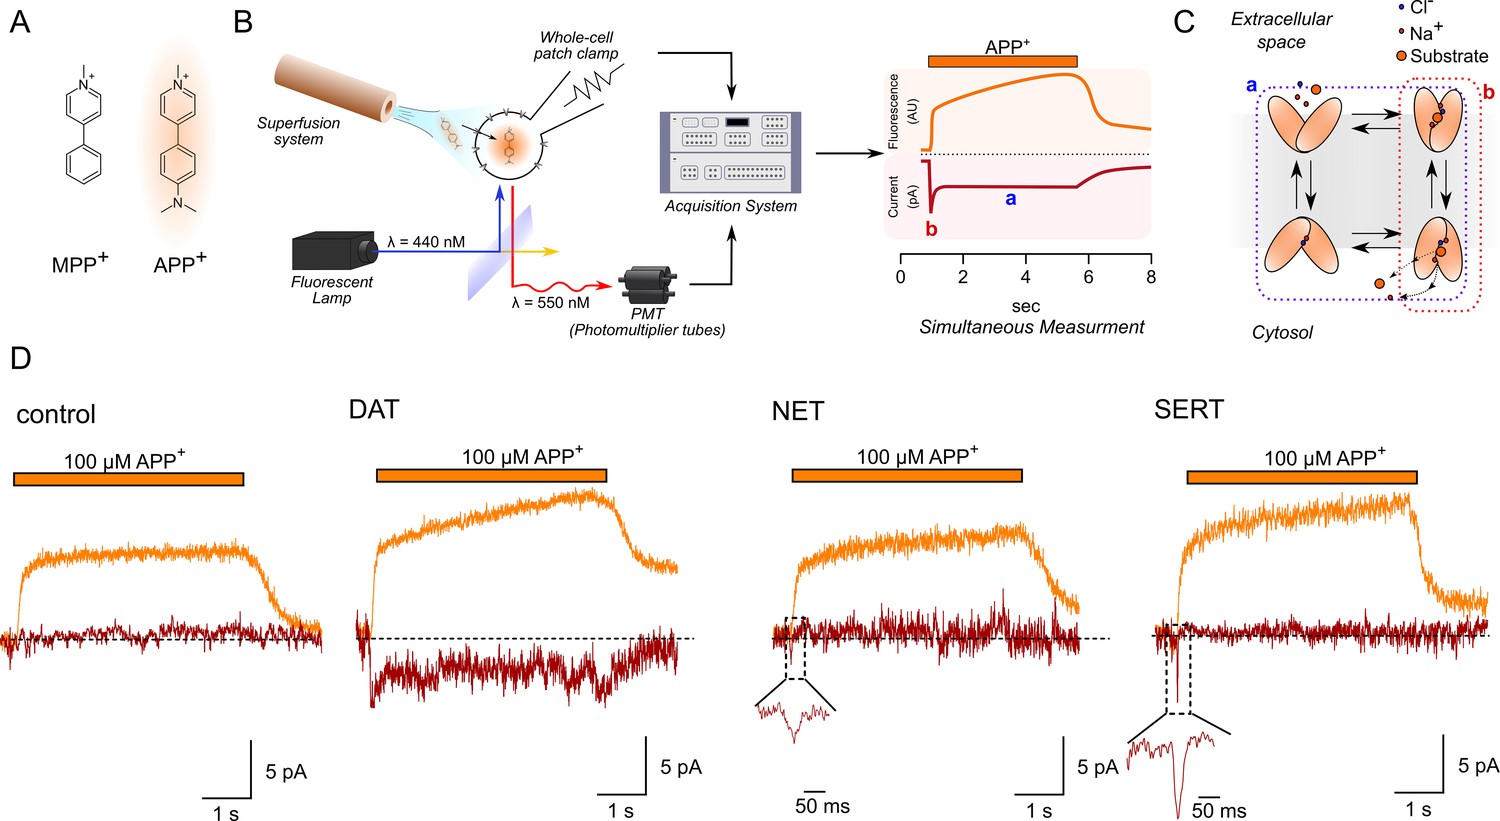
Simultaneous measurements of fluorescence and currents.
(A) APP+ is a fluorescent analogue of MPP+. Excitation and emission spectra of APP+ occur at wavelengths ranging from 410 to 450 nm and 510 to 550 nm, respectively, which depends on solvent properties. (B) Left, schematics of the setup used in this study. The setup included (1) a dichroic glass that specifically reflects light of 440 nm but allows transmission of those with a wavelength of 550 nm, (2) an inverted microscope with a x100 objective (for single-cell fluorescence recordings), (3) an electrode and patch-clamp amplifier that allows for voltage control, (4) a photomultiplier tube (PMT) that converts emitted fluorescence into electrical signal, and (5) and an acquisition system that allows for filtering, digitizing, and two-channel recordings of APP+-induced fluorescence and currents. Right, a theoretical trace for a two-channel recording that displays simultaneous APP+-induced currents (red trace) and fluorescence (orange trace) in real time. (C) A simplified scheme of a secondary active transporter that employs Na+ and Cl- as co-substrates. Substrate-induced currents comprise two components: peak current (reactions highlighted in red and b in (B), right) that represents movement of charged substrate/co-substrates through the membrane electric field and steady-state current (reactions highlighted in blue and a in (B), right) that represents transporters functioning in the physiological forward mode. (D) Representative traces of the APP+-induced currents and fluorescence in empty HEK293 cells or in HEK293 cells expressing dopamine transporter (DAT), norepinephrine transporter (NET), and serotonin transporter (SERT) patched under normal physiological ionic conditions. In all traces, the rapid rise and decline in fluorescence on applying and washing off APP+, respectively (see 'Results'), are shown. All three transporters showed a linear increase in fluorescence as a function of time, indicative of APP+ accumulation in cells expressing DAT, SERT, and NET. APP+ induced robust DAT-mediated currents that comprise both peak and steady-state currents. Only peak currents (represented as magnified inset) were seen on APP+ application to cells expressing NET and SERT. AU – arbitrary units.
Figure 1—figure supplement 1
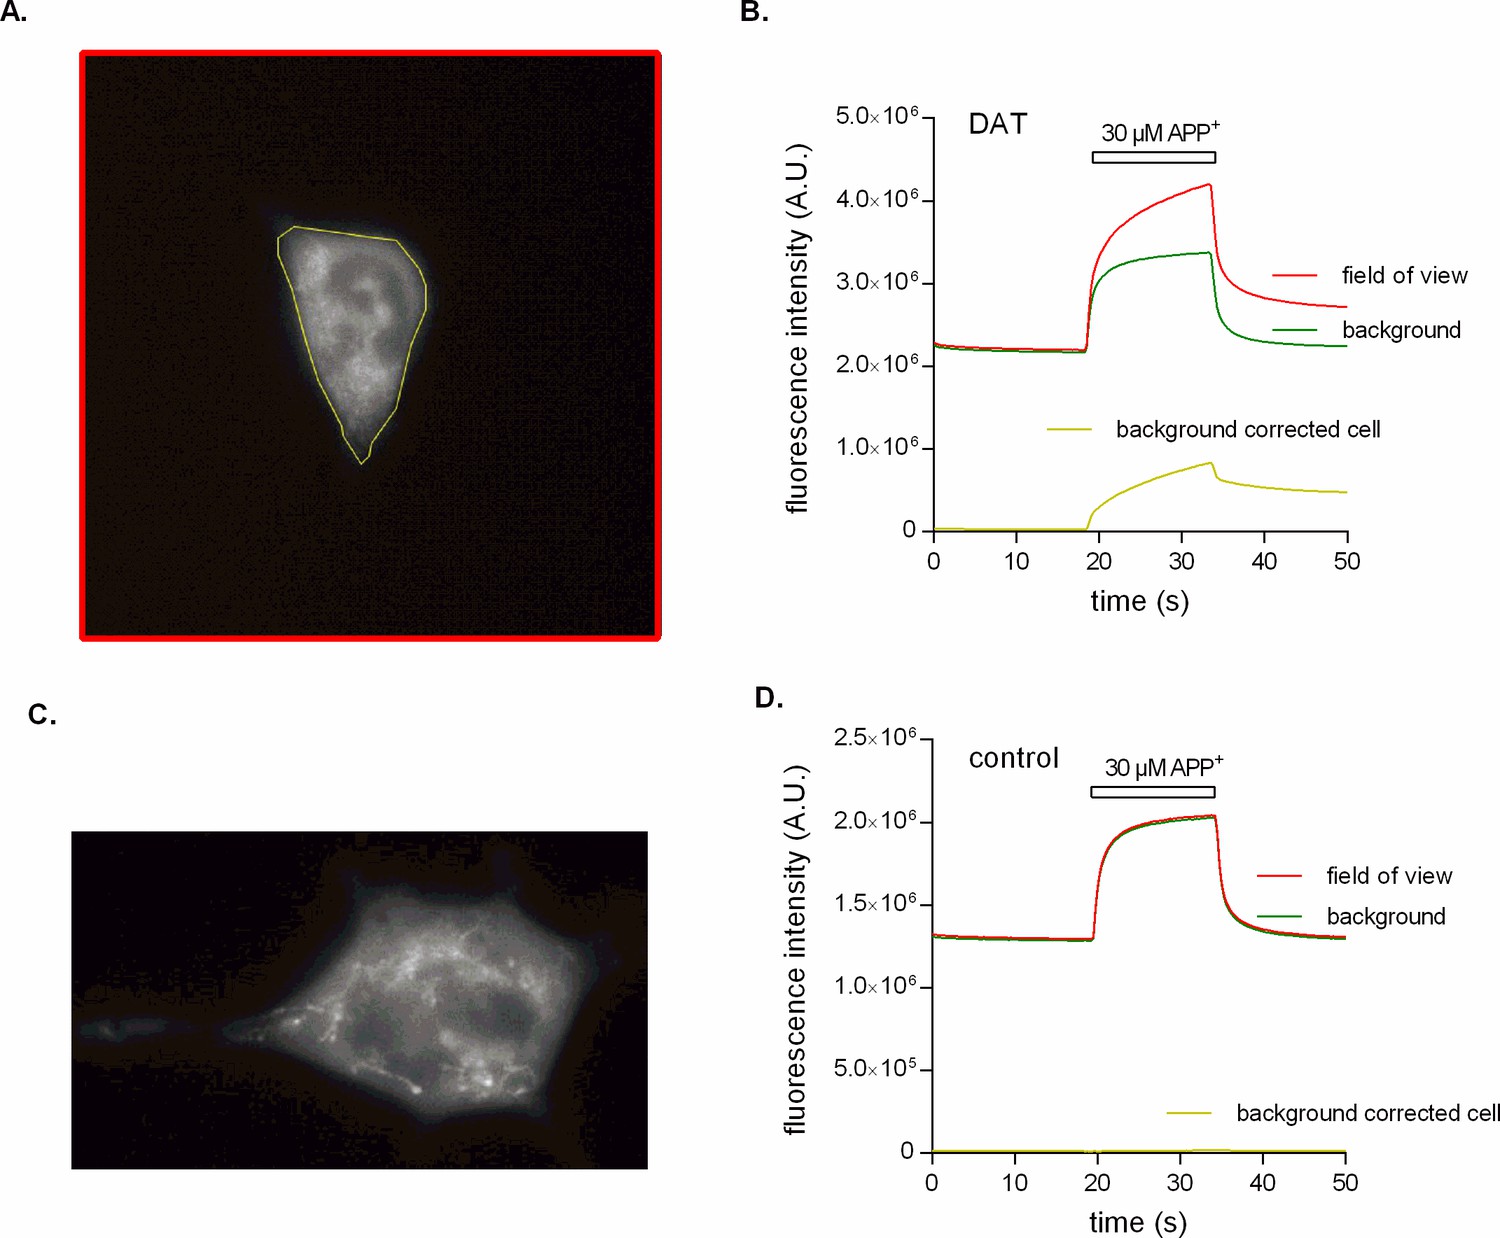
Epifluorescence recordings of APP+ accumulation.
(A) Epifluorescence image of an HEK293 cell stably expressing dopamine transporter (DAT). This image is one of many that were recorded with a sampling rate of 250 ms per frame (see Video 1 as the video attachment in additional files). The depicted frame shows the cell after it was exposed to 30 µM APP+. Indicated in yellow is the region of interest (ROI) that contains the cell, while the red ROI encompasses the entire field of view. (B) Time-dependent analysis of fluorescence intensities. The red line is the fluorescence intensity measured as a function of time over the entire field of view (red ROI in (A)). This is what a photomultiplier tube (PMT) records given its lack of spatial resolution. The camera, however, allows for separating the fluorescence signal arising from APP+ in solution (green line) from the fluorescence contributed by sequestered and cell-bound APP+ (yellow line). This analysis revealed that the fast component, which was also seen with the PMT, can almost be fully attributed to photons emitted by the state of low quantum yield adopted by APP+ in an aqueous solution. (C) An additional DAT-expressing cell after exposure to 30 µM APP+ for 15 s. It is evident from this image that APP+ adheres to intracellular membranes, where it remains even after its removal from the bath solution (see Video 2 as the video attachment in additional files). (D) APP+ is not transported into an untransfected HEK293 cell as seen in Video 3 (in additional files). This is evident by no difference (yellow line) in fluorescence intensity between the field of view (red line) and the background due to APP+ in solution (green line).
Figure 2 with 1 supplement
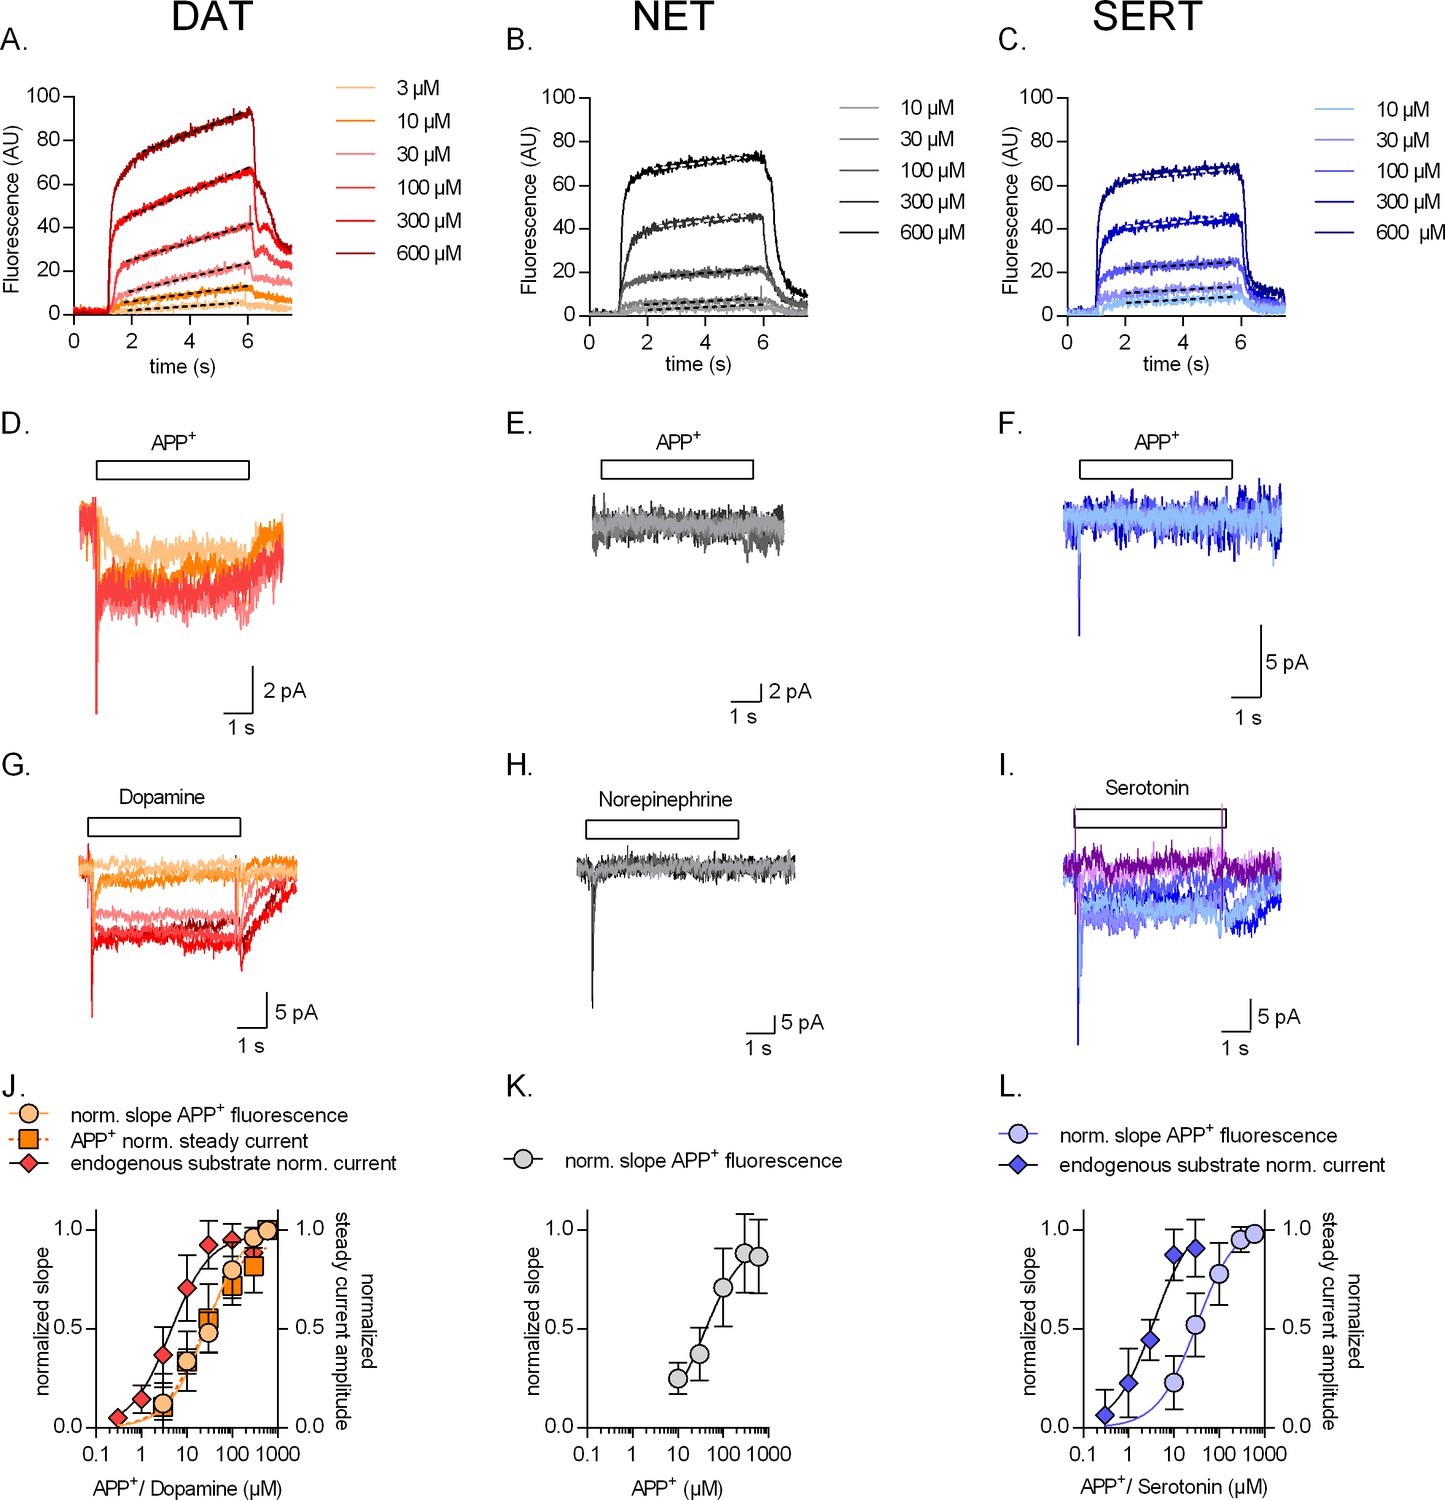
Concentration dependence of substrate uptake by monoamine transporters.
Representative single-cell traces of concentration-dependent increase in APP+-induced fluorescence (A–C) and concomitant currents (D–F) in dopamine transporter (DAT), norepinephrine transporter (NET), and serotonin transporter (SERT), respectively. Representative single-cell traces of currents induced by increasing concentrations of dopamine on DAT (G), norepinephrine on NET (H), and serotonin on SERT (I). (J) Normalized concentration response of APP+-induced fluorescence (KM = 27.7 ± 7.1 µM (n = 11)), APP+-induced steady-state currents (KM = 21.5 ± 10 µM (n = 6)), and dopamine-induced steady-state currents (KM = 4.4 ± 1.4 µM (n = 6)) in DAT-expressing HEK293 cells. (K) Normalized concentration response of APP+-induced fluorescence (KM = 37.3 ± 17 µM (n = 9)) in HEK293 cells expressing NET. Neither norepinephrine nor APP+ induced any steady-state currents in NET (even at the highest concentration tested, i.e., 600 µM). (L) Normalized concentration response of APP+-induced fluorescence (KM = 32.0 ± 13 µM (n = 6)) and serotonin-induced steady-state currents (KM = 3.6 ± 1.4 µM (n = 9)) in SERT-expressing HEK293 cells. APP+ did not induce any steady-state currents in SERT (even at the highest concentration tested, i.e., 600 µM). All experiments were performed under physiological ionic conditions. All fluorescence and current amplitudes were normalized to those obtained at 600 µM (which was set to 1) and the data points were fitted with a rectangular hyperbola. All datasets are represented as means ± SD. AU – arbitrary units, norm. – normalized.
Figure 2—figure supplement 1
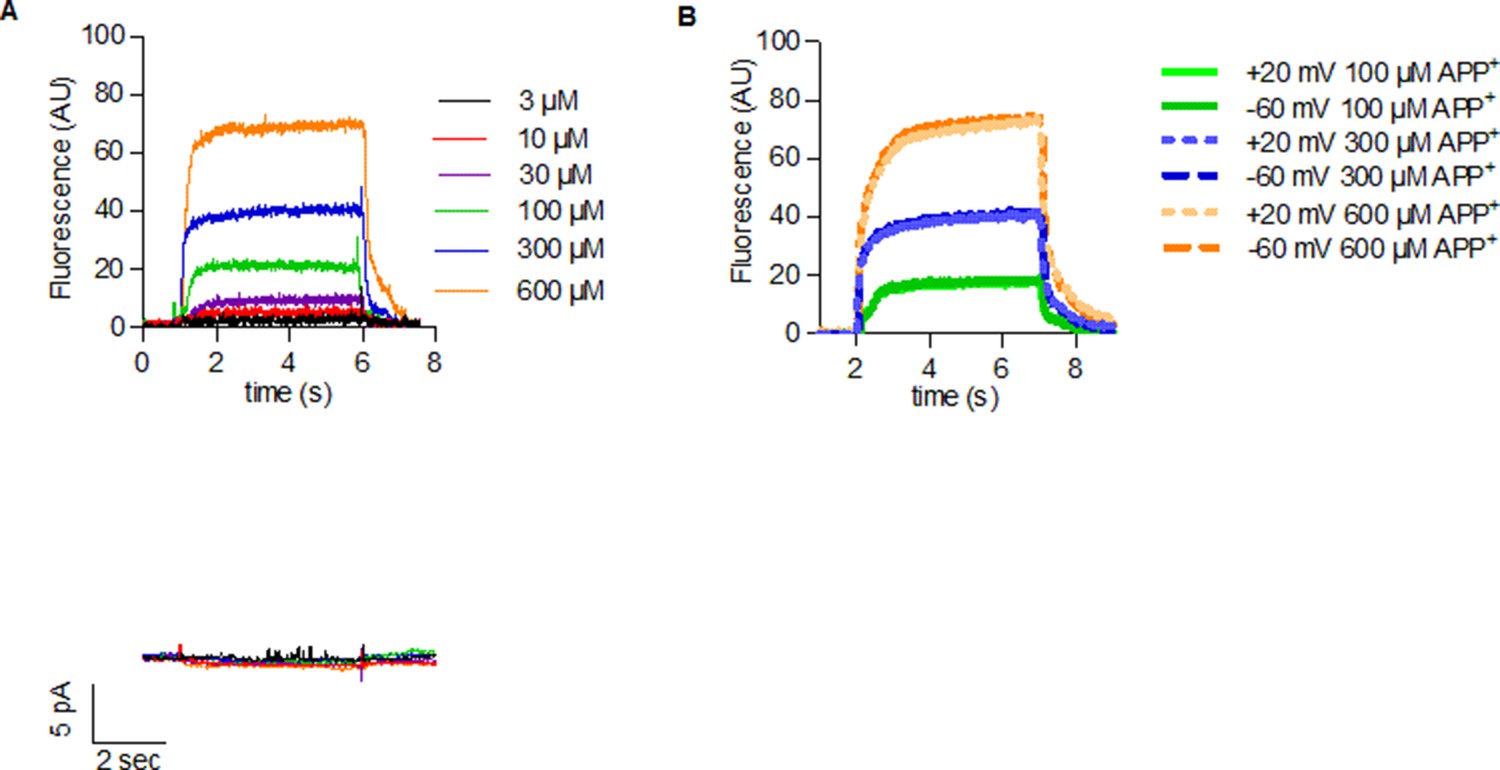
APP+ uptake in control cells.
(A) Representative traces of concentration response of APP+-induced fluorescence (top) and currents (below) in a control untransfected HEK293 cell. As the traces indicate, there was no APP+ accumulation or APP+-induced currents in control cells (this figure and Figure 2 for DAT-, SERT-, and NET-mediated APP+ uptake). (B) Representative trace of a single untransfected HEK239 cell indicating voltage having no effect on APP+ uptake by control cells (this figure and Figure 3 for voltage dependency of DAT-, NET-, and SERT-mediated APP+ uptake).
Figure 3
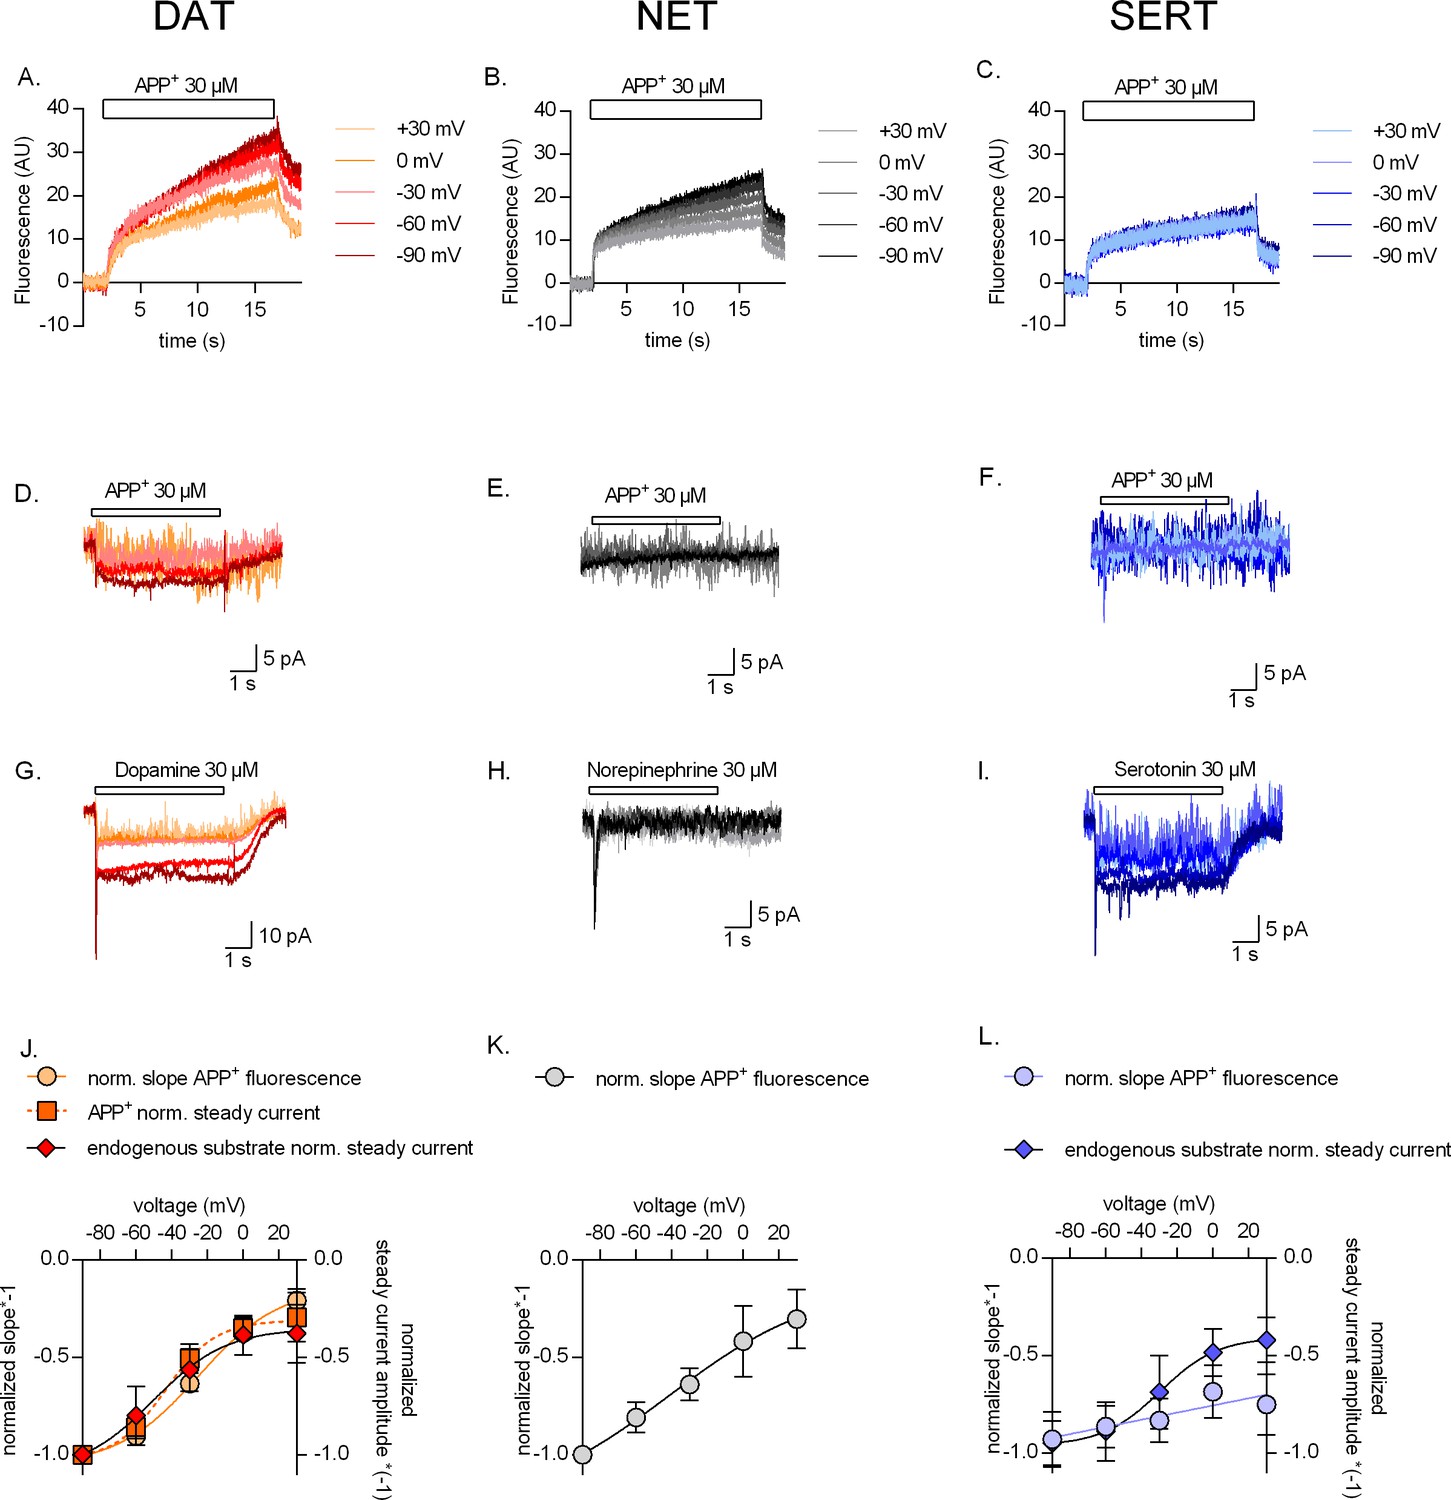
Voltage dependence of APP+ uptake by monoamine transporters.
Representative single-cell traces of APP+-induced fluorescence (A–C) and concomitant currents (D–F) under different voltages in dopamine transporter (DAT), norepinephrine transporter (NET), and serotonin transporter (SERT), respectively. APP+ was applied at concentrations of 30 µM. Representative single-cell traces of currents induced by dopamine (30 µM) on DAT (G), norepinephrine (30 µM) on NET (H), and serotonin (30 µM) on SERT (I) under different voltages. (J) Normalized voltage dependency of APP+-induced fluorescence (circle symbols, n = 6), APP+-induced steady-state currents (square symbols, n = 6), and dopamine-induced steady-state currents (diamond symbols, n = 6) in DAT-expressing HEK293 cells. (K) Normalized voltage dependency of APP+-induced fluorescence (circle symbols, n = 6) in HEK293 cells expressing NET. Neither norepinephrine nor APP+ induced any steady-state currents in NET. (L) Normalized voltage dependency of APP+-induced fluorescence (circle symbols, n = 6) and serotonin-induced steady-state currents (diamond symbols, n = 11) in SERT-expressing HEK293 cells. APP+ did not induce any steady-state currents in SERT. All experiments were performed under physiological ionic conditions. All fluorescence and current amplitudes were normalized to those obtained at −90 mV (which was set to 1) and the data points were fitted to the Boltzmann equation (except APP+ uptake by SERT, which was fitted to a line). All datasets are represented as means ± SD. AU – arbitrary units, norm. – normalized. We note that the sigmoidal Boltzmann and the line function are both arbitrary fits to the data. Neither one of them are suitable to model the processes, which underlie the depicted voltage dependence. The decision to use one or the other was based on the fidelity of the resulting fit.
Figure 4

The effect of intracellular cations on transporter mediated APP+ uptake.
Rate of APP+-associated fluorescent uptake (total rise in absolute fluorescence/unit time – AU/sec) measured in dopamine transporter (DAT) (A and D), norepinephrine transporter (NET) (B and E), and serotonin transporter (SERT) (C and F) under different intracellular conditions and different voltages. Pipette solutions include the physiological intracellular ionic conditions (163 mM Kin+, circle symbols), an intracellular condition devoid of Nain+ and Kin+ (163 mM NMDGin+, square symbols), or an intracellular environment of high Na+ (163 mM Nain+, diamond symbols). All data points were fitted to the line equation. The dashed lines in (D–F) are the same as those obtained by fitting data points obtained from 163 mM Kin+ from (A–C) for the respective transporters. The slope of the lines in the presence of either 163 mM NMDGin+ or 163 mM Kin+ in (A) (DAT), (B) (NET), and (C) (SERT) was not significantly different (F-test). The p-values were 0.42, 0.65, and 0.63, respectively. This suggest that intracellular Kin+ does not affect the voltage dependence of APP+ uptake of either of the three monoamine transporters. The slopes of the lines, in the absence and presence of 163 mM Nain+, in (D) (DAT, p=0.0135) and (E) (NET, p<0.0001) were different (F-test). In (F) (SERT), the slope was not significantly different (p=0.66), while the y-intercept was (p<0.0001). This analysis is consistent with the idea that intracellular Na+ hampers APP+ through all three transporters. All datasets are represented as means ± SD; the number of experiments in each individual dataset was six; AU – arbitrary units.
Figure 5 with 2 supplements
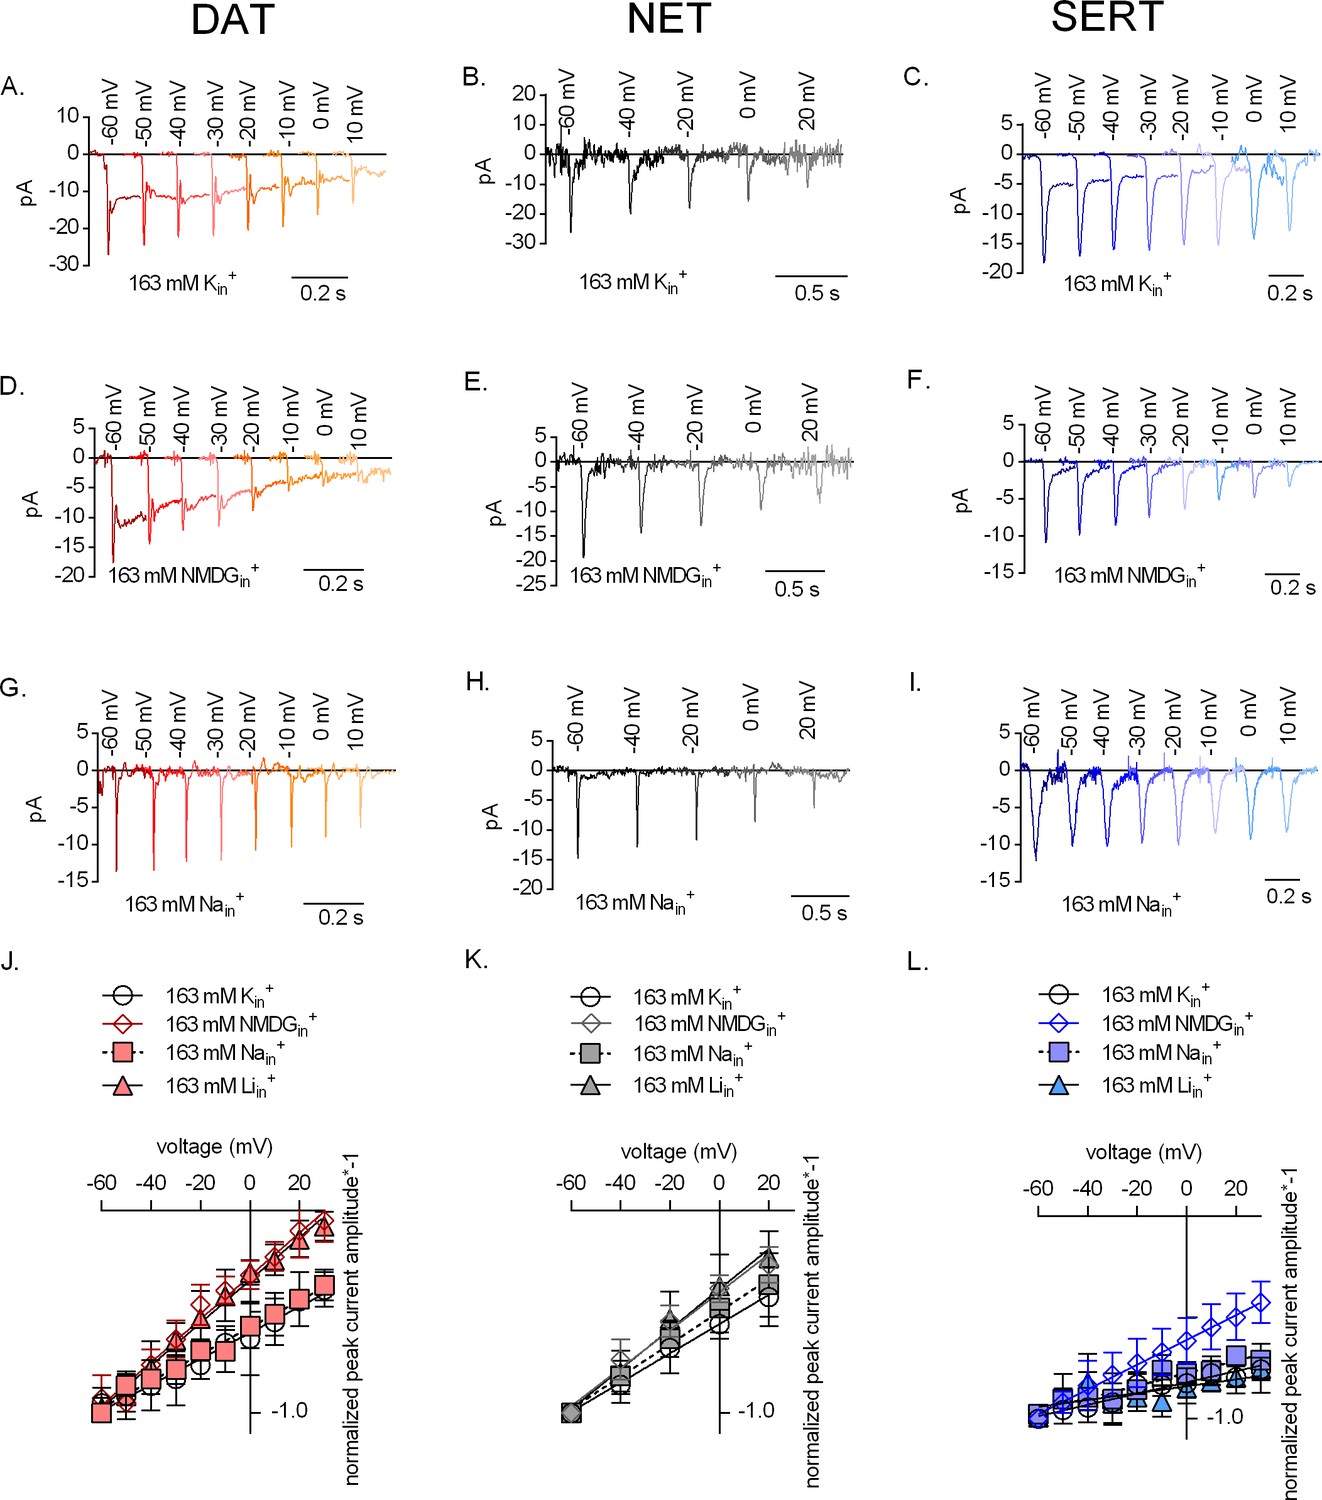
The effect of intracellular cations on the voltage dependence of monoamine induced peak currents.
Representative single-cell traces of current profiles elicited by 30 µM dopamine in dopamine transporter (DAT) (A, D, and G), 30 µM norepinephrine in norepinephrine transporter (NET) (B, E, and H), and 30 µM serotonin in serotonin transporter (SERT) (C, F, and I) under different intracellular conditions and different voltages. Peak current–voltage relationships of DAT (J), NET (K), and SERT (L) under different pipette solutions that include the physiological intracellular ionic conditions (163 mM Kin+, circle symbols), an intracellular condition devoid of Nain+ and Kin+ (163 mM NMDGin+, diamond symbols), an intracellular environment of high Na+ (163 mM Nain+, square symbols), and high intracellular Li+ (163 mM Liin+, triangle symbols). Peak current amplitudes were normalized to those obtained at −60 mV (which was set to 1) and the individual datasets were fitted to the line equation. The slope of the voltage dependence in the presence and absence of 163 mM Kin+ was significantly different for all three transporters (DAT (p<0.0001), NET (p=0.019), and SERT (p<0.0001); F-test). All data points are represented as means ± SD.
Figure 5—figure supplement 1
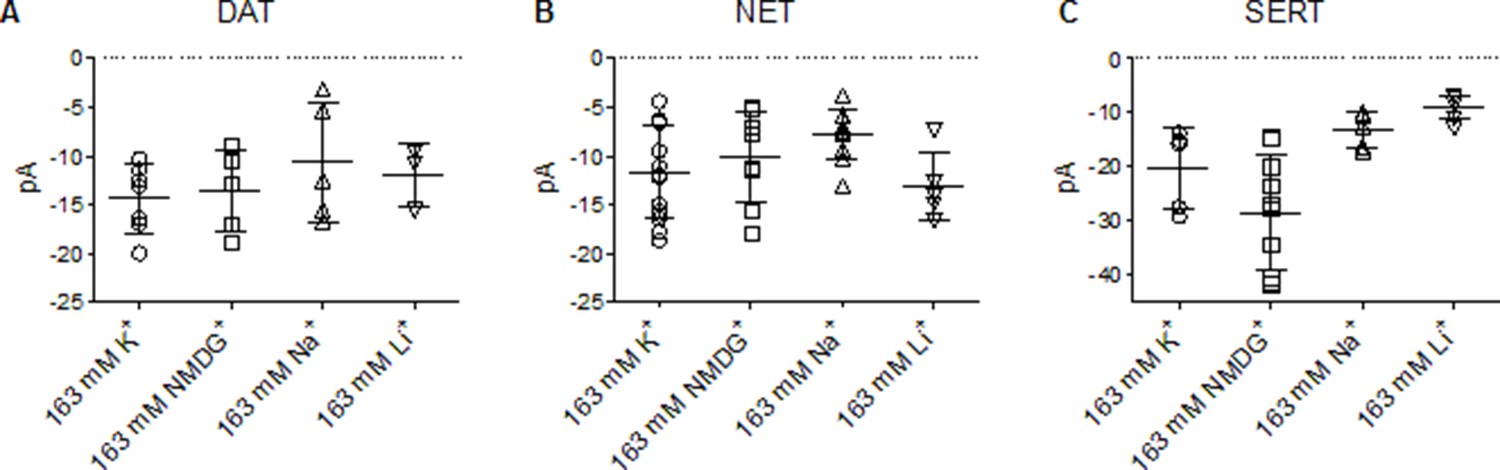
Absolute values of the peak amplitudes elicited in DAT, NET, and SERT.
(A, B, and C) are plots of absolute peak amplitudes elicited by cells expressing dopamine transporter (DAT), norepinephrine transporter (NET), or serotonin transporter (SERT) on rapid application of 30 µM dopamine, 100 µM norepinephrine, and 30 µM serotonin, respectively, under different intracellular conditions and at −60 mV. These include pipette solutions that contain either 163 mM Kin+, 163 mM NMDGin+, 163 mM Nain+, or 163 mM Liin+. The means in (A) are as follows: 163 mM Kin+: 14.4 ± 3.4 pA; 163 mM NMDGin+: 13.6 ± 4.2 pA; 163 mM Nain+: 10.7 ± 6.1 pA; 163 mM Liin+: 12.0 ± 3.1 pA. The means in (B) are as follows: 163 mM Kin+: 11.6 ± 4.8 pA; 163 mM NMDGin+: 10.1 ± 4.7 pA; 163 mM Nain+: 7.7 ± 2.6 pA; 163 mM Liin+: 13.1 ± 3.5 pA. The means in (C) are as follows: 163 mM Kin+: 20.3 ± 7.4 pA; 163 mM NMDGin+: 28.4 ± 10.5 pA; 163 mM Nain+: 13.3 ± 3.3 pA; 163 mM Liin+: 9.0 ± 2.1 pA. All datasets are represented as means ± SD (n > 3 per condition). pA – picoampere.
Figure 5—figure supplement 2
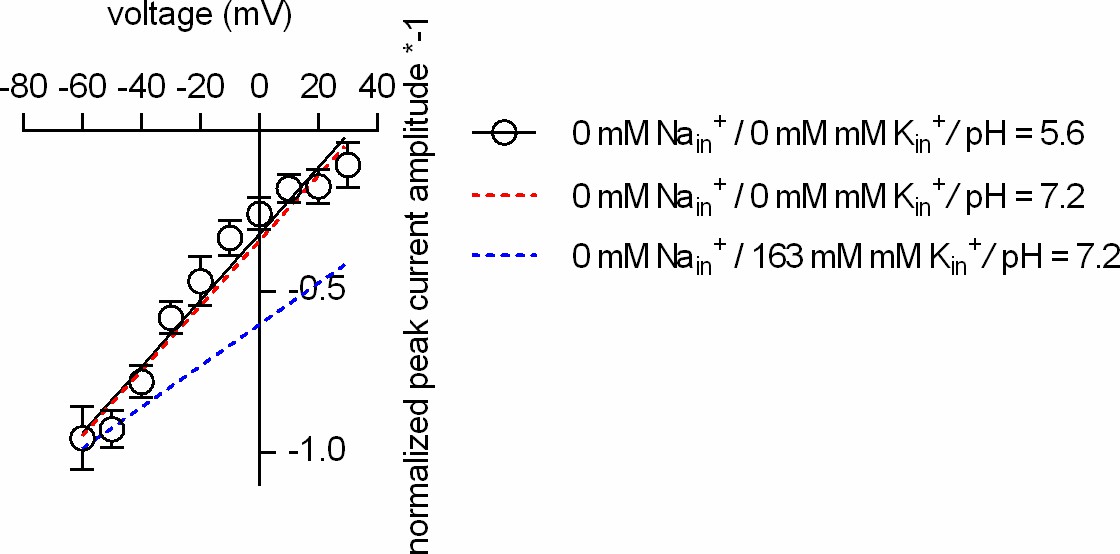
Intracellular protons cannot replace Kin+in DAT.
Plotted is the normalized peak current amplitude as a function of voltage. The peak currents were elicited by rapid application of 30 µM dopamine. The dashed red and blue lines are the fits to the data in Figure 5J. At pH 5.6, intracellularly (open circles; n = 5; error bars indicate SD), the slope of the voltage dependence remains steep when Nain+ and Kin+ are absent.
Figure 6 with 1 supplement
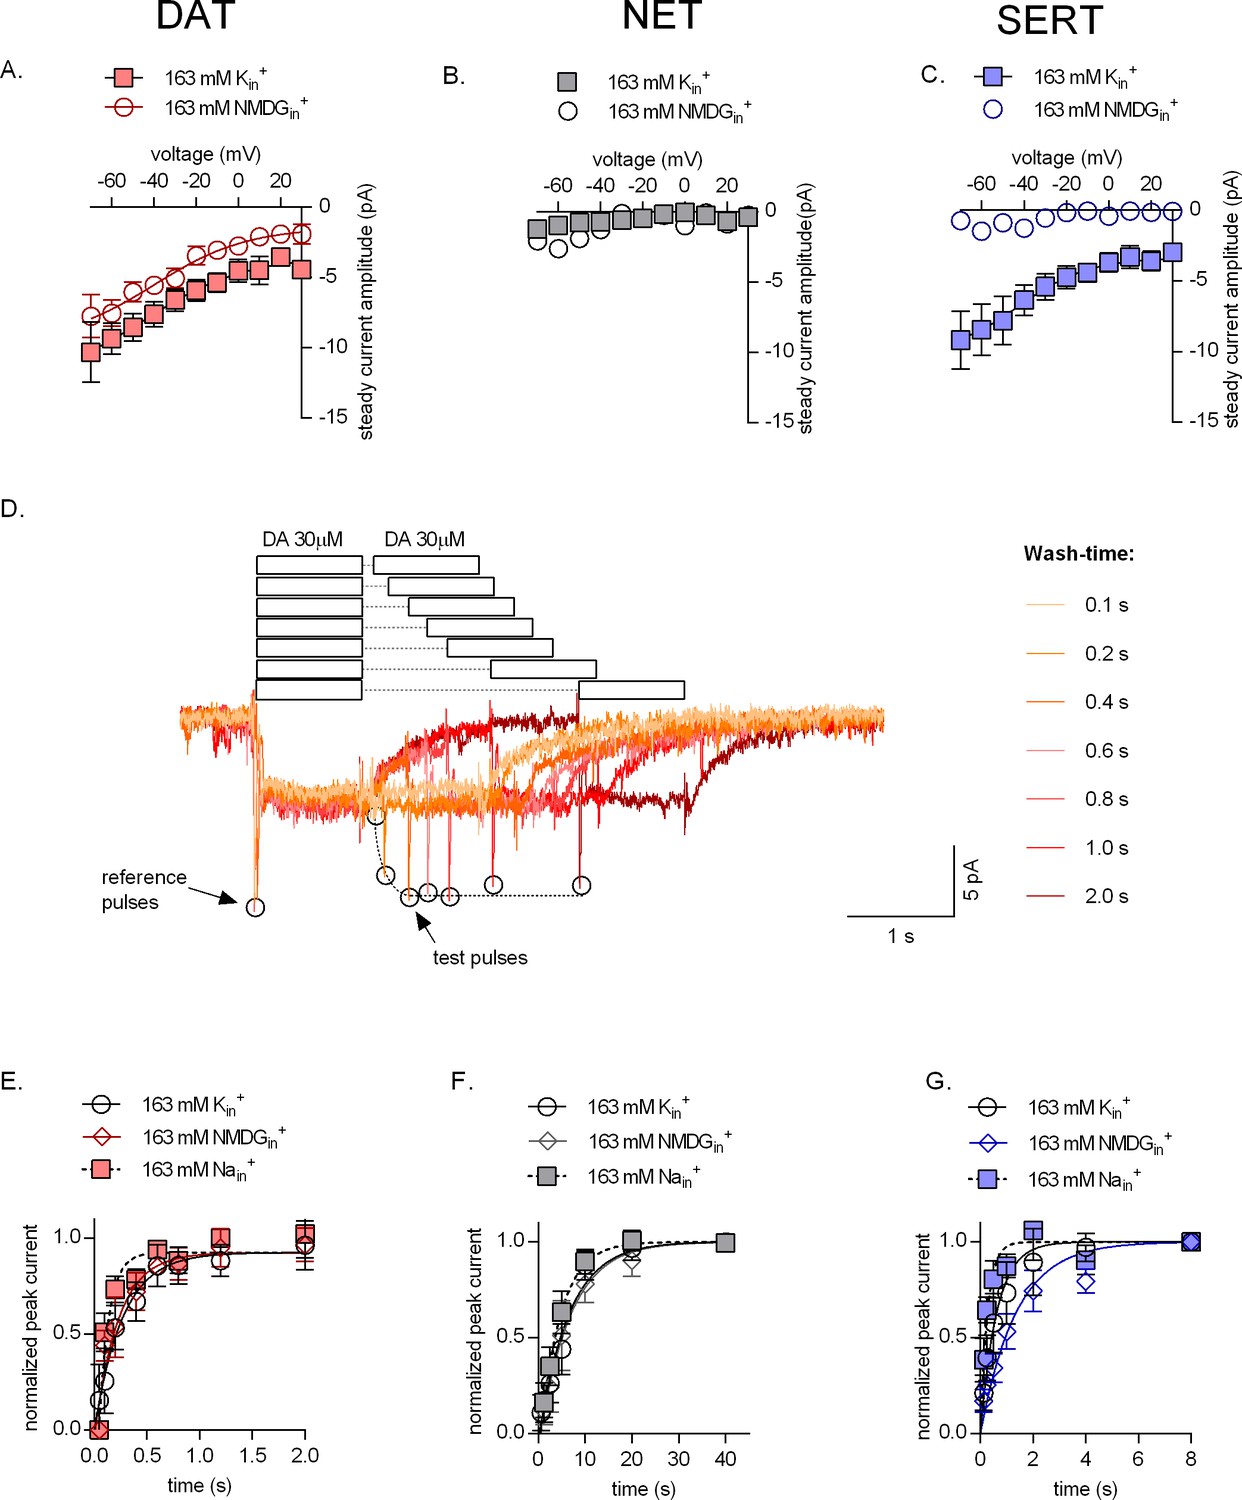
Effect of intracellular potassium on the catalytic rate of monoamine transporters.
(A, B, C) Amplitudes of steady-state currents elicited by 30 µM dopamine on dopamine transporter (DAT) and 30 µM norepinephrine on norepinephrine transporter (NET), and 30 µM serotonin on serotonin transporter (SERT), respectively, as a function of voltage under physiological intracellular conditions (square symbols) and an intracellular environment devoid of Na+ and K+ (163 mM NMDGin+, circle symbols). NET did not elicit any steady-state currents on exposure to norepinephrine. The data points in (A), (B), and (C) are represented as means ± SEM. The lines indicate fits of the Boltzmann equation to the data points. For DAT (A), we compared the amplitude of the current in the presence and absence of 163 mM Kin+ at -20 mV. The difference in amplitude at this potential was significant (p=0.0334); Mann Whitney test (n = 9; each). (D) Representative single-cell trace of the two-pulse protocol: 30 µM dopamine was applied to a DAT-expressing cell to generate a reference pulse followed by variable wash times and a repeated pulse of 30 µM dopamine again (test pulse). The peak current amplitudes (which represent available binding sites on completion of the transport cycle) are plotted as a function of time to determine transporter catalytic rate. Catalytic rates determined for DAT (E), NET (F), and SERT (G) under intracellular conditions that are physiological (163 mM Kin+, circle symbols), devoid of intracellular Na+ or K+ (163 mM NMDGin+, diamond symbols) or contain high intracellular Na+ (163 mM Nain+, square symbols). Peak current amplitudes obtained at each test pulse were normalized to those of the reference peak (which was set to 1) and fitted with a mono-exponential function. The catalytic rates obtained were as follows: DAT (163 mM Kin+ - 3.74 ± 0.76 s−1; 163 mM Nain+ - 10.68 ± 2.14 s−1; 163 mM NMDGin+ - 4.45 ± 0.93 s−1), NET (163 mM Kin+ - 0.15 ± 0.013 s−1; 163 mM Nain+ - 0.22 ± 0.016 s−1; 163 mM NMDGin+ - 0.15 ± 0.014 s−1), and SERT (163 mM Kin+ - 1.61 ± 0.12 s−1; 163 mM Nain+ - 2.57 ± 0.28 s−1; 163 mM NMDGin+ - 0.74 ± 0.058 s−1). The data in (E), (F), and (G) are represented as means ± SD (n = 5 for each condition).
Figure 6—figure supplement 1
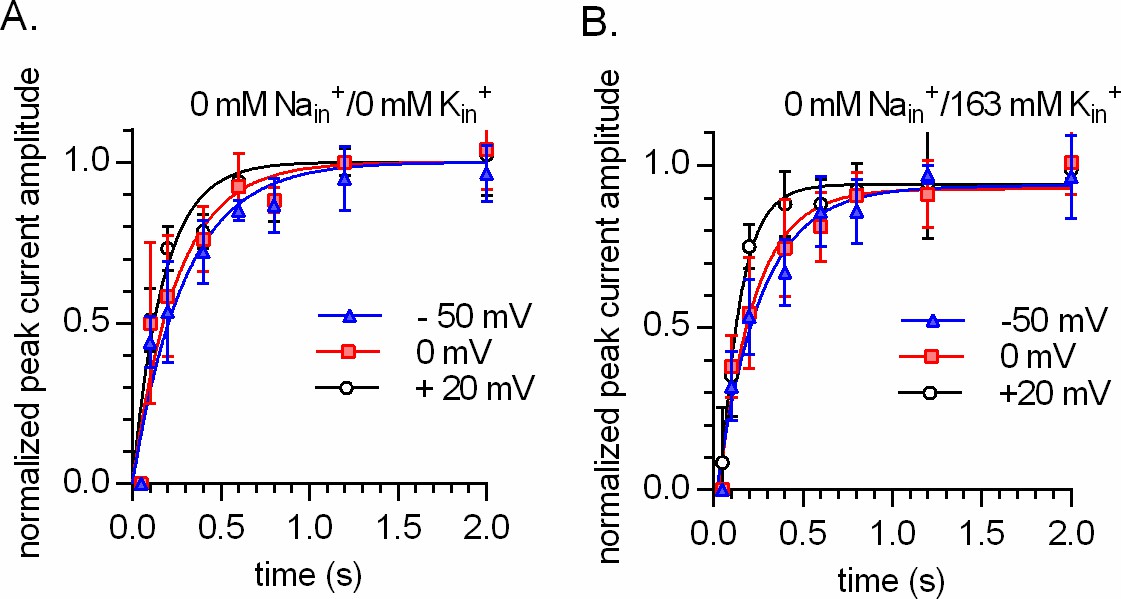
Intracellular K+does not render the time course of peak current recovery of DAT voltage independent.
(A and B) show the results from two-pulse protocols conducted at -50 mV (triangles), 0 mV (squares), and +20 mV (circles). The tested conditions were 163 NMDGin+ in (A) and 0 mM Nain/163 mM Kin+ in (B) (n = 6; each error bar indicates SD). The peak current was elicited by the application of 30 µM dopamine. The solid lines in blue, red, and black are monoexponential fits to the data. The rates in (A) were 3.407 s−1 (95% confidence interval: 2.796–4.017 s−1), 3.996 s−1 (95% confidence interval: 3.056–4.936 s−1), and 5.712 s−1 (95% confidence interval: 4.470–6.954 s−1) for -50 mV, 0 mV, and +20 mV, respectively. The rates in (B) were 3.143 s−1 (95% confidence interval: 2.626–3.660 s−1), 3.383 s−1 (95% confidence interval: 2.734–4.031 s−1), and 4.920 s−1 (95% confidence interval: 3.800–6.040 s−1) for -50 mV, 0 mV, and +20 mV, respectively.
Figure 7 with 2 supplements
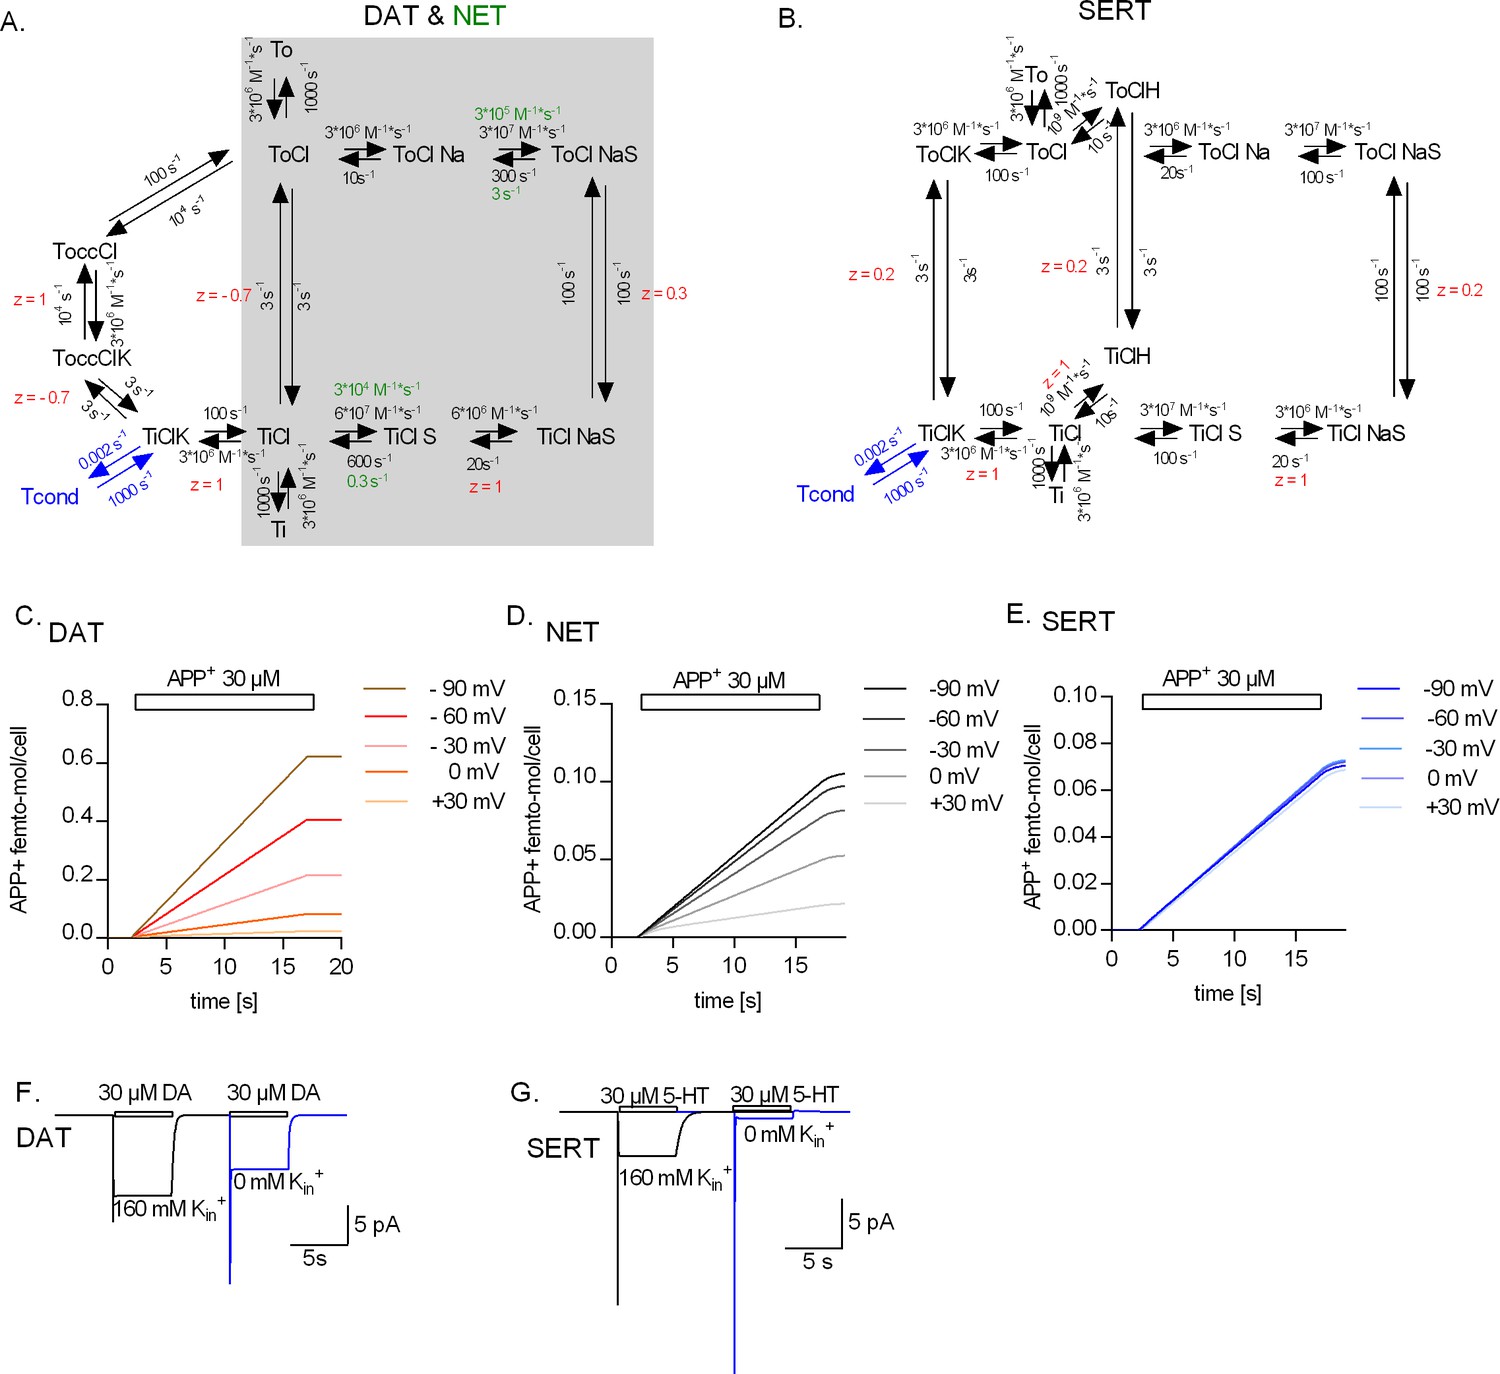
Kinetic models of the catalytic cycle of the monoamine transporters.
(A) Reaction scheme of dopamine transporter (DAT) and norepinephrine transporter (NET). Shaded in grey is the original scheme proposed by Erreger et al., 2008. The original scheme is nested in the refined model. We assumed that DAT and NET not only share the same scheme but also most parameters. However, to account for the smaller turn-over rate of NET and the absence (or a lack of detection) of the steady current component on challenge with norepinephrine, we posited slower substrate-binding kinetics for NET (rate constants indicated in green). (B) Reaction scheme of serotonin transporter (SERT). Simulated APP+ uptake through DAT (C), NET (D), and SERT (E). kon and koff for APP+ were set to 9*105 s−1*M−1 and 30 s−1, 3*105 s−1*M−1 and 1 s−1, and 1*105 s−1*M−1 and 1 s−1 for DAT, NET, and SERT, respectively. Simulated substrate-induced currents for DAT (F) and SERT (G) in the presence (black trace) and absence (blue trace) of 163 mM Kin+. The current in the presence of 163 mM Kin+ is the sum of the coupled and uncoupled currents. The current in the absence of Kin+ is the coupled current in isolation. In simulations (F) and (G), we assumed a membrane voltage of -60 mV.
Figure 7—figure supplement 1
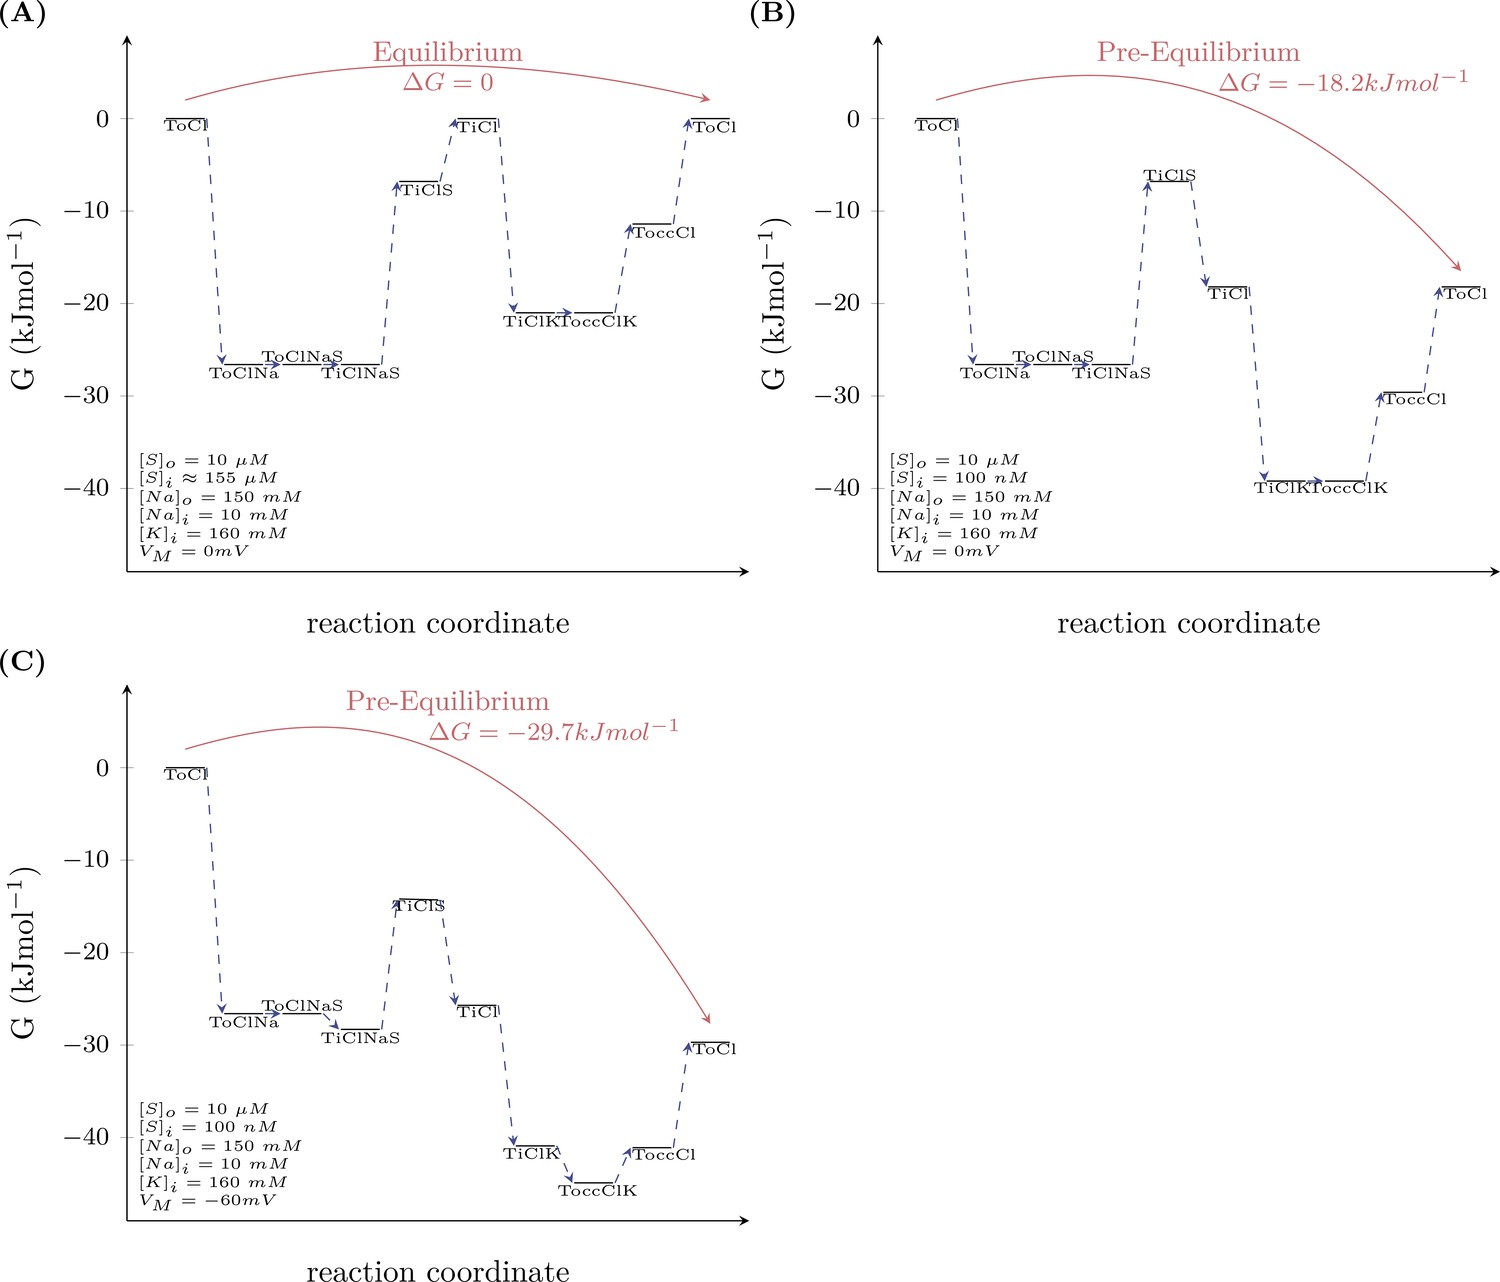
Model prediction of the energy landscape of the transport cycle endured by DAT.
Schemes (A and B) map out the Gibbs free energy of the outer loop of the kinetic model of dopamine transporter (DAT) (see scheme in Figure 7A) at 0 mV (A) and −60 mV (B). For calculating the Gibbs free energy of this loop, we assumed a pre-equilibrium condition (i.e., an extracellular and intracellular substrate concentration that we arbitrarily set to 10 µM and 100 nM, respectively). As shown in both schemes, the Gibbs free energy between the ‘initial-left’ and the ‘final-right’ state is negative. Accordingly, the multistep reaction can proceed spontaneously and the voltage contributes to the extent by which the Gibbs free energy changes. In scheme (C), we mapped out the Gibbs free energy at equilibrium (the difference in Gibbs free energy between the ‘initial’ and the ‘final’ state is zero). This condition was met when the intracellular substrate concentration was 155 µM. At this intracellular substrate concentration, the energy stored in the substrate gradient notably matched exactly the energy of the Na+ gradient. The model therefore predicts that no energy is dissipated as heat.
Figure 7—figure supplement 2
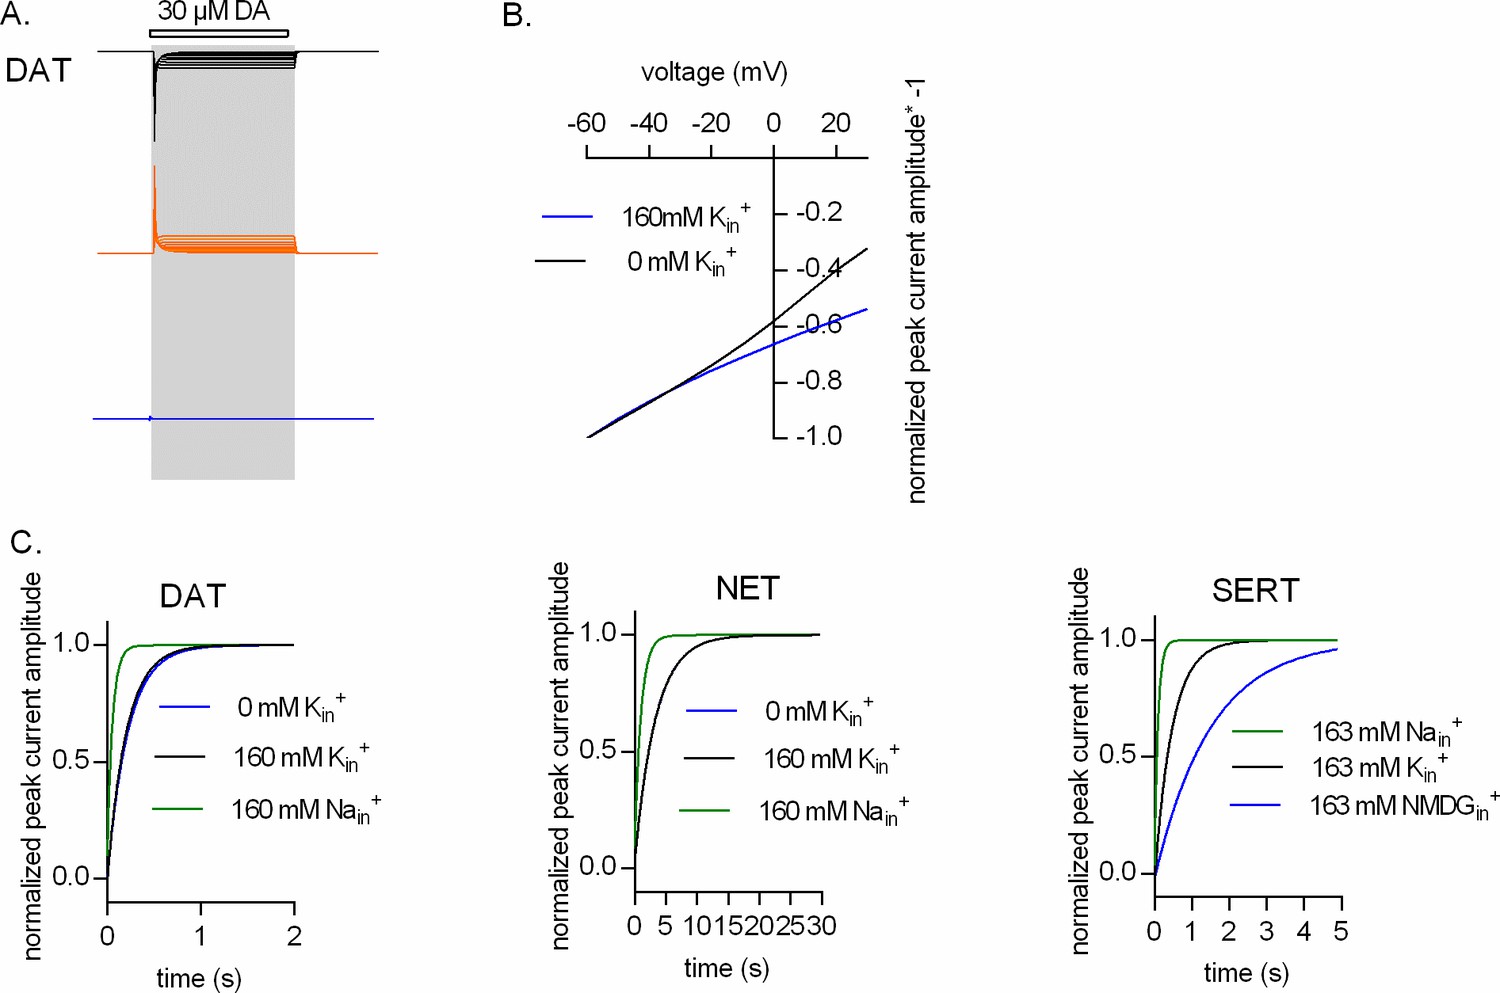
Kin+ binding to inward-facing state of DAT affects the voltage dependence of the peak current.
(A) Our model posits sequential binding and unbinding of Nain+ and Kin+ to the inward-facing conformations and assigns equal valences to these reactions. Thus, the inwardly directed current, produced by outgoing Nain+ ions dissociating into the cytosol, is canceled out by the outwardly directed current generated by the incoming Kin+ ions. This point is illustrated for dopamine transporter (DAT), which shows the simulated current components produced by dissociating Nain+ ions (black traces, upper panel) and associating Kin+ ions (orange traces, middle panel) over the voltage range from -60 mV to +30 mV. Because of the rapid kinetics of ion binding/unbinding, these currents cancel each other out: their sum is zero (blue trace, bottom panel). (B) In the absence of Kin+, the current, which is generated by Na+ ions dissociating into the cytosol, is not canceled out. As a consequence, the voltage dependence of the peak current in the absence of Kin+ is steeper than that in its presence. (C) Simulated peak current recovery in the presence of 160 mM Nain+ (green line), 160 mM Kin+ (black line), and 160 mM NMDGin+ (blue line) for DAT (left panel), norepinephrine transporter (NET) (middle panel), and serotonin transporter (SERT) (right panel).
Videos
Video 1
Accelerated video of APP+ uptake by an HEK293 cell stably expressing DAT (30 µM APP+ was applied at time point 2 s in the video and terminated at time point 4 s in the video).
The actual duration of APP+ application was 15 s. The relevant analysis of this video is shown in Figure 1—figure supplement 1A and B.
Video 2
Accelerated video of APP+ uptake by an HEK293 cell stably expressing DAT (30 µM APP+ was applied at time point 2 s in the video and terminated at time point 4 s in the video).
The actual duration of APP+ application was 15 s. The relevant image of this video that highlights intracellular adherence of APP+ is shown in Figure 1—figure supplement 1C.
Video 3
Accelerated video of a lack of APP+ uptake by an untransfected HEK293 cell (30 µM APP+ was applied at time point 2 s in the video and terminated at time point 4 s in the video).
The actual duration of APP+ application was 15 s. The relevant analysis of this video is shown in Figure 1—figure supplement 1D.
Additional files
Download links
A two-part list of links to download the article, or parts of the article, in various formats.
Downloads (link to download the article as PDF)
Open citations (links to open the citations from this article in various online reference manager services)
Cite this article (links to download the citations from this article in formats compatible with various reference manager tools)
Handling of intracellular K+ determines voltage dependence of plasmalemmal monoamine transporter function
eLife 10:e67996.
https://doi.org/10.7554/eLife.67996


