Pak1 and PP2A antagonize aPKC function to support cortical tension induced by the Crumbs-Yurt complex
- Centre de Recherche sur le Cancer, Université Laval, Canada
- axe oncologie du Centre de Recherche du Centre Hospitalier Universitaire de Québec-UL, Canada
- Institute of Biomedical Engineering, University of Toronto, Canada
- Ted Rogers Centre for Heart Research, University of Toronto, Canada
- Department of Cell and Systems Biology, University of Toronto, Canada
- Developmental and Stem Cell Biology Program, The Hospital for Sick Children, Canada
Figures
Figure 1
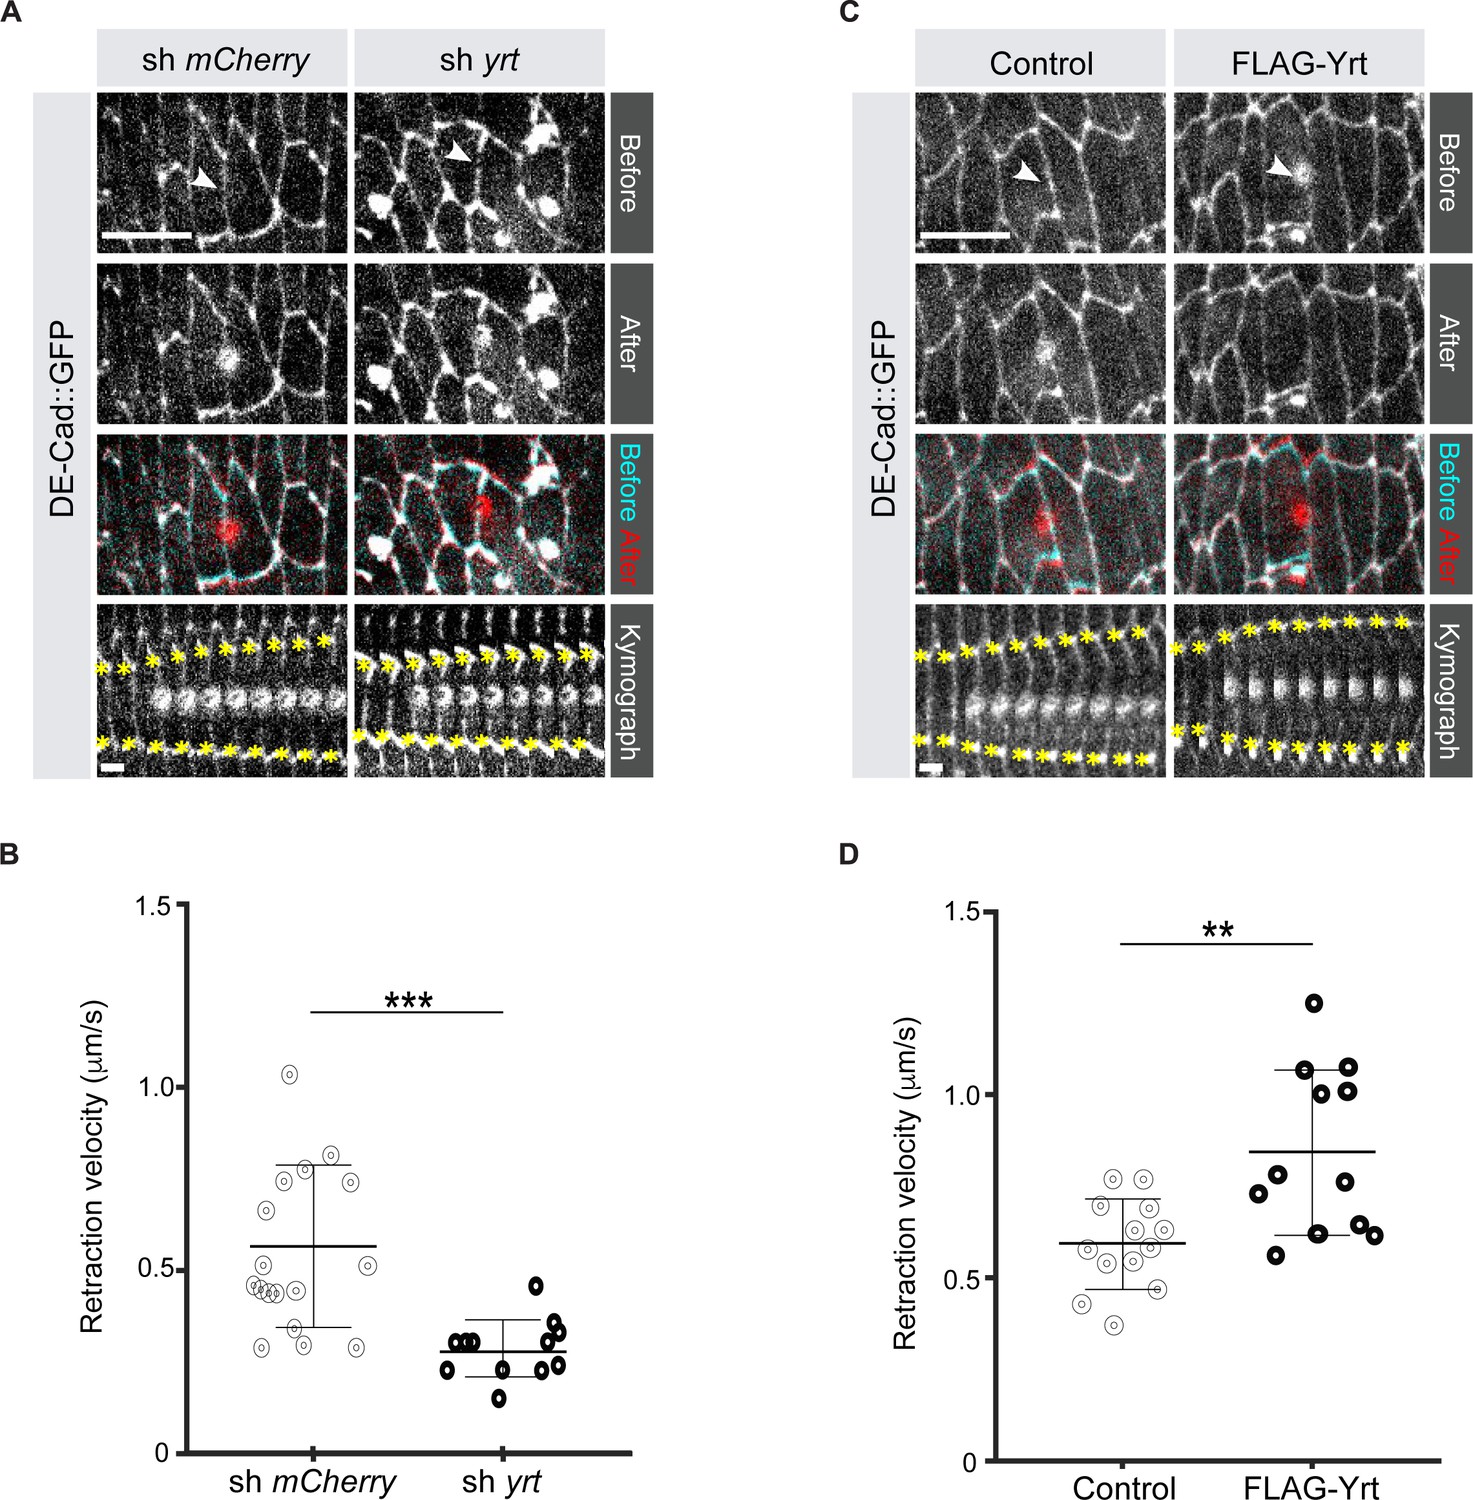
Yrt increases cortical tension.
(A) Epidermal cells in stage 14 Drosophila embryos expressing DE-cad::GFP and shRNA against mCherry or yrt before (cyan in merge) and after (red in merge) laser ablation of a cell-cell interface (white arrowheads). Scale bar, 10 µm. Circular marks visible after ablation indicate where the UV laser passed through the vitelline membrane, creating autofluorescent holes. Bottom panel shows kymographs of interface retraction over time (scale bar, 4 s). Yellow asterisks indicate the position of the tracked vertices. (B) Retraction velocity after laser ablation in embryos expressing shRNA against mCherry (n = 17 junctions in 17 different embryos) or yrt (n = 12). (C) Epidermal cells in stage 14 Drosophila embryos expressing DE-cad::GFP and wild-type levels of Yrt expression (left panel; expression of LacZ as control) or overexpression of FLAG-Yrt (right panel) before (cyan in merge) and after (red in merge) ablation of a cell-cell interface (white arrowheads). Scale bar, 10 µm. (D) Retraction velocity after laser ablation in embryos with wild-type Yrt expression (n = 13 junctions in 13 different embryos) or overexpressing FLAG-Yrt (n = 12). In B and D, error bars indicate the standard deviation (s.d.), and the black bold line denotes the mean. ** p ≤ 0.01, *** p ≤ 0.001 (Mann-Whitney test).
-
Figure 1—source data 1
Yrt increases retraction velocity.
Raw data for Figure 1B and D.
- https://cdn.elifesciences.org/articles/67999/elife-67999-fig1-data1-v2.xlsx
Figure 2
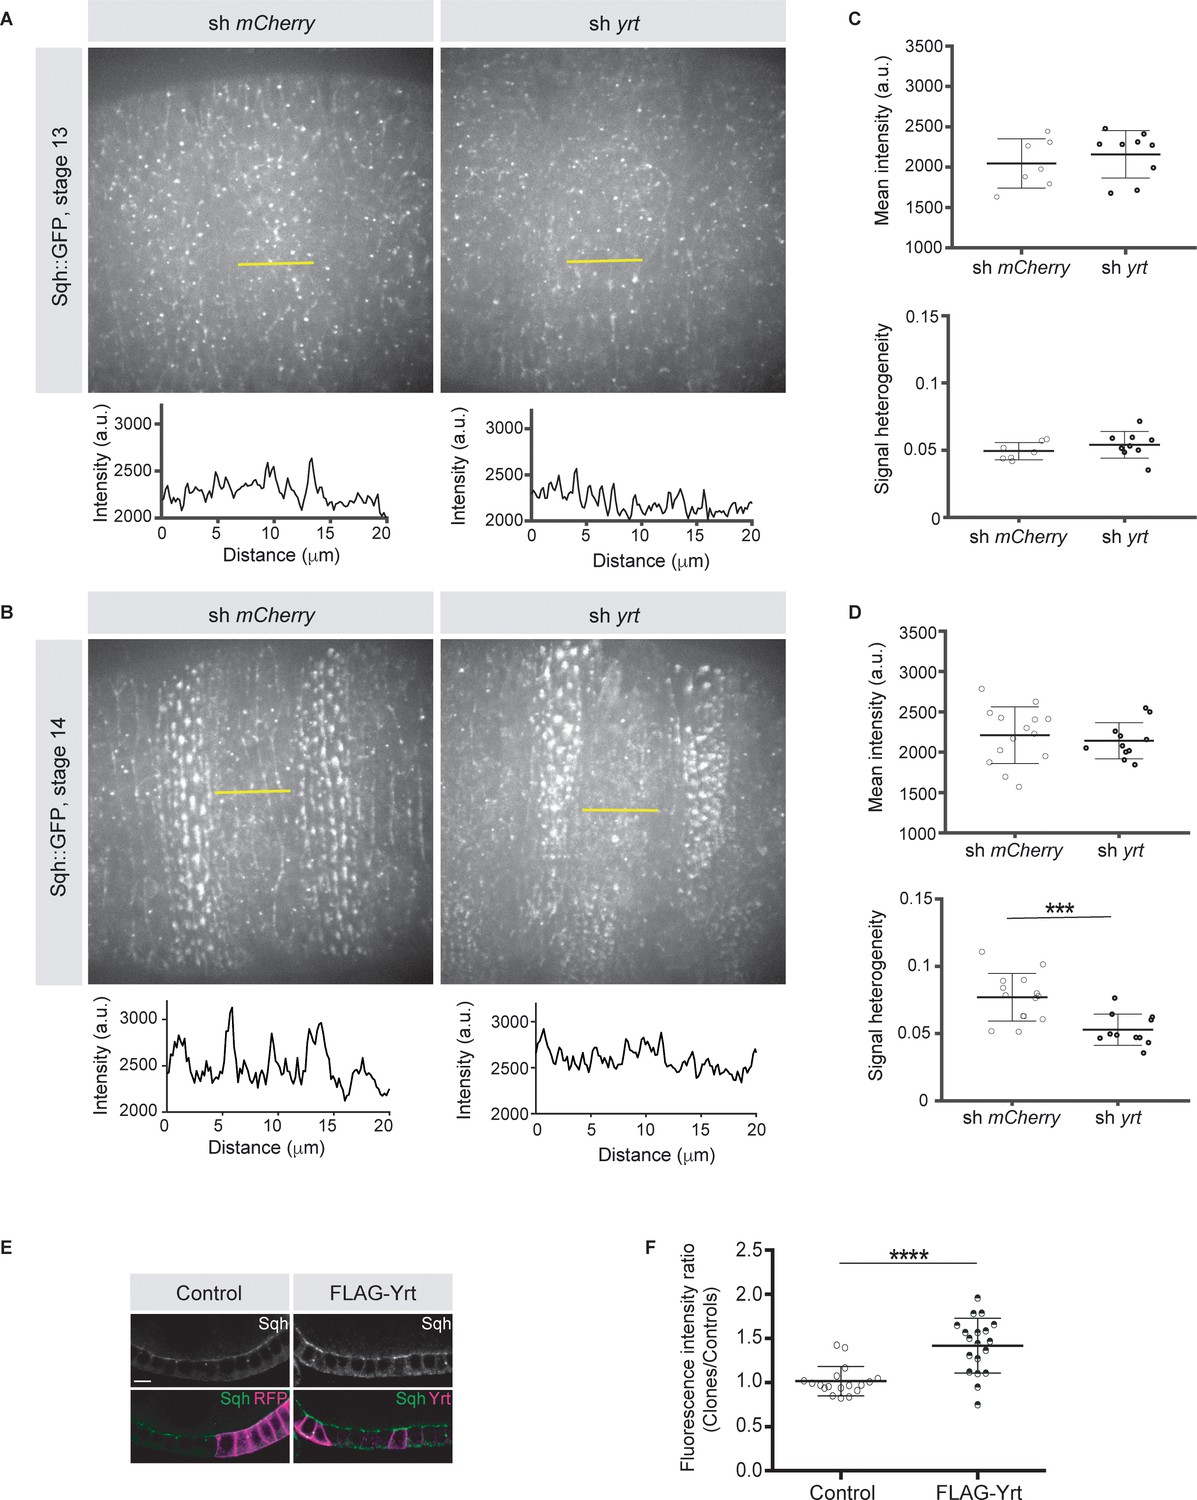
Yrt promotes apical enrichment of Myosin.
(A, B) Expression of Sqh:GFP and shRNA targeting either mCherry or yrt in the embryonic epidermis at stages 13 (A) and 14 (B). Intensity vs. distance is plotted for indicated yellow lines. (C, D) Mean Sqh intensity and heterogeneity of Sqh signal for antero-posterior linescans in stage 13 embryos (C; n = seven sh mCherry, nine sh yrt) and in stage 14 embryos (D; n = 14 sh mCherry, 11 sh yrt). Error bars indicate the standard deviation (s.d.), and black lines denote the mean. *** p < 0.001 (Mann-Whitney test). (E) Mosaic expression of FLAG-Yrt in follicular epithelial cells constitutively expression Sqh::GFP, which was visualized by immunofluorescence. FLAG-Yrt-expressing cells (right panels) are labeled with mRFP, which was co-expressed with LacZ in control clones (left panels). Scale bar represents 5 μm. (F) Quantification of the fluorescence intensity of apical Sqh::GFP in cells expressing the exogenous proteins described in E (stage 5 and 6 follicles were used for quantification). Results were calculated as a ratio between FLAG-Yrt-expressing cells and control cells in the same follicle (n = 18 follicles for the control and n = 19 follicles for FLAG-Yrt). **** p ≤ 0.0001 (one-way ANOVA), error bars indicate s.d.; bold black lines denote the mean in F.
-
Figure 2—source data 1
Yrt controls Myosin distribution from stage 14 of embryogenesis.
Raw data for Figure 2A–D.
- https://cdn.elifesciences.org/articles/67999/elife-67999-fig2-data1-v2.xlsx
-
Figure 2—source data 2
Yrt increases apical Sqh in the follicular epithelium.
Raw data for Figure 2F.
- https://cdn.elifesciences.org/articles/67999/elife-67999-fig2-data2-v2.xlsx
Figure 3
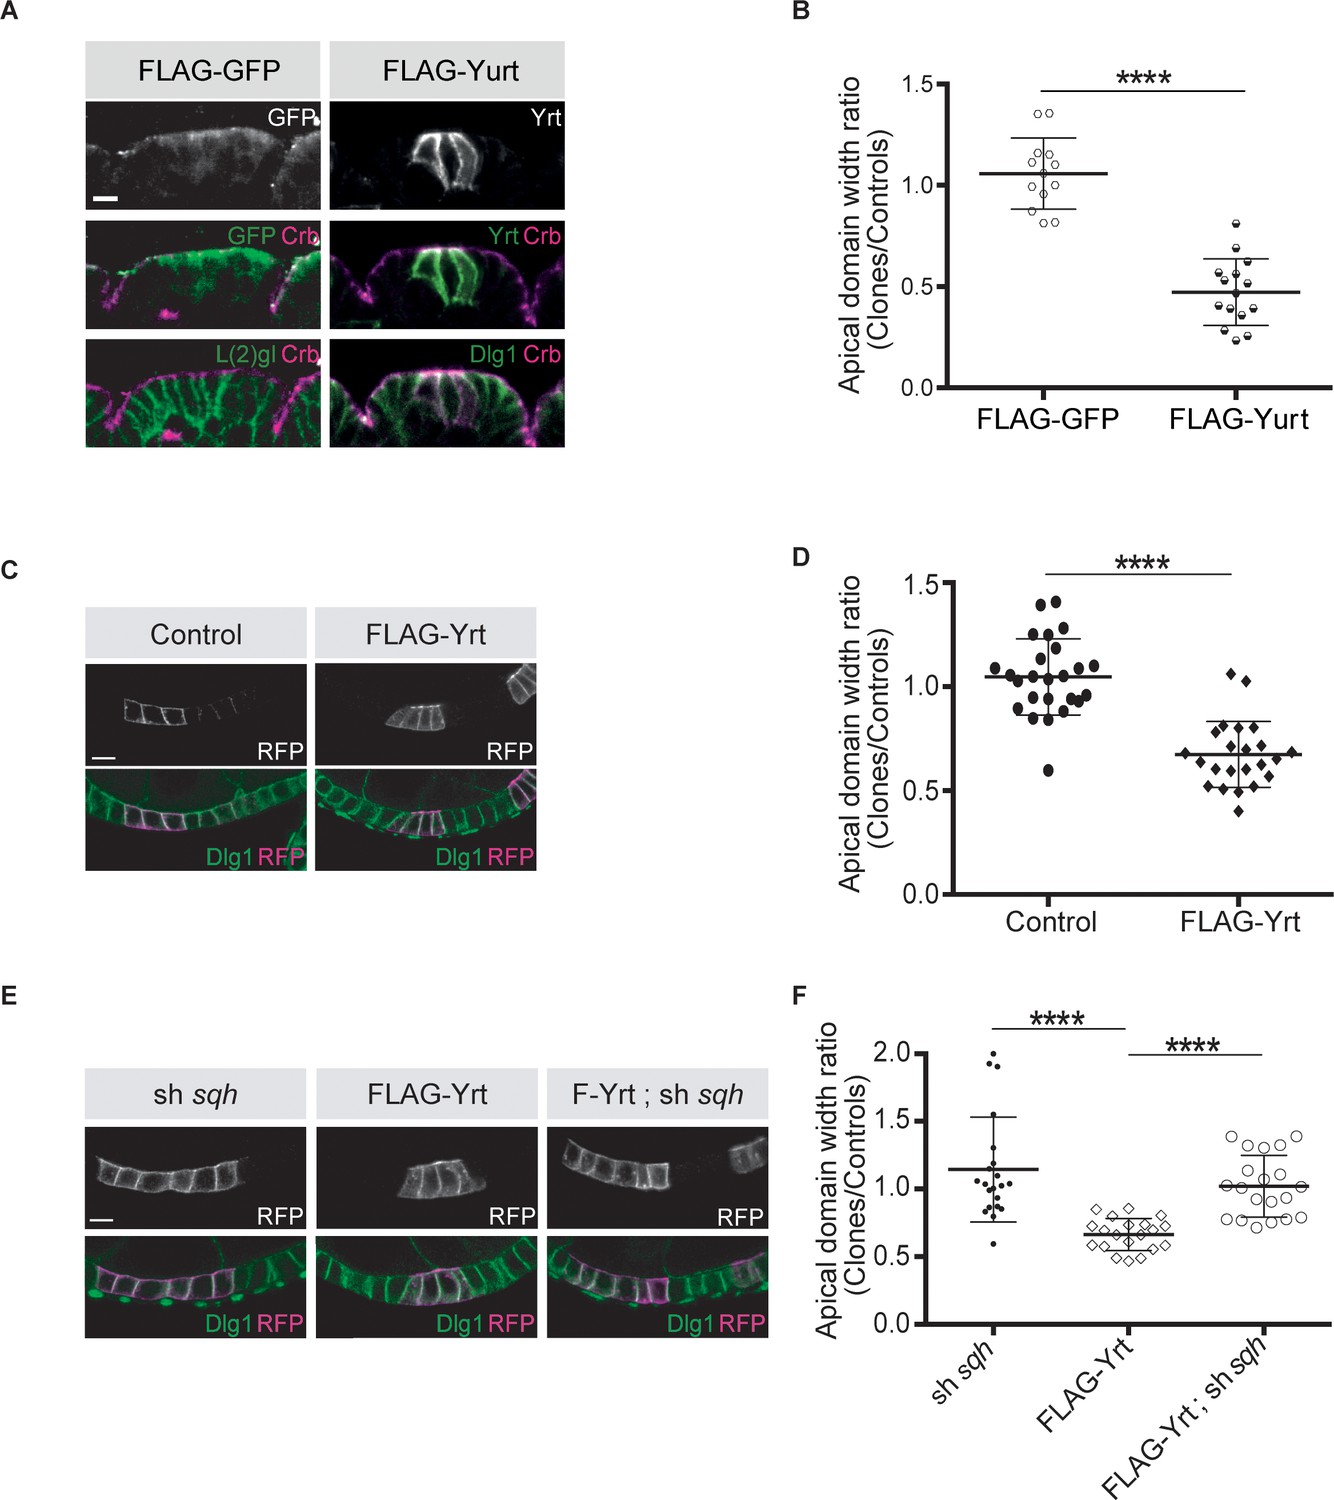
Yrt promotes apical constriction.
(A) Mosaic expression of FLAG-GFP or FLAG-Yrt in the embryonic epidermis at stage 14. Crb immunostaining (magenta) marks the apical domain, whereas immunolabeling of L(2)gl or Discs large 1 (Dlg1) label the lateral membrane. (B) Quantification of apical domain width (n = 13 for FLAG-GFP and n = 15 for FLAG-Yrt; images were acquired from seven individual embryos for each genotype). Results are expressed as the ratio between the width of cells expressing the transgenes and the width of control cells in the same segment (**** p ≤ 0.0001). Scale bar represents 5 μm. (C) Clonal expression of membrane-targeted RFP (mRFP) and LacZ (control; left panels), or mRFP and FLAG-Yrt (F-Yrt; right panels) in the follicular epithelium. Immunostaining of mRFP highlights cells expressing the transgenes, whereas immunolabeling of endogenous Dlg1 (green) marks the lateral membrane of all epithelial cells. (D) Quantification of apical domain width of cells expressing the transgenes listed in C. Results are expressed as the ratio between the width of cells expressing the transgenes and the width of control cells in the same follicle. (E) Mosaic expression of a shRNA targeting sqh (left panels), of FLAG-Yrt (center panels), or expression of both sh-sqh and FLAG-Yrt (right panels). mRFP was co-expressed with these constructs, and used to label positive cells. (F) Quantification of the apical diameter of cells expressing the transgenes indicated in E. Results are expressed as a ratio to the width of control cells. In B, D and F, error bars indicate s.d.; bold black lines denote the mean; n ≥ 20; **** p ≤ 0.0001 (Student’s t-test was used in B, one-way ANOVA for D, F). Follicles shown in C and E were at stage 5. Scale bars represent 5 μm.
-
Figure 3—source data 1
Yrt promotes apical constriction.
Raw data for Figure 3B,D,F.
- https://cdn.elifesciences.org/articles/67999/elife-67999-fig3-data1-v2.xlsx
Figure 4

aPKC represses Yrt-induced apical constriction.
(A–G) Clonal expression of the indicated proteins in the follicular epithelium. Clones were positively labeled with mRFP or Yrt staining. (H, I) Quantification of the apical diameter of cells expressing the transgenes indicated in A–E (H) or F, G (I). Results are expressed as a ratio to the width of control cells in the same follicle (stage 5 and 6 follicles were used for quantification). Scale bars represent 5 μm. **** p ≤ 0.0001 (one-way ANOVA), error bars indicate s.d.; bold black lines denote the mean, n ≥ 19.
-
Figure 4—source data 1
aPKC represses Yrt function.
Raw data for Figure 4H,I.
- https://cdn.elifesciences.org/articles/67999/elife-67999-fig4-data1-v2.xlsx
Figure 5
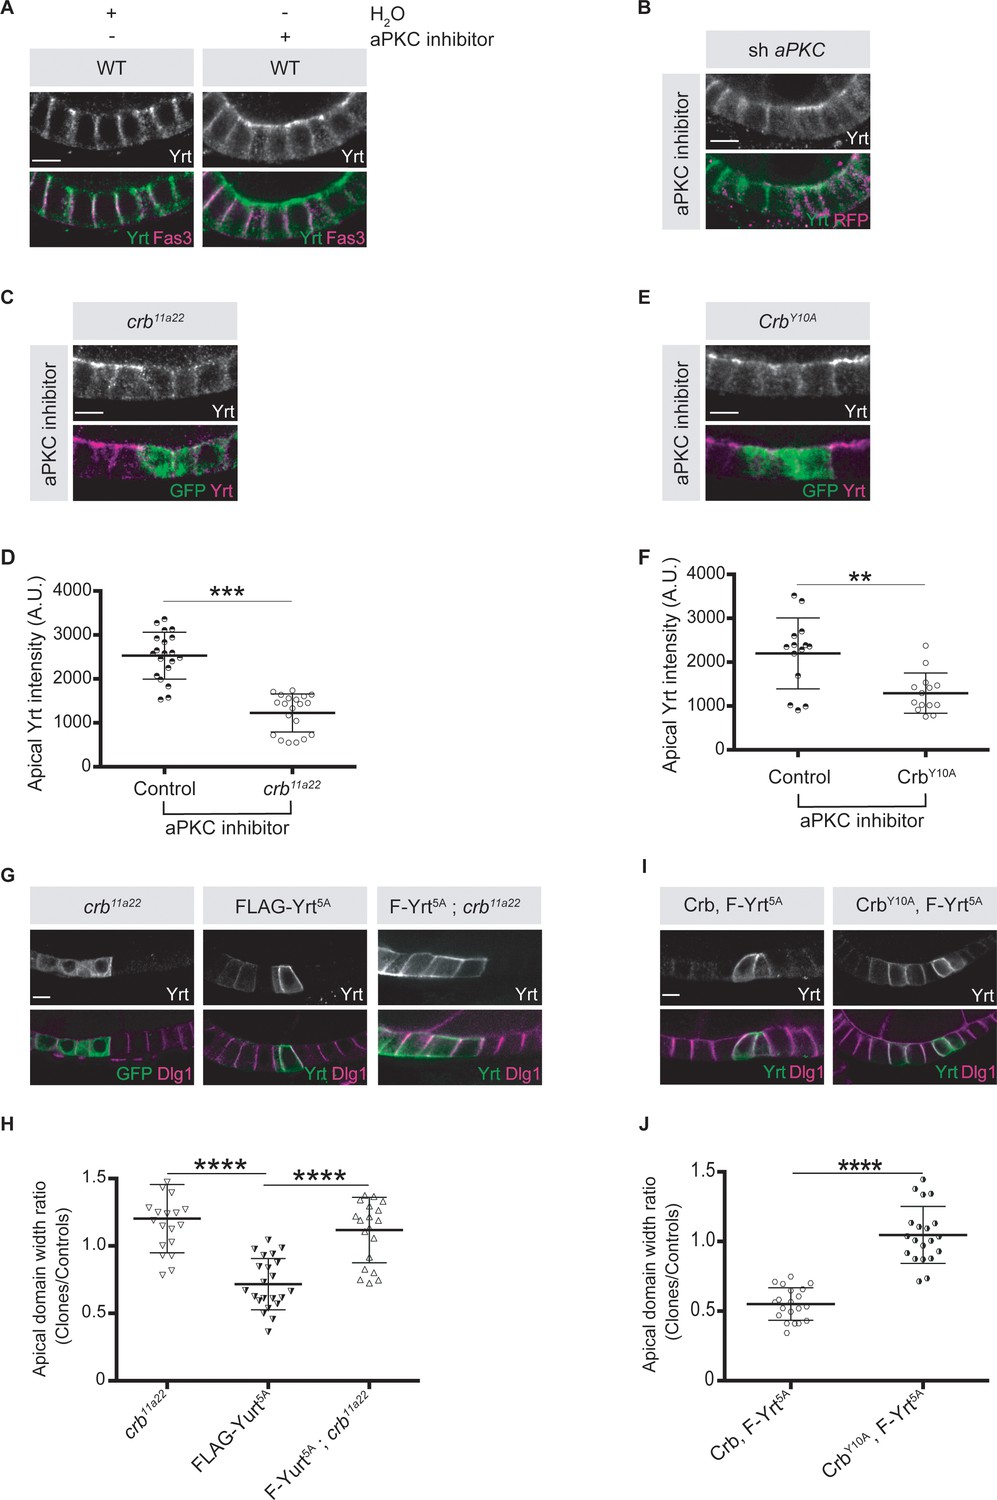
Crb is essential for Yrt-dependent apical constriction.
(A) Panels depict immunofluorescence of Yrt (green in merge) and Fasciclin 3 (Fas3; lateral marker, magenta) in the follicular epithelium treated for 2 hr with the aPKC inhibitor CRT-006-68-54. (B) aPKC knockdown cells (mRFP positive) were immunostained for Yrt. (C) crb11A22 (null allele) homozygous mutant clones were produced in adult crb/+ female flies (mutant clones are GFP positive). Dissected ovaries were incubated with the aPKC inhibitor CRT-006-68-54 prior to fixation and Yrt immunostaining. (D) Quantification of apical Yrt intensity in control or crb mutant cells within the same follicle in presence of the aPKC inhibitor CRT-006-68-54. (E) Analysis of Yrt localization in control or crb11A22 mutant cells expressing exogenous CrbY10A (GFP-positive cells) exposed to the aPKC inhibitor CRT-006-68-54. (F) Quantification of apical Yrt staining in control and crb null cells expressing exogenous CrbY10A treated with the aPKC inhibitor. (G) FLAG-Yrt5A was specifically expressed in crb mutant cell clones (right panels). Mosaic expression of FLAG-Yrt5A in control cells or crb mutant clones were used as controls (middle and left panels, respectively). Clones were labeled with GFP (left panels) or by Yrt immunostaining (middle and right panels). Dlg1 staining was used to label the lateral membrane. (H) Quantification of the apical domain width of cells expressing the transgenes listed in G. (I) Immunostaining of Yrt and Dlg1 in follicular epithelial cells expressing FLAG-Yrt5A and exogenous wild-type Crb (left panels), or FLAG-Yrt5A together with CrbY10A (right panels). (J) Quantification of the apical domain width of cells expressing the transgenes listed in I. Results are expressed as the ratio between the width of cells expressing the transgenes and the width of control cells in the same follicle. Stage three follicles were depicted in A and B, whereas panels C, E, G, and I display stage five follicles. In D, F, H, and J error bars indicate s.d.; bold black lines denote the mean; n ≥ 20; ** p ≤ 0.01, *** p ≤ 0.001, **** p ≤ 0.0001 (one-way ANOVA). All scale bars represent 5 μm.
-
Figure 5—source data 1
Crb cooperates with Yrt.
Raw data for Figure 5H,J.
- https://cdn.elifesciences.org/articles/67999/elife-67999-fig5-data1-v2.xlsx
Figure 6
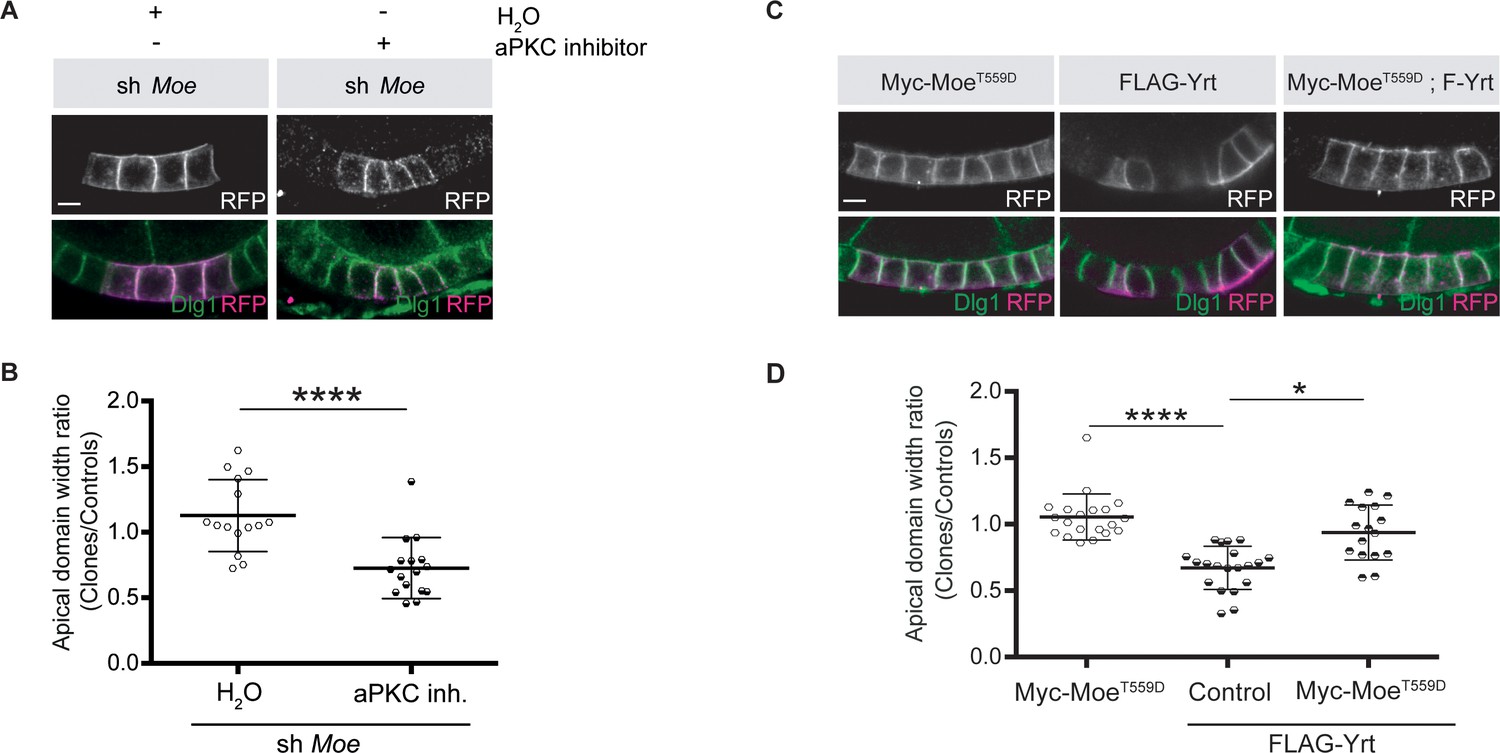
Moe suppresses Yrt-induced apical constriction.
(A) Mosaic knockdown of Moe in absence or presence of the aPKC inhibitor CRT-006-68-54. Clones are positively labeled with membrane-targeted RFP. (B) Quantification of apical domain width of knockdown cells in absence or presence of the aPKC inhibitor CRT-006-68-54. Results were calculated as a ratio between clonal cells and control cells in the same follicle. (C) Clonal expression of FLAG-Yrt, Myc-MoeT559D (Karagiosis and Ready, 2004), or both proteins (clones are labeled with mRFP). (D) Quantification of the apical domain width of cells expressing the transgenes listed in C. Results are expressed as the ratio between the width of cells expressing transgenes and the width of control cells in the same follicle (quantification was performed using stage five follicles). In B and D, error bars indicate s.d.; bold black lines denote the mean; n ≥ 18; * p ≤ 0.05, **** p ≤ 0.0001 (one-way ANOVA). All scale bars represent 5 μm.
-
Figure 6—source data 1
Moe and Yrt show antagonistic function.
Raw data for Figure 6B,D.
- https://cdn.elifesciences.org/articles/67999/elife-67999-fig6-data1-v2.xlsx
Figure 7
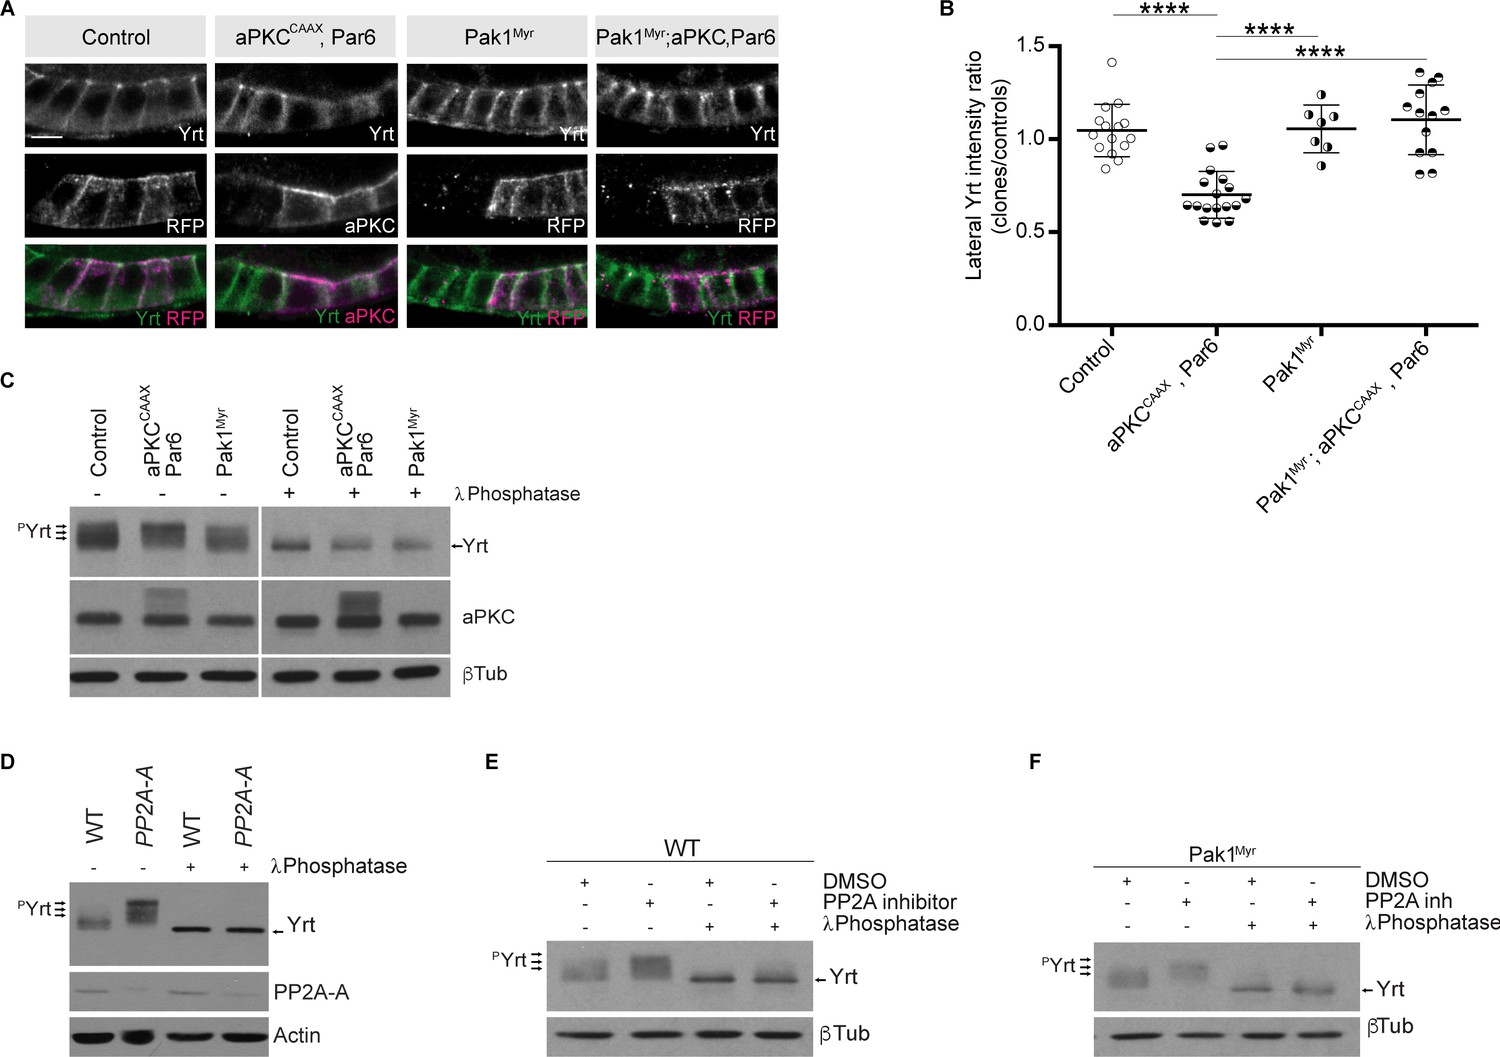
Pak1 and PP2A control the phosphorylation level of Yrt.
(A) Yrt immunostaining in control follicular epithelial cells or clones of cells expressing aPKCCAAX together with Par6, Pak1Myr, or aPKCCAAX with Par6 and Pak1Myr. Clones were positively labeled with RFP or aPKC immunostaining in stage four follicles. Scale bar represents 5 μm. (B) Quantification of lateral Yrt staining intensity in genotypes described in A. Error bars indicate s.d.; bold black lines denote the mean; n ≥ 16; **** p ≤ 0.0001 (one-way ANOVA). (C) Control embryos, embryos overexpressing Par-6 and aPKCCAAX, or embryos expressing Pak1Myr were homogenized. Samples were incubated or not with the λ phosphatase and processed for SDS-PAGE. Western blotting using anti-Yrt antibodies showed the migration profile of phosphorylated (pYrt) or unphosphorylated Yrt, whereas β-Tubulin (βTub) was used as loading control. (D) Western blots showing the migration profile of Yrt (pYrt stands for phosphorylated Yrt) extracted from wild-type (WT) or PP2A-A mutant embryos. The expression level of PP2A-A is also shown, and Actin was used as loading control. (E) Wild-type embryos were treated or not with the PP2A inhibitor Cantharidin, homogenized, and processed for SDS-PAGE. Western blotting using control samples shows the phosphorylation levels of Yrt (pYrt), whereas samples incubated with λ Phosphatase prior to gel electrophoresis show unphosphorylated Yrt. β-Tubulin (βTub) was used as loading control. (F) Embryos overexpressing Pak1Myr were treated or not with PP2A inhibitor and homogenized. Western blotting using anti-Yrt antibodies showed the migration profile of phosphorylated (pYrt) or unphosphorylated Yrt. λ Phosphatase was used as a positive control of Yrt dephosphorylation, and β-Tubulin (βTub) was used as loading control.
-
Figure 7—source data 1
aPKC and Pak1 control Yrt localization.
Raw data for Figure 7B.
- https://cdn.elifesciences.org/articles/67999/elife-67999-fig7-data1-v2.xlsx
-
Figure 7—source data 2
aPKC and Pak1 control Yrt phosphorylation.
Original scan for Figure 7C.
- https://cdn.elifesciences.org/articles/67999/elife-67999-fig7-data2-v2.pdf
-
Figure 7—source data 3
PP2A dephosphorylates Yrt.
Original scan for Figure 7D.
- https://cdn.elifesciences.org/articles/67999/elife-67999-fig7-data3-v2.pdf
-
Figure 7—source data 4
Pak1 acts upstream of PP2A.
Original scan for Figure 7E,F.
- https://cdn.elifesciences.org/articles/67999/elife-67999-fig7-data4-v2.pdf
-
Figure 7—source data 5
Loading controls.
Original scan of loading controls.
- https://cdn.elifesciences.org/articles/67999/elife-67999-fig7-data5-v2.pdf
-
Figure 7—source data 6
Annotated blots.
Region of each blot shown in Figure 7C–F are highlighted with a yellow box.
- https://cdn.elifesciences.org/articles/67999/elife-67999-fig7-data6-v2.pdf
Figure 8
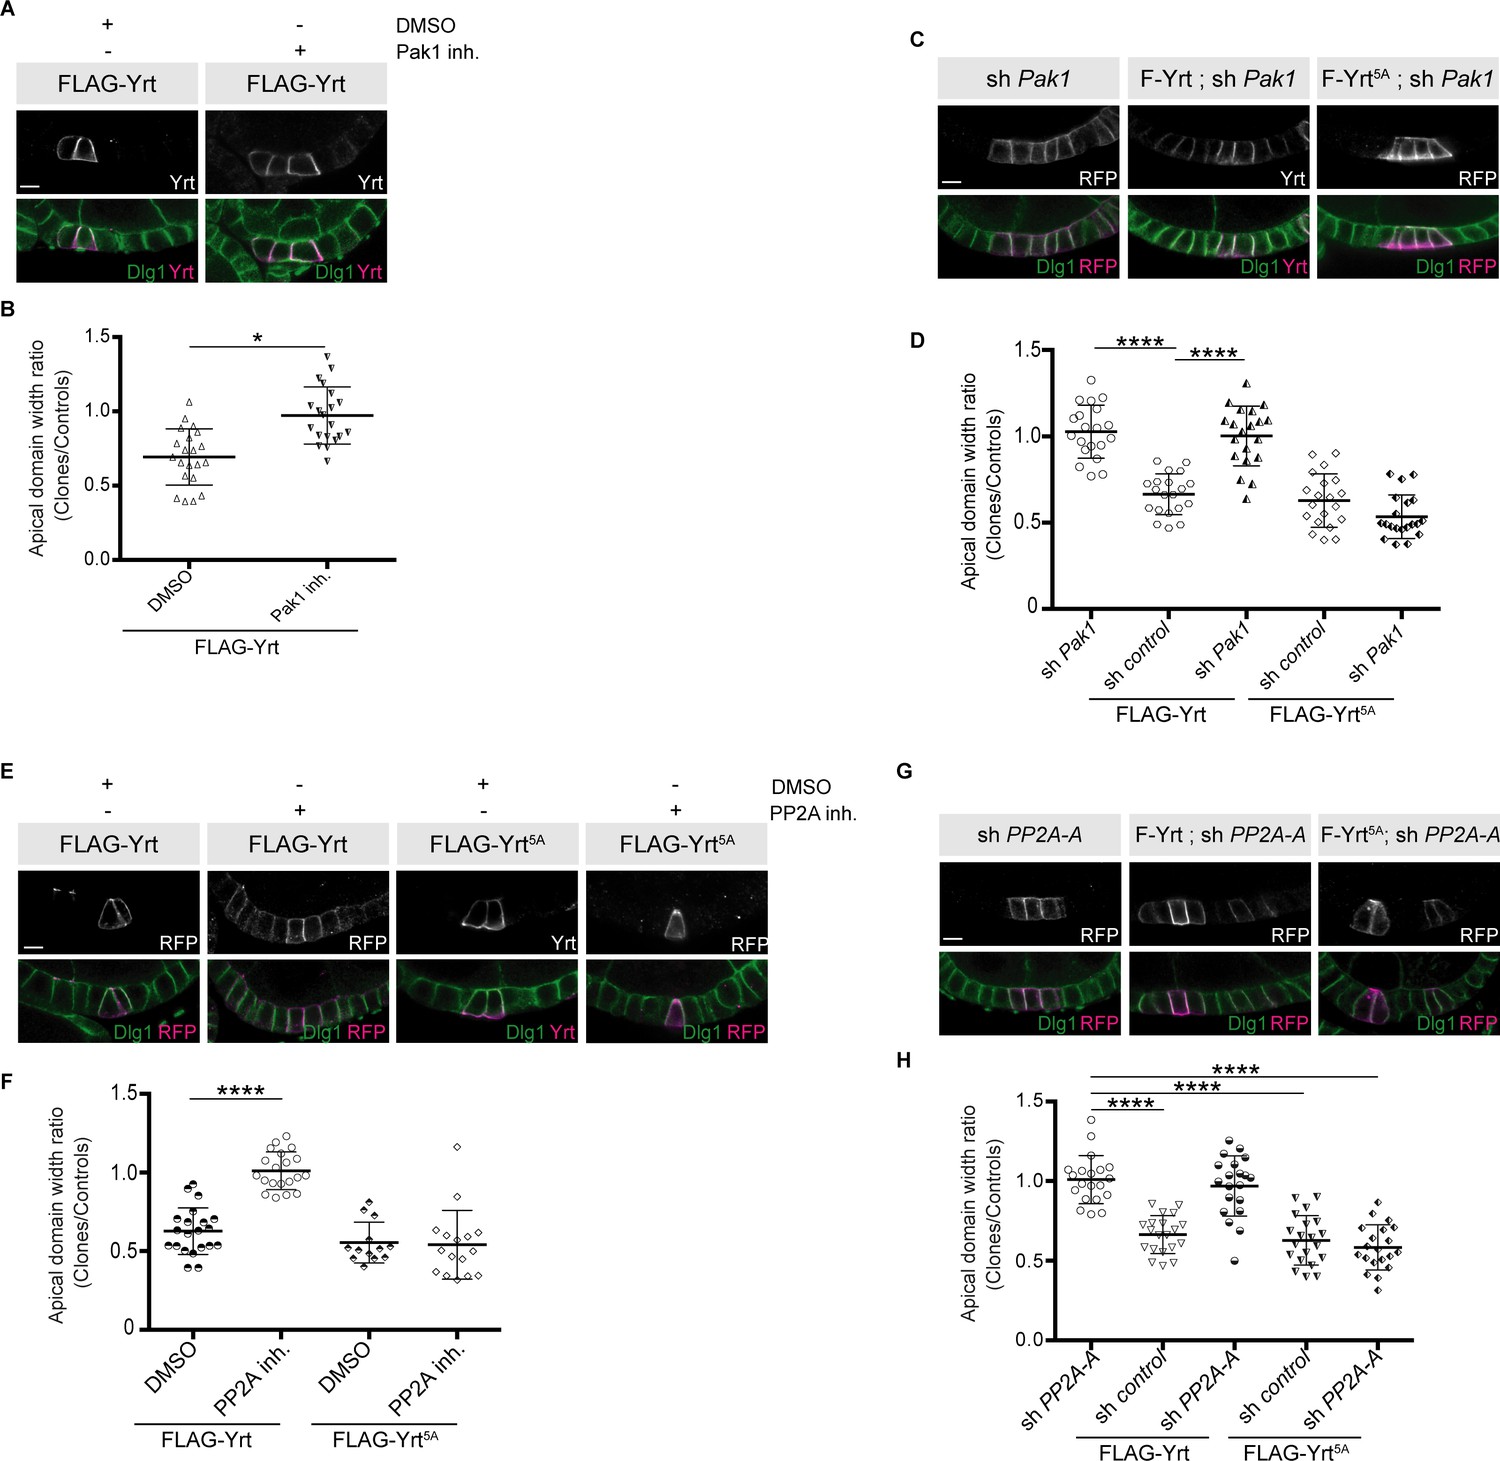
Pak1 and PP2A are essential for Yrt-induced apical constriction.
(A) Stage four follicles clonally overexpressing FLAG-Yrt were incubated with the vehicle DMSO or the Pak1 inhibitor (IPA-3; Pak1 inh.) prior to fixation and immunostaining with antibodies directed against Yrt and Dlg1. (B) Quantification of the apical diameter of cells expressing transgenes indicated in A incubated or not with IPA-3. Results are expressed as the ratio between the width of cells expressing the transgenes and the width of control cells in the same follicle. (C) Immunostaining of Dlg1 in follicles displaying mosaic expression of a shRNA targeting Pak1 and the indicated FLAG-Yrt constructs. Clones were labeled with mRFP or Yrt staining. (D) Quantification of the diameter of cells expressing the exogenous proteins described in C. Results were calculated as a ratio between transgene expressing cells and control cells within the same follicle. (E) Follicles containing cell clones expressing FLAG-Yrt or FLAG-Yrt5A (mRFP-positive cells) were incubated or not with the PP2A inhibitor Cantharidin (PP2A inh.) prior to immunostaining with indicated antibodies. (F) Quantification of the apical diameter of cells expressing transgenes indicated in E. Results are expressed as the ratio between the width of cells expressing the transgenes and the width of control cells in the same follicle. (G) Panels depict follicular epithelium displaying mosaic knockdown of PP2A-A (left panels), mosaic expression of FLAG-Yrt (middle panels), or the combination of the indicated FLAG-Yrt constructs with a shRNA targeting PP2A-A (middle and right panels). Immunostaining of mRFP or Yrt highlights cells expressing the transgenes, whereas immunolabeling of endogenous Dlg1 shows the lateral domain of all epithelial cells. (H) Quantification of the apical diameter of cells expressing transgenes indicated in G. Results are expressed as the ratio between the width of cells expressing the transgenes and the width of control cells in the same follicle. B, D, F, and H, error bars indicate s.d.; bold black lines denote the mean; n ≥ 16; * p ≤ 0.05, **** p ≤ 0.0001 (one-way ANOVA). (C, F and G) imaged follicles were at stages 5 or 6. All scale bars represent 5 μm.
-
Figure 8—source data 1
Pak1 and PP2A promote apical constriction.
Raw data for Figure 8B,D,F,H.
- https://cdn.elifesciences.org/articles/67999/elife-67999-fig8-data1-v2.xlsx
Figure 9
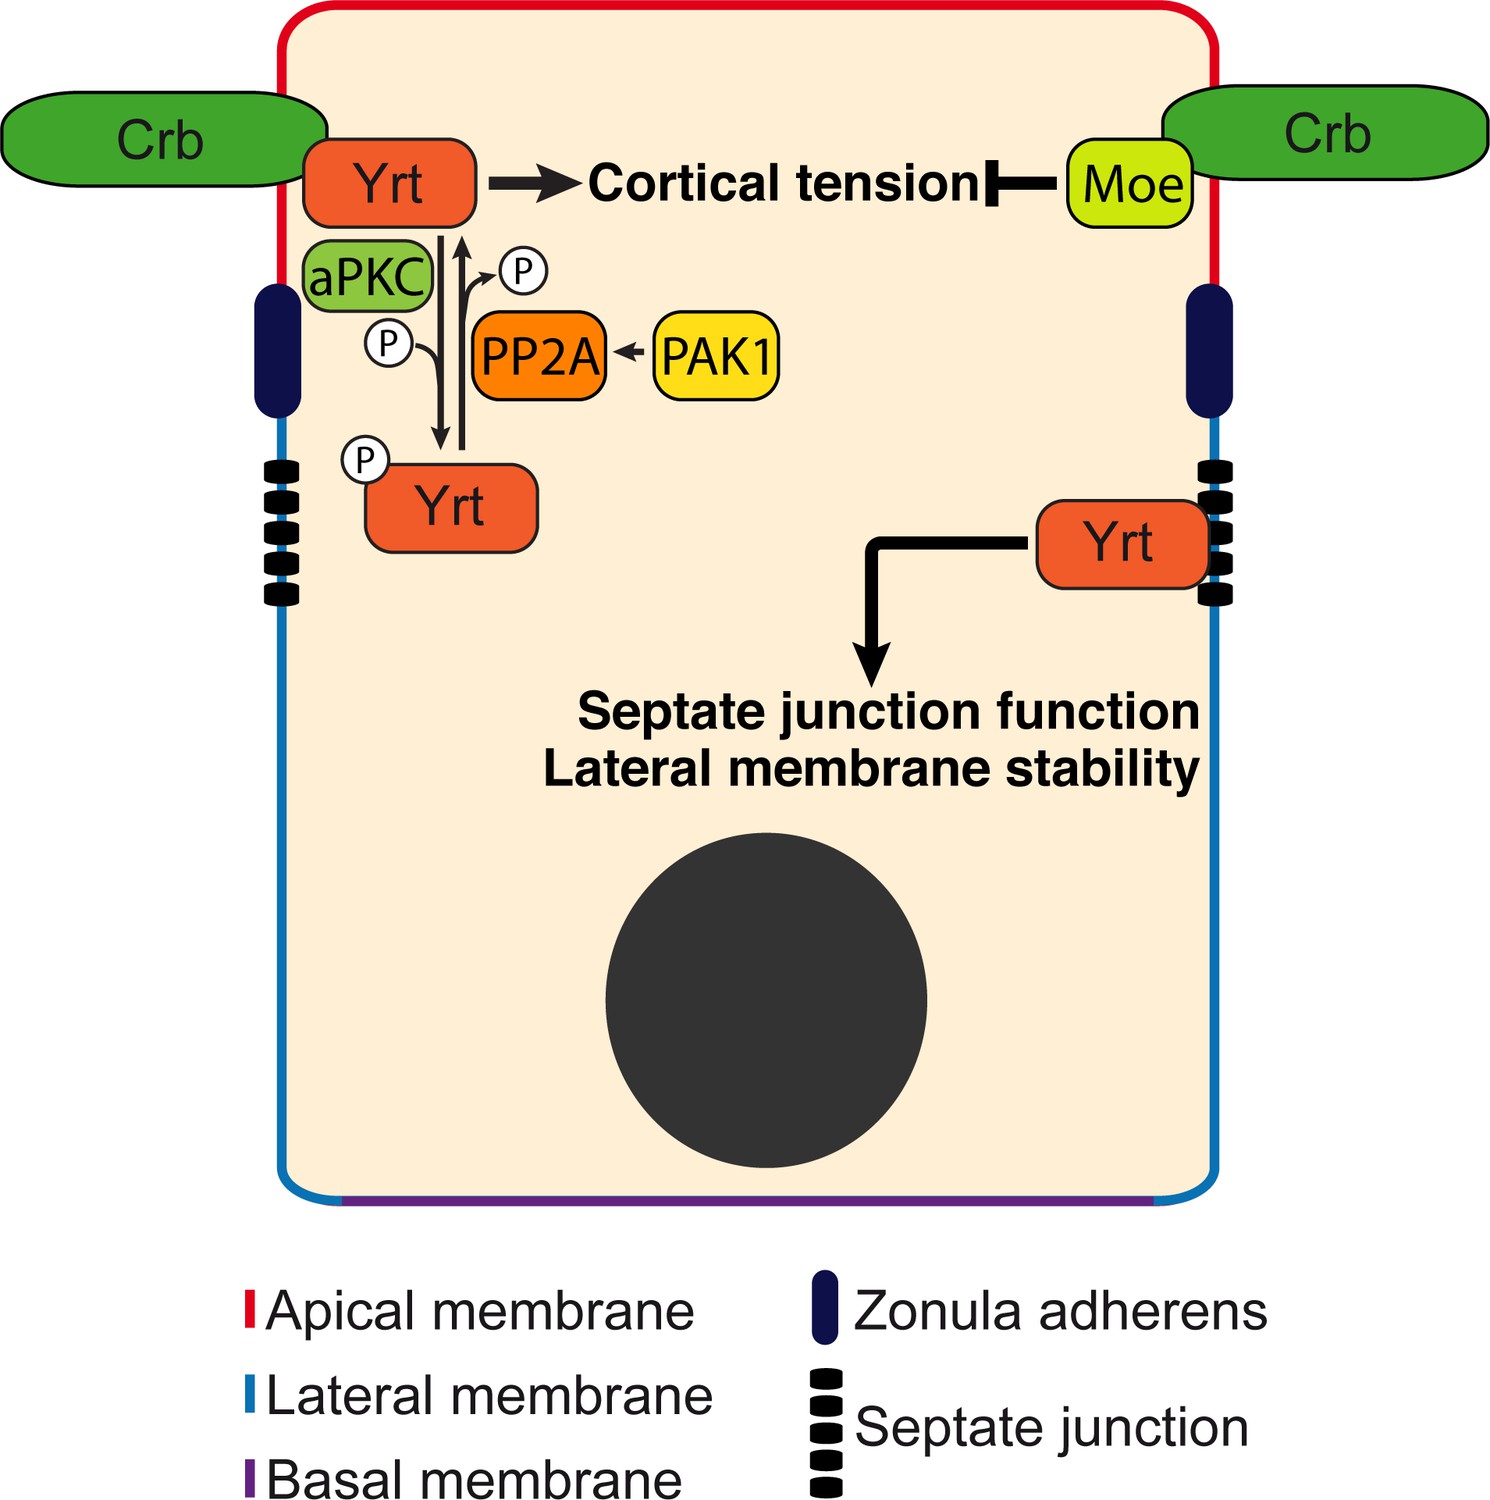
Model: Yrt is a multifunctional protein promoting cortical tension downstream of Crb.
Yrt is localized to the lateral membrane where it prevents the spread of apical characteristics in differentiating epithelial cells and controls the occluding function of septate junctions in fully differentiated cells (Laprise et al., 2006; Laprise et al., 2009; Laprise and Tepass, 2011; Sollier et al., 2015). Yrt also occupies the apical domain owing to its direct interaction with Crb (Laprise et al., 2006). Yrt promotes Crb-dependent cortical tension (this study) in contrast to Moe that represses Myosin function downstream of Crb (Flores-Benitez and Knust, 2015; Salis et al., 2017). Hence, these proteins contribute to the functional plasticity of Crb, and a fine regulation of their association with Crb is thus required to define and stabilize the functional architecture of epithelial cells. Our data indicate that aPKC plays a key role in this process through phospho-dependent exclusion of Yrt from the apical domain. In contrast, Pak1 promotes Yrt dephosphorylation through activation of PP2A. The Pak1–PP2A module, which opposes aPKC function, is thus essential for Yrt-induced contractility. The equilibrium between aPKC and Pak1–PP2A activities thus balances Yrt and Crb functions.
Author response image 1
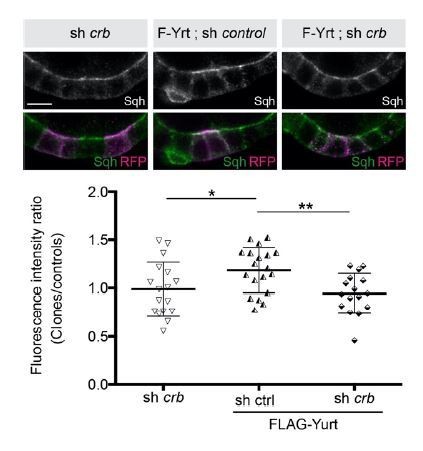
Yrt is a multifunctional protein promoting cortical tension downstream of Crb.
Mosaic expression of FLAG-Yrt (F-Yrt) with a control shRNA or a shRNA targeting crb in follicular epithelial cells constitutively expressing Sqh::GFP, which was visualized by immunofluorescence. FLAG-Yrt-expressing cells (middle and right panels) are labeled with mRFP. The lower part of the figure shows quantification of apical Sqh intensity in cells expressing the transgenes listed above. Results are presented as a ratio between clonal cells and control cells in the same follicle (see Author response image 2; *P £ 0.05, **P £ 0.01).
Author response image 2
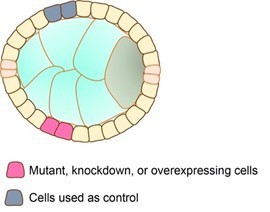
We used mosaic analysis in the Drosophila follicular epithelium.
The impact of clonal gene depletion and/or protein overexpression on apical constriction was assessed by measuring apical domain width of cells within clones (pink cells) and control cells occupying an equivalent position on the other side of the follicle (grey cells). Results were expressed as the ratio between the width of clonal cells and the width of control cells in the same follicle.
Author response image 3
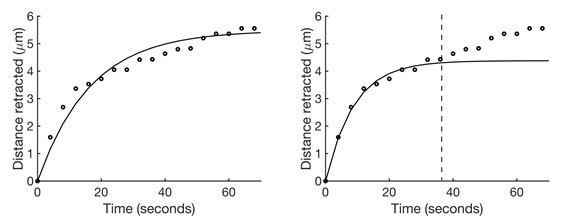
Kelvin-Voigt model fits retraction over time better at shorter time scales.
(Left) A sample set of retraction vs. time data (points) fit with the Kelvin-Voigt model (line). The accuracy of the fit for the initial recoil is sacrificed in an attempt to fit the longer stress relaxation response. (Right) The same data fit with the Kelvin-Voigt model only up to 36 seconds post-ablation (dashed line). The fit for the initial recoil response is significantly more accurate.
Author response image 4
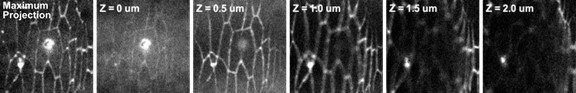
Autofluorescent holes in the vitelline membrane generated by laser ablation.
The leftmost image shows the maximum intensity projection of a section of epidermal tissue immediately following ablation. The rest of the images are individual confocal slices starting at the plane of the vitelline membrane (Z = 0 um) where the hole caused by ablation is in focus, and moving basally into the tissue. Note that the ablated adherens junction is in focus at the plane Z = 0.5 um.
Videos
Video 1
yrt depletion decreases retraction velocity.
Video of representative laser ablation experiments in control and yrt knockdown embryos.
Video 2
Yrt overexpression increases retraction velocity.
Video of representative laser ablation experiments in control and Yrt-overexpressing embryos.
Tables
Table 1
List of fly stocks used in this study.
| Genotype | Source | Identifier |
|---|---|---|
| D. melanogaster: UAS-FLAG-Yurt | Reference (Gamblin et al., 2014) | N/A |
| D. melanogaster: UAS-FLAG-Yurt[5A] | Reference (Gamblin et al., 2014) | N/A |
| D. melanogaster: UAS-FLAG-Yurt[FWA] | Reference (Gamblin et al., 2018) | N/A |
| D. melanogaster: UAS-FLAG-Yurt[5D] | Reference (Gamblin et al., 2014) | N/A |
| D. melanogaster: UAS-sh yurt | Drosophila Bloomington Stock Centre | # 36118 |
| D. melanogaster: UAS-sh squash | Drosophila Bloomington Stock Centre | # 32439 |
| D. melanogaster: UAS-aPKC[CAAX] | Reference (Sotillos et al., 2004) | N/A |
| D. melanogaster: UAS-aPKC[CAAX], Par6 | Gift from T. Harris (Harris and Tepass, 2010) | N/A |
| D. melanogaster: UAS-sh mCherry | Drosophila Bloomington Stock Centre | # 35785 |
| D. melanogaster: FRT82b, crb[11a22] | Drosophila Bloomington Stock Centre | # 3448 |
| D. melanogaster: UAS-sh aPKC | Drosophila Bloomington Stock Centre | # 34332 |
| D. melanogaster: UAS-sh Pak1 | Drosophila Bloomington Stock Centre | # 41714 |
| D. melanogaster: UAS-Pak[myr] | Drosophila Bloomington Stock Centre | # 8804 |
| D. melanogaster: foscrb[Y10A]; FRT82b, crb[11a22] | Reference (Klose et al., 2013) | N/A |
| D. melanogaster: UAS-LacZ | Drosophila Bloomington Stock Centre | # 8529 |
| D. melanogaster: sh Pp2a-A | Drosophila Bloomington Stock Centre | # 55050 |
| D. melanogaster: endo-E-Cadherin::GFP | Reference (Huang et al., 2009) | N/A |
| D. melanogaster: sqh-sqh::GFP | Reference (Royou et al., 2004) | N/A |
| D. melanogaster: matαtub67;15 GAL4 | Reference (Staller et al., 2013) | N/A |
| D. melanogaster: daughterless-GAL4 | Drosophila Bloomington Stock Centre | # 27608 |
| D. melanogaster: hs-FLP;; tub-FRT-Gal80-FRT-Gal4, UAS–mRFP | Gift from Y. Bellaiche, Institut Curie, PSL Research University, Paris, France. | N/A |
| D. melanogaster: hs-FLP; tub-GAL4, UAS-GFP; FRT82b, tub-GAL80 | Gift from N. Perrimon, Harvard Medical School, Boston, USA | N/A |
| D. melanogaster: hs-FLP; sqh-Sqh::GFP; tub>Gal80>Gal4, UAS–mRFP | Gift from Y. Bellaiche, Institut Curie, PSL Research University, Paris, France. | N/A |
| D. melanogaster: wild type | Drosophila Bloomington Stock Centre | # 25210 |
| D. melanogaster: PP2A-A[EP2332] / Cyo | Drosophila Bloomington Stock Centre | # 1704 |
| D. melanogaster: Patched-GAL4 | Drosophila Bloomington Stock Centre | # 65661 |
| D. melanogaster: UAS-myc-Moesin[T559D] | Drosophila Bloomington Stock Centre | # 8630 |
| D. melanogaster: UAS-sh Moesin | Drosophila Bloomington Stock Centre | # 8629 |
| D. melanogaster: UAS-FLAG-GFP | Reference (Gamblin et al., 2018) | N/A |
Table 2
Detailed genotypes.
| Figure 1 | |
|---|---|
| A | endo-E-Cadherin::GFP / +; UAS-sh mCherry / matαtub67;15 GAL4 |
| endo-E-Cadherin::GFP / +; UAS-sh yrt / matαtub67;15 GAL4 | |
| B | endo-E-Cadherin::GFP / +; UAS-sh mCherry / matαtub67;15 GAL4 |
| endo-E-Cadherin::GFP / +; UAS-sh yrt / matαtub67;15 GAL4 | |
| C | endo-E-Cadherin::GFP / UAS-LacZ; daughterless-GAL4 / + |
| endo-E-Cadherin::GFP / +; UAS-FLAG-Yrt / daughterless-GAL4 | |
| D | endo-E-Cadherin::GFP / UAS-LacZ; daughterless-GAL4 / + |
| endo-E-Cadherin::GFP / +; UAS-FLAG-Yrt / daughterless-GAL4 | |
| Figure 2 | |
| A | sqh-Sqh::GFP; UAS-sh mCherry / matαtub67;15 GAL4 |
| sqh-Sqh::GFP ; UAS-sh yrt / matαtub67;15 GAL4 | |
| B | sqh-Sqh::GFP; UAS-sh mCherry / matαtub67;15 GAL4 |
| sqh-Sqh::GFP ; UAS-sh yrt / matαtub67;15 GAL4 | |
| C | sqh-Sqh::GFP; UAS-sh mCherry / matαtub67;15 GAL4 |
| sqh-Sqh::GFP ; UAS-sh yrt / matαtub67;15 GAL4 | |
| D | sqh-Sqh::GFP; UAS-sh mCherry / matαtub67;15 GAL4 |
| sqh-Sqh::GFP ; UAS-sh yrt / matαtub67;15 GAL4 | |
| E | hs-FLP; sqh-Sqh::GFP; UAS-LacZ / tub-FRT-GAL80-FRT-GAL4, UAS–mRFP |
| hs-FLP; sqh-Sqh::GFP; UAS-FLAG-Yrt / tub-FRT-GAL80-FRT-GAL4, UAS–mRFP | |
| F | hs-FLP; sqh-Sqh::GFP; UAS-LacZ / tub-FRT-GAL80-FRT-GAL4, UAS–mRFP |
| hs-FLP; sqh-Sqh::GFP; UAS-FLAG-Yrt / tub-FRT-GAL80-FRT-GAL4, UAS–mRFP | |
| Figure 3 | |
| A | Patched-GAL4 / +; UAS-FLAG-GFP / + |
| Patched-GAL4 / +; IAS-FLAG-Yrt / + | |
| B | Patched-GAL4 / +; UAS-FLAG-GFP / + |
| Patched-GAL4 / +; IAS-FLAG-Yrt / + | |
| C | hs-FLP / +; ; UAS- LacZ / tub-FRT-GAL80-FRT-GAL4, UAS–mRFP |
| hs-FLP / +; ; UAS- FLAG-Yrt / tub-FRT-GAL80-FRT-GAL4, UAS–mRFP | |
| D | hs-FLP / +; ; UAS- LacZ / tub-FRT-GAL80-FRT-GAL4, UAS–mRFP |
| hs-FLP / +; ; UAS- FLAG-Yrt / tub-FRT-GAL80-FRT-GAL4, UAS–mRFP | |
| E | hs-FLP / +; sh sqh / +; UAS- LacZ / tub-FRT-GAL80-FRT-GAL4, UAS–mRFP |
| hs-FLP / +; sh LexA / +; UAS- FLAG-Yrt / tub-FRT-GAL80-FRT-GAL4, UAS–mRFP | |
| hs-FLP / +; sh sqh / +; UAS- FLAG-Yrt / tub-FRT-GAL80-FRT-GAL4, UAS–mRFP | |
| F | hs-FLP / +; sh sqh / +; UAS- LacZ / tub-FRT-GAL80-FRT-GAL4, UAS–mRFP |
| hs-FLP / +; sh LexA / +; UAS- FLAG-Yrt / tub-FRT-GAL80-FRT-GAL4, UAS–mRFP | |
| hs-FLP / +; sh sqh / +; UAS- FLAG-Yrt / tub-FRT-GAL80-FRT-GAL4, UAS–mRFP | |
| Figure 4 | |
| A | hs-FLP / +; ; UAS- aPKC[CAAX] / tub-FRT-GAL80-FRT-GAL4, UAS–mRFP |
| B | hs-FLP / +; UAS- LacZ / +; UAS- FLAG-Yrt / tub-FRT-GAL80-FRT-GAL4, UAS–mRFP |
| C | hs-FLP / +; ; UAS-aPKC[CAAX], UAS- FLAG-Yrt / tub-FRT-GAL80-FRT-GAL4, UAS–mRFP |
| D | hs-FLP / +; UAS- LacZ / +; UAS- FLAG-Yrt[5A] / tub-FRT-GAL80-FRT-GAL4, UAS–mRFP |
| E | hs-FLP / +; ; UAS-aPKC[CAAX], UAS- FLAG-Yrt[5A] / tub-FRT-GAL80-FRT-GAL4, UAS–mRFP |
| F | hs-FLP / +; ; UAS- FLAG-Yrt[5D] / tub-FRT-GAL80-FRT-Gal4, UAS–mRFP |
| G | hs-FLP / +; ; UAS- FLAG-Yrt[FWA] / tub-FRT-GAL80-FRT-Gal4, UAS–mRFP |
| H | hs-FLP / +; ; UAS- aPKC[CAAX] / tub-FRT-GAL80-FRT-GAL4, UAS–mRFP |
| hs-FLP / +; UAS- LacZ / +; UAS- FLAG-Yrt / tub-FRT-GAL80-FRT-GAL4, UAS–mRFP | |
| hs-FLP / +; ; UAS-aPKC[CAAX], UAS- FLAG-Yrt / tub-FRT-GAL80-FRT-GAL4, UAS–mRFP | |
| hs-FLP / +; UAS- LacZ / +; UAS- FLAG-Yrt[5A] / tub-FRT-GAL80-FRT-GAL4, UAS–mRFP | |
| hs-FLP / +; ; UAS-aPKC[CAAX], UAS- FLAG-Yrt[5A] / tub-FRT-GAL80-FRT-GAL4, UAS–mRFP | |
| I | hs-FLP / +; UAS- LacZ / +; + / tub-FRT-GAL80-FRT-GAL4, UAS–mRFP |
| hs-FLP / +; ; UAS- FLAG-Yrt[5A] / tub-FRT-GAL80-FRT-Gal4, UAS–mRFP | |
| hs-FLP / +; ; UAS- FLAG-Yrt[5D] / tub-FRT-GAL80-FRT-Gal4, UAS–mRFP | |
| hs-FLP / +; ; UAS- FLAG-Yrt[FWA] / tub-FRT-GAL80-FRT-Gal4, UAS–mRFP | |
| Figure 5 | |
| A | wild type ovaries treated with DMSO or aPKC inhibitor |
| B | hs-FLP / +; ; sh aPKC / tub-FRT-GAL80-FRT-GAL4, UAS–mRFP |
| C | hs-FLP; tub-GAL4, UAS-GFP / +; FRT82b, crb[11a22] / FRT82b, tub-GAL80 treated with aPKC inhibitor |
| D | hs-FLP; tub-GAL4, UAS-GFP / +; FRT82b, crb[11a22] / FRT82b, tub-GAL80 treated with aPKC inhibitor |
| E | hs-FLP; tub-GAL4, UAS-GFP / fosCrb[Y10A]; FRT82b, crb[11a22] / FRT82b,tub-GAL80 treated with aPKC inhibitor |
| F | hs-FLP; tub-GAL4, UAS-GFP / fosCrb[Y10A]; FRT82b, crb[11a22] / FRT82b,tub-GAL80 treated with aPKC inhibitor |
| G | hs-FLP; tub-GAL4, UAS-GFP / UAS-LacZ; FRT82b, crb[11a22] / FRT82b,tub-GAL80 |
| hs-FLP; tub-GAL4, UAS-GFP / UAS-FLAG-Yrt[5A]; FRT82b / FRT82b,tub-GAL81 | |
| hs-FLP; tub-GAL4, UAS-GFP / UAS-FLAG-Yrt[5A]; FRT82b, crb[11a22] / FRT82b,tub-GAL80 | |
| H | hs-FLP; tub-GAL4, UAS-GFP / UAS-LacZ; FRT82b, crb[11a22] / FRT82b,tub-GAL80 |
| hs-FLP; tub-GAL4, UAS-GFP / UAS-FLAG-Yrt[5A]; FRT82b / FRT82b,tub-GAL81 | |
| hs-FLP; tub-GAL4, UAS-GFP / UAS-FLAG-Yrt[5A]; FRT82b, crb[11a22] / FRT82b,tub-GAL80 | |
| I | hs-FLP; tub-GAL4, UAS-GFP / UAS-FLAG-Yrt[5A], fosCrb; FRT82b, crb[11a22] / FRT82b,tub-GAL80 |
| hs-FLP; tub-GAL4, UAS-GFP / UAS-FLAG-Yrt[5A], fosCrb[Y10A]; FRT82b, crb[11a22] / FRT82b,tub-GAL80 | |
| J | hs-FLP; tub-GAL4, UAS-GFP / UAS-FLAG-Yrt[5A], fosCrb; FRT82b, crb[11a22] / FRT82b,tub-GAL80 |
| hs-FLP; tub-GAL4, UAS-GFP / UAS-FLAG-Yrt[5A], fosCrb[Y10A]; FRT82b, crb[11a22] / FRT82b,tub-GAL80 | |
| Figure 6 | |
| A | hs-FLP / +; ; UAS-sh moe / tub-FRT-GAL80-FRT-GAL4, UAS–mRFP treated with H2O or aPKC inhibitor |
| B | hs-FLP / +; ; UAS-sh moe / tub-FRT-GAL80-FRT-GAL4, UAS–mRFP treated with H2O or aPKC inhibitor |
| C | hs-FLP / +; UAS- myc-Moesin[T559D] / +; + / tub-FRT-GAL80-FRT-GAL4, UAS–mRFP |
| hs-FLP / +; UAS- LacZ / +; UAS- FLAG-Yrt / tub-FRT-GAL80-FRT-GAL4, UAS–mRFP | |
| hs-FLP / +; UAS- myc-Moesin[T559D] / +; UAS- FLAG-Yrt / tub-FRT-GAL80-FRT-GAL4, UAS–mRFP | |
| D | hs-FLP / +; UAS- myc-Moesin[T559D] / +; + / tub-FRT-GAL80-FRT-GAL4, UAS–mRFP |
| hs-FLP / +; UAS- LacZ / +; UAS- FLAG-Yrt / tub-FRT-GAL80-FRT-GAL4, UAS–mRFP | |
| hs-FLP / +; UAS- myc-Moesin[T559D] / +; UAS- FLAG-Yrt / tub-FRT-GAL80-FRT-GAL4, UAS–mRFP | |
| Figure 7 | |
| A | hs-FLP / +; ; UAS- LacZ / tub-FRT-Gal80-FRT-Gal4, UAS–mRFP |
| hs-FLP / +; ; UAS-aPKC[CAAX], Par6 / tub-FRT-GAL80-FRT-GAL4, UAS–mRFP | |
| hs-FLP / +; ; UAS-Pak[Myr] / +; + / tub-FRT-GAL80-FRT-GAL4, UAS–mRFP | |
| hs-FLP / +; ; UAS-Pak[Myr] / +; UAS-aPKC[CAAX], Par6 / tub-FRT-GAL80-FRT-GAL4, UAS–mRFP | |
| B | hs-FLP / +; ; UAS- LacZ / tub-FRT-Gal80-FRT-Gal4, UAS–mRFP |
| hs-FLP / +; ; UAS-aPKC[CAAX], Par6 / tub-FRT-GAL80-FRT-GAL4, UAS–mRFP | |
| hs-FLP / +; ; UAS-Pak[Myr] / +; + / tub-FRT-GAL80-FRT-GAL4, UAS–mRFP | |
| hs-FLP / +; ; UAS-Pak[Myr] / +; UAS-aPKC[CAAX], Par6 / tub-FRT-GAL80-FRT-GAL4, UAS–mRFP | |
| C | Daughterless-GAL4 / +; UAS-FLAG-GFP / Daughterless-GAL4 |
| Daughterless-GAL4 / +; UAS-aPKC[CAAX], Par6 / Daughterless-GAL4 | |
| Daughterless-GAL4 / UAS-Pak[myr]; + / Daughterless-GAL4 | |
| D | wild type |
| Pp2A-29b[EP2332] | |
| E | wild type embryos treated with DMSO or PP2A inhibitor |
| F | Daughterless-GAL4 / UAS-Pak[myr]; + / Daughterless-GAL4 treated with DMSO or PP2A inhibitor |
| Figure 8 | |
| A | hs-FLP / +; ; UAS- FLAG-Yrt / tub-FRT-GAL80-FRT-GAL4, UAS–mRFP treated with DMSO or Pak1 inhibitor |
| B | hs-FLP / +; ; UAS- FLAG-Yrt / tub-FRT-GAL80-FRT-GAL4, UAS–mRFP treated with DMSO or Pak1 inhibitor |
| C | hs-FLP / +; sh Pak1; + / tub-FRT-GAL80-FRT-GAL4, UAS–mRFP |
| hs-FLP / +; sh Pak1; UAS- FLAG-Yrt / tub-FRT-GAL80-FRT-GAL4, UAS–mRFP | |
| hs-FLP / +; sh Pak1; UAS- FLAG-Yrt[5A] / tub-FRT-GAL80-FRT-GAL4, UAS–mRFP | |
| D | hs-FLP / +; sh Pak1; + / tub-FRT-GAL80-FRT-GAL4, UAS–mRFP |
| hs-FLP / +; sh lexA; UAS- FLAG-Yrt / tub-FRT-GAL80-FRT-GAL4, UAS–mRFP | |
| hs-FLP / +; sh Pak1; UAS- FLAG-Yrt / tub-FRT-GAL80-FRT-GAL4, UAS–mRFP | |
| hs-FLP / +; sh lexA; UAS- FLAG-Yrt[5A] / tub-FRT-GAL80-FRT-GAL4, UAS–mRFP | |
| hs-FLP / +; sh Pak1; UAS- FLAG-Yrt[5A] / tub-FRT-GAL80-FRT-GAL4, UAS–mRFP | |
| E | hs-FLP / +; ; UAS- FLAG-Yrt / tub-FRT-GAL80-FRT-GAL4, UAS–mRFP treated with DMSO or PP2A inhibitor |
| hs-FLP / +; ; UAS- FLAG-Yrt[5A] / tub-FRT-GAL80-FRT-GAL4, UAS–mRFP treated with DMSO or PP2A inhibitor | |
| F | hs-FLP / +; ; UAS- FLAG-Yrt / tub-FRT-GAL80-FRT-GAL4, UAS–mRFP treated with DMSO or PP2A inhibitor |
| hs-FLP / +; ; UAS- FLAG-Yrt[5A] / tub-FRT-GAL80-FRT-GAL4, UAS–mRFP treated with DMSO or PP2A inhibitor | |
| G | hs-FLP / +; ; sh Pp2A-29b / tub-FRT-GAL80-FRT-GAL4, UAS–mRFP |
| hs-FLP / +; UAS-FLAG-Yrt; sh Pp2A-29b / tub-FRT-GAL80-FRT-GAL4, UAS–mRFP | |
| hs-FLP / +; UAS-FLAG-Yrt[5A]; sh Pp2A-29b / tub-FRT-GAL80-FRT-GAL4, UAS–mRFP | |
| H | hs-FLP / +; ; sh Pp2A-29b / tub-FRT-GAL80-FRT-GAL4, UAS–mRFP |
| hs-FLP / +; sh lexA; UAS- FLAG-Yrt / tub-FRT-GAL80-FRT-GAL4, UAS–mRFP | |
| hs-FLP / +; UAS-FLAG-Yrt; sh Pp2A-29b / tub-FRT-GAL80-FRT-GAL4, UAS–mRFP | |
| hs-FLP / +; sh lexA; UAS- FLAG-Yrt[5A] / tub-FRT-GAL80-FRT-GAL4, UAS–mRFP | |
| hs-FLP / +; UAS-FLAG-Yrt[5A]; sh Pp2A-29b / tub-FRT-GAL80-FRT-GAL4, UAS–mRFP | |
Additional files
Download links
A two-part list of links to download the article, or parts of the article, in various formats.
Downloads (link to download the article as PDF)
Open citations (links to open the citations from this article in various online reference manager services)
Cite this article (links to download the citations from this article in formats compatible with various reference manager tools)
Pak1 and PP2A antagonize aPKC function to support cortical tension induced by the Crumbs-Yurt complex
eLife 10:e67999.
https://doi.org/10.7554/eLife.67999


