Psychomotor impairments and therapeutic implications revealed by a mutation associated with infantile Parkinsonism-Dystonia
- Department of Pharmacology, Vanderbilt University, United States
- Department of Surgery, University of Alabama at Birmingham, United States
- Department of Computational and Systems Biology, School of Medicine, University of Pittsburgh, United States
- School of Medical Sciences, Faculty of Medicine and Health, University of Sydney, Australia
- Department of Molecular Physiology & Biophysics, Vanderbilt University, United States
- Center for Structural Biology, Vanderbilt University, United States
- Department of Chemistry, Vanderbilt University, United States
- Department of Biomedical Sciences, Idaho College of Osteopathic Medicine, United States
- Computational Chemistry and Molecular Biophysics Section, NIDA, NIH, United States
- Molecular Neurosciences, Developmental Neurosciences, University College London (UCL), United Kingdom
- Laboratory of Molecular & Cellular Neurobiology, NIMH, NIH, United States
- Institute for Drug Discovery, Leipzig University Medical School, Germany
- Center for Inter-systemic Networks and Enteric Medical Advances, University of Alabama at Birmingham, United States
Figures
Figure 1 with 1 supplement
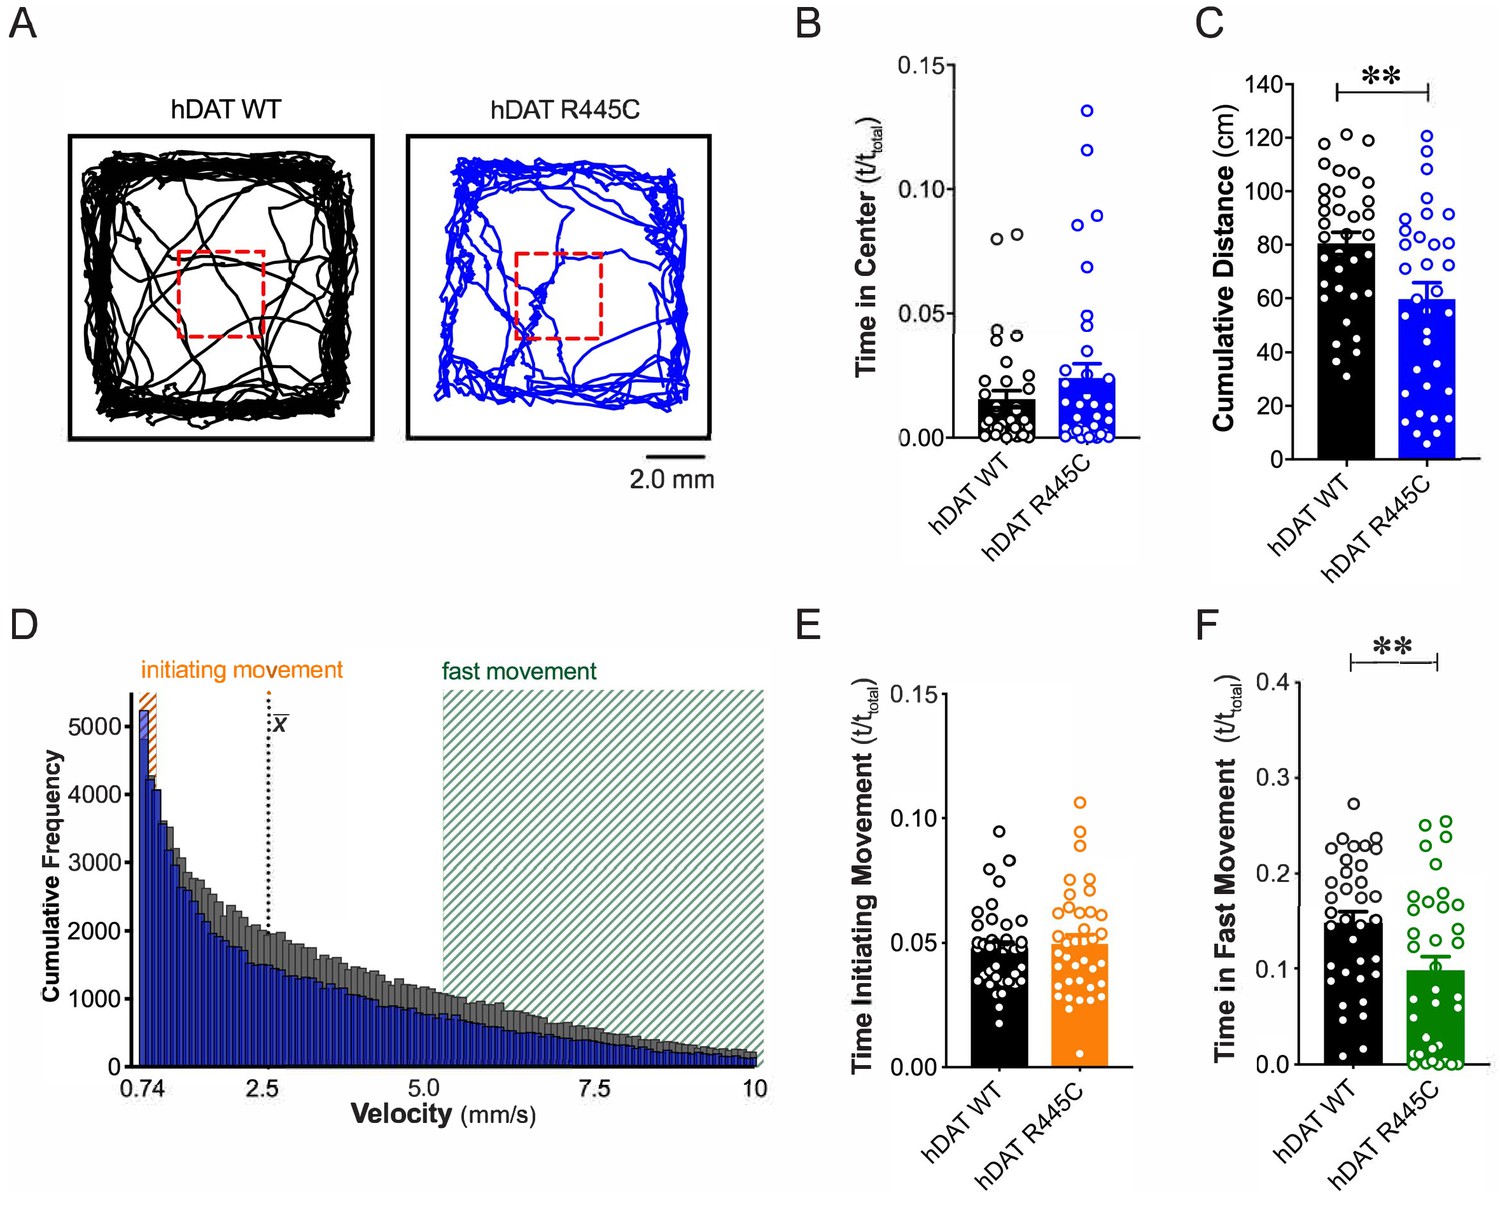
R445C variant disrupts locomotive behaviors in Drosophila.
(A) hDAT WT or hDAT R445C was selectively expressed in DA neurons in a dDAT KO (fmn) background. Representative trajectories of hDAT WT (black) and hDAT R445C (blue) flies in an open-field test during a 5 min test period. 3 × 3 mm square (red dashed lines) delineates the center space. (B) hDAT WT and hDAT R445C flies spent comparable time in the center space (p>0.05; n = 35). (C) hDAT R445C flies traveled significantly less relative to hDAT WT flies (p=0.006; n = 35). (D) Histogram represents instantaneous velocities ranging from 0.74 to 10.0 mm/s (bin width = 0.094 mm/s; see Materials and methods) and corresponding frequencies (number of times) for hDAT WT (gray bars) and hDAT R445C (blue bars) flies. Initiating movement velocities (0.74–0.94 mm/s, orange shaded), fast movement velocities (5.3–10.0 mm/s, green shaded), average velocity (x̄) are highlighted. (E) hDAT R445C flies spent a comparable amount of time initiating movement relative to hDAT WT flies (p>0.05; n = 35). (F) hDAT WT flies spent significantly more time in fast movement compared with hDAT R445C flies (p=0.001; n = 35). Data represent mean ± SEM. Welch’s t-test: (B); Mann-Whitney test (C) and (E - F).
Figure 1—figure supplement 1

AMPH-induced DA efflux and behaviors in hDAT WT flies.
(A) (top) AMPH-induced (arrow) amperometric currents in DATfmn, dDAT, and hDAT WT brains. In hDAT WT brains, cocaine (20 µM) blocked the ability of AMPH to cause DA efflux. (bottom) Quantitation of peak currents showed a significant decrease in DA efflux measured in DATfmn relative to dDAT and hDAT WT brains, as well as in hDAT WT brains in the presence of cocaine. (F(3,18) = 9.341, p=0.0006; n = 3–7). (B) DA uptake in intact brains of DATfmn, dDAT, and hDAT WT flies (F(2,9) = 25.75, p=0.0002; n = 4). (C) AMPH-induced locomotion measured by beam crossing detection recorded over a 60-min time period in DATfmn, dDAT and hDAT WT flies Interaction F(2,24) = 52.66, p<0.0001; n = 5. Data represent mean ± SEM. One-way ANOVA with Tukey’s multiple comparison test (A)-(B); Two-way ANOVA with Tukey’s multiple comparison test (C). *p<0.05; **p<0.01; ***p<0.001; ****p<0.0001.
Figure 2
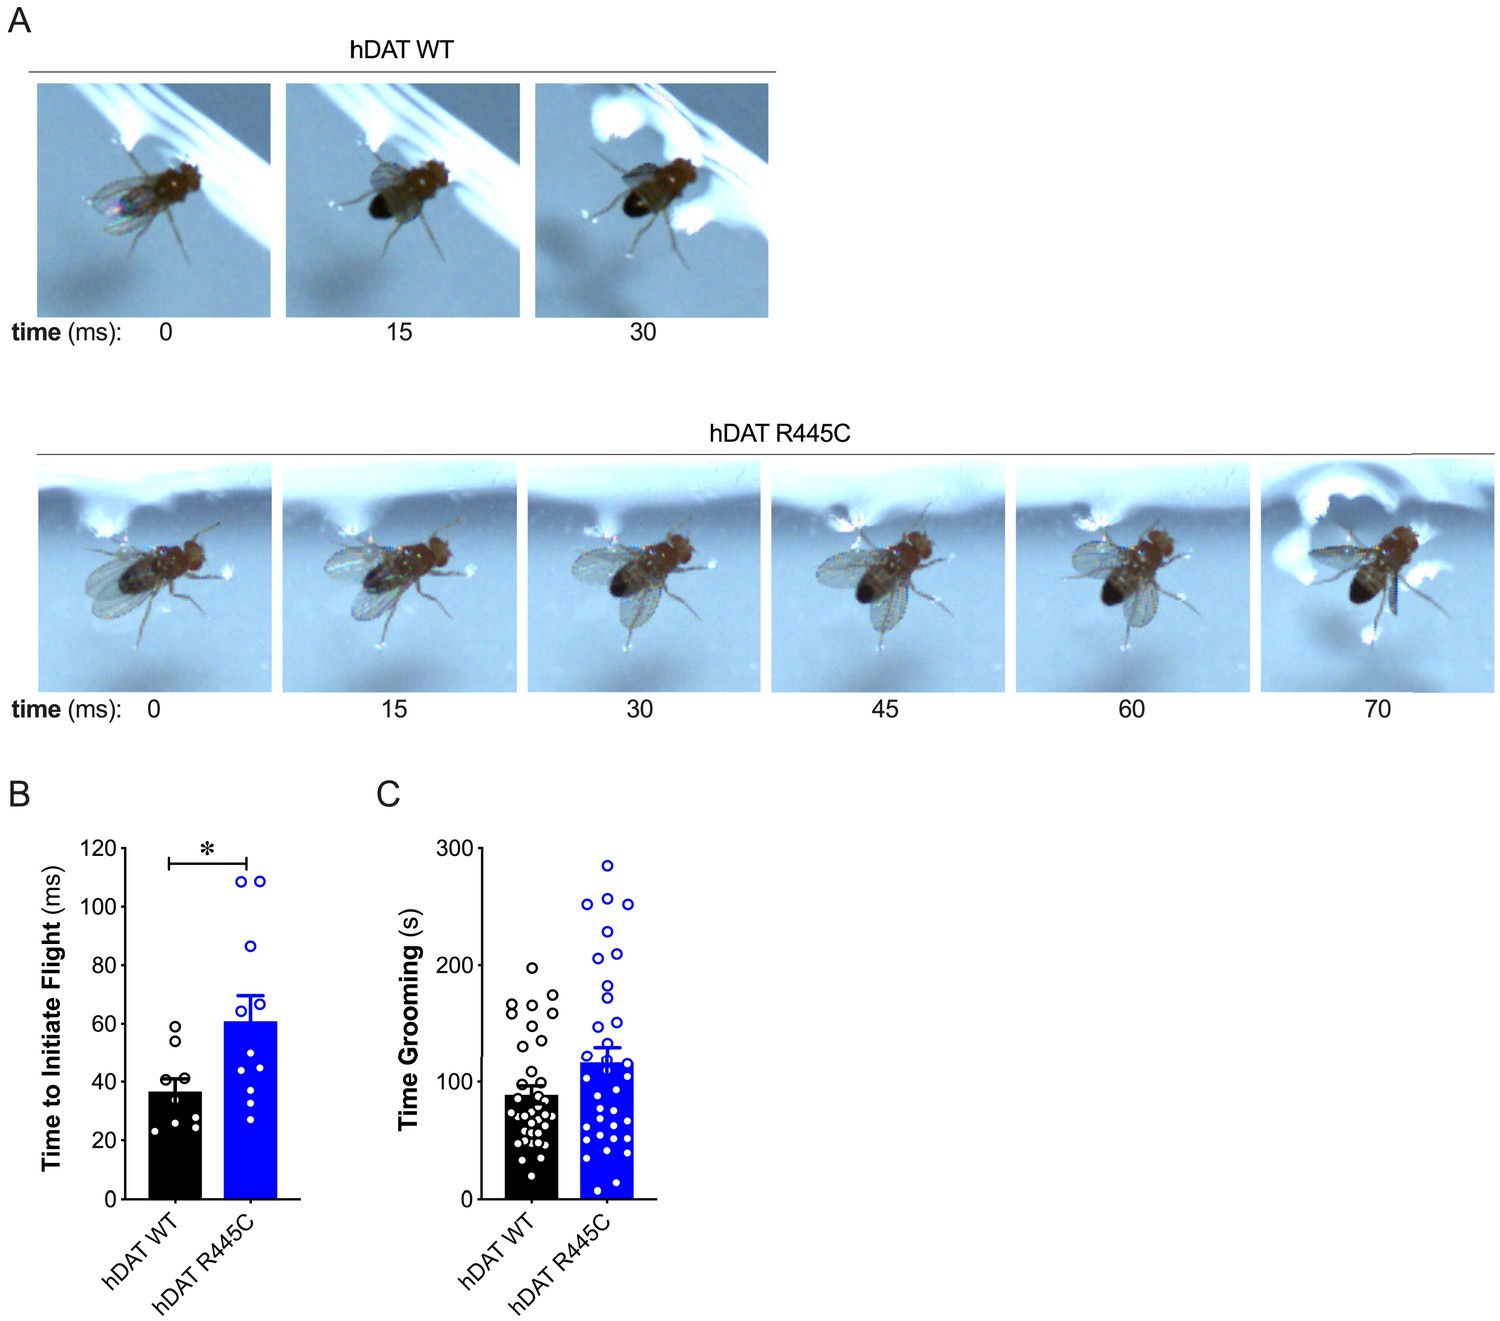
R445C variant selectively impairs coordinated motor behaviors, such as take-off, but not repetitive motor behaviors, such as grooming.
(A) Representative single frames of Drosophila hDAT WT (top) and hDAT R445C (bottom) during various phases of coordinated take-off (video recorded at 2000 fps). (B) Flight initiation (take-off) was quantified from the initial phase of wing elevation (t = 0) to the second phase of simultaneous wing depression and leg extension. Flight initiation was significantly delayed in hDAT R445C flies relative to hDAT WT (p=0.03; n = 10–11). (C) hDAT R445C flies spent comparable time grooming compared with hDAT WT flies (p>0.05; n = 35). Data represent mean ± SEM. Welch’s t-test: (B); Mann-Whitney test (C).
Figure 3
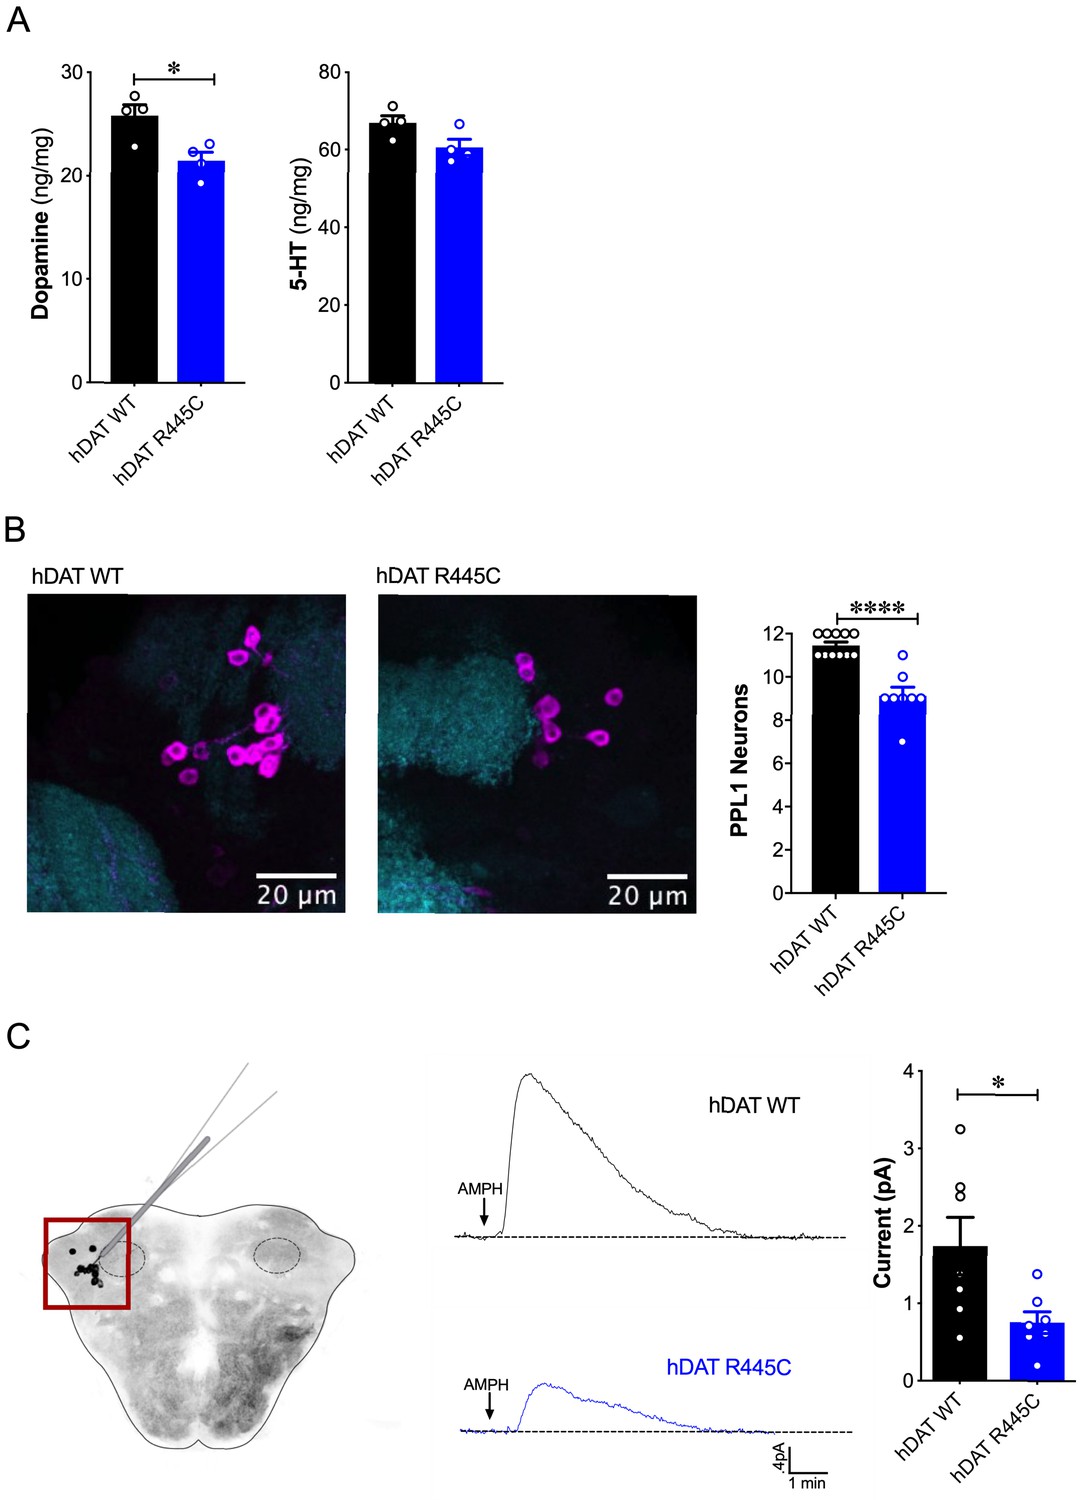
Reduced brain DA content and AMPH-induced DA efflux in hDAT R445C flies.
(A) Tissue concentration of DA (left) and 5-HT (right) measured by HPLC (n = 4, 20 brains per measurement). DA content was significantly decreased in hDAT R445C relative to hDAT WT brains (p=0.01). 5-HT content in hDAT R445C was comparable to hDAT WT (p>0.05). (B) Confocal z-stack (5 µm) of hDAT WT (left) and hDAT R445C (center) brains co-stained with anti-TH (magenta) and anti-n82 (cyan) zoomed-in on PPL1 neurons. Quantitation of TH-positive PPL1 neurons showed a significant reduction of these neurons in hDAT R445C brains relative to hDAT WT (p<0.0001; n = 8–11; right) (C) Diagram illustrates amperometric studies in Drosophila brains in which a carbon fiber electrode records currents from TH-positive PPL1 DA neuronal region (red box) in response to AMPH application (20 µM; left). AMPH-induced (arrow) amperometric currents in hDAT WT (black trace) and hDAT R445C (blue trace) brains. Quantitation of peak currents showed a significant decrease in DA efflux measured in hDAT R445C relative to hDAT WT (p=0.04; n = 7; right). Data represent mean ± SEM. Student’s t-test (A)-(B); Welch’s t-test: (C).
Figure 4 with 2 supplements
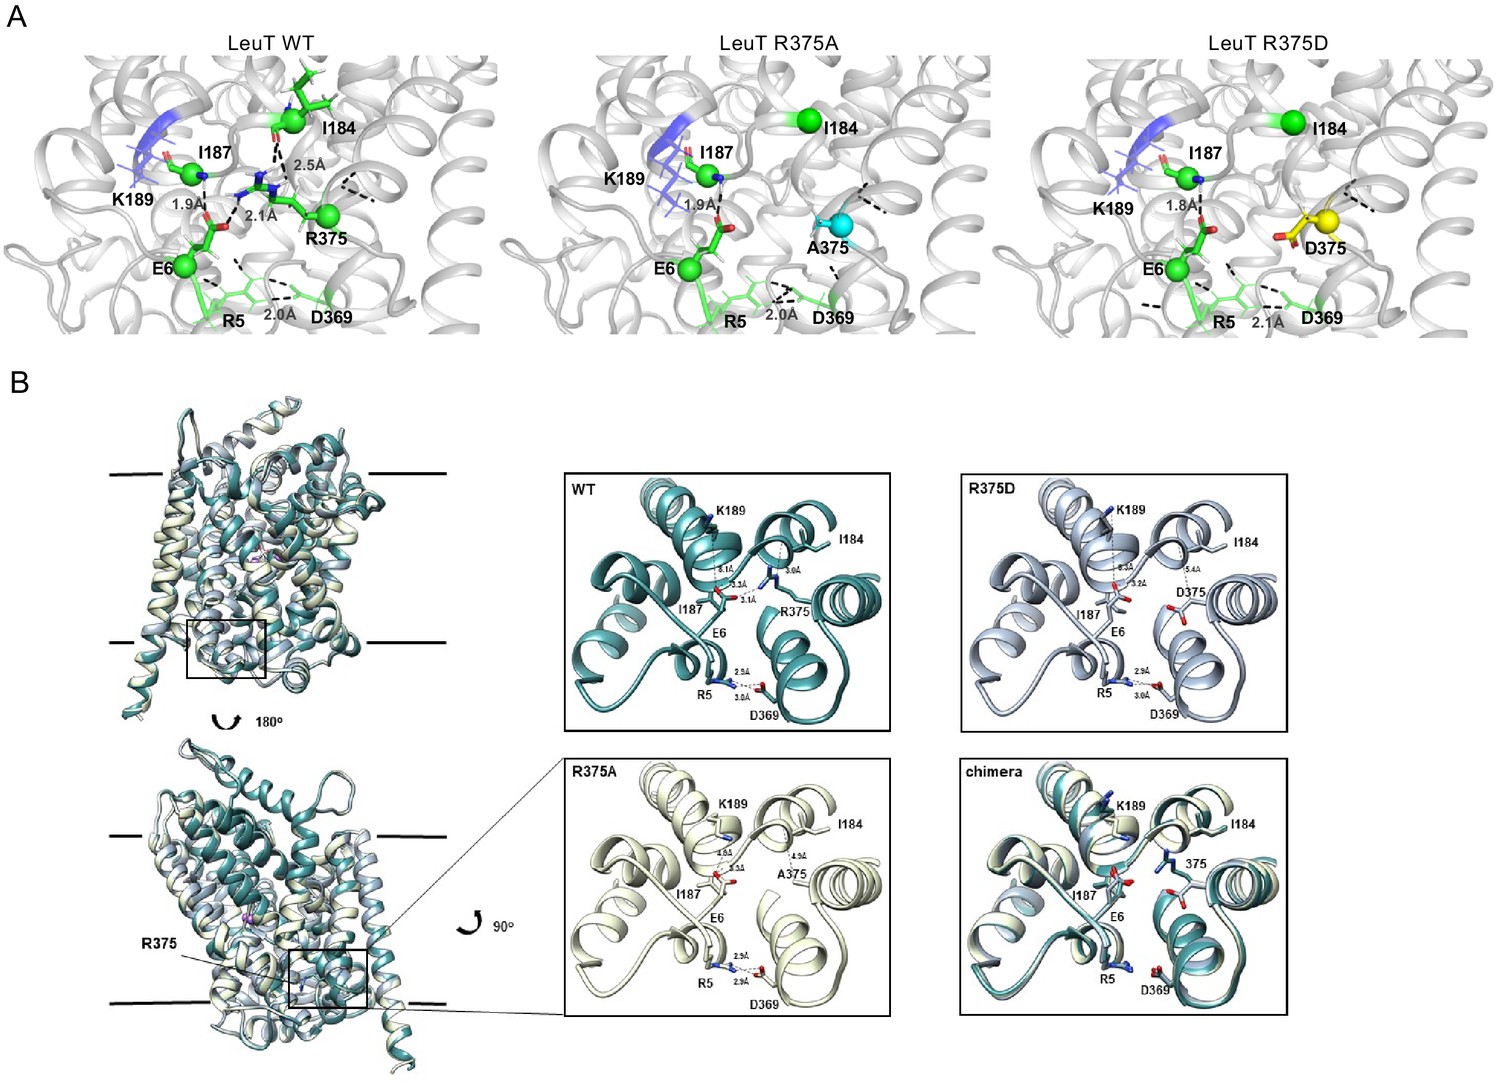
Representative Rosetta models and crystallographic structures of LeuT revealed weakening of E6-R375 salt bridge promoted by substitutions at R375 (corresponding to R445 in hDAT).
(A) Models derived, using Rosetta, of LeuT WT (left), LeuT R375A (middle) and LeuT R375D (right) where protein backbones are represented as cartoons and residues E6, I184, I187, R5, and D369 are represented as green spheres and sticks. K189 is colored in blue throughout each model. R375 is colored in green (left). A375 is colored in cyan (middle). D375 is colored in yellow (right). All corresponding polar contacts between side chain or backbone atoms in each model are represented as dashed lines in black. R375 substitution to either Ala or Asp disrupted E6-R375 salt bridge. (B) Crystal structures of LeuT WT (green), LeuT R375A (cream) and LeuT R375D (grey) are superimposed. Box indicates area of zoomed-in view of TM1-TM8 IC region for LeuT WT (top left), LeuT R375D (top right), LeuT R375A (bottom left) and overlay of three structures (bottom right). Distances between residues are shown in dashed lines.
Figure 4—figure supplement 1
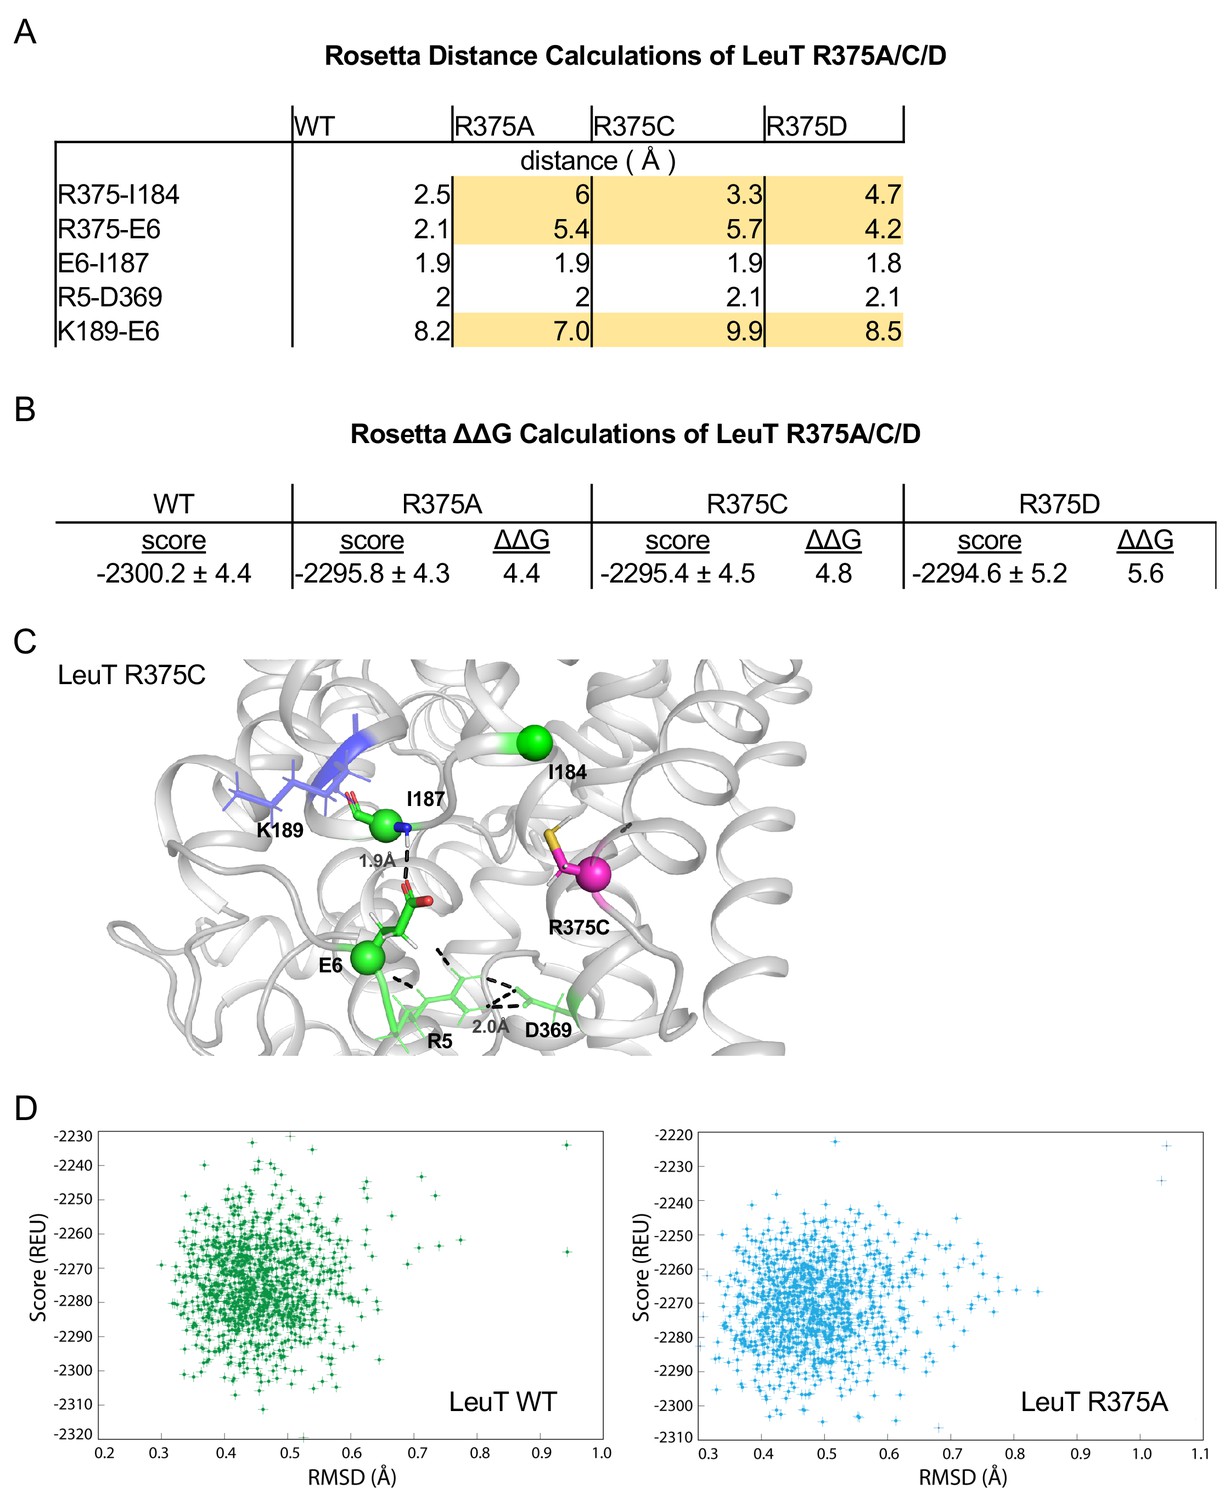
Related to Figure 4A.
(A) Distances between IC residues in angstroms (Å) for LeuT WT, R375A, R375C, and R375D. (B) Rosetta scores represent the average scores of the top 5% of models. ΔΔG values are in Rosetta Energy Units (REUs). (C) Rosetta modeling of LeuT R375C, where protein backbones are represented in gray, amino acid side chains in green, K189 in blue, and R375C in magenta. All corresponding polar contacts between side chain or backbone atoms in each model are represented as dashed lines in black. (D) REU versus RMSD diagrams were obtained from 1000 Rosetta Flex ΔΔG trajectories for LeuT WT (left) and LeuT R375A (right). The RMSD between the protein backbone and heavy side chain atoms within a 10 Å distance of R375 and R375A was calculated to show the correlation between the energy-optimized models and the experimental model.
Figure 4—figure supplement 2
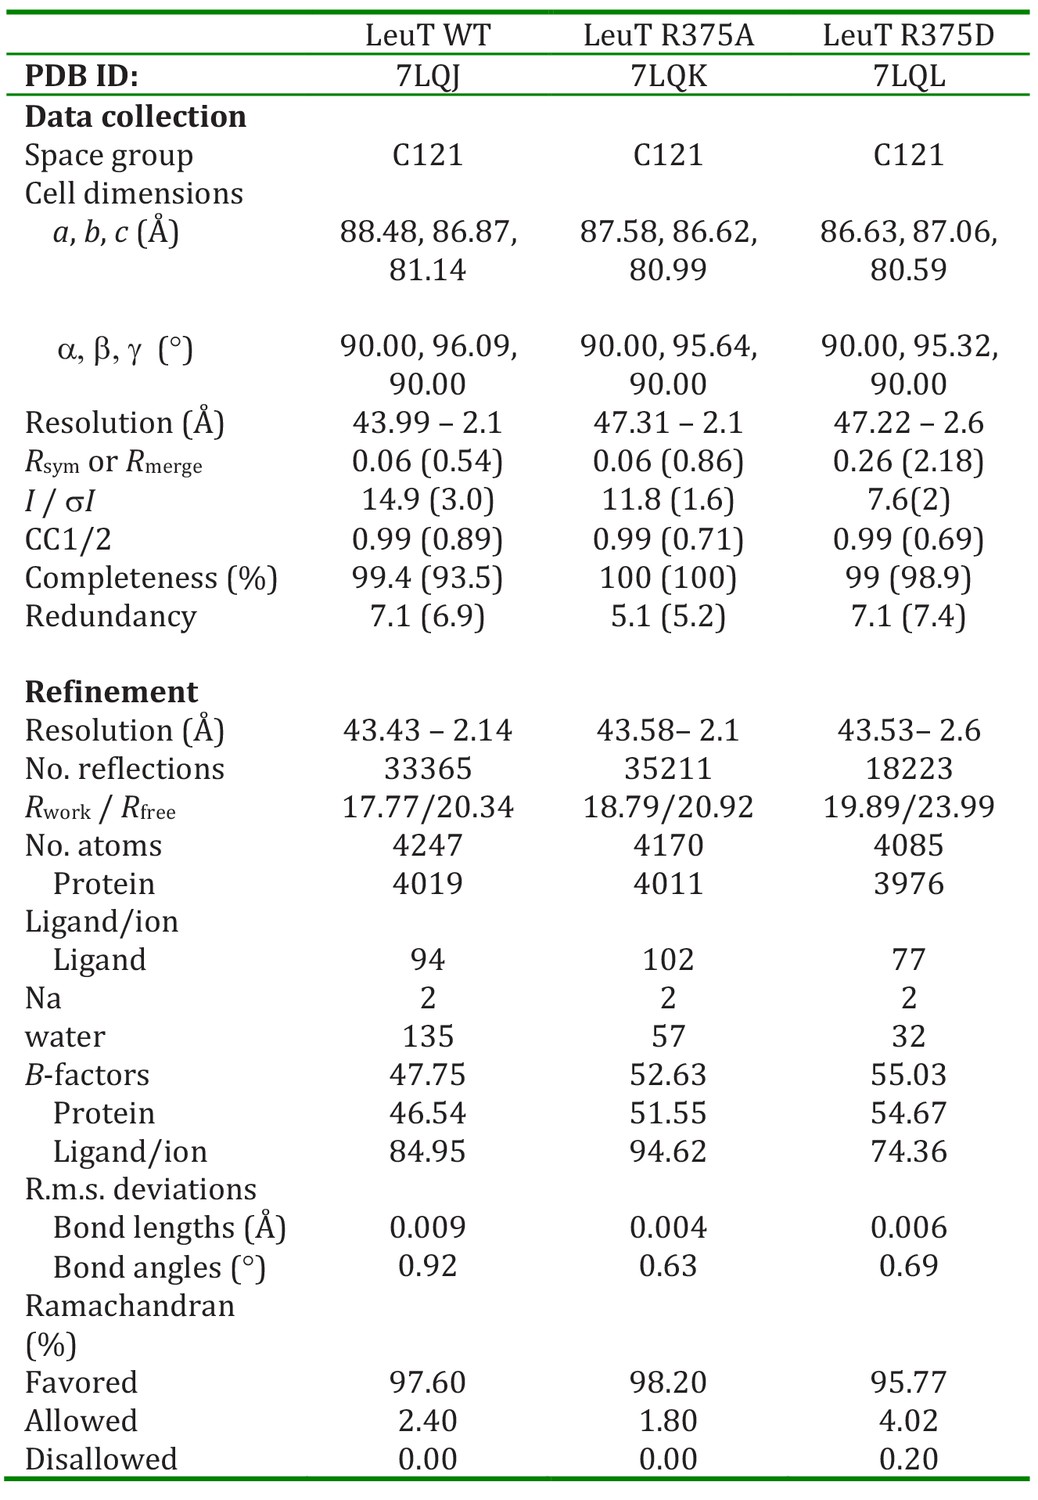
Related to Figure 4B.
Crystallographic data for LeuT WT and R375A regarding data collection, model building, and refinement statistics.
Figure 5
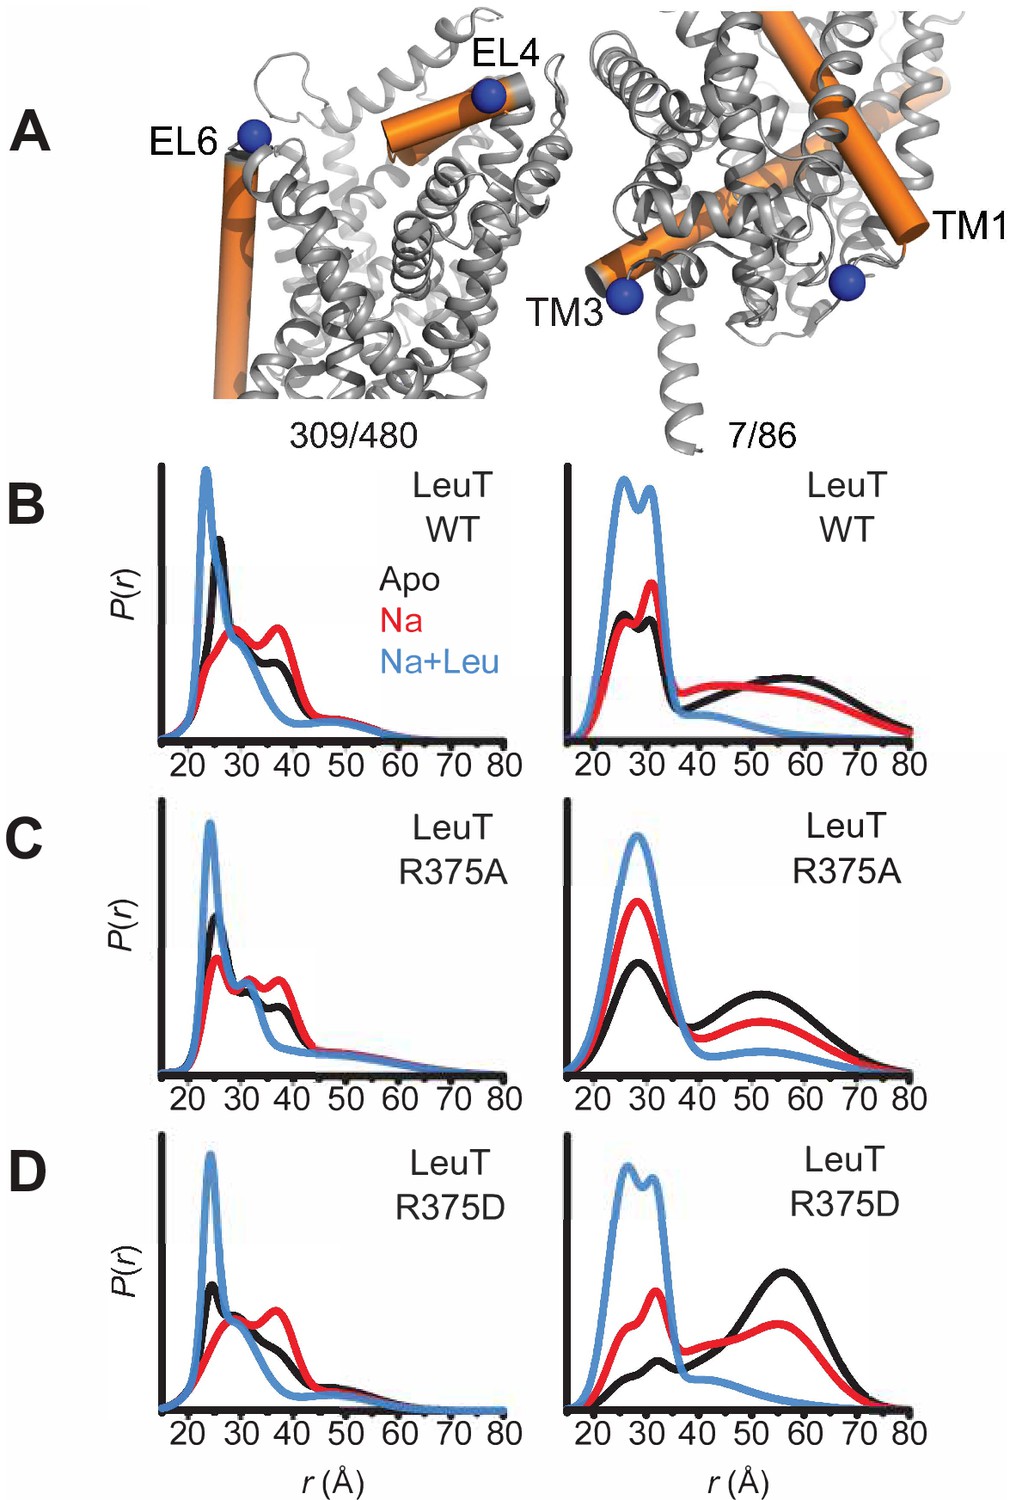
Asp substitution at R375 in LeuT favors an inward facing conformation Probability distance distributions (P(r)) of the spin labels 308/409 and 7/86 (A) reporting the conformational dynamics of the EC (left) and IC (right) gate of LeuT, respectively. Distance distributions for each pair were obtained in the Apo (black), Na+-bound (Na+; red), and Na+- and Leu-bound (Na+/Leu; blue) conformations for LeuT WT (B), LeuT R375A (C), and LeuT R375D (D).
Figure 6 with 1 supplement
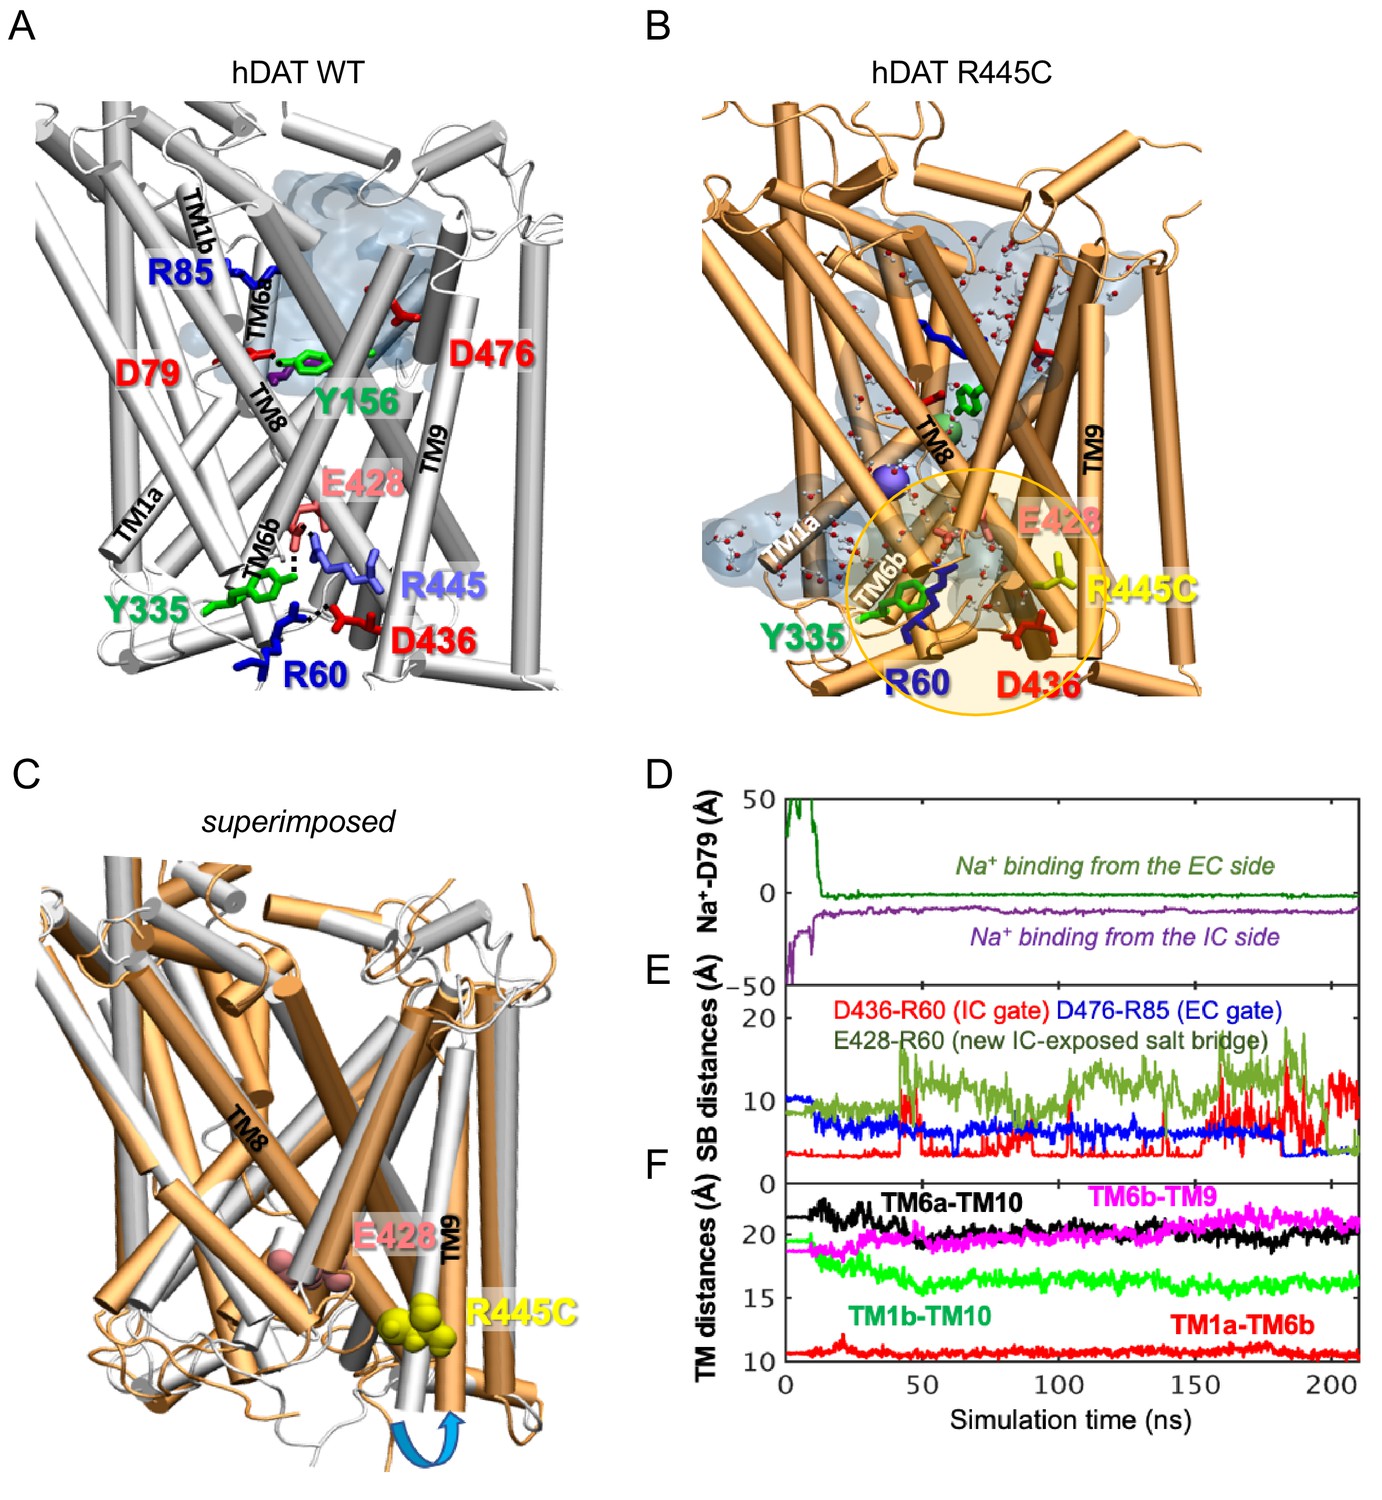
hDAT R445C favors the opening of the IC vestibule, leading to intermittent formation of a channel-like intermediate.
(A) Structure of hDAT WT in the OF state (white) illustrates a network of interactions at the IC surface stabilizing the closure of IC vestibule and solvated EC vestibule (gray shaded region). (B) Substitution of R445 with Cys (orange) breaks salt-bridge R445-E428, which weakens IC network interactions and promotes the intermittent formation of a channel-like intermediate. This conformation favors the entry of both water and ions from the IC space. Hydrated regions inside the transporter are indicated in gray shaded areas with explicit water molecules displayed in spheres and lines (CPK format). Green and purple spheres are Na+ migrating from the EC and IC side, respectively. (C) Structural alignment of hDAT R445C (orange) with hDAT WT (white). In hDAT R445C, the association between TM8 and TM9 (near the IC exposed region) is weakened. TM9 undergoes an outward titling (blue curved arrow) to allow for the ‘opening’ of IC vestibule along TM8, facilitated by the absence of C445-E428 salt bridge (R445-E428 in hDAT WT holds TM8-TM9 in place). (D–F) Results from MD simulations of hDAT R445C. Time evolution of distances between Na+ and D79 (D); between salt-bridge forming residues at EC and IC regions (E) are displayed. On the EC side, D476-R85 distance decreases (EC gate closure). On the IC side, D436-R60 distance increases (IC gate opening). D345-K66 remains closed. After dissociating from D436 (t = 150 ns), R60 interacts with E428 (t = 200 ns). (F) Interhelical distances for EC-exposed TM1b-TM10 and TM6a-TM10 shows that the EC region remains exposed to solvent with reduced opening, and IC-exposed TM1a-TM6b is closed, but there is a new opening indicated by the increase in TM6b-TM9 distance. Conformation shown in B is the last snapshot taken from the simulation trajectory in D–F.
Figure 6—figure supplement 1
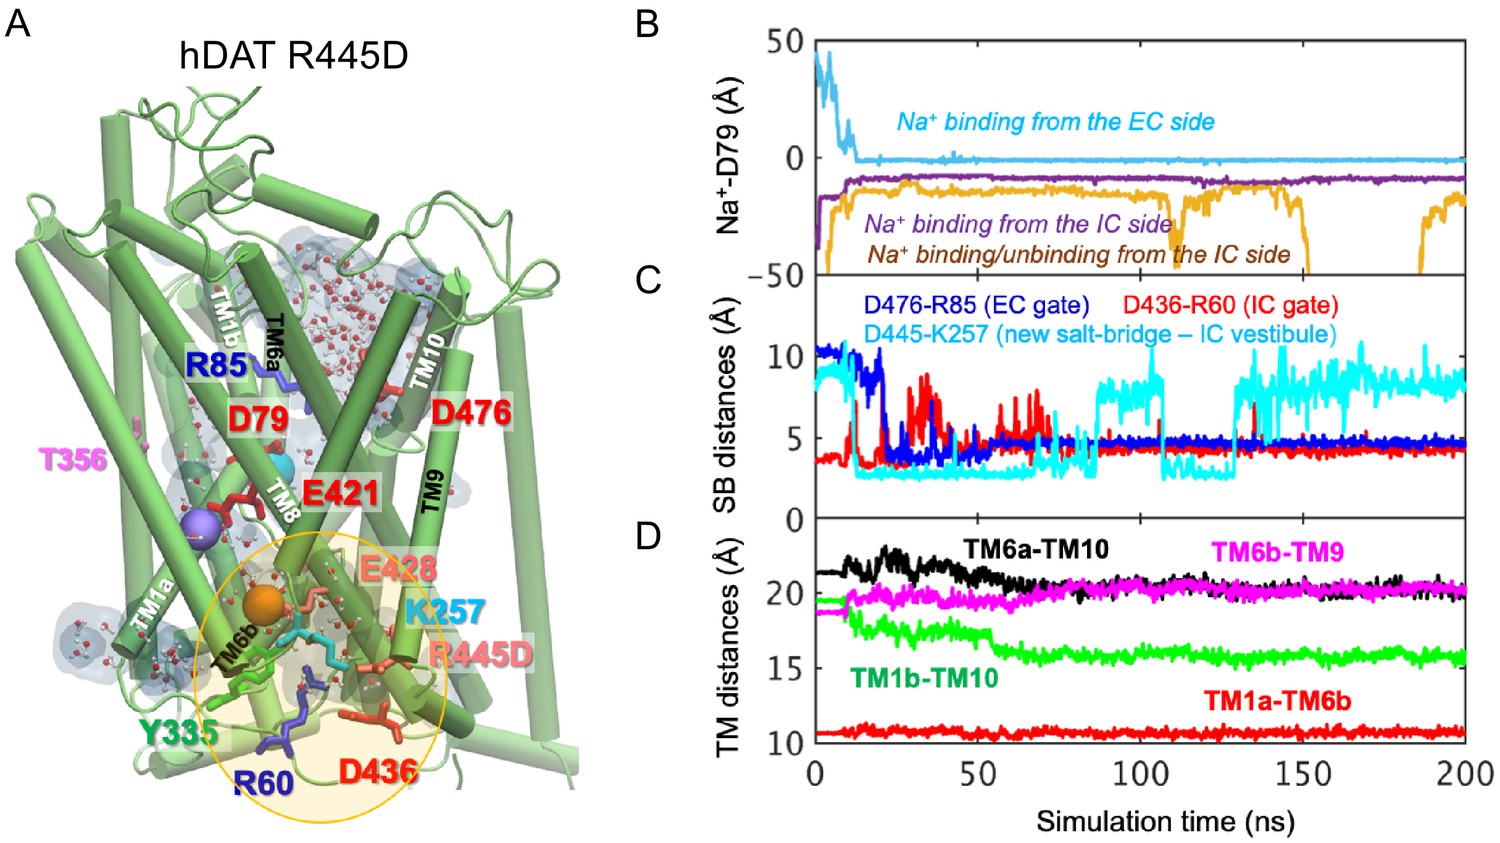
Related to Figure 6.
(A) Model of hDAT R445D showing the formation of a channel-like intermediate promoted by the opening of the IC vestibule. In hDAT R445D, three Na+ ions bind along the transport lumen (two diffusing from the IC region, and one from the EC region). The region enclosed in the yellow ellipse is more exposed to the cytosol relative to WT, allowing Na+ and water entry. Hydrated regions inside the transporter are indicated in gray shaded areas with explicit water molecules displayed in spheres and lines (CPK format). The conformation shown is a snapshot (100 ns) taken from the simulation trajectory illustrated in B-D. (B) Time evolution of distances between Na+ and D79. (C) Time evolution of distances between the D476-R85 salt-bridge on the EC side show that this interaction shortens over time (EC gate closure). The distances between D436-R60 on the IC side increase intermittently (IC gate opening). Interestingly, a new salt bridge between D445 and K257 is formed intermittently. (D) Time evolution of interhelical distances between EC-exposed TM1b-TM10 and TM6a-TM10 shows that the EC region remains exposed to solvent with reduced opening, whereas IC-exposed TM1a-TM6b shows that the IC region is predominantly closed with a slight opening indicated by the increase in TM6b-TM9 distance.
Figure 7 with 2 supplements
CQ enhances R445C expression ratios in transfected HEK 293 cells as well as Drosophila flight coordination.
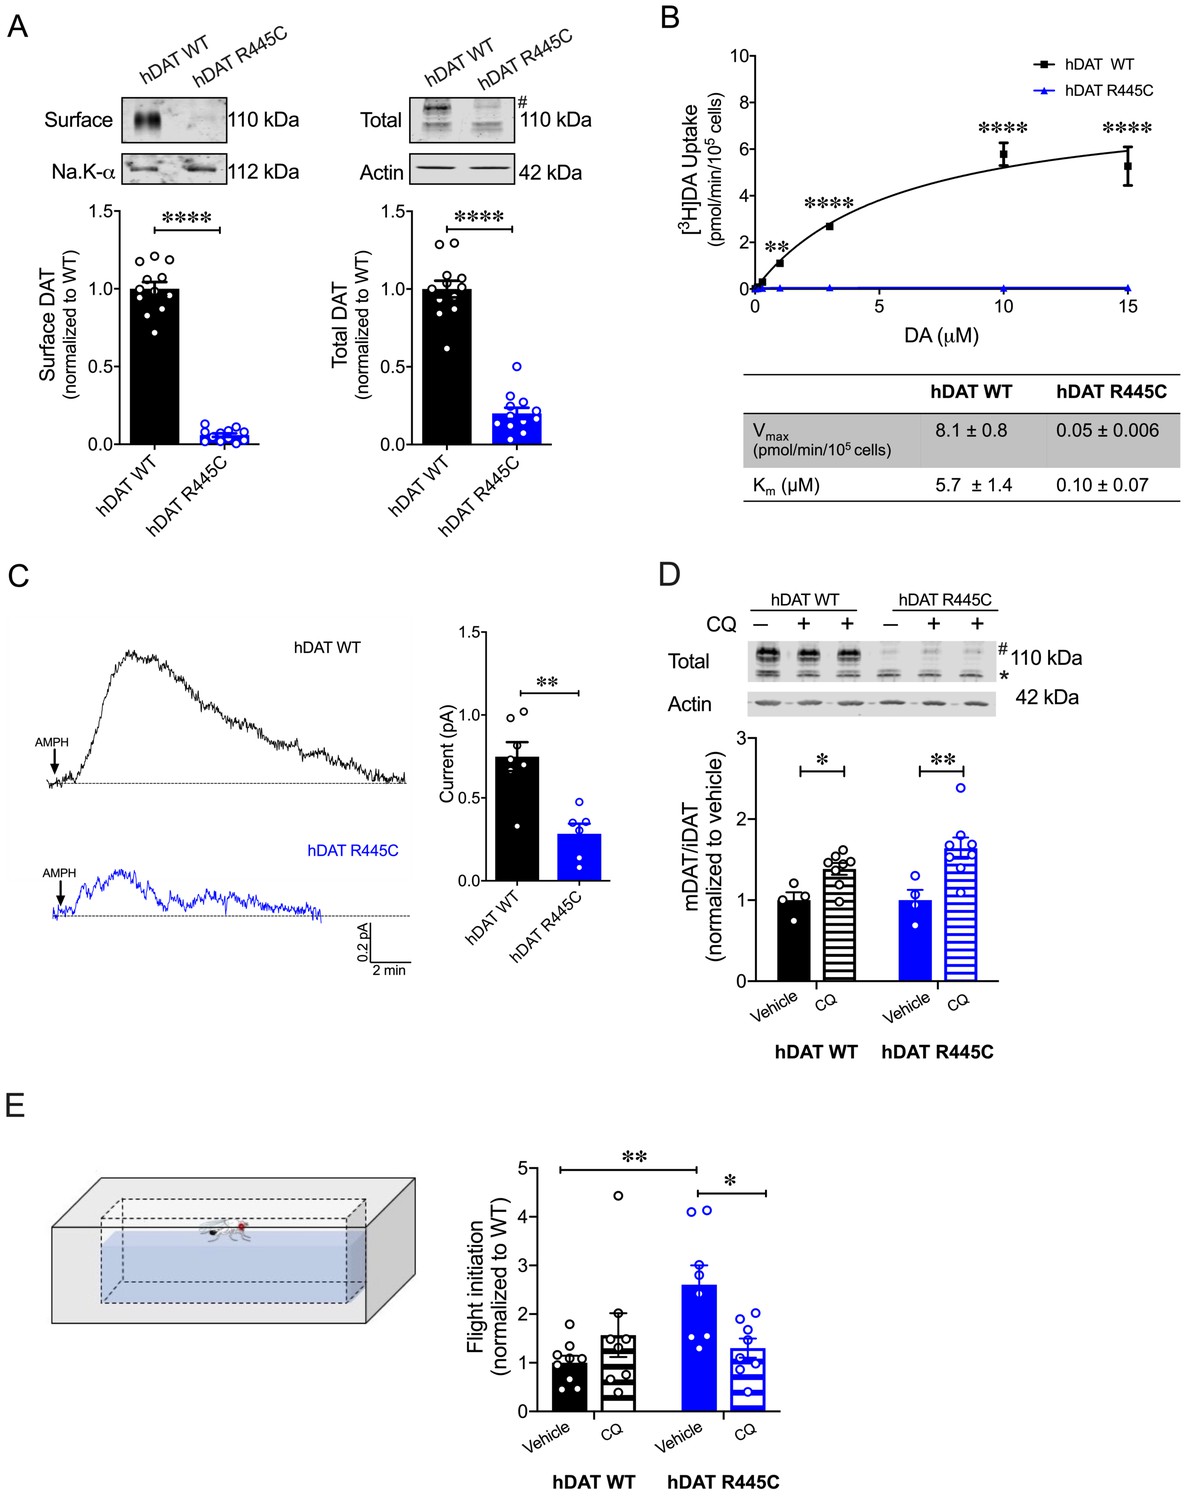
(A) Representative immunoblots of surface hDAT (top left), total hDAT (top right) and corresponding Na-K ATPase (bottom left) and actin (bottom right) loading controls. hDAT expression was normalized to hDAT WT. hDAT R445C displayed significantly reduced surface (p<0.0001; n = 4, in triplicate) and total glycosylated (#) expression relative to hDAT WT (p<0.0001; n = 4, in triplicate). (B) Average 3[H]DA saturation curves of DA uptake measured in hDAT WT (black) or hDAT R445C (blue) cells (n = 3, in triplicate). Curves were fit to Michaelis-Menten kinetics to derive Km and Vmax. DA uptake for hDAT R445C was significantly reduced compared with hDAT WT at every DA concentration measured (F(6,64) = 52.4, p<0.0001), as were the kinetic constants, Km and Vmax (p<0.0001). (C) Representative traces of amperometric currents (DA efflux) recorded in response to AMPH application (left; 10 μM, indicated by arrow) from hDAT WT (black) and hDAT R445C (blue) cells loaded with DA (2 mM, 10 min) with whole-cell pipette. Quantitation of peak current amplitudes illustrated a significant reduction in DA efflux recorded from hDAT R445C compare to hDAT WT (right; p=0.008; n = 6–7). (D) Representative immunoblots of total hDAT (top) and actin loading controls (bottom), where glycosylated (#) and non-glycosylated (*) hDAT is highlighted. Ratio of mature (glycosylated) to immature (non-glycosylated) DAT (mDAT/iDAT) expression following CQ treatment was normalized to vehicle condition for hDAT WT and hDAT R445C cells (n = 4, in duplicate). Incubating hDAT R445C cells with CQ (1 mM, 4 hr) significantly increased the ratio of mDAT/iDAT (F(1,20) = 18.0), p=0.003. CQ also significantly increased mDAT/iDAT expression in hDAT WT cells (p=0.04). (E) Diagramed is the flight initiation assay used to determine take-off times for hDAT WT and hDAT R445C Drosophila (left). hDAT R445C and hDAT WT Drosophila were fed CQ (3 mM, 72 hr) or vehicle supplemented diet. Quantitation showed a significant reduction in the time to initiate flight in hDAT R445C flies (F(1,29) = 8.7, p=0.04) in response to CQ compared with vehicle conditions (right). Time for flight initiation was comparable in hDAT WT flies exposed to CQ and vehicle supplemented diet (p>0.05). Data represent mean ± SEM. Student’s t-test (A) and (C); Two-way ANOVA with Bonferroni’s multiple comparison test: (B), and (D–E).
Figure 7—figure supplement 1
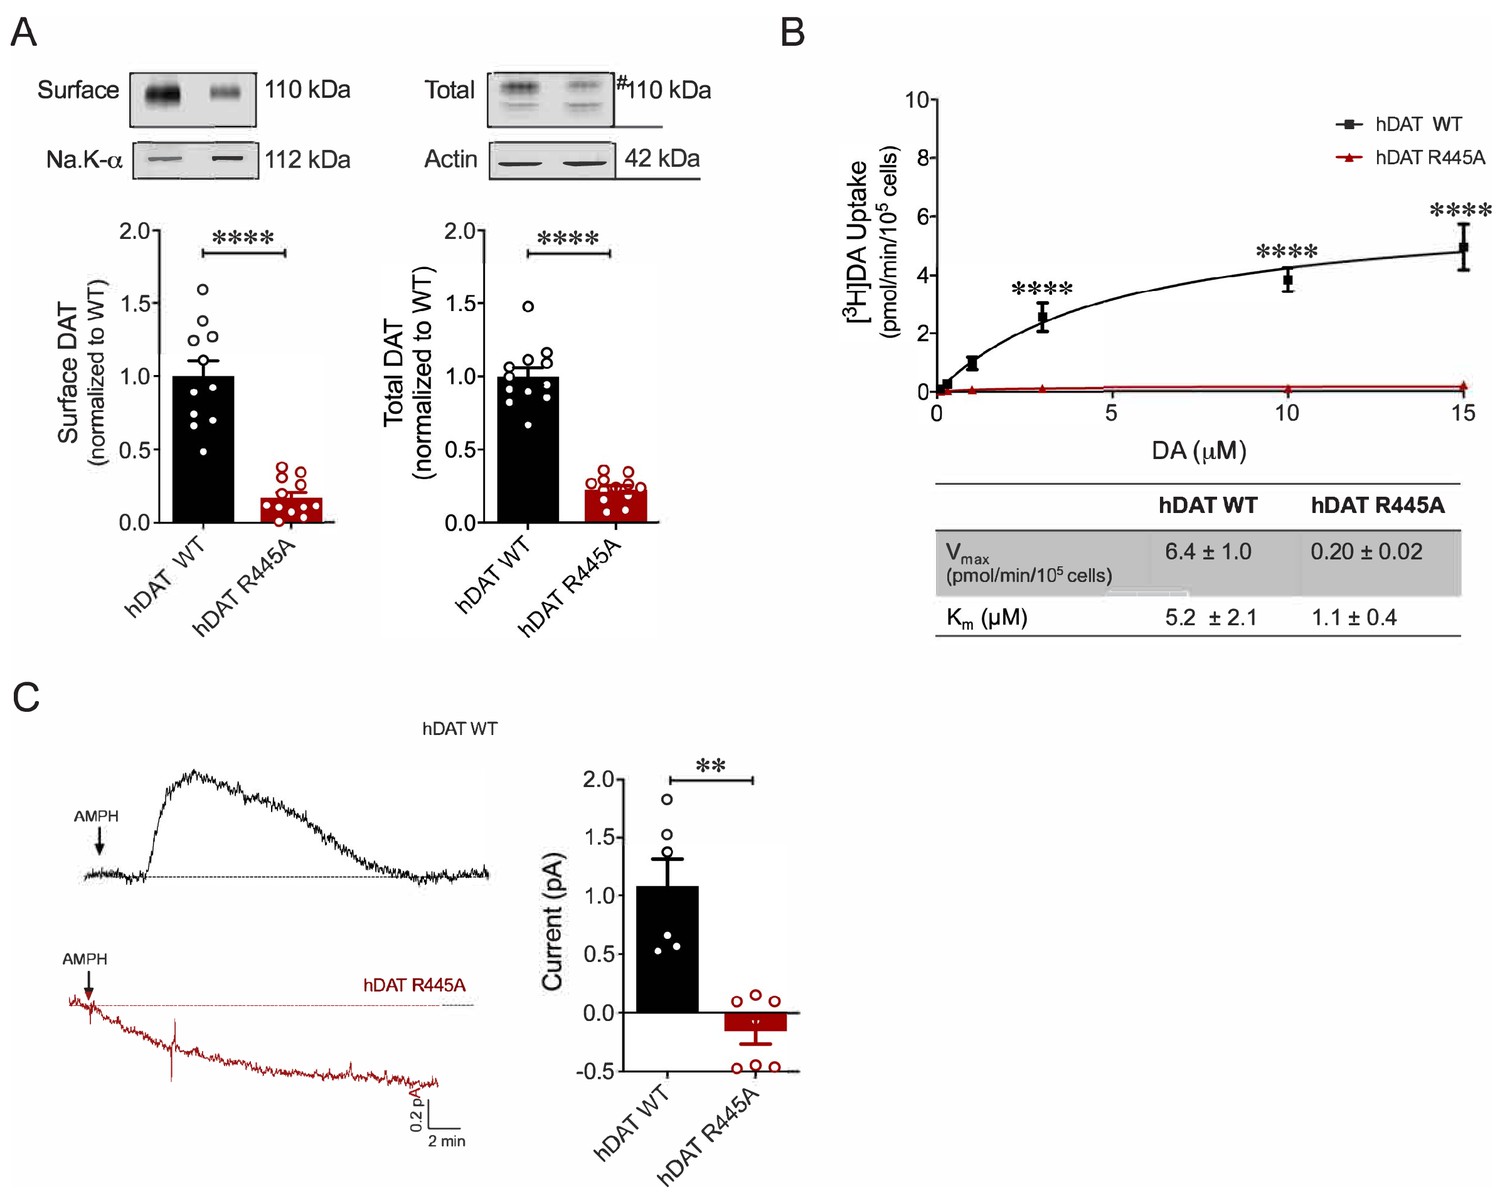
R445A substitution impairs hDAT expression and function in HEK 293 cells.
(A) Representative immunoblots of surface hDAT (top left), total hDAT (top right) and corresponding Na-K ATPase (bottom left) and actin (bottom right) loading controls (n = 4, in triplicate). hDAT expression was normalized to hDAT WT. hDAT R445A displayed significantly impaired surface (p<0.0001) and total (#) expression relative to hDAT WT (p<0.0001). (B) [3H]DA saturation curves of DA uptake measured in hDAT WT (black) and hDAT R445A (red) cells (n = 3, in triplicate). Curves were fit to Michaelis-Menten kinetics to derive Km and Vmax. DA uptake for hDAT R445A was significantly reduced compared with hDAT WT (F(5,92) = 22.7, p<0.0001) as were kinetic constants, Km and Vmax (p<0.0001). (C) Left: Representative amperometric traces (DA efflux) recorded in response to AMPH application (10 μM, indicated by arrow) from hDAT WT (black) and hDAT R445A (red) loaded with DA (2 mM, 10 min) via a whole-cell patch electrode in current-clamp. Right: Quantitation of peak amperometric current in hDAT R445A and hDAT WT cells (p=0.002; n = 6). Data represent mean ± SEM. Welch’s t-test (A); Two-way ANOVA with Bonferroni’s multiple comparison test: (B). Mann-Whitney Test (C).
Figure 7—figure supplement 2
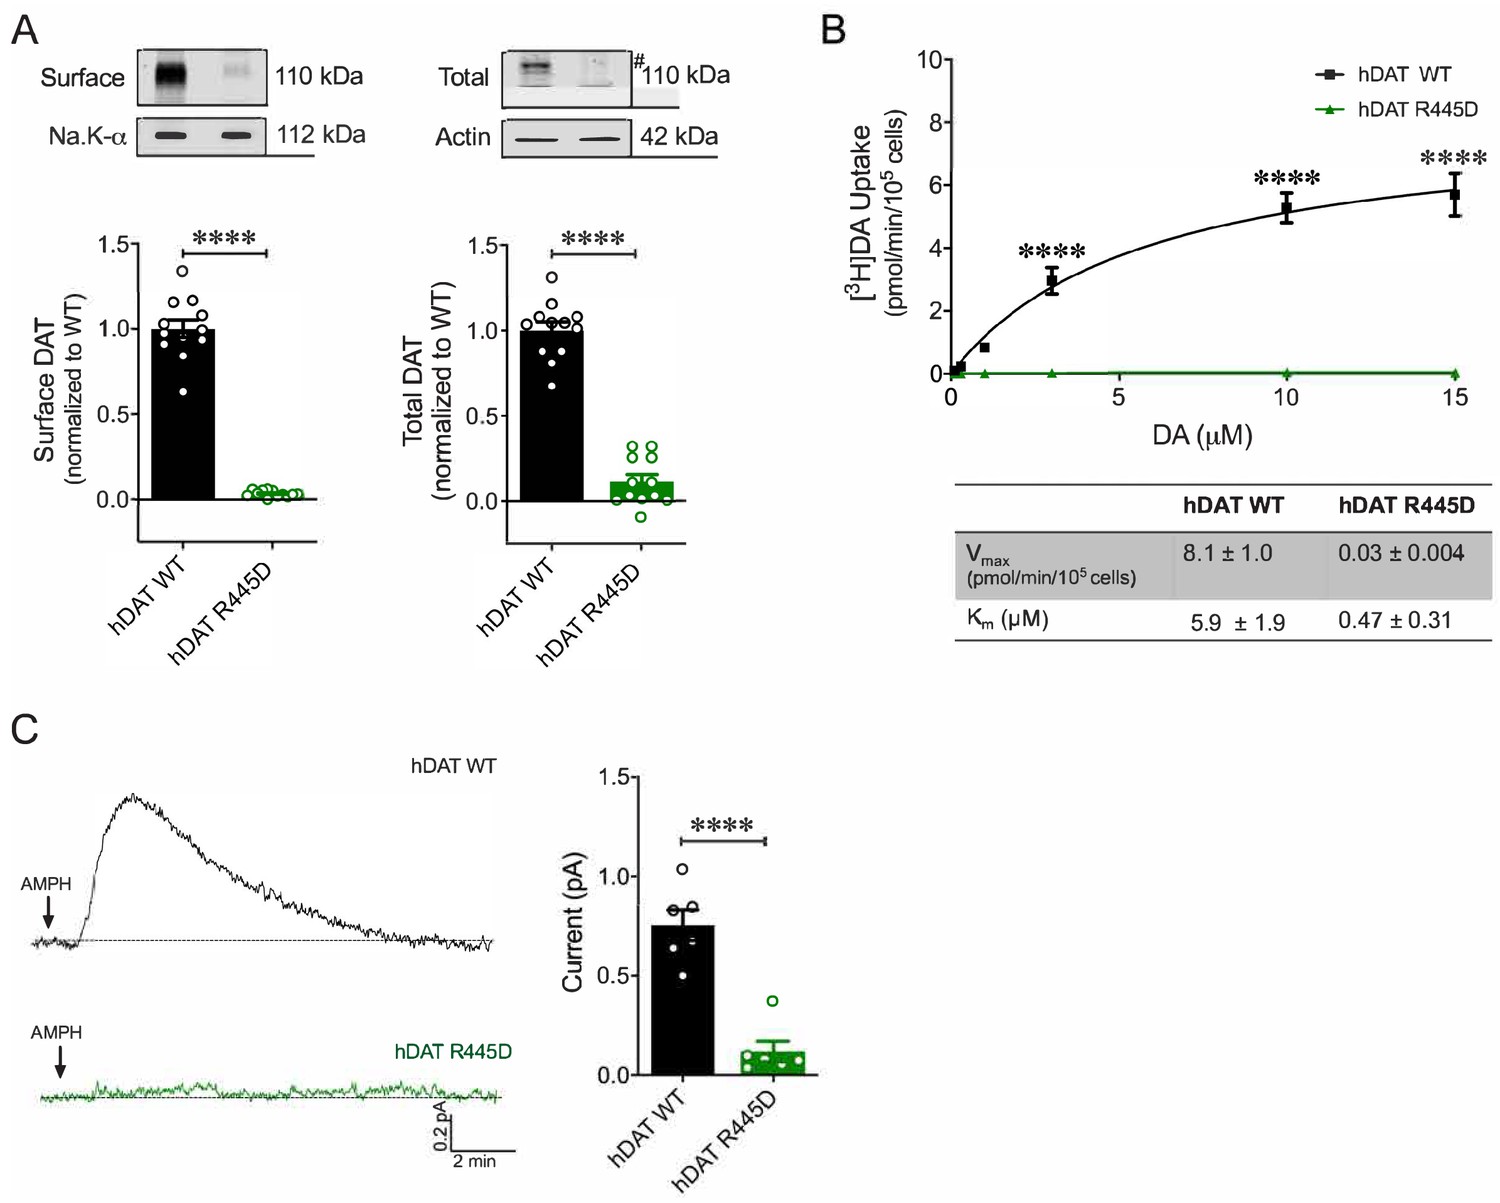
R445D substitution impairs hDAT expression and function in HEK 293 cells.
(A) Representative immunoblots of surface hDAT (top left), total hDAT (top right) and corresponding Na-K ATPase (bottom left) and actin (bottom right) loading controls (n = 4, in triplicate). hDAT R445D displayed significantly reduced surface (p<0.0001) and total (#) expression relative hDAT WT (p<0.0001). (B) [3H]DA uptake was measured in hDAT WT (black), hDAT R445D (green) cells (n = 3, in triplicate). Curves were fit to Michaelis-Menten kinetics to derive Km and Vmax. DA uptake for hDAT R445D was significantly reduced compared with hDAT WT (F(5,94) = 42.1, p<0.0001), as were the kinetic constants, Km and Vmax (p<0.0001). (C) Left: Representative amperometric traces (DA efflux) recorded in response to AMPH application (10 μM, indicated by arrow) from hDAT WT (black) and hDAT R445D (green) cells loaded DA (2 mM, 10 min) with a whole-cell patch electrode. Right: Peak current amplitudes illustrated a significant reduction in DA efflux recorded from hDAT R445D relative hDAT WT (p=0.002; n = 6). Data represent mean ± SEM. Welch’s t-test (A); two-way ANOVA with Bonferroni’s multiple comparison test: (B). Mann-Whitney Test (C).
Videos
Video 1
hDAT WT flies in flight.
Representative video of coordinated flight take-off of Drosophila hDAT WT. Video display is slowed down from the ‘start’ to ‘stop’ time of take-off to ease visualization.
Video 2
hDAT R445C flies in flight.
Representative video of coordinated flight take-off of Drosophila hDAT R445C. Video display is slowed down from the ‘start’ to ‘stop’ time of take-off to ease visualization.
Tables
Key resources table
| Reagent type (species) or resource | Designation | Source or reference | Identifiers | Additional information |
|---|---|---|---|---|
| Gene (Homo sapiens) | SLC6A3 | Uniprot | Uniprot Q01959 | Encodes hDAT protein |
| Gene (Aquifex aeolicus) | LeuT | Uniprot | Uniprot O67854 | Encodes LeuT protein |
| Strain, strain background (Escherichia coli) | C43 DE3 F– ompT gal dcm hsdSB(rB- mB-)(DE3) | Lucigen | ||
| Genetic reagent (D. melanogaster) | W1118 | Bloomington Stock Center | BI 6326 | |
| Genetic reagent (D. melanogaster) | TH-GAL4 | Bloomington Stock Center | BI 8848 | |
| Genetic reagent (D. melanogaster) | DATMB07315 | Bloomington Stock Center | BI 25547 | |
| Genetic reagent (D. melanogaster) | UAS-mCherry | Kyoto Stock Center | 109594 | |
| Genetic reagent (D. melanogaster) | M[vas-int.Dm]ZH-2A; M[3xP3-RFP.attP']ZH-22A | Rainbow Transgenic Flies | 24481 | |
| Genetic reagent (D. melanogaster) | DATfmn | Gift from Dr. K. Kume | ||
| Cell line (Homo sapiens) | HEK | |||
| Antibody | Anti-DAT(Rat monoclonal) | Millipore | MAB369 | WB (1:1000) |
| Antibody | Anti- β-actin (Mouse monoclonal) | Sigma-Aldrich | A5441 | WB (1:5000) |
| Antibody | Anti- Na-K ATPase | Developmental Studies Hybridoma Bank | a5 | WB (1:100) |
| Antibody | Anti- TH | Millipore | AB152 | IHC (1:200) |
| Antibody | Anti- Bruchpilot | Developmental Studies Hybridoma Bank | nc82 | IHC (1:50) |
| Recombinant DNA reagent | pEGFP (plasmid) | Clonetech | ||
| Recombinant DNA reagent | pET16b (plasmid) | Novagen | ||
| Peptide, recombinant protein | LeuT | This paper | Purified from C43 (DE3) E. coli | |
| Peptide, recombinant protein | LeuT R375A | This paper | Purified from C43 (DE3) E. coli | |
| Peptide, recombinant protein | LeuT R375C | This paper | Purified from C43 (DE3) E. coli | |
| Peptide, recombinant protein | LeuT R375D | This paper | Purified from C43 (DE3) E. coli | |
| Chemical compound, drug | [3H]dopamine | PerkinElmer Life Sciences | NET673250UC | |
| Chemical compound, drug | Sulfo-NHS-SS-biotin | Fisher | PG82078 | |
| Other | Fugene-6 | Roche Molecular Biochemicals |
Additional files
Download links
A two-part list of links to download the article, or parts of the article, in various formats.
Downloads (link to download the article as PDF)
Open citations (links to open the citations from this article in various online reference manager services)
Cite this article (links to download the citations from this article in formats compatible with various reference manager tools)
Psychomotor impairments and therapeutic implications revealed by a mutation associated with infantile Parkinsonism-Dystonia
eLife 10:e68039.
https://doi.org/10.7554/eLife.68039


