Dopamine differentially modulates the size of projection neuron ensembles in the intact and dopamine-depleted striatum
- Neuroscience Institute, New York University Grossman School of Medicine, United States
- Fresco Institute for Parkinson’s and Movement Disorders, New York University Langone Health, United States
Figures
Figure 1 with 2 supplements
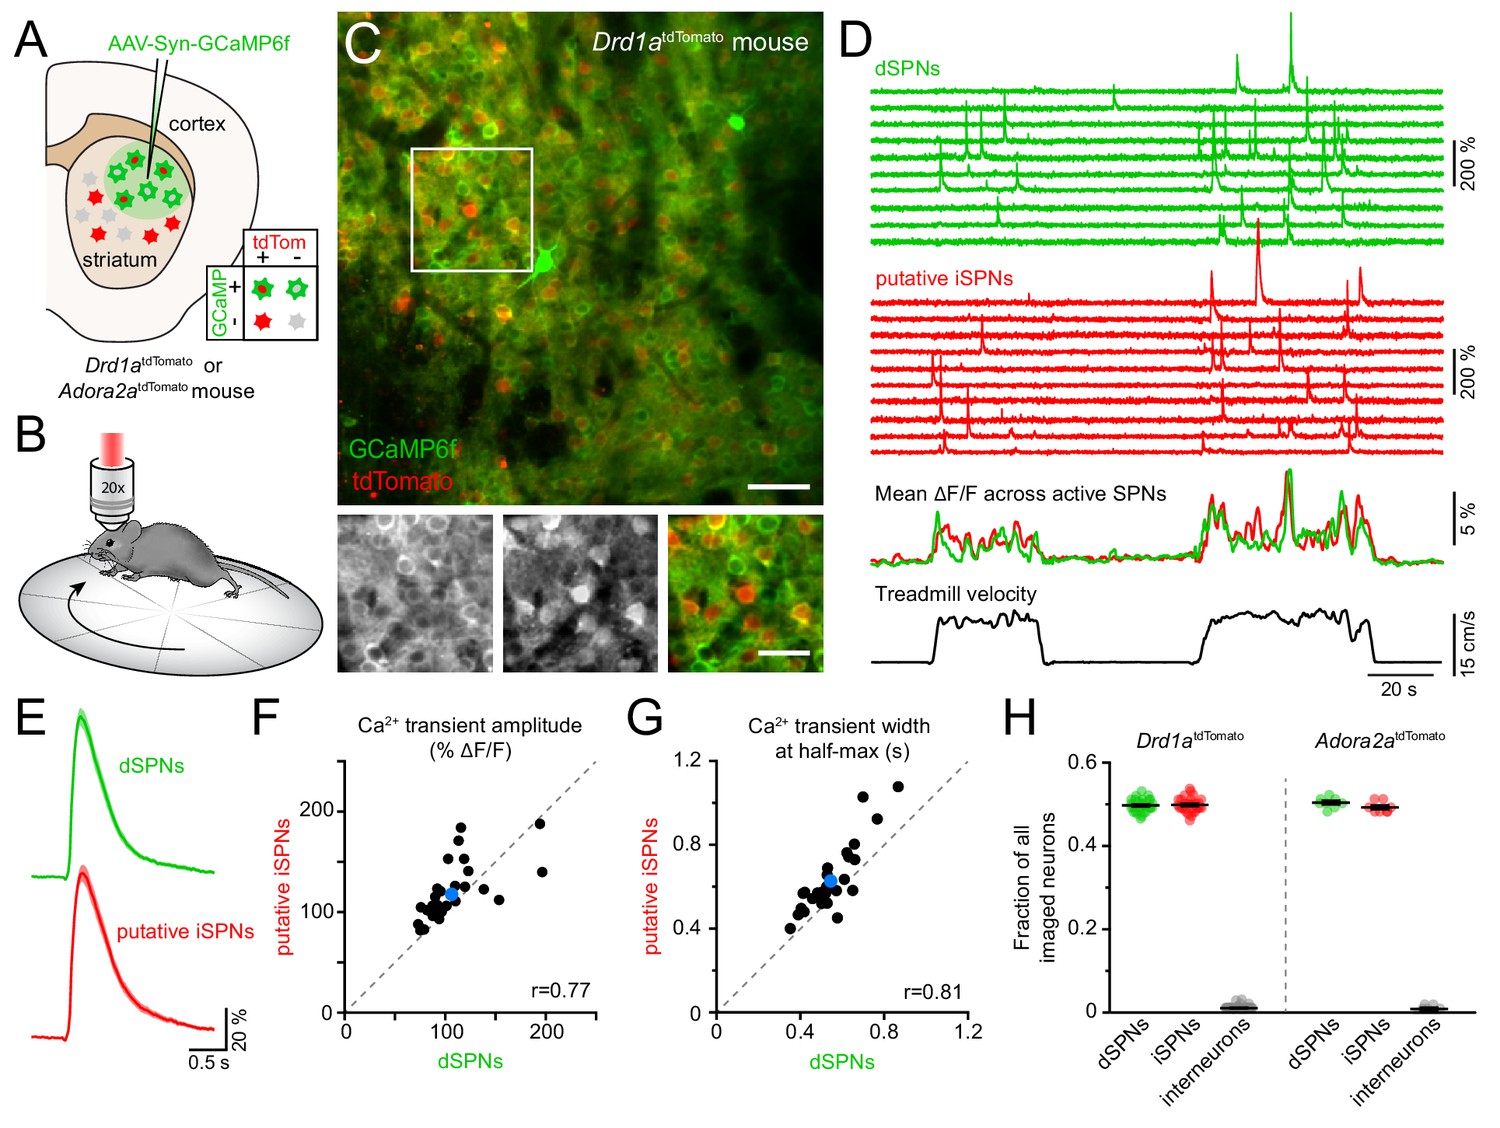
Simultaneous Ca2+ imaging from dSPNs and iSPNs.
(A,B) Experimental setup. GCaMP6f was virally expressed in dorsolateral striatum neurons (A) in mice expressing tdTomato in dSPNs (Drd1atdTomato) or iSPNs (Adora2atdTomato), and imaged by two-photon microscopy through an implanted imaging window while mice locomote on a circular treadmill (B). (C) Top: representative two-photon maximum projection image of dorsolateral striatum in a Drd1atdTomato mouse. Red: dSPNs, green: striatal neurons virally transduced to express GCaMP6f (scale bar: 50 μm). Inset shown at bottom in green (left) and red (middle) channels only, and composite (right; scale bar: 30 μm). (D) Top: example Ca2+ fluorescence traces from dSPNs (green) and putative iSPNs (red) in a Drd1atdTomato mouse. Middle: Mean ΔF/F across all active dSPNs and iSPNs. Bottom: treadmill velocity highlighting two self-initiated locomotor bouts. (E) Mean Ca2+ transient waveform (± s.e.m) imaged from active dSPNs and putative iSPNs in Drd1atdTomato mice. (F) Comparison of Ca2+ transient amplitude in dSPNs versus putative iSPNs in Drd1atdTomato mice (n = 30 FOVs from 18 mice). Mean ± s.e.m is depicted in blue, and unity as dashed gray line. r: Spearman correlation coefficient. (G) Same as (F for Ca2+ transient width at half-max in dSPNs versus iSPNs). (H) Fraction of all imaged neurons assigned to dSPNs, iSPNs and interneurons in Drd1atdTomato (n = 30 FOVs from 18 mice) and Adora2atdTomato (n = 8 FOVs in four mice) mice.
Figure 1—figure supplement 1
Imaging striatal activity using two-photon microscopy or photometry.
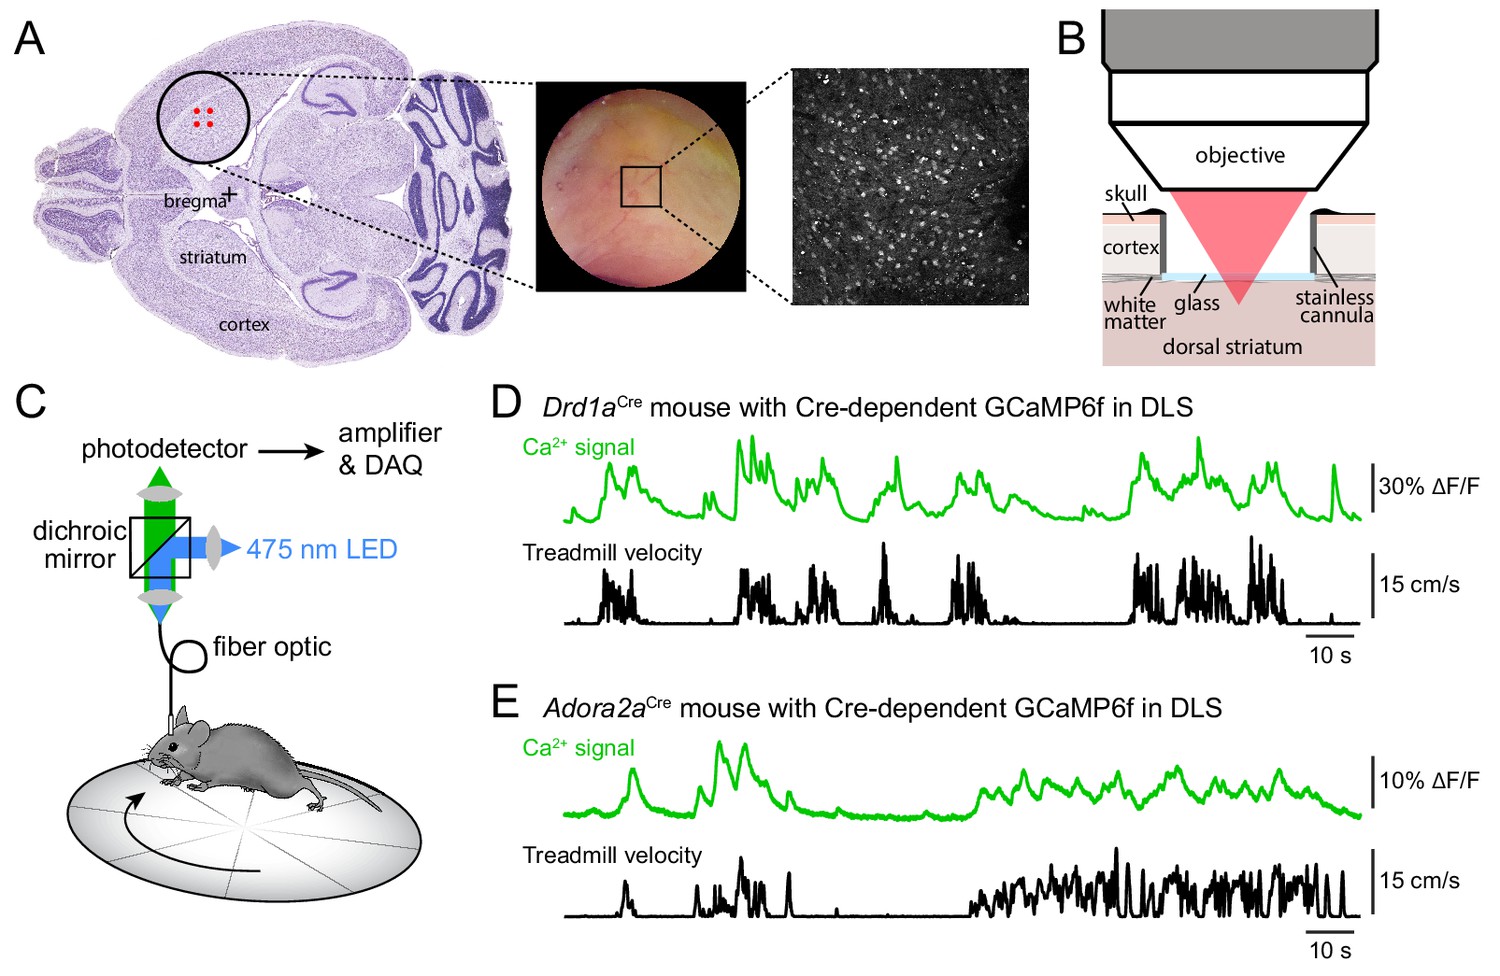
(A) Left: diagram of two-photon imaging window placement relative to bregma on horizontal brain section, with location of viral injections indicated in red. Middle: picture of representative imaging window two weeks post-implantation. Right: example two-photon image of tdTomato-positive dSPNs in a 500 × 500 m FOV. (B) Schematic of two-photon imaging preparation in sagittal plane. To gain optical access to dorsal striatum, the overlaying cortex is removed and replaced with a stainless steel canula fitted with a glass coverslip. (C) Fiber photometry experimental setup. (D) Fiber-photometry recording (top) and treadmill velocity (bottom) recorded from a Drd1aCre mouse virally expressing Cre-dependent GCaMP6f in dorsolateral striatum. Population Ca2+ fluorescence is elevated throughout bouts of forward locomotion. (E) Same as (B for an Adora2aCre mouse expressing GCaMP6f in iSPNs).
Figure 1—figure supplement 2
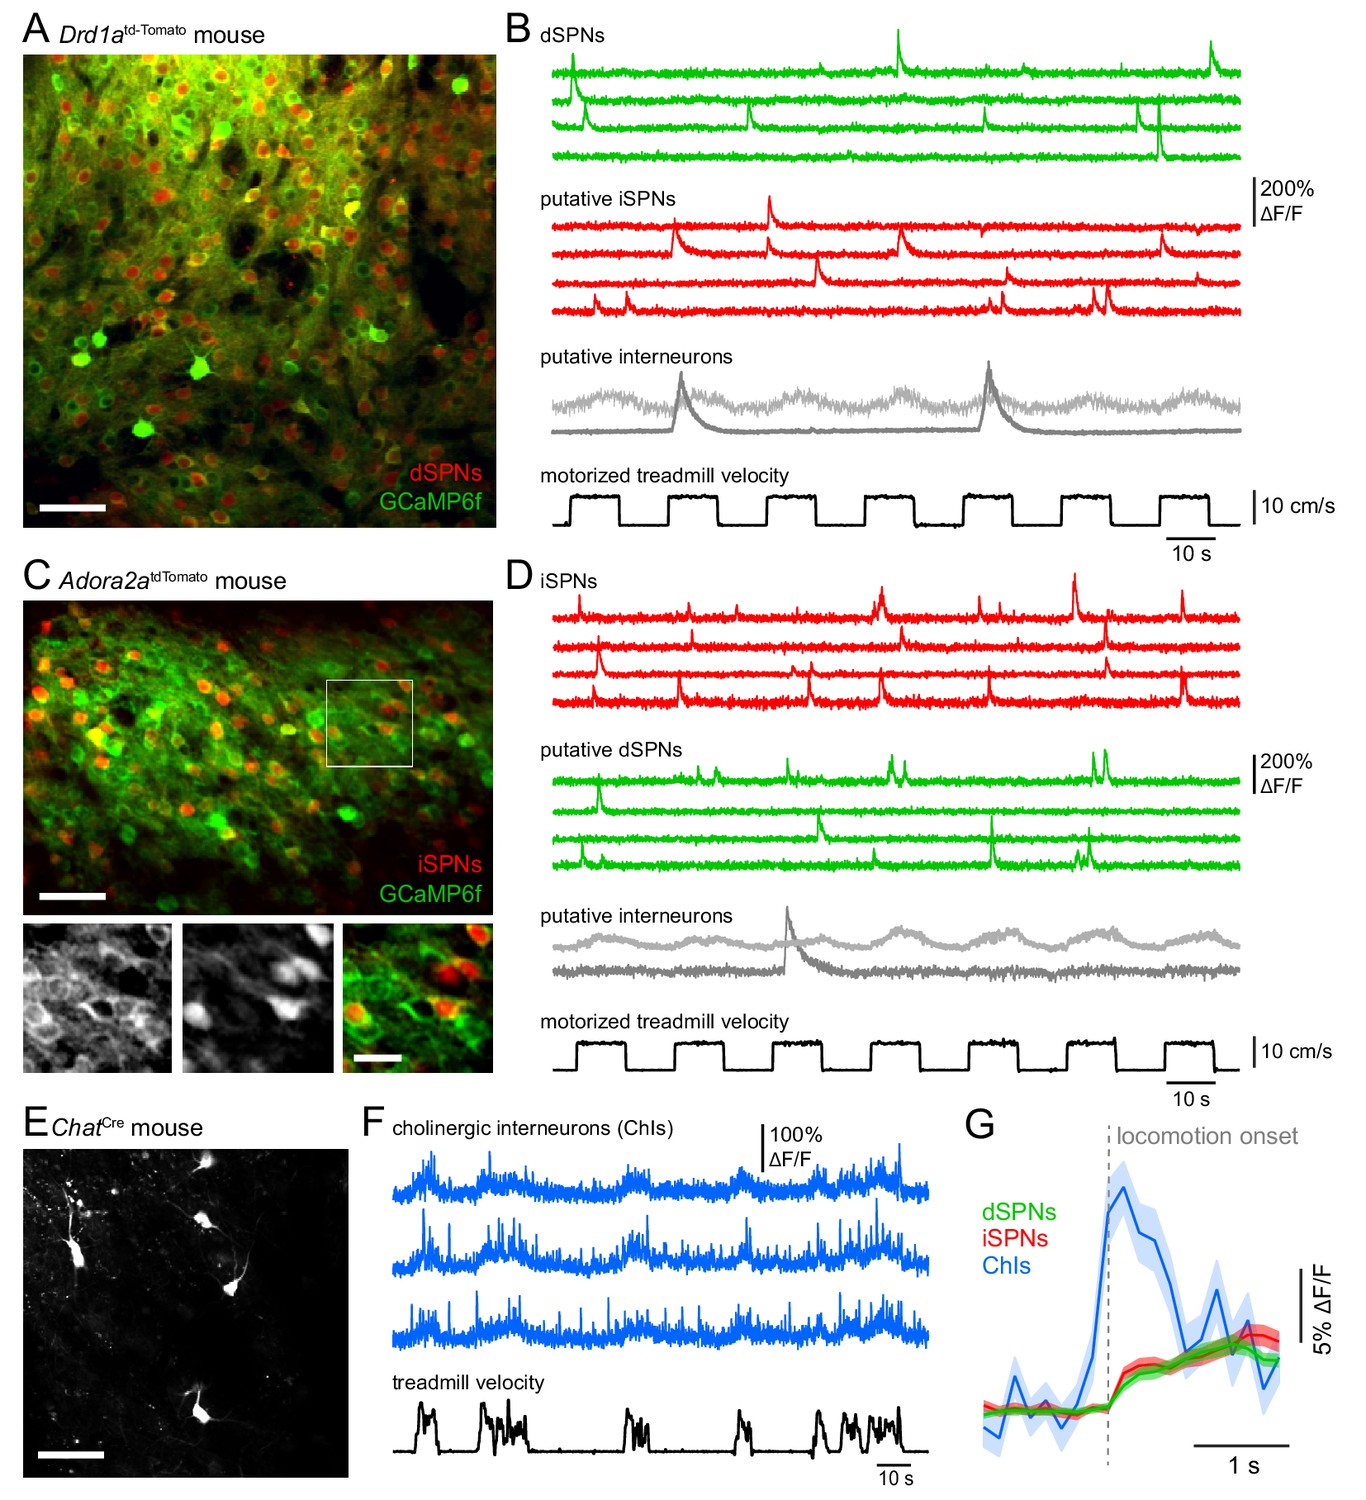
Distinguishing Ca2+ signals in dSPNs, iSPNs, and interneurons in vivo.
(A) In vivo two-photon maximum projection image of dorsolateral striatum in a Drd1atd-Tomato mouse expressing tdTomato in dSPNs and Cre-independent GCaMP6f (AAV1-Syn-GCaMP6f) in all neurons. Scale bar: 50 μm. (B) Example Ca2+ fluorescence traces from four active dSPNs (green), four putative dSPNs (red) and two putative interneurons in FOV shown in (A) Bottom: treadmill velocity during motorized trials (black). (C) Same as (A) for an Adora2aCre mouse virally expressing a red Cre-dependent reporter in iSPNs (AAV1-FLEX-tdTomato) and Cre-independent GCaMP6f (AAV1-Syn-GCaMP6f) in all neurons. Scale bar: 60 μm. Inset: Detail of boxed area in green (left), red (middle), and merged (right) channels. Scale bar: 20 μm. (D) Example Ca2+ fluorescence traces from four active iSPNs (red), four putative dSPNs (green) and two putative interneurons in FOV shown in (C) Bottom: treadmill velocity during motorized trials (black). (E) Two-photon maximum projection image of dorsolateral striatum in a ChatCre mouse virally expressing Cre-dependent GCAMP6f (AAV1-FLEX-Syn-GCaMP6f) in cholinergic interneurons. Scale bar: 80 μm. (F) Ca2+ fluorescence traces from three active cholinergic interneurons (blue) as mice self-initiate locomotor bouts on a free-spinning treadmill (black). (G) Mean (± s.e.m in shaded area) Ca2+ signal across active dSPNs (green), iSPNs (red) and cholinergic interneurons (blue) aligned to locomotion onset.
Figure 2

Activity in dSPNs and iSPNs is balanced during forward locomotion.
(A) Mean Ca2+ transient frequency per active dSPNs and iSPNs (n = 38 FOVs in 22 mice) while immobile (light gray) or spontaneously locomoting on treadmill (dark gray; p=5.5×10⁻¹⁰ in dSPNs, 4.1 × 10⁻¹⁰ in iSPNs, Wilcoxon signed-rank). (B) Mean frequency of Ca2+ transients per active dSPN (green) and iSPN (red) at different treadmill velocities. Shaded area: s.e.m. (C) Same as (B) aligned to locomotion onset and offset, overlaid with treadmill velocity (black). (D) Active SPN ensembles consist of all SPNs showing Ca2+ transients during forward locomotor bouts. Individual bouts recruit only a subset of SPNs from the overall active ensemble. (E) Size of active dSPN vs. iSPN ensembles, measured as the percentage of all imaged dSPNs or iSPNs exhibiting Ca2+ transients per FOV (n = 38 FOVs from 22 mice). Mean ± s.e.m is indicated in blue and unity line in dashed gray. r: Spearman correlation coefficient. (F) Active dSPN (green) and iSPN (red) ensemble size on motorized vs. free-spinning (spontaneously-initiated locomotion) treadmills (n = 12 FOVs; dSPNs: p=0.23, iSPNs: p=0.35, Wilcoxon signed-rank). (G) Cumulative distribution of active dSPNs (green) and iSPNs (red) recruited as a function of distance travelled over the course of imaging sessions. (H) Comparison of the size of dSPN (left) and iSPN (right) ensembles imaged on separate sessions 3 days (dark dots) or a month (light dots) apart. r: Spearman correlation coefficient.
Figure 3 with 2 supplements
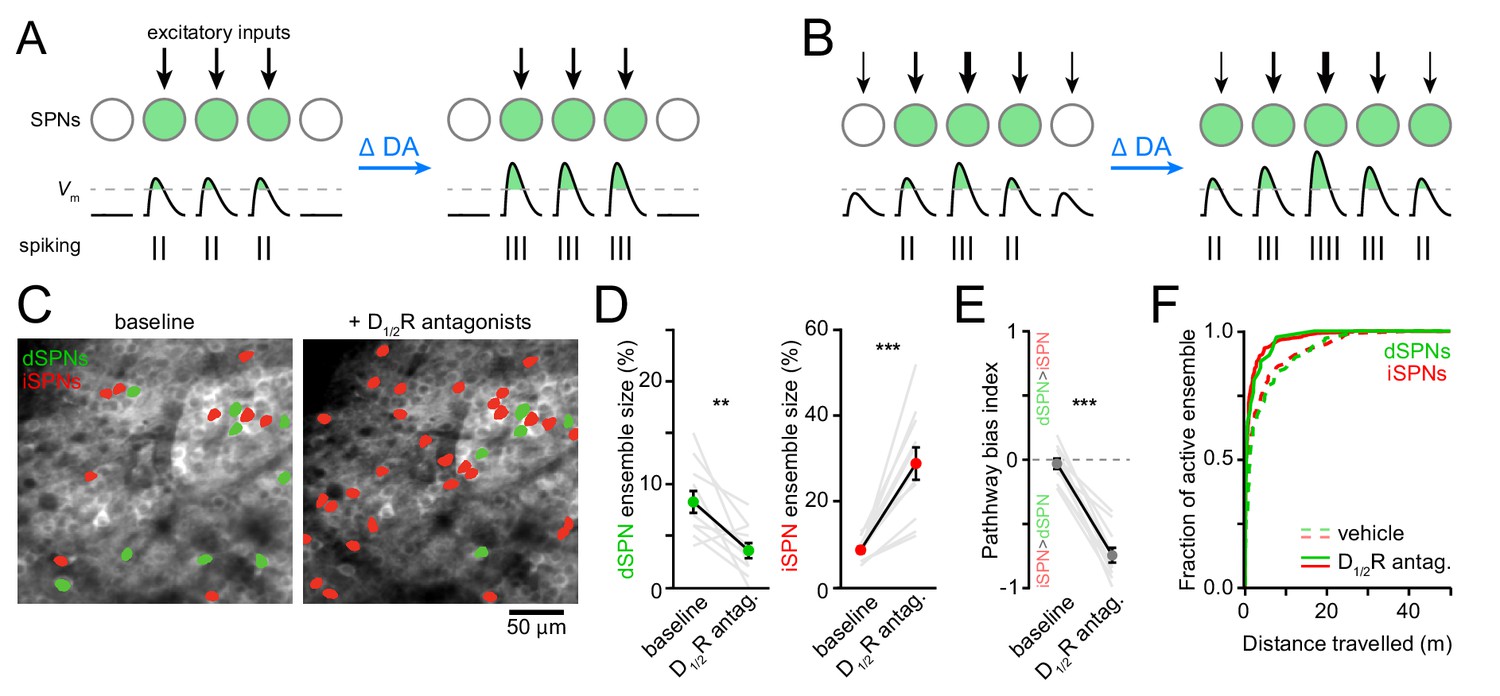
Reducing DA receptor signaling expands iSPN ensembles and shrinks dSPN ensembles.
(A,B) DA may affect SPN firing rates without (A) or with (B) accompanying changes in active ensemble size. Active SPNs are depicted as filled circles. Movement-related excitatory inputs of varying strength (arrows) evoke action potentials (vertical bars) when postsynaptic membrane depolarizations exceed spike threshold (dashed line). In this example, changes in extracellular DA increase the strength of excitatory afferents and/or the intrinsic excitability of SPNs. (C) Example maximum projection image of GCaMP6f signal in dorsolateral striatum immediately before (left) and 20 min after (right) systemic administration of a cocktail of D1/2R antagonists (SCH23390, 0.2 mg/kg + raclopride, 1 mg/kg). dSPNs and iSPNs displaying Ca2 + transients during forward locomotion during each imaging session are highlighted in green and red, respectively. (D) Percentage of all imaged dSPNs (left) and iSPNs (right) showing Ca2+ transients during locomotion before and after systemic administration of D1/2R antagonists (n = 11 FOVs in five mice; dSPNs: p=0.003; iSPNs: p=0.001 vs. baseline, Wilcoxon signed-rank). Mean ± s.e.m are overlaid. (E) Bias in the size of active dSPN and iSPN ensembles before and after D1/2R antagonist treatment (p=0.001 vs. baseline, Wilcoxon signed-rank). (F) Cumulative distribution of active dSPNs (left) and iSPNs (right) recruited as a function of distance travelled in vehicle- (dashed) and D1/2R antagonist-treated mice (solid), indicating that imaging sessions are sufficiently long to adequately estimate the size of active SPN ensembles.
Figure 3—figure supplement 1

Behavior and SPN Ca2+ transient properties with DA receptor antagonists.
(A) Mean (± s.e.m) self-initiated treadmill velocity before and after systemic administration of D1/2R antagonists (N = 5 mice, p=0.62 vs. baseline, Wilcoxon signed-rank). (B) Same as (A) for locomotor bout duration (p=0.06, Wilcoxon signed-rank). (C) Same as (A) for bout frequency (p=0.001, Wilcoxon signed-rank). (D) Mean (± s.e.m) Ca2+ transient frequency per dSPN active during forward locomotion before and after systemic administration of D1/2R antagonists (p=0.19, Wilcoxon signed-rank). (E) Same as (D) for iSPNs (p=0.003, Wilcoxon signed-rank). (F) Same as (D) for bias in frequency between pathways (p=0.49, Wilcoxon signed-rank). (G) Mean (± s.e.m) Ca2+ transient amplitude per dSPN active during forward locomotion before and after systemic administration of D1/2R antagonists (p=0.85, Wilcoxon signed-rank). (H) Same as (G) for iSPNs (p=0.21, Wilcoxon signed-rank). (I) Same as (G) for bias in amplitude between pathways (p=0.21, Wilcoxon signed-rank).
Figure 3—figure supplement 2

Vehicle treatment does not affect striatal activity.
(A) Percentage of all imaged dSPNs showing Ca2+ transients during forward locomotion before and after systemic administration of vehicle (n = 10 FOVs in five mice, p=0.58 vs. baseline, Wilcoxon signed-rank). Mean ± s.e.m are overlaid. (B) Same as (A) for iSPNs (p=0.97, Wilcoxon signed-rank). (C) Bias in the size of active dSPN and iSPN ensembles before and after vehicle treatment (p=0.56, Wilcoxon signed-rank). (D) Mean (± s.e.m) Ca2+ transient frequency per dSPN active during forward locomotion before and after systemic administration of vehicle (p=0.37, Wilcoxon signed-rank). (E) Same as (D) for iSPNs (p=0.19, Wilcoxon signed-rank). (F) Same as (D) for bias in frequency between pathways (p=0.56, Wilcoxon signed-rank). (G) Mean (± s.e.m) Ca2+ transient amplitude per dSPN active during forward locomotion before and after systemic administration of vehicle (p=0.06, Wilcoxon signed-rank). (H) Same as (G) for iSPNs (p=0.37, Wilcoxon signed-rank). (I) Same as (G) for bias in amplitude between pathways (p=0.10, Wilcoxon signed-rank).
Figure 4 with 2 supplements
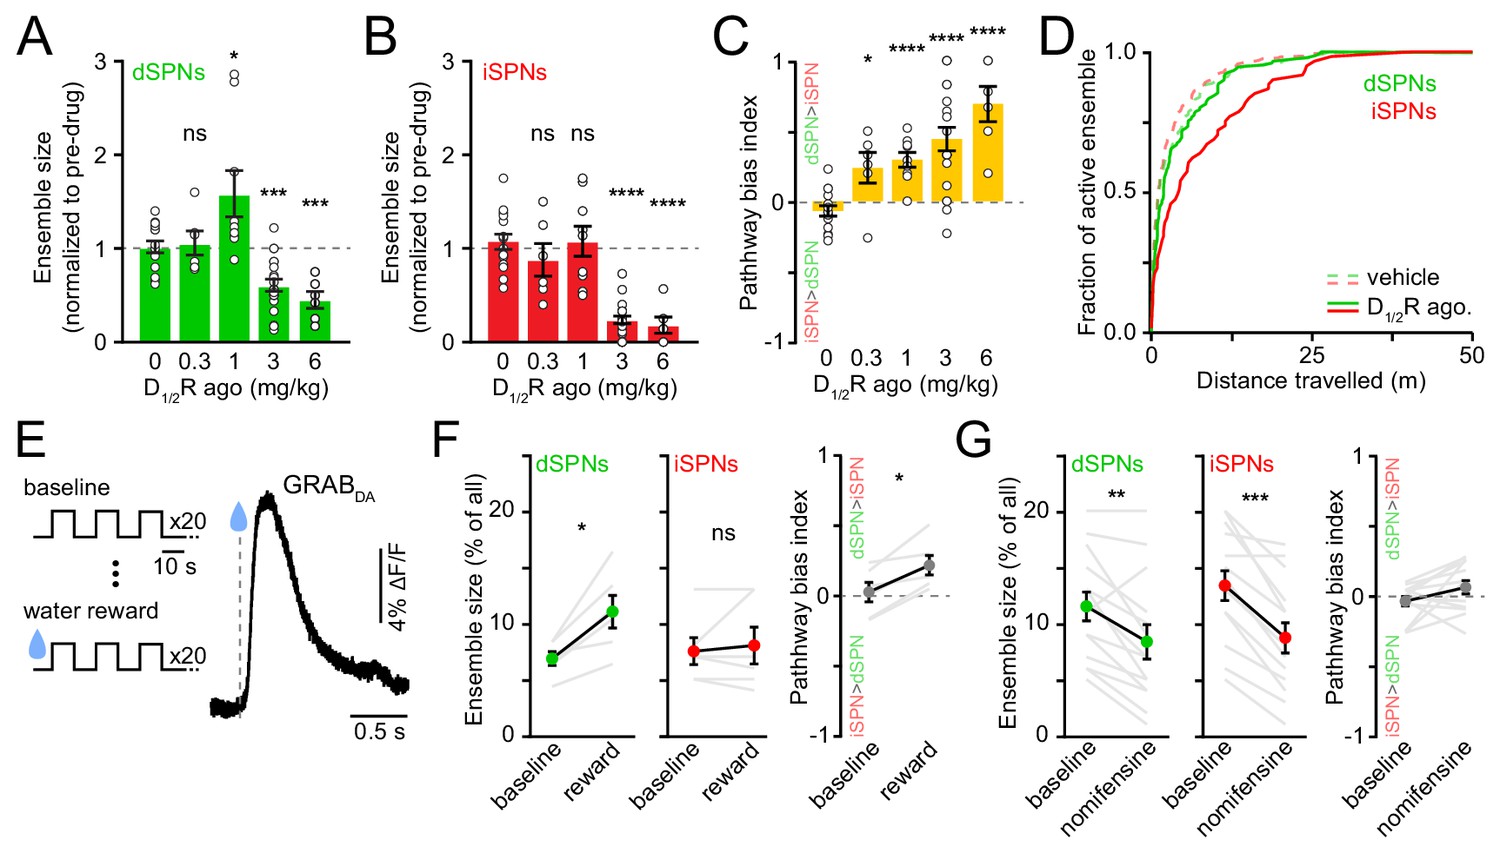
Elevating DA receptor signaling reconfigures movement-related SPN ensembles in a concentration-dependent manner.
(A) Fraction of imaged dSPNs active during locomotion in mice treated with different doses of D1/2R agonists (SKF81297 + quinpirole) normalized to pre-drug baseline (vehicle: n = 15 FOVs; 0.3 mg/kg: p=0.92, n = 6 FOVs; 1 mg/kg: p=0.04, n = 9 FOVs; 3 mg/kg: p=1.7×10⁻⁴, n = 20 FOVs; 6 mg/kg: p=2.9×10⁻⁴, n = 6 FOVs; all vs. vehicle, Mann-Whitney). (B) Same as (A) for iSPNs (0.3 mg/kg: p=0.27, n = 6 FOVs; 1 mg/kg: p=0.92, n = 9 FOVs; 3 mg/kg: p=3.1×10⁻⁹, n = 20 FOVs; 6 mg/kg: p=3.7×10⁻⁵, n = 6 FOVs; all vs. vehicle, Mann-Whitney). (C) Bias in ensemble size between dSPNs and iSPNs (0.3 mg/kg: p=0.02; 1 mg/kg: p=4.3×10⁻⁵; 3 mg/kg: p=7.8×10⁻⁶; 6 mg/kg: p=7.4×10⁻⁵; all vs. vehicle, Mann-Whitney). (D) Cumulative distribution of active dSPNs (green) and iSPNs (red) recruited with travelled distance after systemic administration of vehicle (dashed) and D1/2R agonists (solid). (E) Left, experimental paradigm: mice executed blocks of three 10 s-long locomotor bouts on a motorized treadmill. The first 20 blocks were unrewarded (baseline) but the following 20 were preceded by delivery of a water reward. Right, example GRABDA2h fluorescence (Sun et al., 2020) imaged from dorsolateral striatum using fiber photometry upon water reward delivery. Inset, mean ± s.e.m GRABDA transient amplitude (n = 5 mice). (F) Active dSPN (left) and iSPNs (middle) ensemble size imaged during baseline and rewarded blocks (n = 6 FOVs in four mice; dSPN p=0.03, iSPN p>0.9, all vs. baseline, Wilcoxon signed-rank). Right, pathway bias index (p=0.03 vs. baseline, Wilcoxon signed-rank). Mean ± s.e.m overlaid for each group. (G) Same as (F) upon treatment with the DA transporter inhibitor nomifensine (10 mg/kg; n = 14 FOVs in six mice; dSPN p=0.005, iSPN p=2.4×10⁻⁴, pathway bias index p=0.68, all vs. baseline, Wilcoxon signed-rank).
Figure 4—figure supplement 1

Behavior and SPN Ca2+ transient properties with DA receptor agonists.
(A) Mean self-initiated treadmill velocity before and after systemic administration of D1/2R agonists (N = 14 mice, p=0.38 vs. baseline, Wilcoxon signed-rank). (B) Same as (A) for locomotor bout duration (p=0.002, Wilcoxon signed-rank). (C) Same as (A) for bout frequency (p=0.40, Wilcoxon signed-rank). (D) Mean (± s.e.m) Ca2+ transient frequency per dSPN (left) and iSPN (middle) active during forward locomotion after systemic administration of vehicle (n = 15 FOVs in 10 mice) and D1/2R agonists at different concentrations (low: 0.3–1 mg/kg; high: 3–6 mg/kg) normalized to pre-drug baseline (dSPNs, low: p=0.58, high: p=0.27; iSPNs, low: p>0.99, high: p=0.006, all vs. vehicle, Mann-Whitney). Right: Bias in Ca2+ transient frequency between pathways (low: p=0.81; high: p=0.01, all vs. vehicle, Mann-Whitney). (E) Same as (D) for Ca2+ transient amplitude (dSPNs, low: p=0.83, high: p=0.18; iSPNs, low: p=0.89, high: p=0.58; bias, low: p=0.38, high: p=0.66; all vs. vehicle, Mann-Whitney).
Figure 4—figure supplement 2
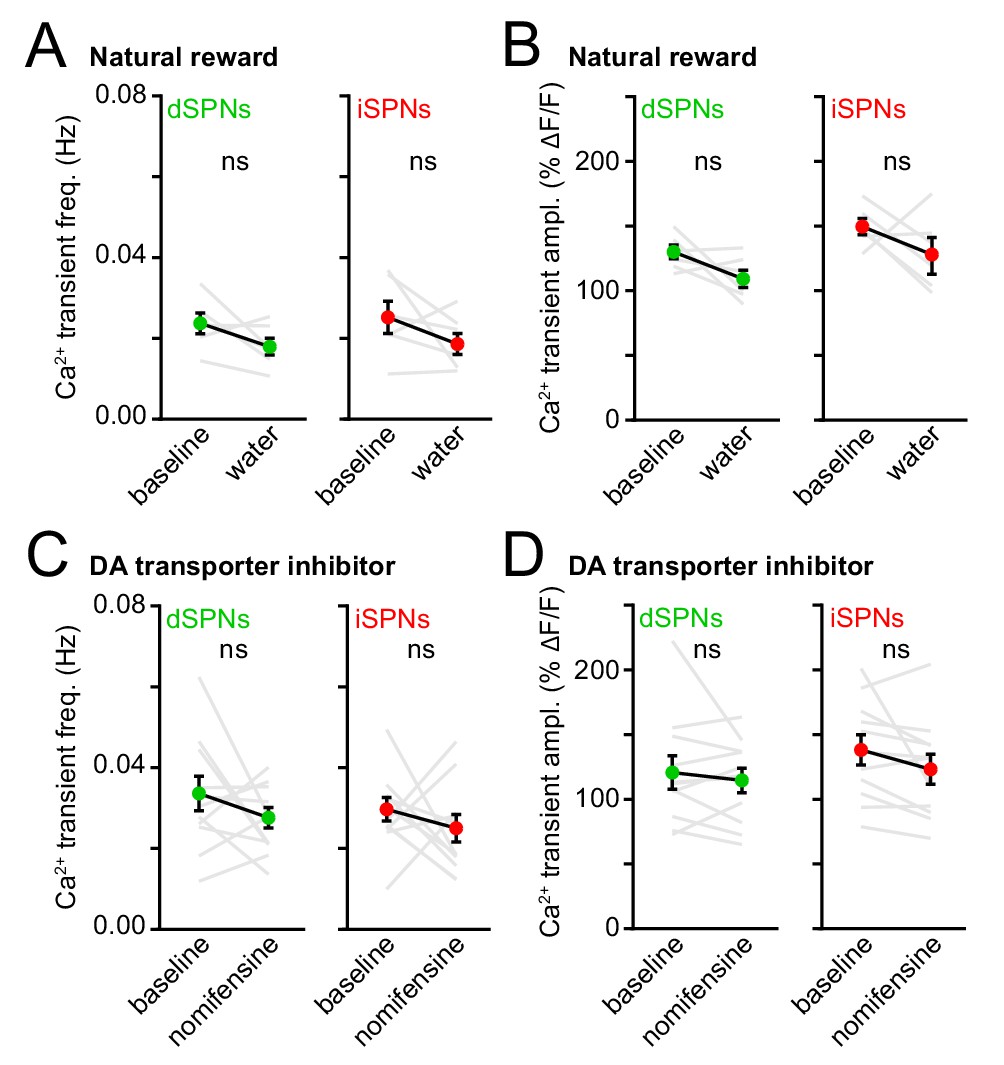
Elevating endogenous DA levels does not alter Ca2+ transient properties.
(A) Mean (± s.e.m) Ca2+ transient frequency per dSPNs (left, green) and iSPNs (right, red) active during locomotion in a baseline (non-rewarded) imaging session vs. a session in which water rewards were delivered every three locomotor bouts (dSPNs: p=0.16; iSPNs: p=0.22; all vs. baseline, Wilcoxon signed-rank). (B) Same as (A) for Ca2+ transient amplitude (dSPN: p=0.16; iSPN: p=0.22; all vs. baseline, Wilcoxon signed-rank). (C) Same as (A) before (baseline) and after pharmacological elevation of DA in striatum with the DA transporter inhibitor nomifensine (dSPNs: p=0.41; iSPNs: p=0.58; all vs. baseline, Wilcoxon signed-rank). (D) Same as (C) for Ca2+ transient amplitude (dSPNs: p=0.64; iSPNs: p=0.08; all vs. baseline, Wilcoxon signed-rank).
Figure 5 with 2 supplements
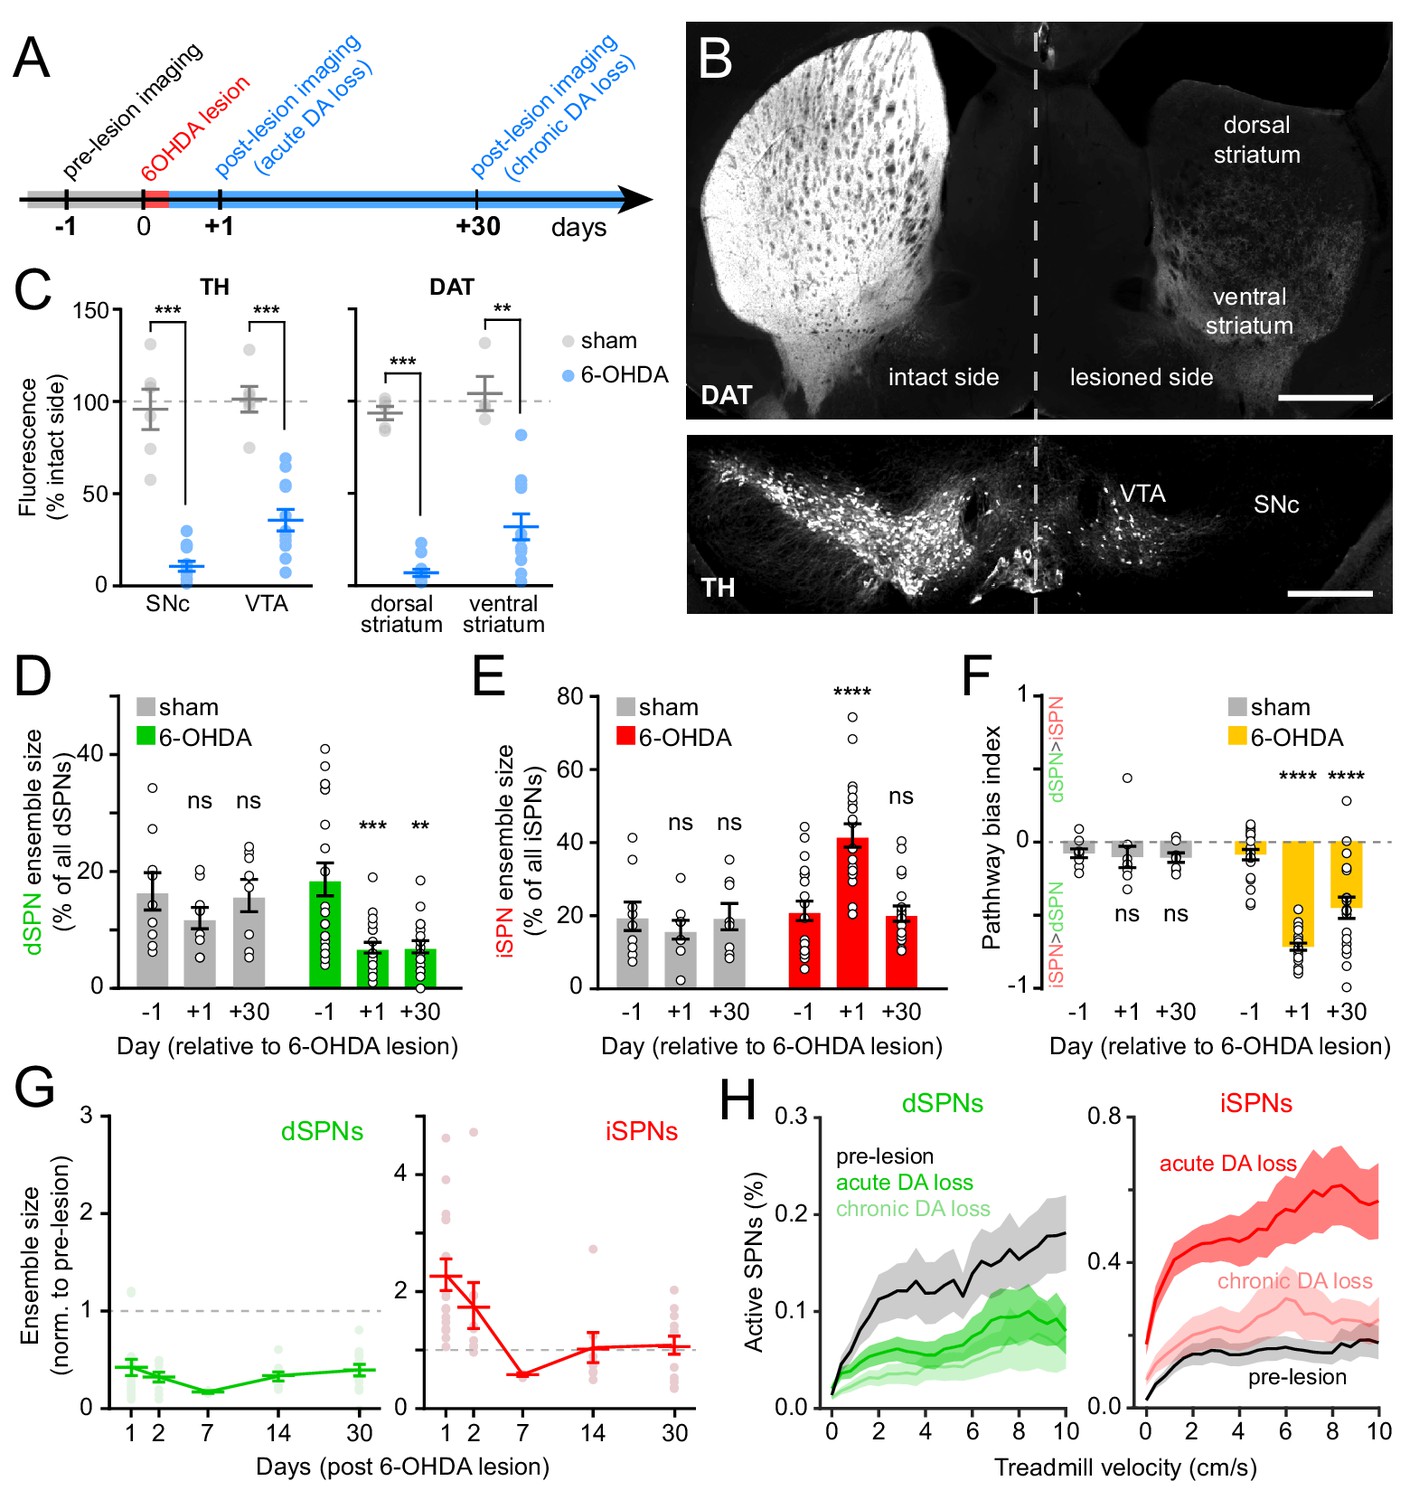
Chronic DA neuron lesions impair dSPN ensembles.
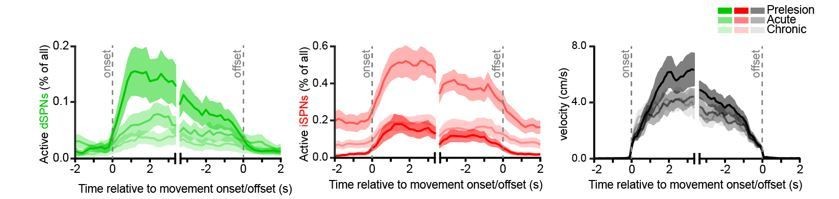
(A) Experimental timeline relative to unilateral lesion of DA neurons in SNc. (B) Example coronal forebrain (top) and ventral midbrain (bottom) sections from a mouse injected with 6-OHDA into the right SNc and stained for DAT (top) and TH (bottom). VTA, ventral tegmental area. Scale bars: 1 mm (top), 0.5 mm (bottom). (C) Immunofluorescence signal for TH in SNc and VTA (left) and DAT in dorsal and ventral striatum (right) on the treated side normalized to the intact side in sham- (gray; n = 6) and 6-OHDA-lesioned mice (blue; n = 12). Mean ± s.e.m is overlaid. Asterisks depict significant difference from sham (SNc p=1.1×10⁻⁴; VTA p=1.1×10⁻⁴; dorsal striatum p=3.2×10⁻⁴; ventral striatum p=0.001; Mann-Whitney). (D) Size of dSPN ensembles before (day −1), the day following (day +1) or a month after (day +30) sham (n = 9 FOVs in six mice; day 1: p=0.42; day 30: p>0.9) or 6-OHDA-mediated SNc lesions (n = 21 FOVs from 12 mice; day 1: p=1.8×10⁻⁴; day 30: p=0.001, all vs. pre-lesion, post-hoc pairwise t-tests with Bonferroni correction). (E) Same as (D) for iSPNs (sham day 1: p=0.78; day 30: p>0.9; 6-OHDA day 1: p=8.0 × 10⁻⁷, day 30: p>0.9, all vs. pre-lesion, post-hoc pairwise t-tests with Bonferroni correction). (F) Bias in ensemble size between dSPNs and iSPNs (sham day 1: p>0.9; day: 30 p>0.9; 6-OHDA day 1: p=3.1×10⁻¹⁴, day 30: p=4.2×10⁻⁵, all vs. pre-lesion, post-hoc pairwise t-tests with Bonferroni correction). (G) Movement-related dSPN (left, green) and iSPN (right, red) ensemble size imaged on different days after SNc lesions with 6-OHDA normalized to pre-lesion ensemble size (n = 16, 9, 2, 8, and 14 FOVs on days 1, 2, 7, 14, and 30, respectively). Note that iSPNs return to baseline values within the first 2 weeks post-lesion. (H) Percentage of imaged dSPNs (left) and iSPNs (right) displaying Ca2+ transients in 200 ms-time bins vs. treadmill velocity during self-initiated forward locomotion before 6-OHDA lesion (black) or on day 1 (acute DA loss) and day 30 (chronic DA loss) after 6-OHDA lesion.
Figure 5—figure supplement 1
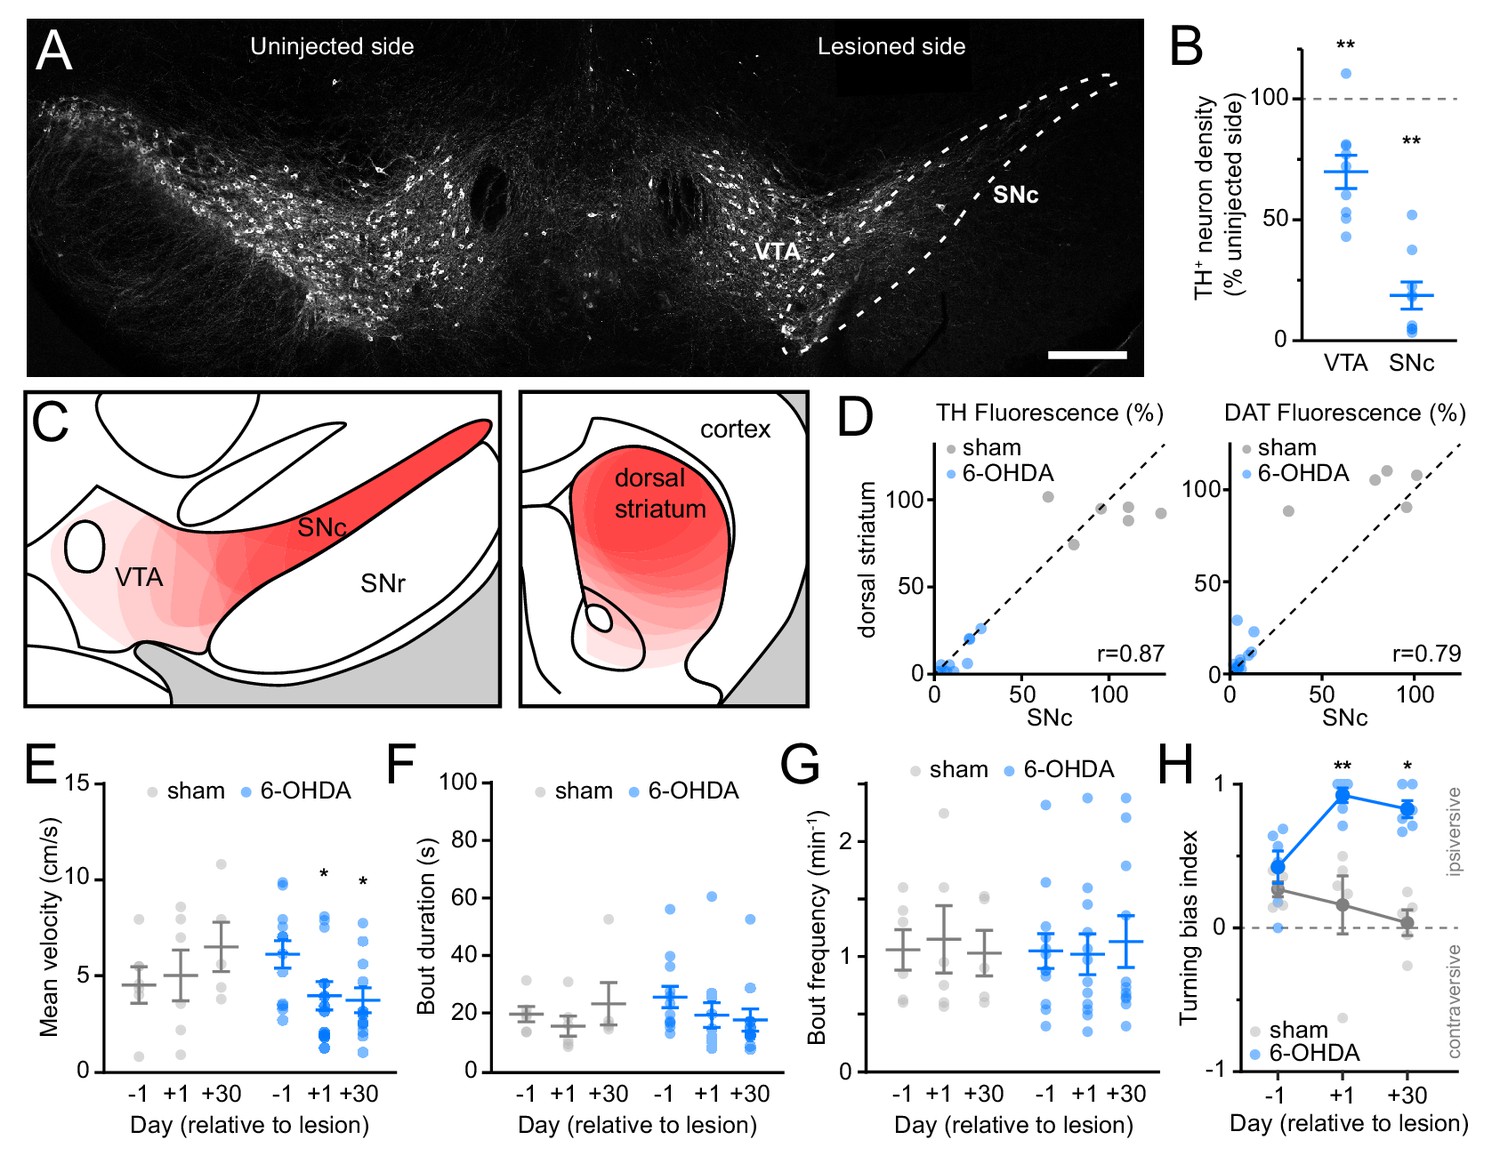
Histological and behavioral characterization of 6-OHDA-treated mice.
(A) Confocal image of a coronal midbrain section immunostained for tyrosine hydroxylase (TH) 24 hr after unilateral injection of 6-OHDA in SNc (dashed outline). Scale bar: 300 μm. (B) Number of TH-positive neurons identified in SNc and VTA on injection side relative to contralateral side 24 hr after intracranial injection of 6-OHDA in SNc (n = 9 sections from three mice; VTA: p=0.008; SNc: p=0.004; Wilcoxon signed rank). (C) Schematic coronal sections of ventral midbrain (left; −3.1 mm from bregma) and forebrain (right;+1 mm from bregma) illustrating 6-OHDA-mediated loss of DA neuron cell bodies in SNc/VTA and DA axons in striatum, respectively. The extent of the lesion is indicated in light red for each mouse and the results of 12 mice used for two-photon imaging are overlaid. SNr: substantia nigra pars reticulata. (D) Comparison of TH (left) and DAT (right) fluorescence (reported as % from control, uninjected hemisphere) in dorsal striatum vs. SNc in sham (gray; N = 6) and 6-OHDA lesioned (blue; N = 12) mice used for two-photon imaging. Dashed black line: unity. r: Spearman correlation coefficient. (E) Mean self-initiated treadmill velocity before (day −1), 1 day after and 30 days after unilateral injection of vehicle (N = 6, gray) or 6-OHDA (N = 12, blue) in SNc (Two-way ANOVA lesion x time: F2,30 = 5.56, p=0.009; sham, day 1: p>0.99, day 30: p=0.14; 6-OHDA, day 1: p=0.035, day 30: p=0.033; all vs. day −1, post-hoc within-group t-tests with Bonferroni correction). (F) Same as (E) for locomotor bout duration (Two-way ANOVA lesion x time: F2,30 = 0.99, p=0.38). (G) Same as (E) for bout frequency (Two-way ANOVA lesion x time: F2,30 = 0.15, p=0.86). (H) Turning bias measured in a closed-arm plus maze in a subset of vehicle (N = 5, gray) and 6-OHDA injected mice (N = 6, blue) 1 day before, 1 day after, and 30 days after intracranial surgery. Values approaching 1 and −1 reflect strong turning bias toward (ipsiversive) or away from (contraversive) the lesioned hemisphere, respectively (Two-way ANOVA lesion x time: F2,27 = 6.0, p=0.007; sham, day 1: p=0.98, day 30: p=0.28; 6-OHDA, day 1: p=0.003, day 30: p=0.015; all vs. day −1, post-hoc within-group t-tests with Bonferroni correction).
Figure 5—figure supplement 2
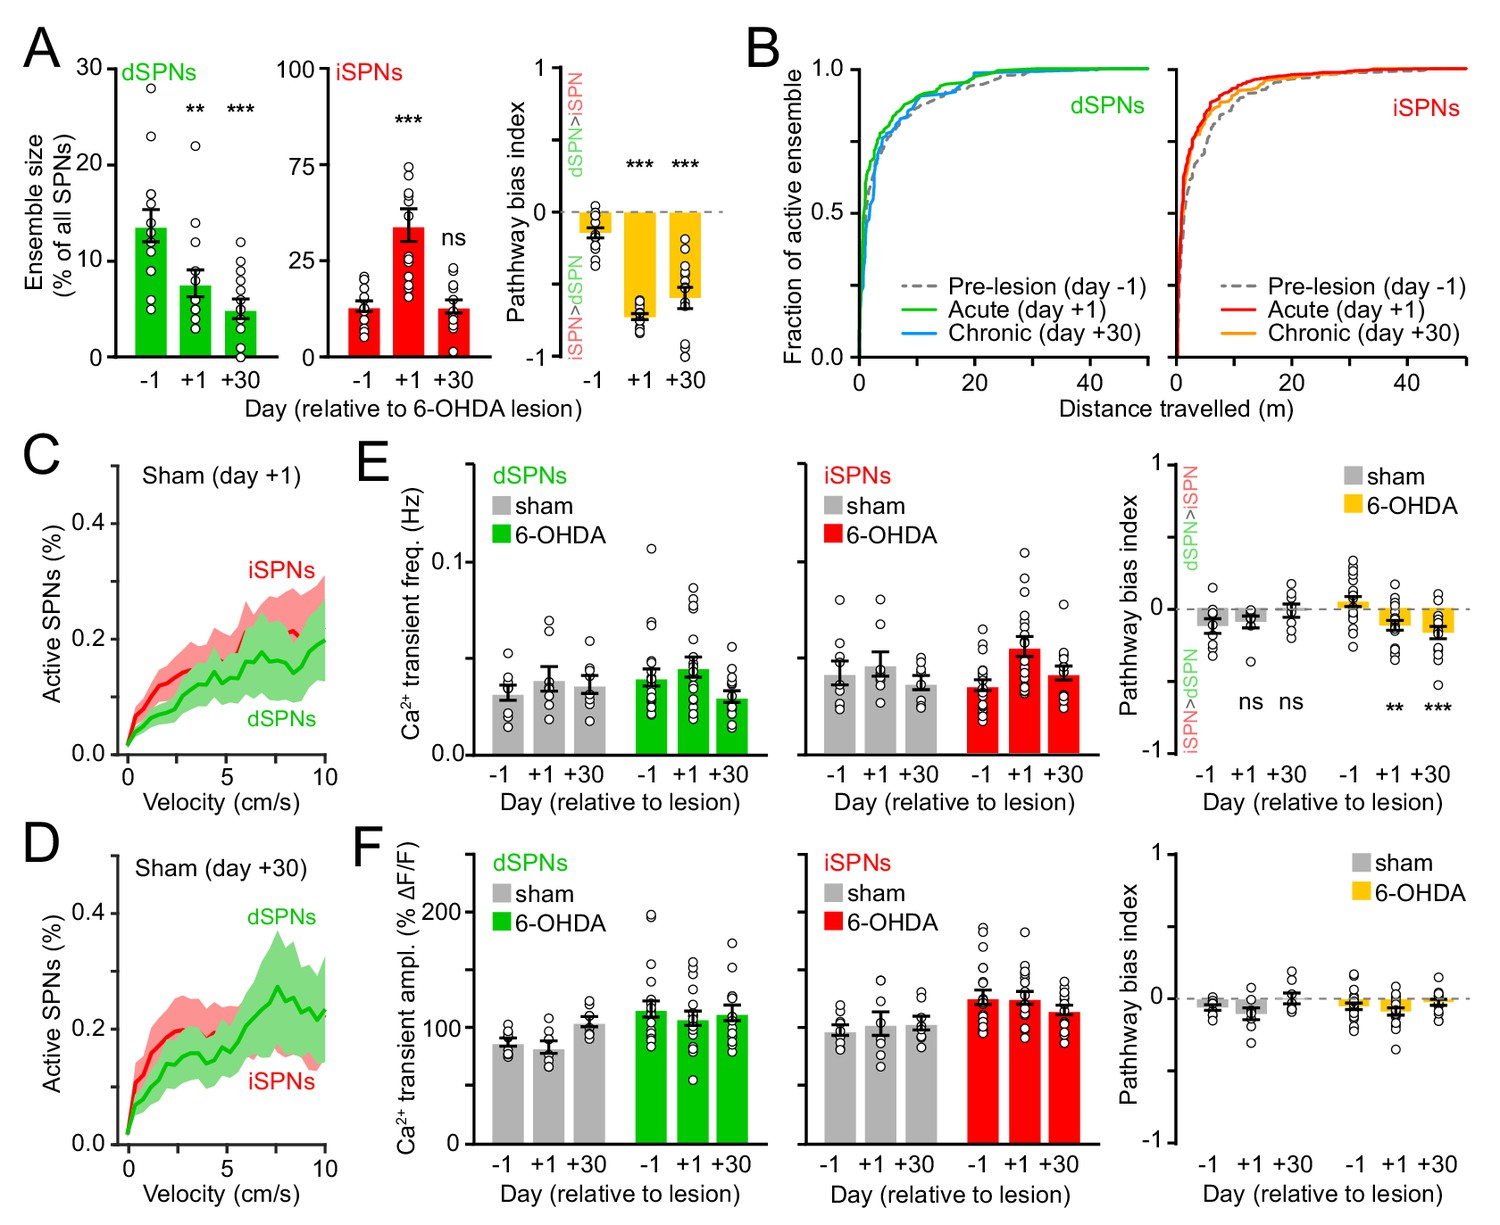
Characterization of striatal activity in sham and 6-OHDA-treated mice.
(A) Size of dSPN (left) and iSPN (middle) ensembles recruited during fixed-velocity locomotion on a motorized treadmill and their relative bias (right) immediately before (day −1), 1 day after or 30 days after unilateral 6-OHDA injection in SNc (dSPNs, day 1: p=0.003, day 30: p=3.7×10⁻⁴; iSPNs, day 1: p=1.2×10⁻⁴, day 30: p=0.88; pathway bias, day 1: p=1.2×10⁻⁴, day 30: p=1.2×10⁻⁴; all vs. day −1, Wilcoxon signed-rank). (B) Cumulative distribution of active dSPNs (left) and iSPNs (right) recruited as a function of distance travelled 1 day before (pre-lesion), 1 day after (acute) or 30 days after (chronic) unilateral 6-OHDA injection in SNc. (C) Percentage of imaged dSPNs (green) and iSPNs (red) displaying Ca2+ transients per 200 ms-time bins vs. mean treadmill velocity during self-initiated forward locomotion on day one after vehicle injection in SNc (sham). Shaded area is s.e.m. (D) Same as (C) for day 30. (E) Mean Ca2+ transient frequency per dSPN (left) and iSPNs (middle) active during self-initiated forward locomotion 1 day before, 1 day after, or 30 days after sham (n = 9 FOVs in six mice) or 6-OHDA treatment (n = 21 FOVs from 12 mice; Two-way ANOVA lesion x time: dSPN, F2,45 = 1.05, p=0.36; iSPN, F2,45 = 1.64, p=0.21). Right: Ca2+ transient frequency bias between pathways (two-way ANOVA lesion x time: F2,45 = 7.98, p=0.001; sham, day 1: p>0.9, day 30: p=0.23; 6-OHDA, day 1: p=0.008, day 30: 5.0 × 10⁻⁴; all vs. day −1; post-hoc within-group t-tests with Bonferroni correction). (F) Same as (E) for Ca2+ transient amplitude (two-way ANOVA lesion x time: dSPN, F2,45 = 1.31, p=0.3; iSPN, F2,45 = 1.50, p=0.2).
Figure 6 with 1 supplement
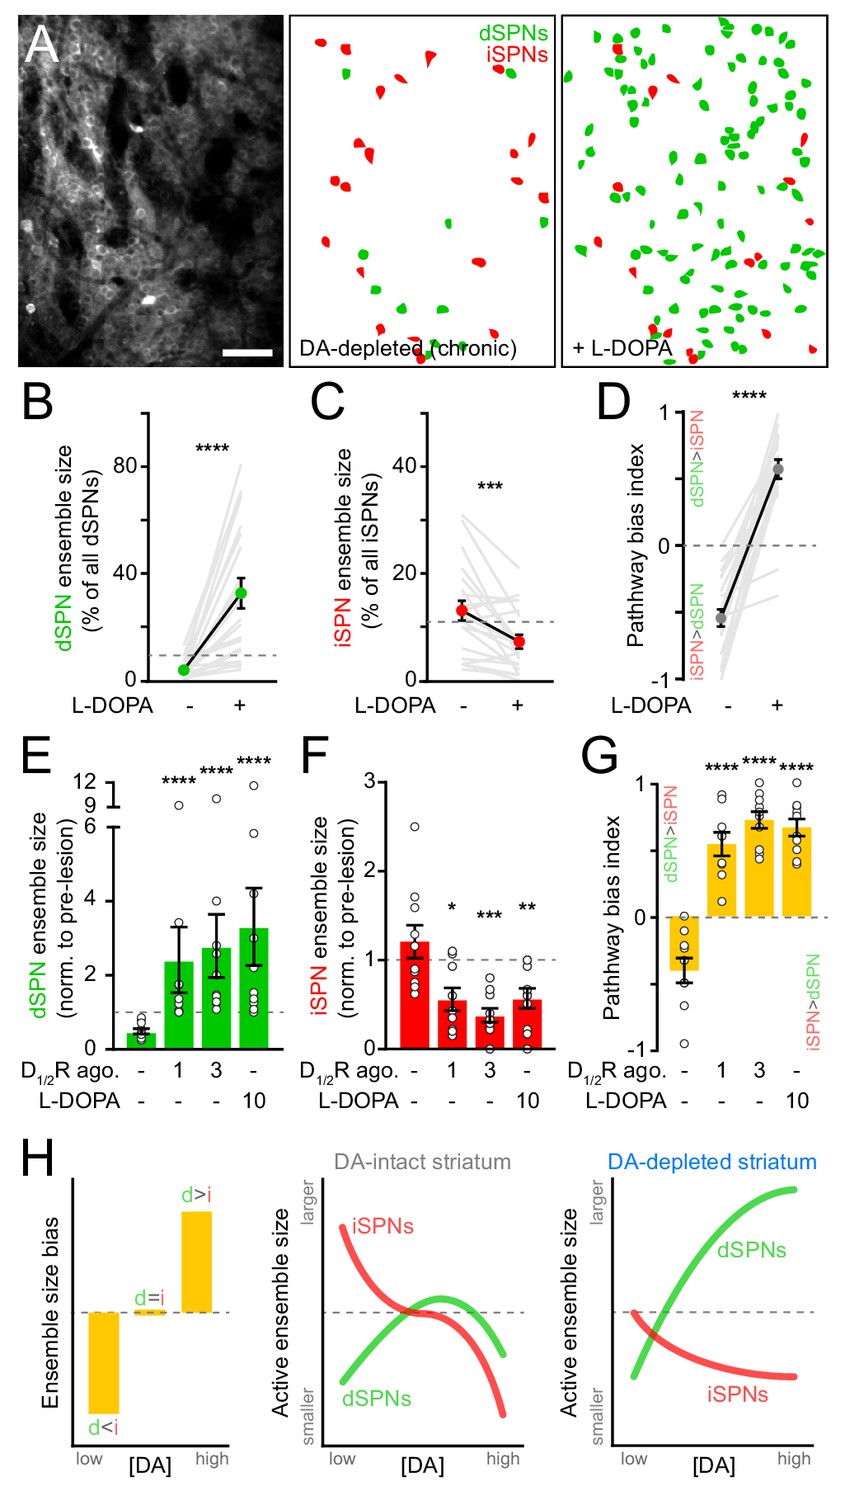
SPN ensembles respond differently to DA after chronic DA depletion.
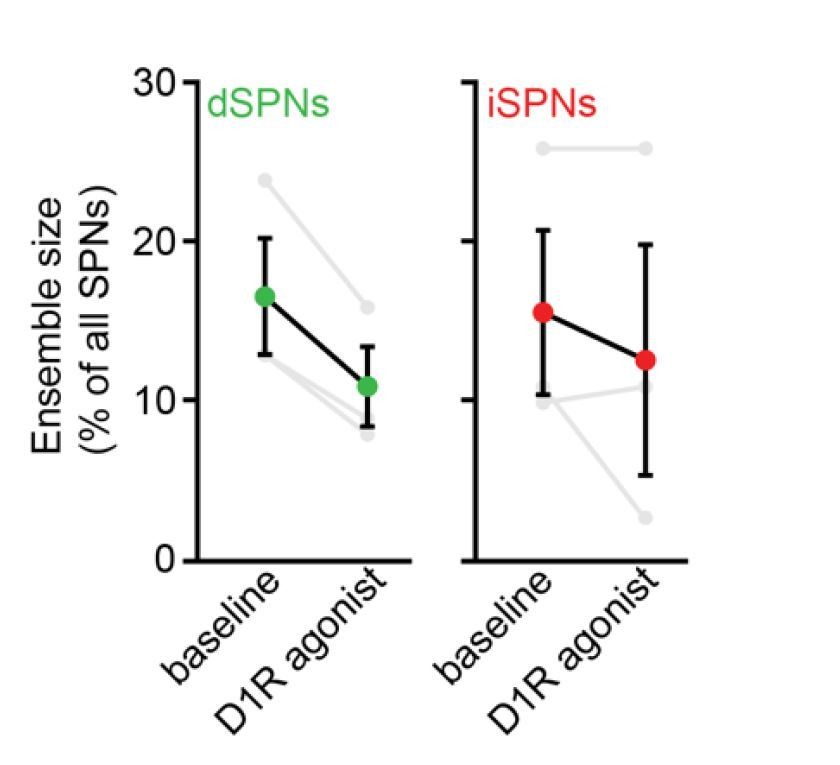
(A) Maximum projection image of a chronically DA-depleted dorsolateral striatum (left) and spatial distribution of active dSPNs (green) and iSPNs (red) ensembles imaged immediately before (middle) and following (right) systemic administration of L-DOPA. Scale bar: 50 μm. (B) Size of movement-related dSPN ensembles in chronically lesioned mice before and after elevating striatal DA with L-DOPA (n = 21 FOVs in 12 mice; p=1.9×10⁻⁶, Wilcoxon signed rank). Dashed line indicates the mean size of dSPN ensembles prior to 6-OHDA lesion. (C) Same as (B) for iSPNs (n = 21 FOVs in 12 mice; p=7.0×10⁻⁴, Wilcoxon signed rank). (D) Bias in the size of active dSPN and iSPN ensembles before and after L-DOPA treatment (n = 21 FOVs in 12 mice; p=9.5×10⁻⁷, Wilcoxon signed rank). (E) Size of movement-related dSPN ensembles in chronically-lesioned mice (n = 10 FOVs in seven mice) imaged before (baseline) and after systemic administration of different doses of D1/2R agonists on separate sessions (1 mg/kg: p=2.2×10⁻⁵; 3 mg/kg: p=1.1×10⁻⁵, all vs. baseline, Mann-Whitney) and L-DOPA (p=1.1×10⁻⁵ vs. baseline, Mann-Whitney) normalized to the size of active dSPN ensembles prior to 6-OHDA lesion. Dashed line indicates unity. (F) Same as (E) for iSPNs (n = 10 FOVs in seven mice; 1 mg/kg: p=0.01; 3 mg/kg: p=1.3×10⁻⁴; L-DOPA: p=8.4×10⁻³; all vs. baseline, Mann-Whitney). (G) Bias in the size of active dSPN and iSPN ensembles before and after treatment with D1/2R agonists or L-DOPA (n = 10 FOVs in seven mice; 1 mg/kg: p=2.2×10⁻⁵; 3 mg/kg: p=1.1×10⁻⁵; L-DOPA, p=1.1×10⁻⁵; all vs. baseline, Mann-Whitney). (H) Diagrams summarizing observed changes in the overall balance between dSPN and iSPN ensembles (left) and the specific changes in the size of movement-related dSPN (green) and iSPN (red) ensembles at varying DA levels in the striatum of intact (middle) and DA-depleted mice (right).
Figure 6—figure supplement 1

Chronic DA depletion affects how striatal neurons respond to DA receptor signaling.
(A) Left, diagrams of a closed-arm plus maze and mouse brain in which DA is unilaterally depleted. Right, Turning bias measured before and after L-DOPA treatment in DA-intact (N = 5, gray) and chronically DA-depleted mice (N = 12, blue; two-way ANOVA lesion x levodopa: F1,30 = 141.3, p=7.1×10⁻¹³; DA-intact: p=0.1; DA-depleted: p<1×10⁻¹⁵; all vs. baseline, post-hoc within-group t-tests with Bonferroni correction). (B) Mean Ca2+ transient frequency per dSPN (left) and iSPN (middle) active in chronically lesioned mice before and after elevating striatal DA with L-DOPA (dSPN: p=0.10; iSPN: p=4.9×10⁻⁴; all vs. baseline, Wilcoxon signed rank). Right: frequency bias index (p=0.02 vs. baseline, Wilcoxon signed rank). Mean ± s.e.m are overlaid for each group. (C) Mean Ca2+ transient frequency per dSPN (left) and iSPN (middle) active in chronically lesioned mice after systemic administration of D1/2R agonists (dSPNs, 1 mg/kg: p=0.43, 3 mg/kg: p=0.44; iSPNs, 3 mg/kg: p=0.22; all vs. vehicle; Mann-Whitney) and L-DOPA (dSPNs: p=0.80; iSPNs: p=0.34; all vs. vehicle; Mann-Whitney) normalized to pre-drug baseline. Right: Bias in Ca2+ transient frequency between pathways (3 mg/kg: p=0.13; L-DOPA: p=0.08; all vs. vehicle, Mann-Whitney).
Author response image 1
Author response image 2
Videos
Video 1
Two-photon time lapse series (30 Hz frame rate) of Gcamp6f fluorescence in dorsolateral striatum as mice engage in bouts of self-paced forward locomotion.
Replay speed: 1x.
Tables
Key resources table
| Reagent type (species) or resource | Designation | Source or reference | Identifiers | Additional information |
|---|---|---|---|---|
| Genetic reagent (M. musculus) | C57BL/6J | Jackson Laboratory | RRID:IMSR_JAX:000664 | |
| Genetic reagent (M. musculus) | B6.Cg-Tg(Drd1a-tdTomato)6Calak/J; Drd1atdTomato | Jackson Laboratory (Ade et al., 2011) | RRID:IMSR_JAX:016204 | |
| Genetic reagent (M. musculus) | Tg(Adora2a-cre)KG139Gsat; Adora2aCre | GENSAT (Gong et al., 2007) | RRID:MMRRC_036158-UCD | |
| Genetic reagent (M. musculus) | Tg(Drd1a-cre)EY217Gsat; Drd1aCre | GENSAT (Gong et al., 2007) | RRID:MMRRC_030778-UCD | |
| Genetic reagent (M. musculus) | B6;129S6-Gt(ROSA)26Sortm14(CAG-tdTomato)Hze/J; Ai14 | Jackson Laboratory (Madisen et al., 2010) | RRID:IMSR_JAX:007908 | |
| Genetic reagent (M. musculus) | B6.129S-Chattm1(cre)Lowl/MwarJ; ChATCre | Jackson Laboratory (Rossi et al., 2011) | RRID:IMSR_JAX:031661 | |
| Antibody | Mouse monoclonal anti-Tyrosine Hydroxylase | Immunostar | Cat#: 22941 RRID:AB_572268 | IHC (1:1000) |
| Antibody | Rat monoclonal anti-Dopamine Transporter | Millipore | Cat#: MAB369 RRID:AB_2190413 | IHC (1:1000) |
| Antibody | Goat anti-mouse IgG Alexa Fluor 647 | Thermo Fisher Scientific | Cat#: A21236 RRID:AB_2535805 | IHC (1:500) |
| Antibody | Goat anti-rat IgG Alexa Fluor 647 | Thermo Fisher Scientific | Cat#: A21247 RRID:AB_141778 | IHC (1:500) |
| Recombinant DNA reagent | pAAV-FLEX-tdTomato | Addgene | Cat#: 28306-AAV1 RRID:Addgene_28306 | |
| Recombinant DNA reagent | pAAV-Syn-GCaMP6f-WPRE-SV40 | Addgene (Chen et al., 2013) | Cat#: 100837-AAV1 RRID:Addgene_100837 | |
| Recombinant DNA reagent | pAAV-hSyn-DA2m | Sun et al., 2020 | Kindly provided by Yulong Li | |
| Chemical compound, drug | Dexamethasone | Henry Schein | Cat #: 1396050 | 4 mg/kg, I.P. |
| Chemical compound, drug | Ketoprofen | Henry Schein | Cat #: 1310364 | 10 mg/kg, S.C. |
| Chemical compound, drug | Desipramine | Tocris | Cat #: 3067 | 25 mg/kg, I.P. |
| Chemical compound, drug | Pargyline | Sigma-Aldrich | Cat #: P8013 | 5 mg/kg, I.P. |
| Chemical compound, drug | 6-OHDA | Sigma-Aldrich | Cat #: H4381 | 3 μg, I.C. |
| Chemical compound, drug | SCH23390 | Fisher Scientific | Cat #: 09-251-0 | 0.2 mg/kg, I.P. |
| Chemical compound, drug | Nomifensine | Tocris | Cat #: 1992 | 10 mg/kg, I.P. |
| Chemical compound, drug | S(-)Raclopride | Sigma-Aldrich | Cat #: R121 | 1 mg/kg, I.P. |
| Chemical compound, drug | (-)Quinpirole | Tocris | Cat #: 1061 | 0.3–6 mg/kg, I.P. |
| Chemical compound, drug | SKF81297 | Tocris | Cat #: 1447 | 0.3–6 mg/kg, I.P. |
| Chemical compound, drug | L-DOPA | Tocris | Cat #: 3788 | 10 mg/kg, I.P. |
| Chemical compound, drug | Benserazide hydrochloride | Sigma-Aldrich | Cat #: B7283 | 12 mg/kg, I.P. |
| Software, algorithm | ScanImage 5 | Vidrio Technologies (Pologruto et al., 2003) | RRID:SCR_014307 | Used for two-photon image acquisition |
| Software, algorithm | Custom MATLAB code | https://github.com/HarveyLab/Acquisition2P_class.git (Driscoll et al., 2017; Chettih, 2019) | Used for two-photon image processing | |
| Software, algorithm | Custom MATLAB code | https://github.com/TritschLab/TLab-2P-analysis | Used for two-photon image analyses | |
| Software, algorithm | Wavesurfer | HHMI Janelia Research Campus | https://wavesurfer.janelia.org/ | Used to register behavior and imaging data |
| Software, algorithm | Fiji | Schindelin et al., 2012 | RRID:SCR_002285 | Used for image processing |
| Software, algorithm | Prism 8.0 | GraphPad | RRID:SCR_002798 | Used for plotting and statistical analyses |
| Other | Mounting medium with DAPI | Fisher Scientific | Cat #: P36931 |
Additional files
Download links
A two-part list of links to download the article, or parts of the article, in various formats.
Downloads (link to download the article as PDF)
Open citations (links to open the citations from this article in various online reference manager services)
Cite this article (links to download the citations from this article in formats compatible with various reference manager tools)
Dopamine differentially modulates the size of projection neuron ensembles in the intact and dopamine-depleted striatum
eLife 10:e68041.
https://doi.org/10.7554/eLife.68041


