Maturation of Purkinje cell firing properties relies on neurogenesis of excitatory neurons
- Department of Pathology and Immunology, Baylor College of Medicine, United States
- Jan and Dan Duncan Neurological Research Institute at Texas Children’s Hospital, United States
- Department of Neuroscience, Baylor College of Medicine, United States
- Program in Developmental Biology, Baylor College of Medicine, United States
- Howard Hughes Medical Institute, Department of Molecular and Human Genetics, Baylor College of Medicine, United States
- Development, Disease Models and Therapeutics Graduate Program, Baylor College of Medicine, United States
Figures
Figure 1 with 4 supplements
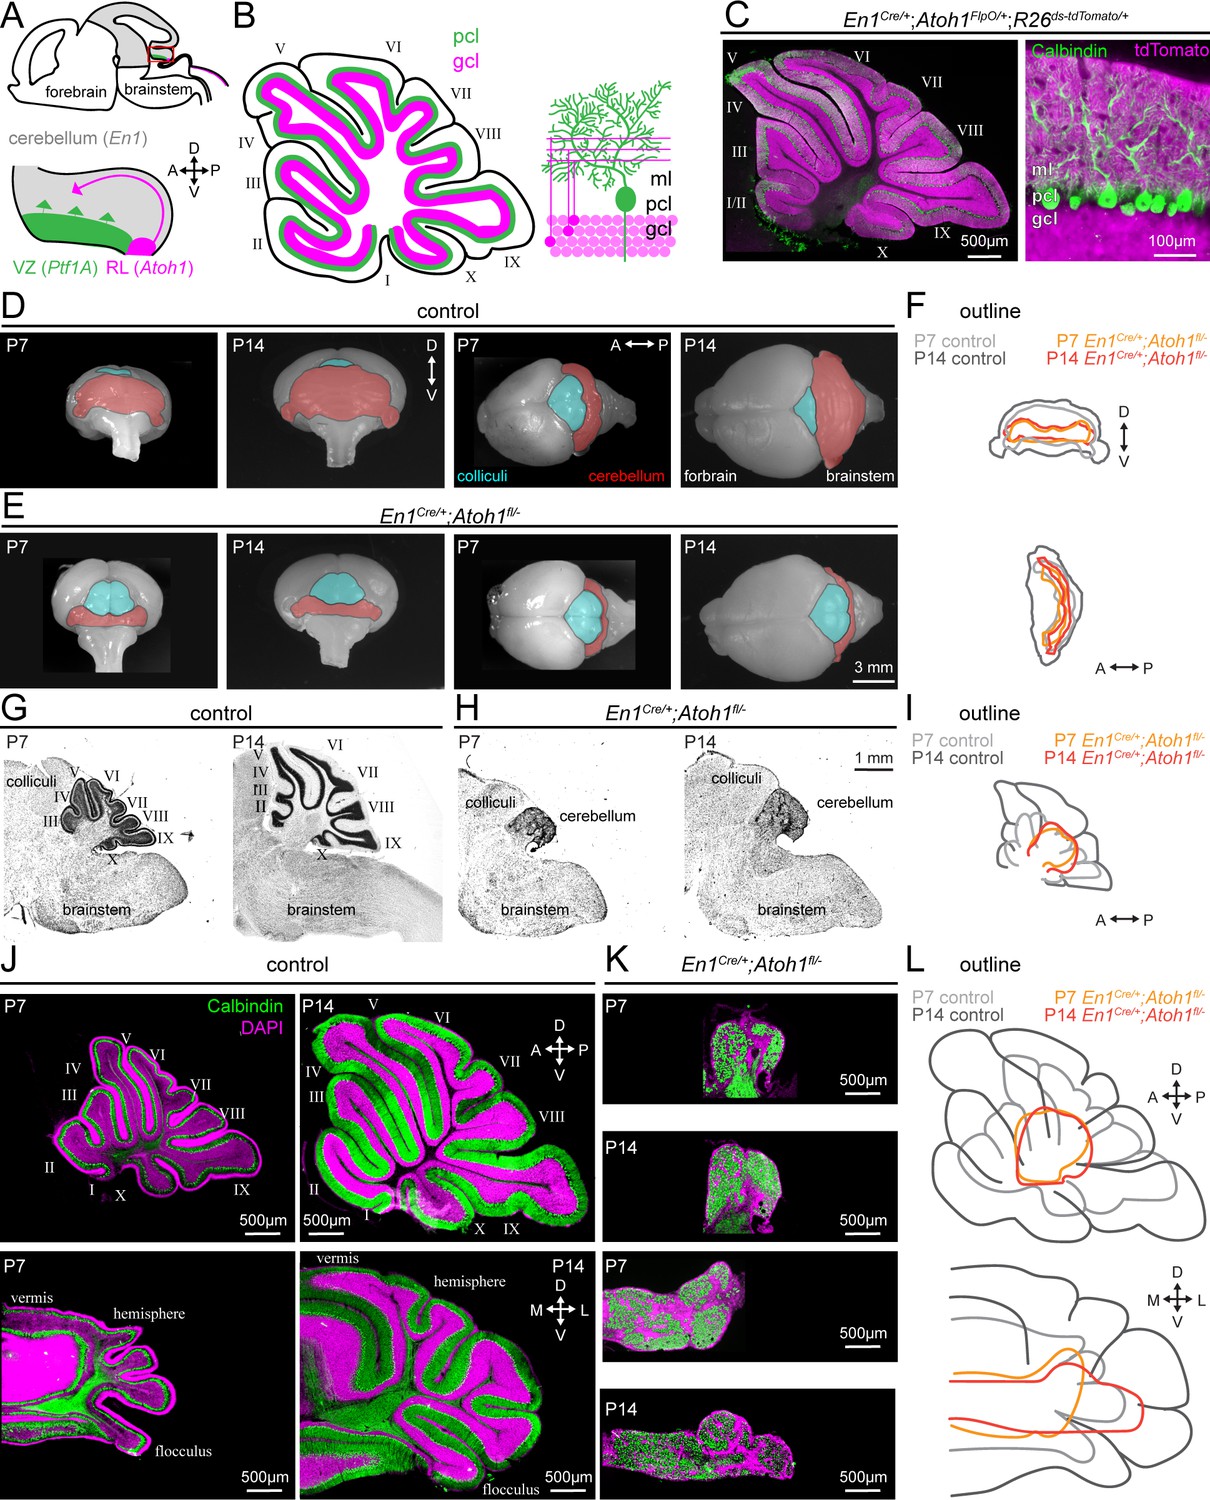
Conditional deletion of Atoh1 from the En1 domain prevents proper size expansion, lamination, and foliation of the cerebellum.
(A) Schematic of an embryonic brain. Inset is the cerebellar anlage. Atoh1 domain (excitatory lineage neurons, including granule cell precursors, pink), Ptf1a domain (inhibitory lineage neurons, including Purkinje cell precursors, green), En1 domain (gray). Orientation is the same for all panels unless otherwise indicated. (B) Schematic of a sagittal section of a P14 cerebellum (left). Cerebellar lobules are labeled with Roman numerals (Larsell, 1952). Schematic of the cerebellar microcircuit with Purkinje cells and granule cells (right). Purkinje cell = green; granule cell = pink; ml = molecular layer, pcl = Purkinje cell layer; gcl = granule cell layer. (C) Intersectional labeling of En1;Atoh1 domain with tdTomato (pink) shows no overlap with Purkinje cells (Calbindin; green). (D) Whole brain images of cerebellum from anterior (left two images) and dorsal view (right two images) from P7 and P14 in control animals. The cerebellum is pseudo-colored in red. (E) Whole brain images of the cerebellum from anterior (left two images) and dorsal views (right two images) from P7 and P14 En1Cre/+;Atoh1fl/- mice. The cerebellum is pseudo-colored in red. (F) Outline of cerebellar size in control and En1Cre/+;Atoh1fl/- mice at P7 and P14 showing size expansion in control, but not En1Cre/+;Atoh1fl/- mice. (G) Sagittal sections of the hindbrain from control mice stained with cresyl violet to visualize gross architecture and regional organization of the brain. (H) Sagittal sections of the hindbrain from En1Cre/+;Atoh1fl/- mice stained with cresyl violet showing the general deformities in regional patterning. (I) Outline of cerebellar size in control and En1Cre/+;Atoh1fl/- mice at P7 and P14 showing size expansion in control, but not En1Cre/+;Atoh1fl/- mice. (J) Sagittal (top) and coronal (bottom) whole section images of cerebella from P7 (left) and P14 (right) control mice. Purkinje cells are stained with Calbindin (green) and DAPI (pink). Note the layered and foliated structure of the cerebellum. (K) Sagittal (top) and coronal (bottom) whole section images of cerebella from P7 and P14 En1Cre/+;Atoh1fl/- mice. Purkinje cells are stained with Calbindin (green) and DAPI (pink). All images are presented at the same magnification. Note the lack of layers and foliation. All images in J and K are presented at the same magnification. (L) Outline of cerebellar size in control and En1Cre/+;Atoh1fl/- mice at P7 and P14 showing size expansion in control, but not in the En1Cre/+;Atoh1fl/- mice. All images are representative of N=3 per age and genotype group.
Figure 1—figure supplement 1
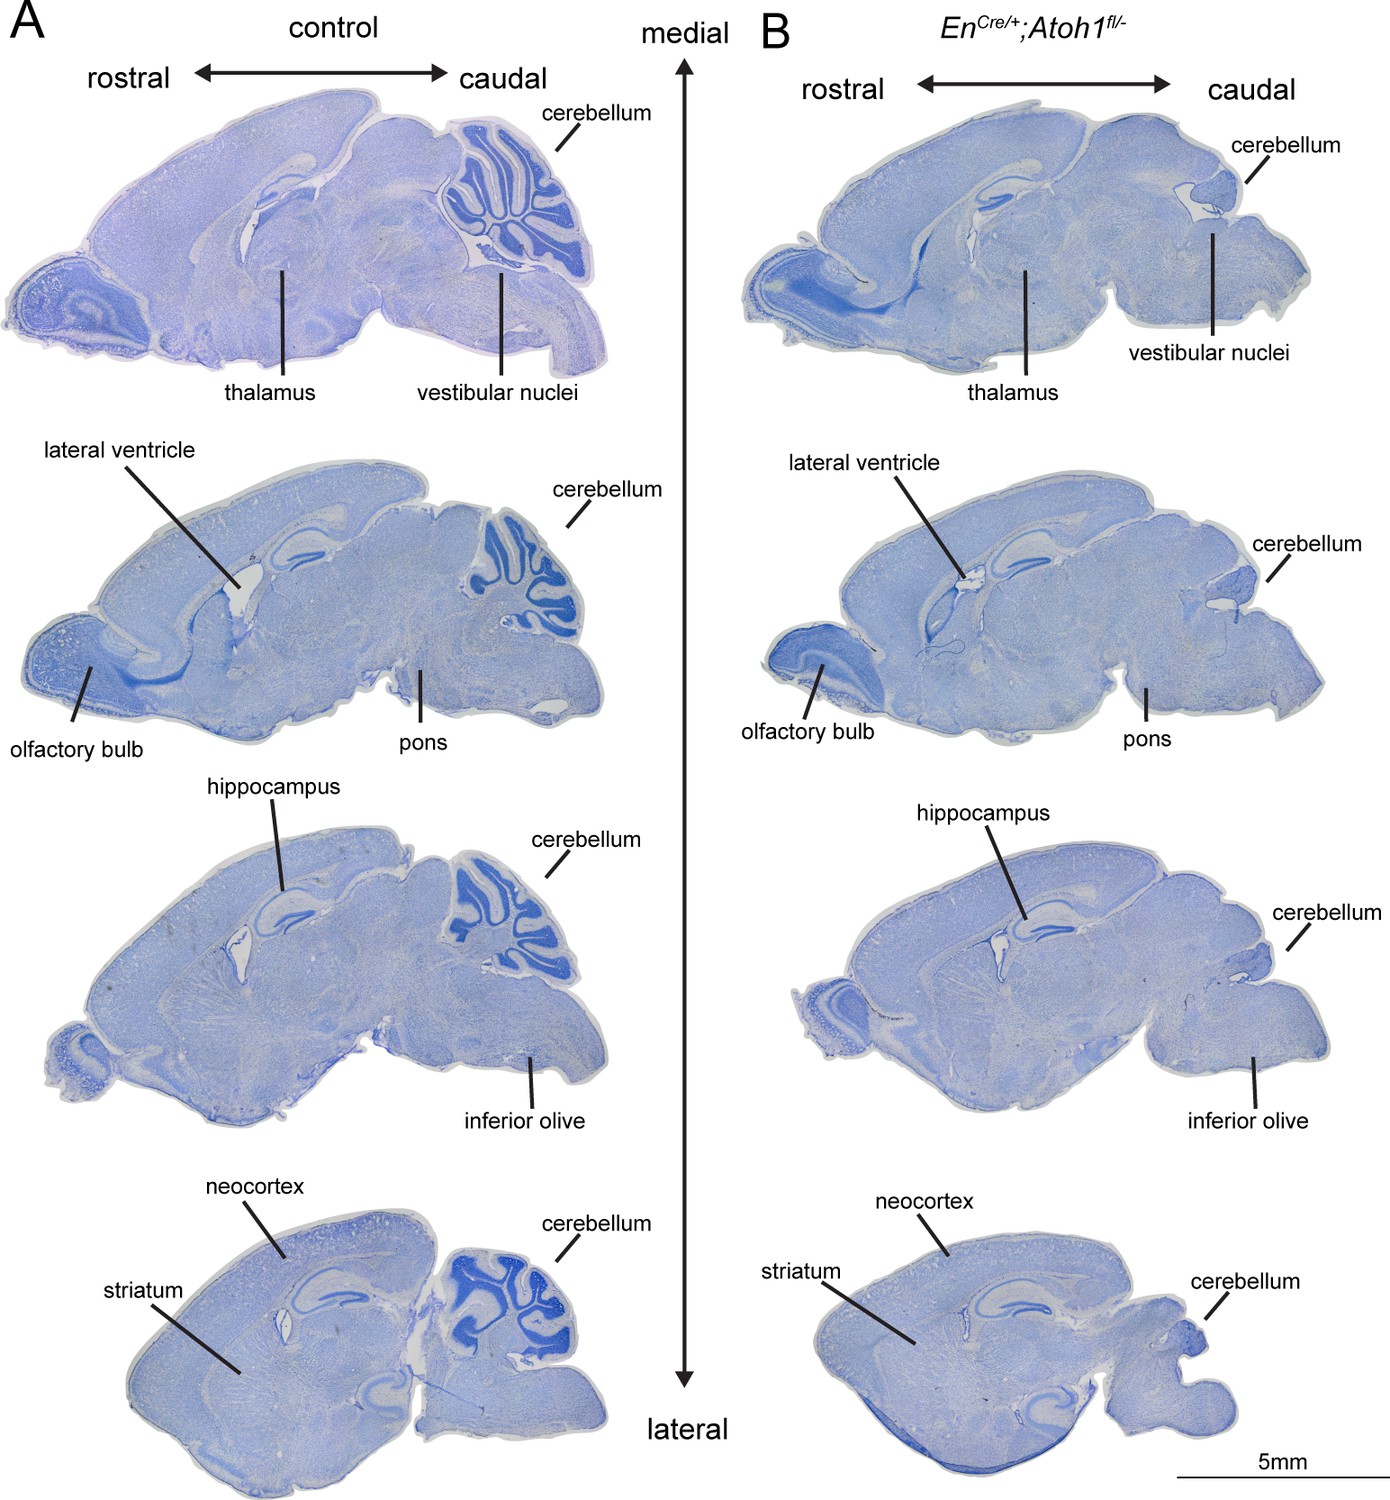
Conditional deletion of Atoh1 from the En1 domain leads to cerebellum-specific morphological abnormalities.
(A) Whole brain sagittal tissue sections from control mice stained using cresyl violet demonstrate the typical anatomical features found throughout the forebrain, midbrain and hindbrain. (B) Whole brain sagittal tissue sections of En1Cre/+;Atoh1fl/- mice stained using cresyl violet display cerebellar-specific gross morphological abnormalities. Regions labeled in the control and En1Cre/+;Atoh1fl/- brain sections: olfactory bulb, hippocampus, striatum, thalamus, pons, vestibular nuclei, inferior olive, and neocortex. All tissue sections were taken from P14 mice.
Figure 1—figure supplement 2
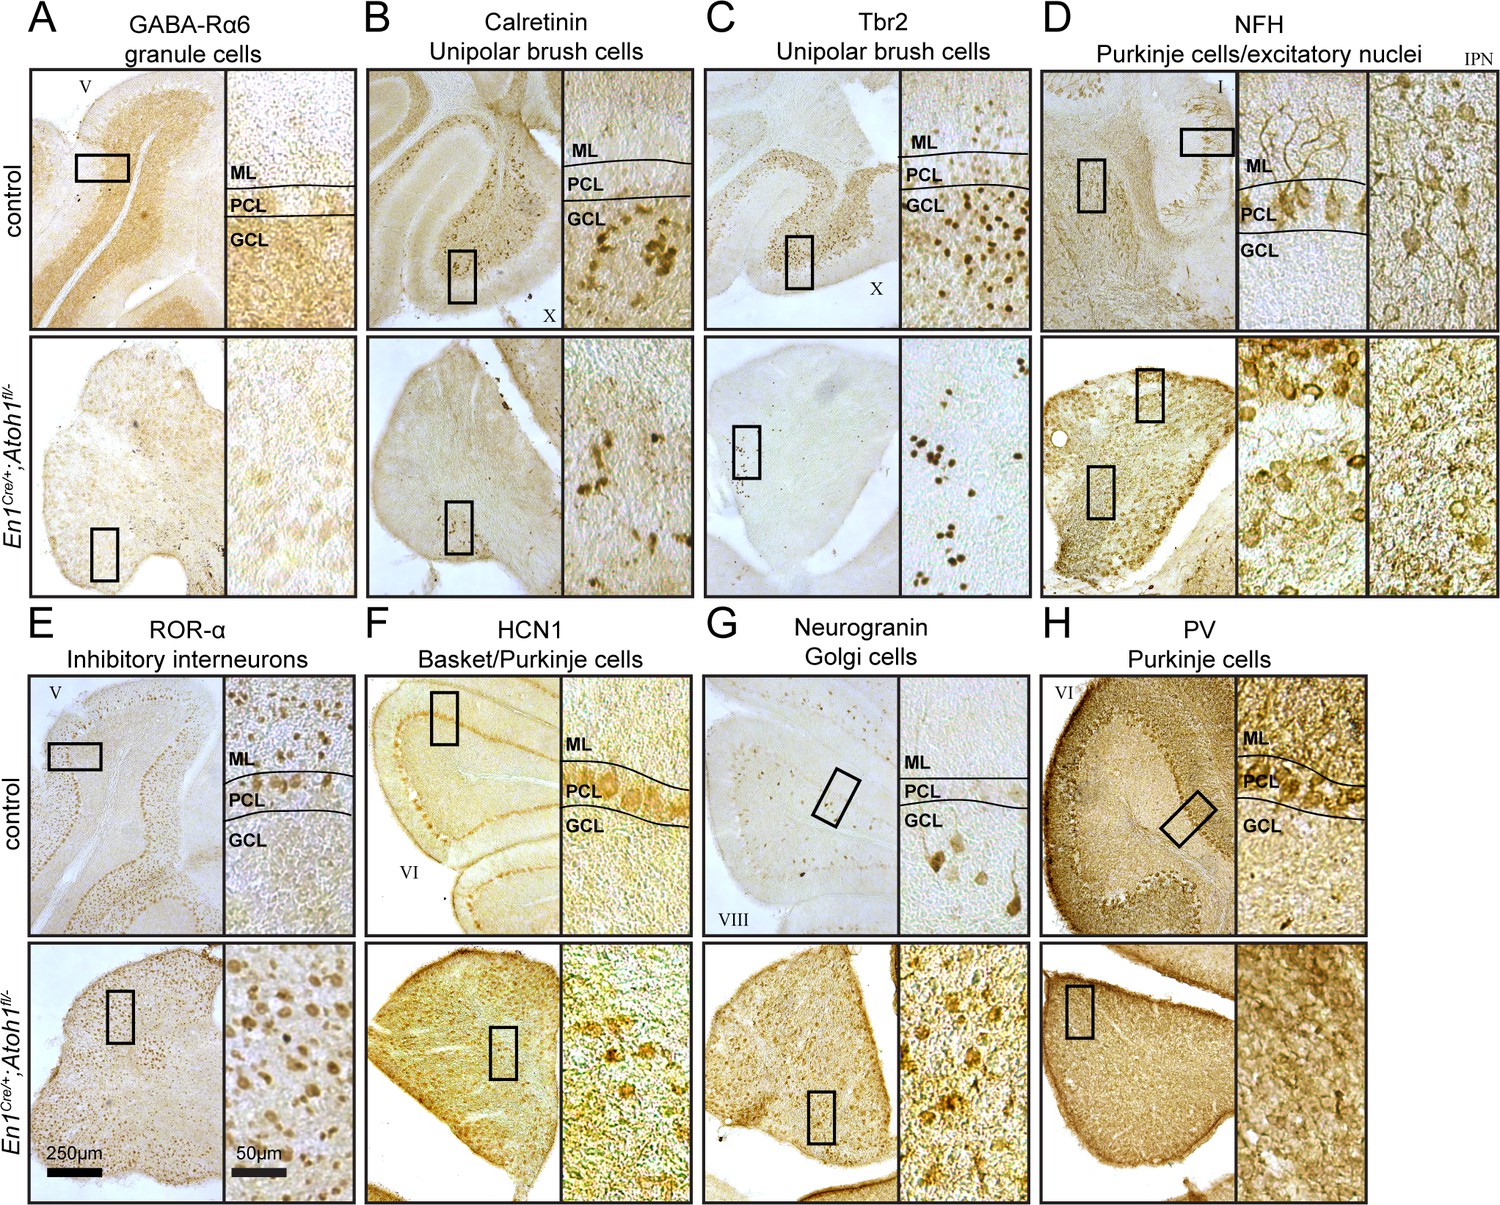
Conditional deletion of Atoh1 from the En1 domain reduces the density of excitatory cerebellar cell types, but increases the density of inhibitory cerebellar cell types.
(A) En1Cre/+;Atoh1fl/- mice lack differentiated granule cells, identified with GABARα6. (B and C) En1Cre/+;Atoh1fl/- mice have a reduction in unipolar brush cells, identified by Calretinin and Tbr2. (D) En1Cre/+;Atoh1fl/- mice have dense staining for NFH that marks Purkinje cells and excitatory nuclei (interposed nucleus shown here). (E through H) En1Cre/+;Atoh1fl/- mice have a high density of inhibitory neurons, revealed with the expression of RORα (E), HCN1 (F), Neurogranin (G), and PV (H). All images are representative for N=3 brains for each genotype and were performed in P14 mice.
Figure 1—figure supplement 3
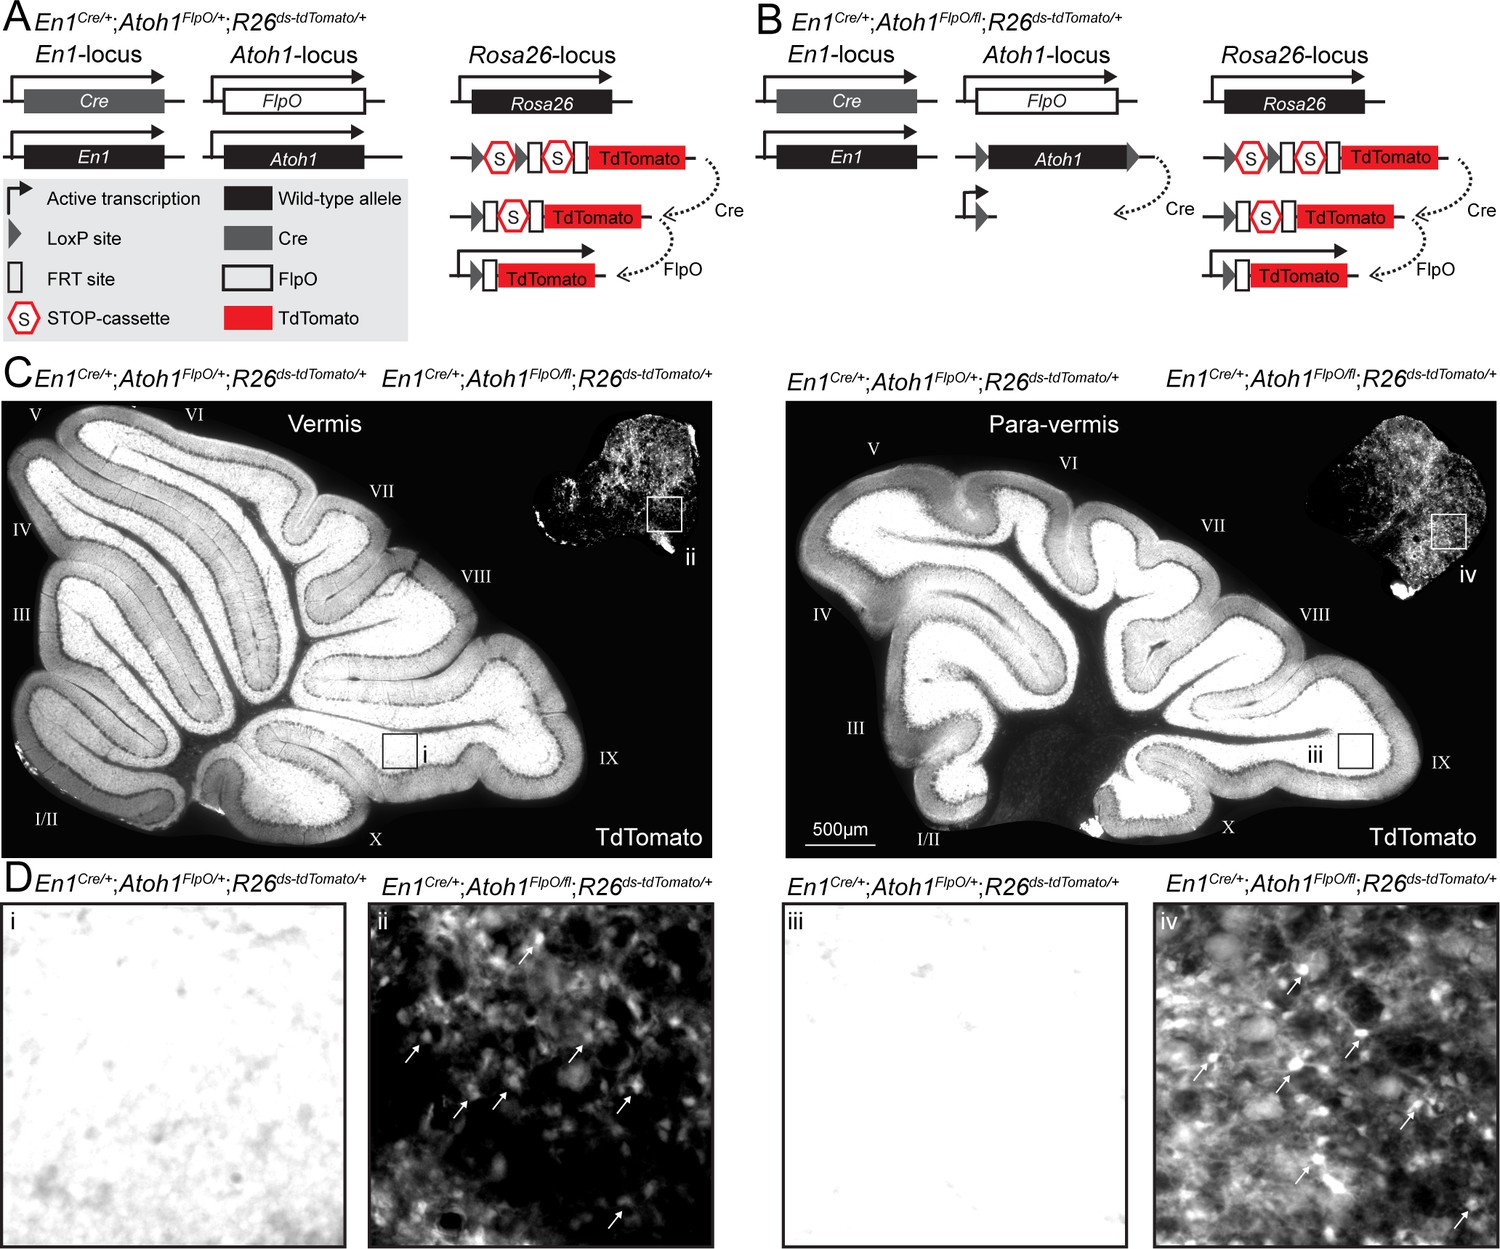
Conditional deletion of Atoh1 from the En1 domain reduces the density of En1;Atoh1 lineage neurons.
(A) Genetic strategy to express TdTomato in the En1;Atoh1 lineage of control mice. (B) Genetic strategy to express TdTomato in the En1;Atoh1 lineage of conditional knockout mice. (C) Expression of TdTomato in sagittal tissue sections taken at the midline (vermis) and more medial (para-vermis) regions of cerebella from control (bottom, left) and conditional knockout (top, right) mice. (D) High magnification of TdTomato signal in lobule IX of control mice (i and iii) and the ventro-caudal region of conditional knockout mice (ii and iv) showing signal saturation in control mice and individually countable cells (arrows) in the conditional knockout mice.
Figure 1—figure supplement 4
Conditional deletion of Atoh1 from the En1 domain reduces the number of unipolar brush cells and excitatory nuclei neurons.
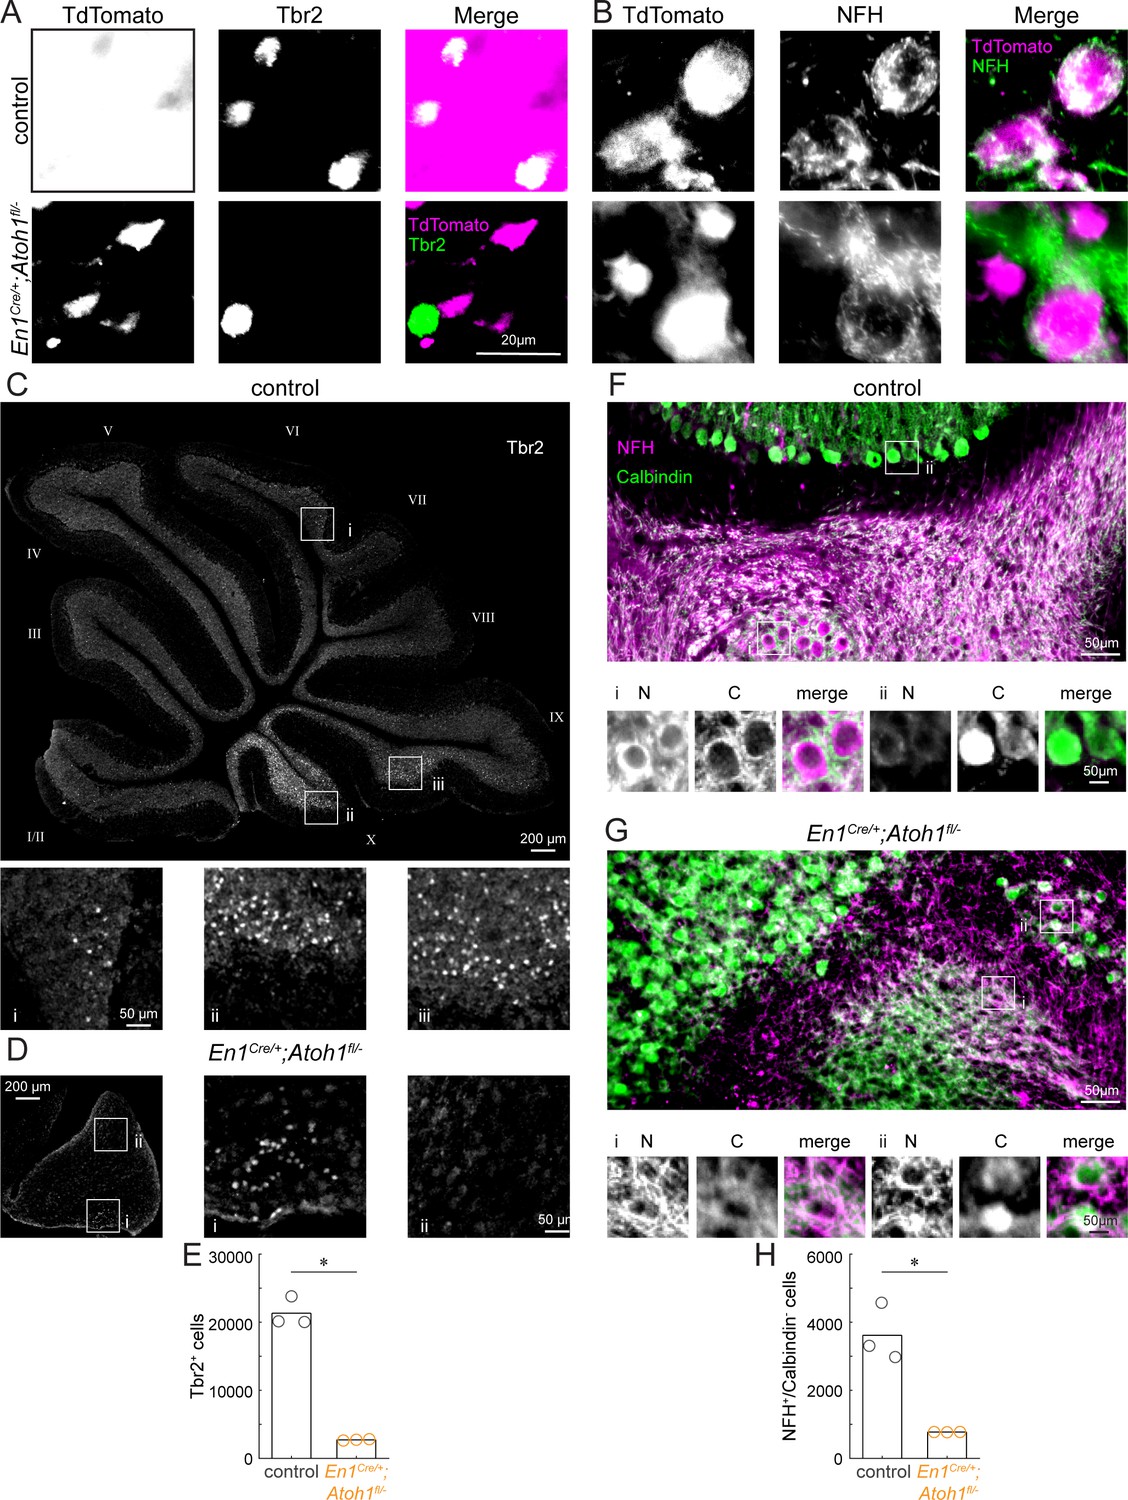
(A) Co-expression of Tbr2 (green) and TdTomato (pink) in the En1;Atoh1 lineage (as in Figure 1—figure supplement 3) in control (top) and conditional knockout (bottom) cerebellums. (B) Co-expression of NFH (green) and TdTomato (pink) in the En1;Atoh1 lineage (as in Figure 1—figure supplement 3) in control (top) and conditional knockout (bottom) cerebellums. (C) Whole section image of Tbr2 (grey) expressing cells in cerebellum from control mouse. Cerebellar lobules are labeled with Roman numerals (Larsell, 1952). Insets (i, ii, iii) show lower density of Tbr2+ cells in dorsal lobule VI (i) than in ventral lobules IX (iii) and X (ii). (D) Whole section image of Tbr2 (gray) expressing cells in the cerebellum from an En1Cre/+;Atoh1fl/- mouse. Insets (i, ii) show higher density of Tbr2+ neurons in ventral cerebellum (i) than in dorsal cerebellum (ii). (E) Quantification of Tbr2+ cells (unipolar brush cells) in control and En1Cre/+;Atoh1fl/- mice. (F) NFH (pink) and Calbindin (green) staining in the cerebellum of a control mouse. Insets show examples of NFH+/Calbindin- (i, excitatory nuclei cells) and NFH+/Calbindin+ (ii, Purkinje cell). In insets, N = NFH signal; C = Calbindin signal; merge = both. (G) NFH (pink) and Calbindin (green) staining in the cerebellum of an En1Cre/+;Atoh1fl/- mouse. Insets show examples of NFH+/Calbindin- (i, putative excitatory nuclei cell) and NFH+/Calbindin+ (ii, Purkinje cell). In insets, N = NFH signal; C = Calbindin signal; merge = both. (H) Quantification of NFH+/Calbindin- cells (putative excitatory nuclei cells for the mutant) in control and En1Cre/+;Atoh1fl/- mice. For (E and H) bar height represents the mean for each genotype (N=3 mice for each). *p<0.05 as determined by a two-tailed, unpaired T-test. The raw data and specific p-values for the comparisons are presented in Figure 1—figure supplement 4—source data 1.
-
Figure 1—figure supplement 4—source data 1
Source data and specific p-values for representative graphs in Figure 1—figure supplement 4.
- https://cdn.elifesciences.org/articles/68045/elife-68045-fig1-figsupp4-data1-v1.xlsx
Figure 2
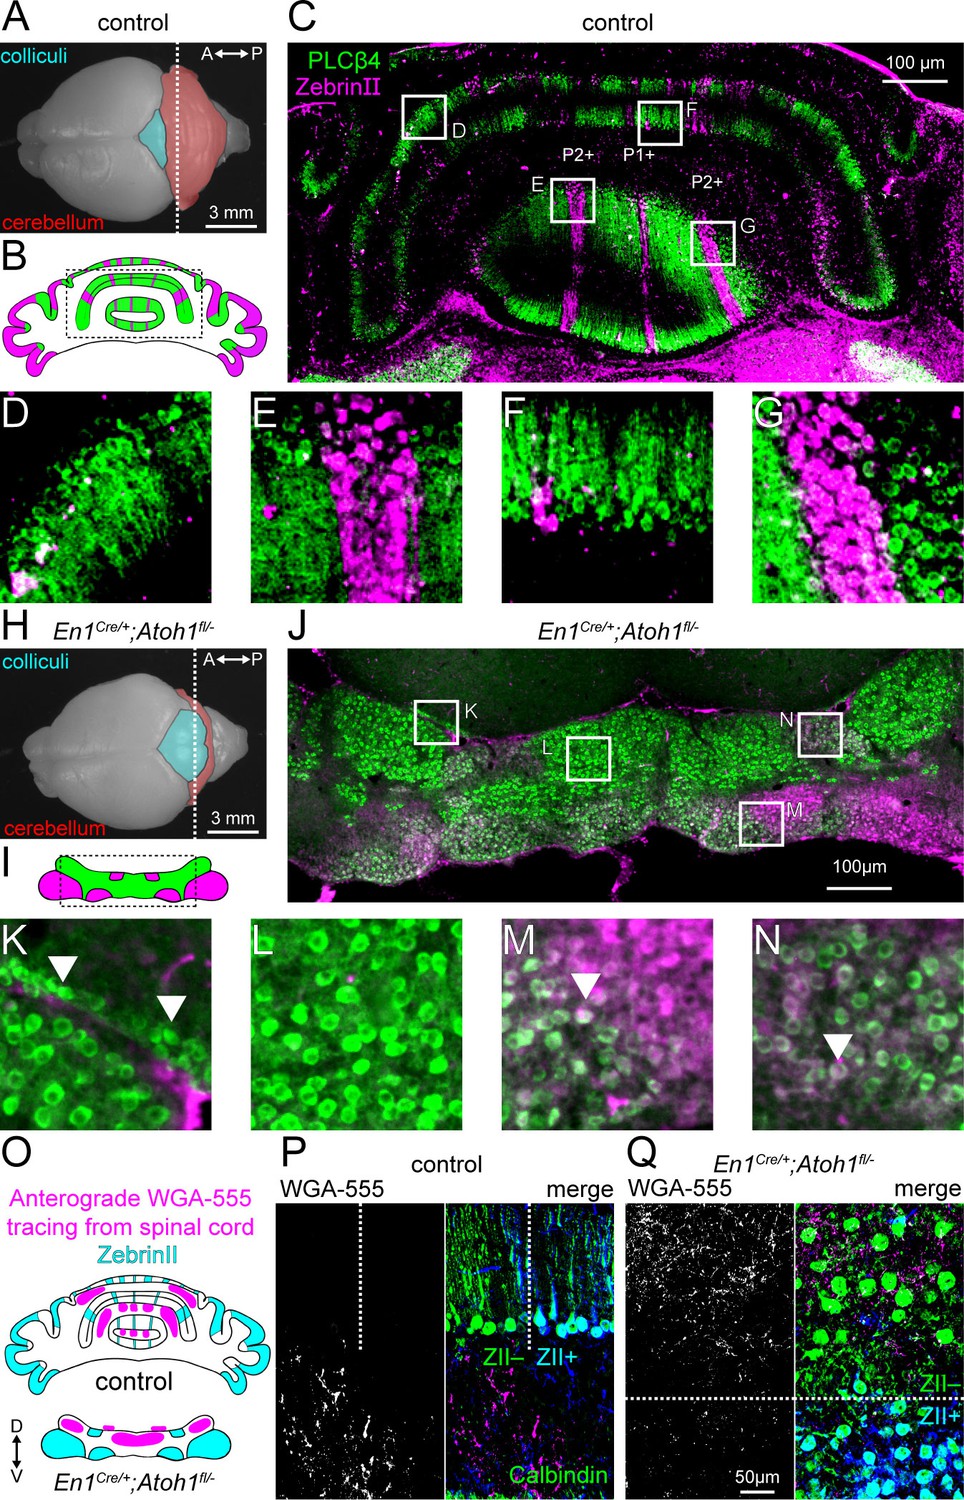
Atoh1 lineage neurons are necessary for the formation of sharp zonal patterns of Purkinje cell sub-types and spinal cord mossy fiber projections.
(A) Top view of a control P14 brain. Dotted line shows the position of the schematic in (B) and where the section in (C) was taken from. (B) Schematic of Purkinje cell ZebrinII (pink) and PLCβ4 (green) patterns in a control section illustrating the striped patterns at P14. (C) Staining of ZebrinII (pink) and PLCβ4 (green). (D-G) Higher power magnification images of insets in (C, H). Top view of En1Cre/+;Atoh1fl/- P14 brain. Dotted line shows position of schematic in (I) and where the section in (J) was taken from. (I) Schematic of Purkinje cell ZebrinII (pink) and PLCβ4 (green) patterns in En1Cre/+;Atoh1fl/- mice showing a clustered pattern at P14. (J) Staining of ZebrinII (pink) and PLCβ4 (green). (K-N) Higher power magnification images of insets in (J) Arrowhead in K: over-migrated Purkinje cells in the inferior colliculus. Arrowhead in M and N: Purkinje cells co-expressing ZebrinII and PLCβ4. (O) Schematic of ZebrinII staining pattern and WGA-Alexa 555 tracing form the spinal cord to the cerebellum in control and En1Cre/+;Atoh1fl/- mice. (P) Representative images of WGA-Alexa 555+ terminals (left: gray; right: pink) in the cerebellum of a control mouse. Dotted lines represent the border between ZebrinII+ (cyan) and ZebrinII- regions. Purkinje cell stained with Calbindin (green) ZebrinII is shown in dark blue. The overlap between Calbindin and ZebrinII is shown cyan. (Q) Representative images of WGA-Alexa 555+ terminals (left: gray; right: pink) in the cerebellum of an En1Cre/+;Atoh1fl/- mouse. Dotted lines represent the border between ZebrinII+ (cyan) and ZebrinII- regions. Purkinje cell stained with Calbindin (green). All images are representative of N=3 brains per genotype.
Figure 3
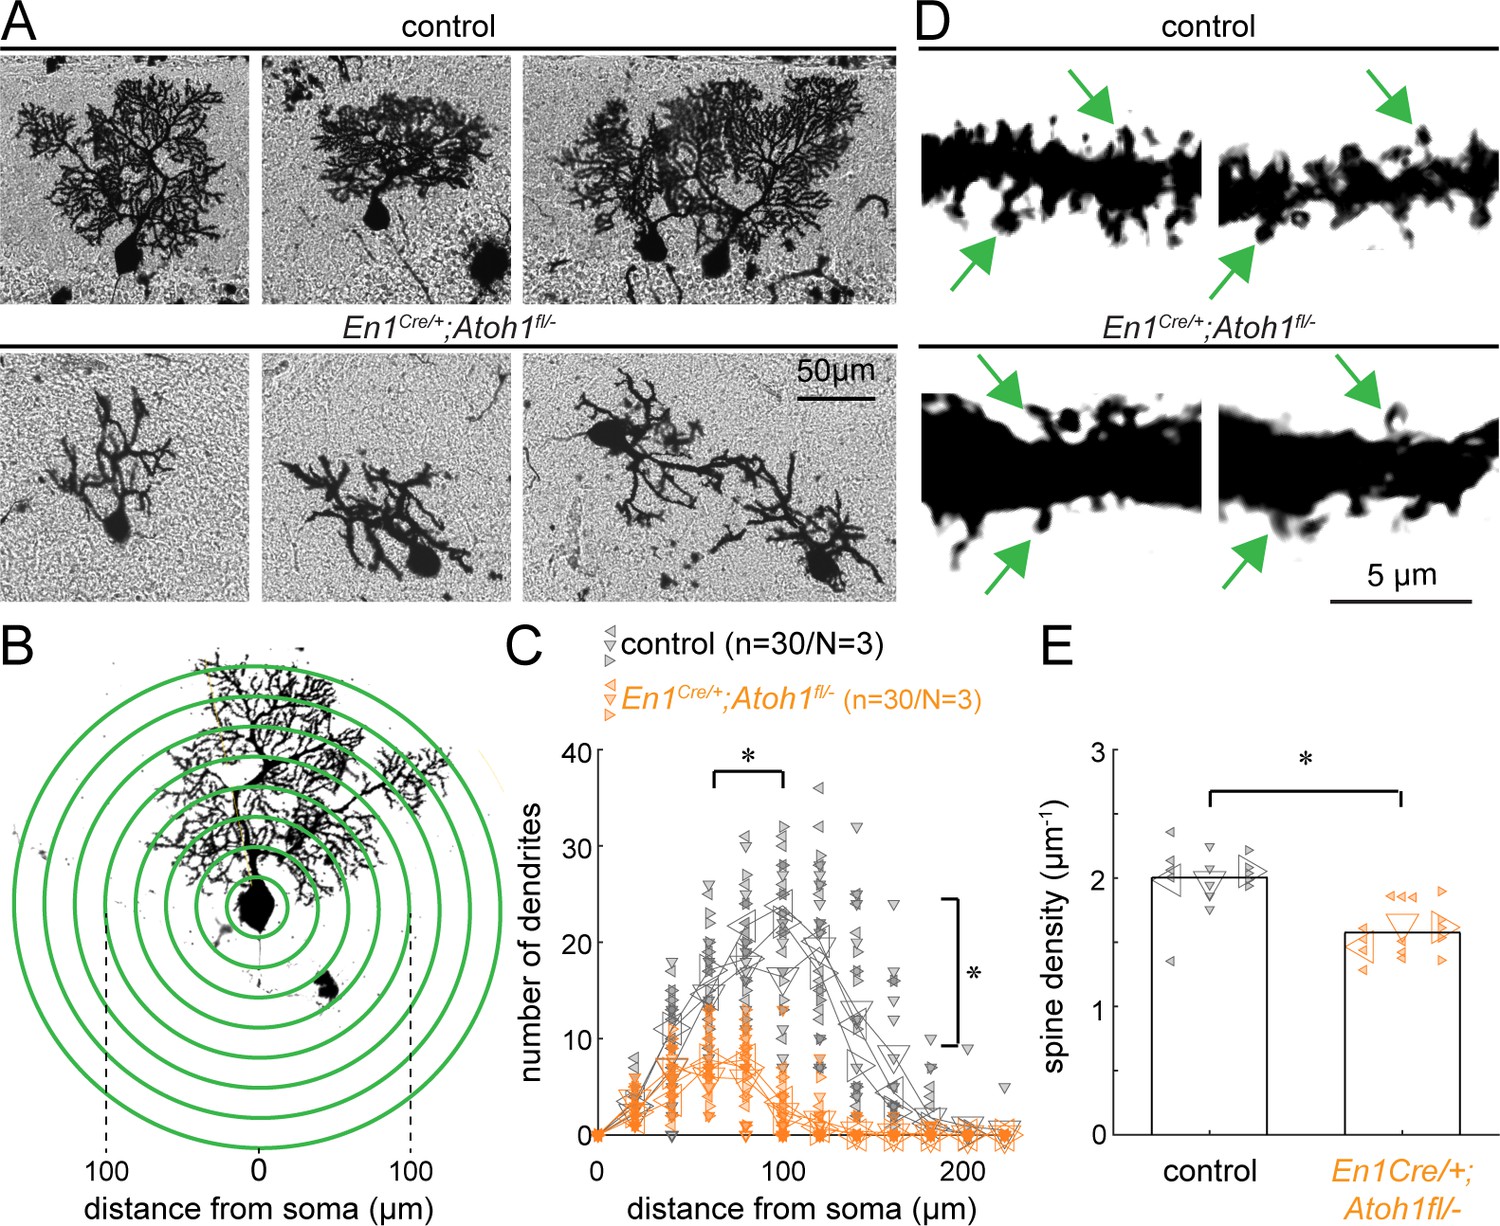
Atoh1 lineage neurons are necessary for establishing the dendritic complexity of Purkinje cells.
(A) Representative images of Golgi-Cox-labeled Purkinje cells in the cerebella of control (top row) and En1Cre/+;Atoh1fl/- (bottom row) mice. (B) Sholl analysis for dendritic complexity. (C) Purkinje cells in En1Cre/+;Atoh1fl/- mice have shorter and less branched Purkinje cell dendrites (n=30/N=3 for each genotype, each animal is indicated with a differentially oriented triangle). (D) Golgi stains showing dendritic spines for control and En1Cre/+;Atoh1fl/- mice (examples indicated by green arrowheads). (E) En1Cre/+;Atoh1fl/- mice contain a significantly lower number of dendritic spines compared to control mice. *p<0.001 for spine density (n=15/N=3 for each genotype, each animal is indicated with a differentially oriented triangle). Linear mixed model with genotype as the fixed effect and mouse number as the random effect. *p<0.001 for both the distance from the soma, the branch number, and spine density. All images were acquired from the cerebella of P14 mice. The raw data and specific p-values for the comparisons are presented in Figure 3—source data 1.
-
Figure 3—source data 1
Source data and specific p-values for representative graphs in Figure 3.
- https://cdn.elifesciences.org/articles/68045/elife-68045-fig3-data1-v1.xlsx
Figure 4
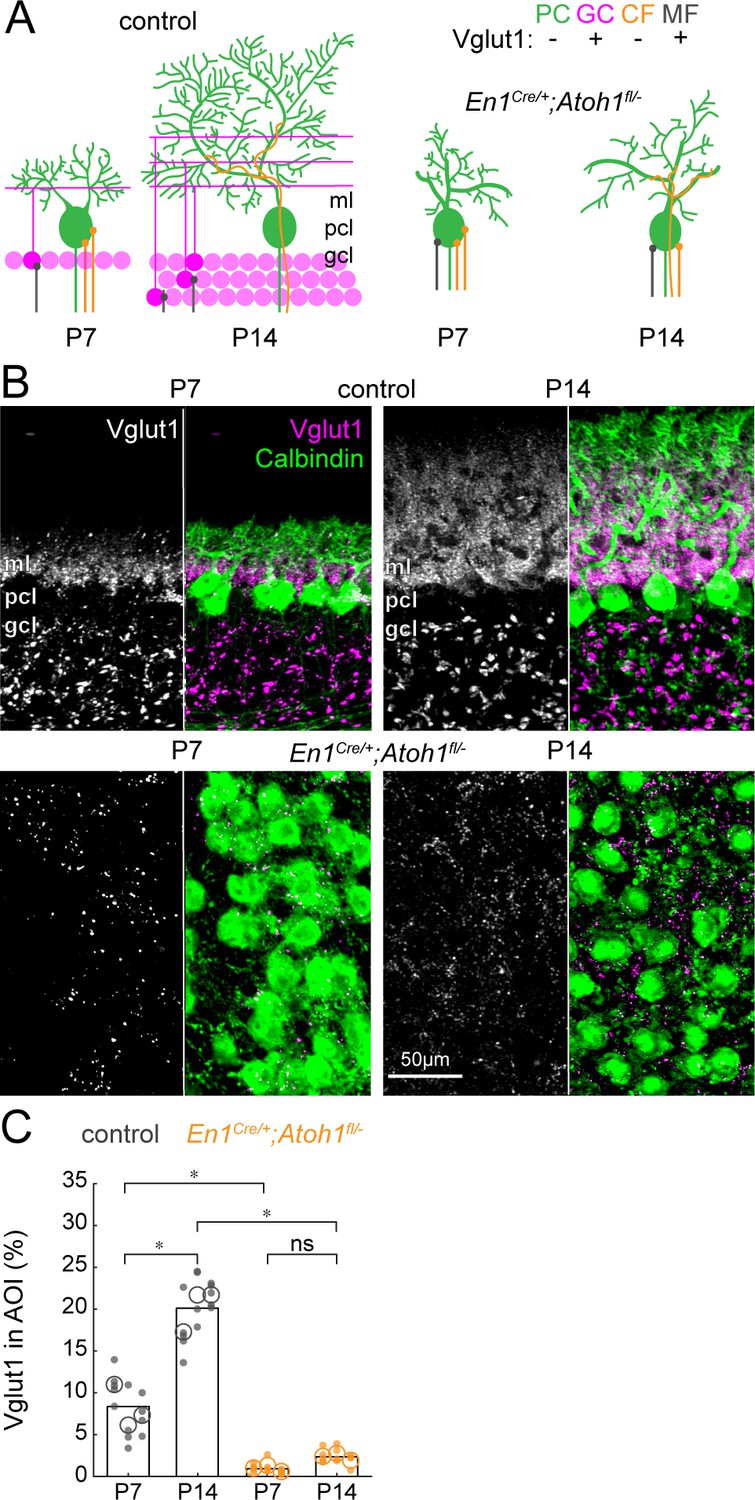
The density of Vglut1 synapses onto Purkinje cells increases between P7 and P14 in control mice and is lower in En1Cre/+;Atoh1fl/- mice.
(A) Schematic of Purkinje cell microcircuit in control (left) and En1Cre/+;Atoh1fl/- mice (right) at P7 and P14. Vglut1 is expressed in granule cell (pink) and some mossy fiber (gray) terminals but not in Purkinje cells (green) or climbing fiber (orange) terminals. Abbreviations: ml = molecular layer; pcl = Purkinje cell layer; gcl = granule cell layer. (B) Representative images for Vglut1 density in the cerebellum of control (top) and En1Cre/+;Atoh1fl/- mice (bottom) at P7 and P14. Left panels are gray-scale images of the Vglut1 signal and right images show the merged images of the Vglut1 (pink) and Calbindin (green) signals. (C) Density of Vglut1 synapses as a percentage of area of interest (AOI; AOI comprises the molecular and Purkinje cell layer in cerebella from control animals and the area occupied by Purkinje cells in the cerebella of En1Cre/+;Atoh1fl/- mice). Significance was established based on the average of each mouse (N=3 mice per genotype, large circles; n=3–5 tissue sections, small dots) using a two-way ANOVA (genotype*age) followed by a Tukey Kramer post-hoc analysis. *p=0.05. The raw data and specific P-values for the comparisons are presented in Figure 4—source data 1.
-
Figure 4—source data 1
Source data and specific p-values for representative graphs in Figure 4.
- https://cdn.elifesciences.org/articles/68045/elife-68045-fig4-data1-v1.xlsx
Figure 5 with 1 supplement
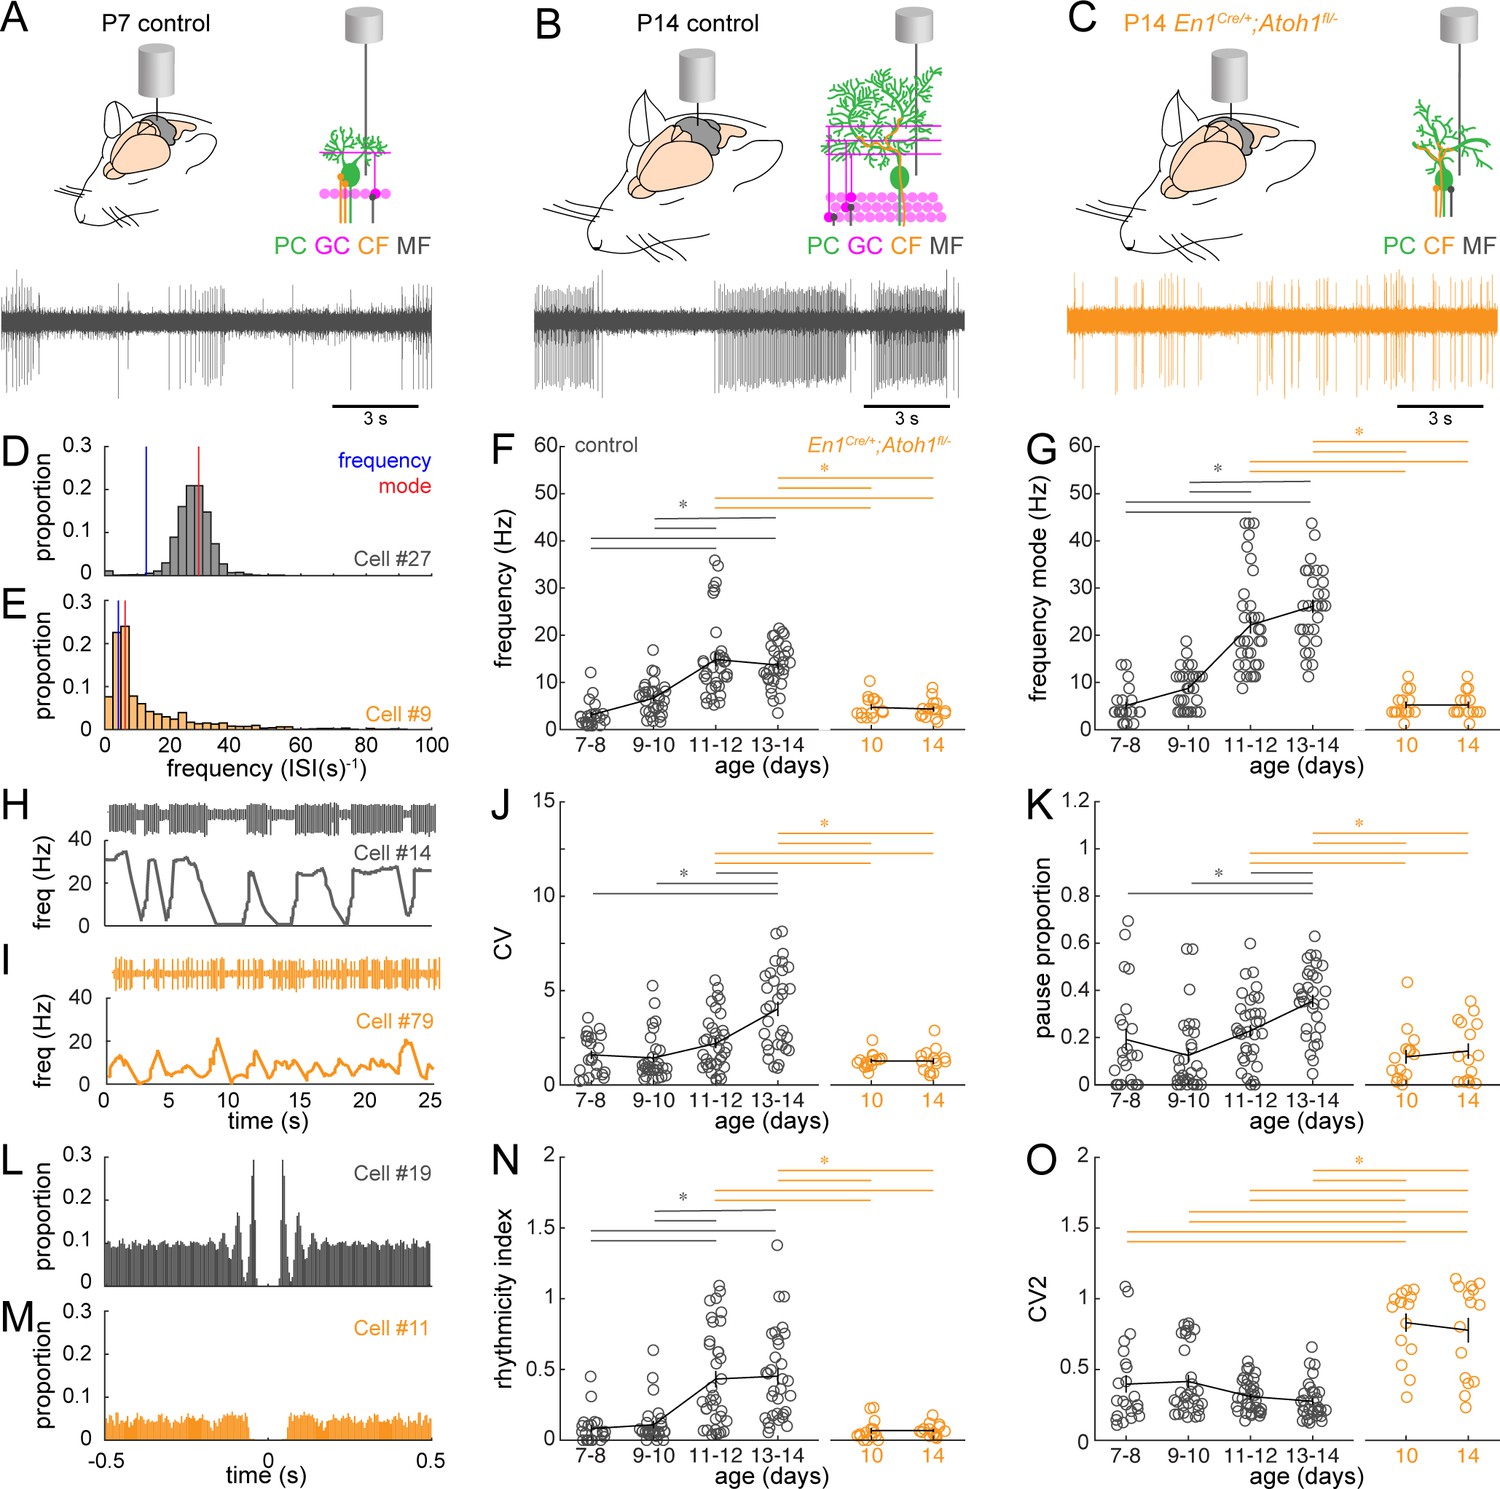
Purkinje cell simple spike firing patterns transform from P7 to P14 in control mice and reflect altered maturation in P14 En1Cre/+;Atoh1fl/- mice.
(A) Schematic of in vivo Purkinje cell recordings in P7 control mouse. Top left: cerebellum with recording electrode. Top right: schematic with recording electrode extracellular to Purkinje cell body. Bottom: representative 15 s recording from a Purkinje cell, each large vertical line is an action potential. (B) Same as (A) For P14 control mouse. (C) Same as (A) for P14 En1Cre/+;Atoh1fl/- mouse. (D) and (E) Examples of frequency (interspike interval, ISI−1) distributions of simple spike firing rate in a P14 Purkinje cell recorded in a control (D) and En1Cre/+;Atoh1fl/- (E) mouse. Blue line indicates the ‘frequency’ as calculate by the total number of simple spikes/recording time (spikes/s). Red lines indicate ‘frequency mode’ as the frequency most commonly observed in the frequency distribution. (F) Simple spike firing frequency (spikes/recording time). (G) Simple spike frequency mode (peak ISI−1 distribution). (H) and (I) example recordings (25 s) from P14 Purkinje cells in control (H) and En1Cre/+;Atoh1fl/- (I) mouse. The top is the recording. Bottom is the firing frequency averaged over one second. (J) Simple spike CV (global firing irregularity). (K) Pause percentage (proportion of recording with ISI > five times average ISI). (L) and (M) Examples of auto-correlograms of the simple spike ISI in a P14 Purkinje cell recorded in a control (L) and En1Cre/+;Atoh1fl/- (M) mouse. (N) Simple spike rhythmicity index calculated based on auto-correlogram. (O) Simple spike CV2 (local firing irregularity). For F,G, J, K, N, and O, significance was determined using an ANOVA between the four control age groups and two En1Cre/+;Atoh1fl/- age groups followed by a Tukey-Kramer post-hoc analysis to assess differences between the groups. Significance was accepted at p<0.05. In the figure, the statistical significance between two groups is indicated as a line starting and ending above the two groups. Gray lines indicate differences within control groups of different ages and orange lines indicate differences between control and En1Cre/+;Atoh1fl/- groups. N/n-numbers: control: P7-8: n=22 cells from N=13 mice; control P9-10: n=30/N=12; control P11-12: n=35/N=11; control P13-14: n=32/N=14; En1Cre/+;Atoh1fl/- P10: n=15/N=3; En1Cre/+;Atoh1fl/- P14: n=15/N=6. The raw data and specific p-values for all the comparisons are presented in Figure 5—source data 1.
-
Figure 5—source data 1
Source data and specific p-values for representative graphs in Figures 5 and 6.
- https://cdn.elifesciences.org/articles/68045/elife-68045-fig5-data1-v1.xlsx
Figure 5—figure supplement 1
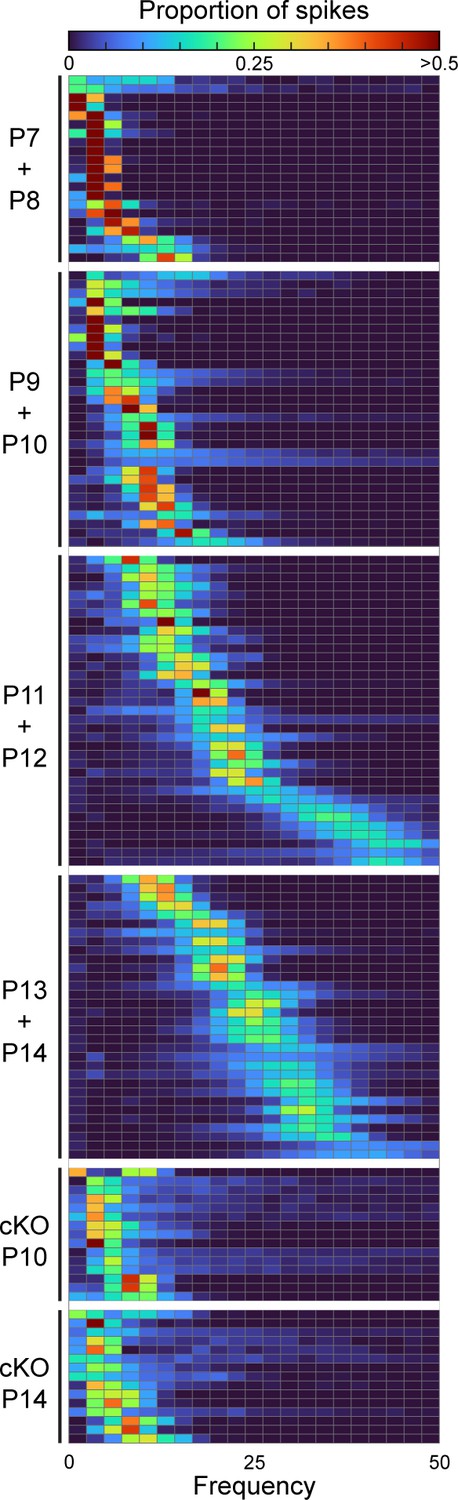
Simple spike distributions of single Purkinje cells.
Heatmap of frequency distribution of simple spike firing patterns in Purkinje cells of different ages in control and En1Cre/+;Atoh1fl/- mice.
Figure 6 with 1 supplement
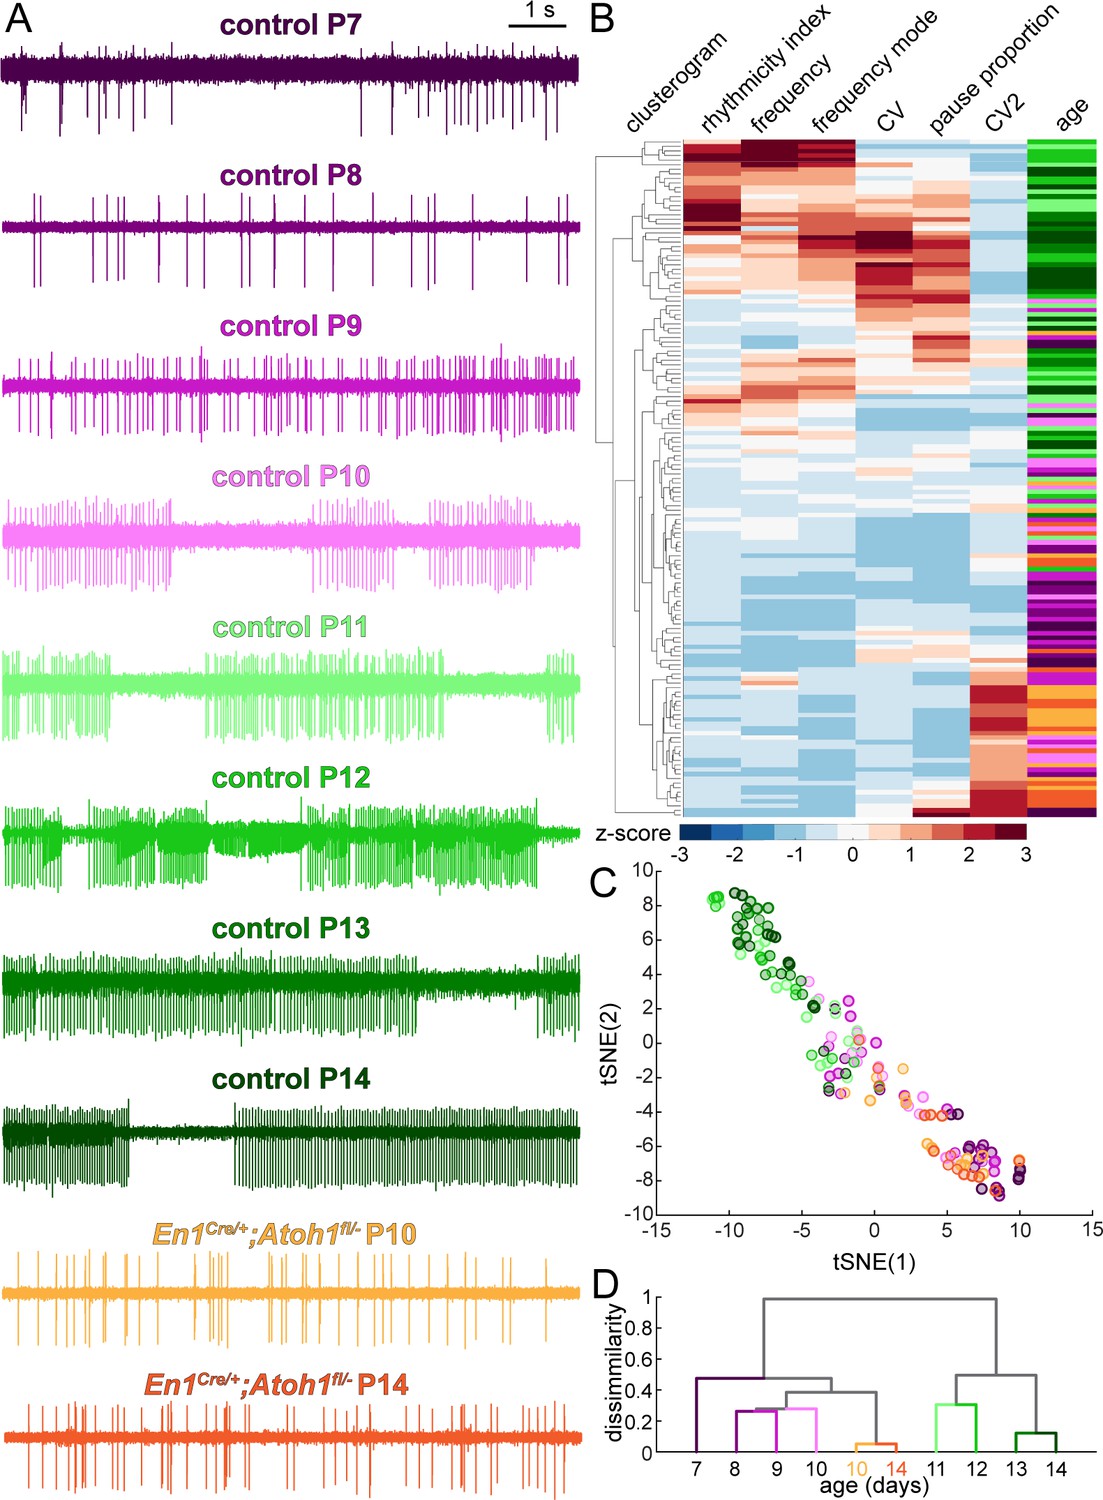
Purkinje cell simple spike firing patterns undergo a developmental transformation between P7-P10 and P11-P14 that does not occur in En1Cre/+;Atoh1fl/- mice.
(A) Representative electrophysiological recordings (each 10 s long) from Purkinje cells recorded in P7-P14 control mice and P10 and P14 En1Cre/+;Atoh1fl/- mice. In some recordings, we observed action potentials from a second cells in the background, typically observed as spikes with a smaller amplitude (for example, in the representative P12 trace). We only include the large amplitude spikes of the single predominant cell in our analysis. (B) Unbiased clusterogram based on the firing parameters summarized in Figure 5. Each row represents the Z-scored firing parameters of a single neuron. The rows were retroactively color-coded according to the colors in panel A. (C) tSNE analysis of the firing patterns summarized in Figure 5. (D) Unbiased cluster analysis on average firing patterns of Purkinje cells recorded in P7-P14 control mice and P10 and P14 En1Cre/+;Atoh1fl/- mice.
Figure 6—figure supplement 1
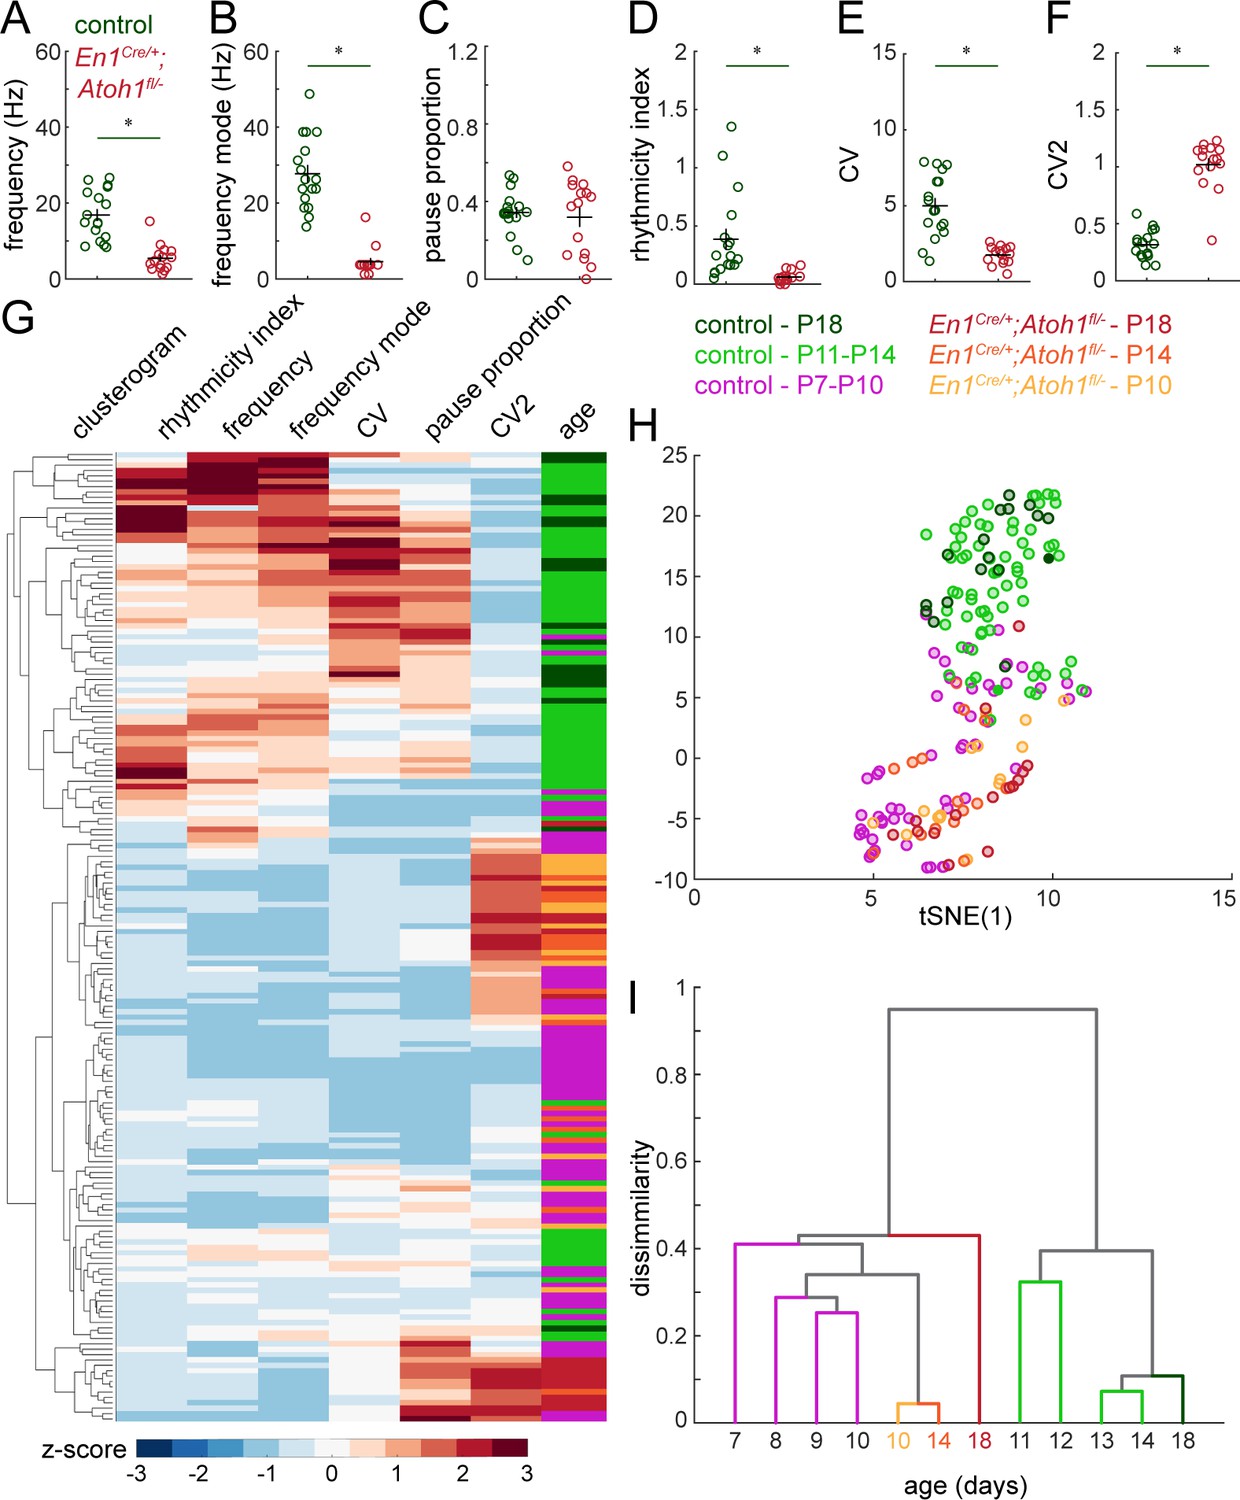
Simple spike firing properties do not normalize by P18 in En1Cre/+;Atoh1fl/- mice.
(A) Simple spike firing frequency (spikes/recording time). (B) Simple spike frequency mode (peak ISI−1 distribution). (C) Pause percentage (proportion of recording with ISI > five times average ISI). (D) Simple spike rhythmicity index calculated based on auto-correlogram. (E) Simple spike CV (global firing irregularity). (F) Simple spike CV2 (local firing irregularity). (G) Unbiased clusterogram based on the firing parameters summarized in Figure 5 and A-F. Each row represents the Z-scored firing parameters of a single neuron. The rows were retroactively color-coded according to the colors in panel of the legend. (H) tSNE analysis of the firing patterns summarized in Figure 5 and A-F. (I) Unbiased cluster analysis on average firing patterns of Purkinje cells recorded in P7-P14 and P18 control mice, and P10, P14, and P18 En1Cre/+;Atoh1fl/- mice. For A-F, significance was determined using a t-test between Purkinje cells in P18 control and En1Cre/+;Atoh1fl/- mice. Significance was accepted at p<0.05. N/n-numbers: control P18: n=17 cells from N=4 mice; En1Cre/+;Atoh1fl/- P18: n=15/N=3. The raw data and specific p-values for all the comparisons are presented in Figure 5—source data 1.
Figure 7
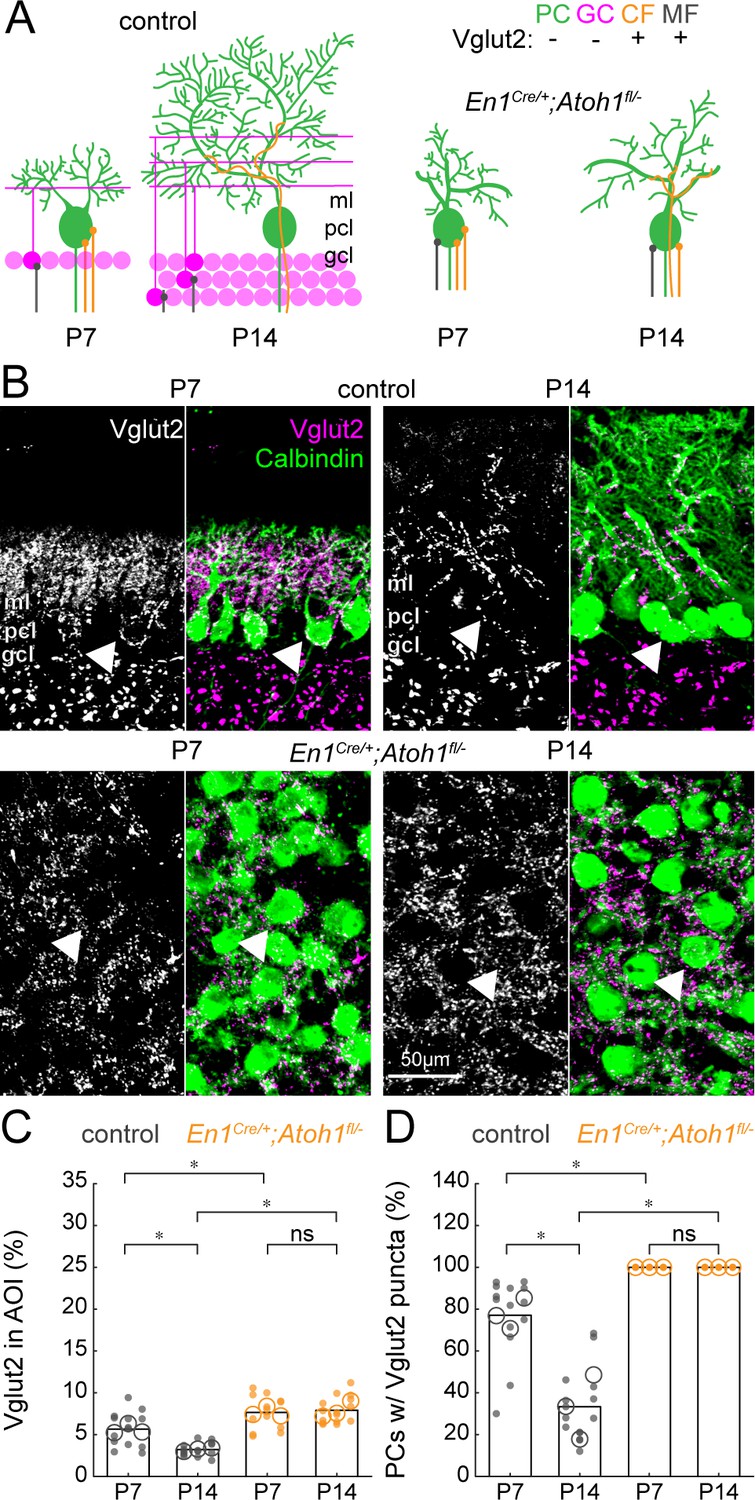
The density of Vglut2 synapses onto Purkinje cells decreases between P7 and P14 in control mice and is higher in En1Cre/+;Atoh1fl/- mutants.
(A) Schematic of Purkinje cell microcircuit in control (left) and En1Cre/+;Atoh1fl/- mice (right) at P7 and P14. Vglut2 is expressed in climbing fibers (orange) and some mossy fibers (gray) but not in Purkinje cells (green) or granule cell (pink) terminals at P14, but in some granule cells at P7 (Miyazaki et al., 2003). Abbreviations: ml = molecular layer; pcl = Purkinje cell layer; gcl = granule cell layer. (B) Representative images showing the density of Vglut2+ profiles in the cerebella of control (top) and En1Cre/+;Atoh1fl/- mice (bottom) at P7 and P14. Left panels are gray-scale images of the Vglut1 signal and right panels are merged to show the Vglut2 (pink) and Calbindin (green) signals. Arrowheads point to Purkinje cells that have direct Vglut2 synapses on their cell bodies. (C) Density of Vglut2 synapses as a percentage of the area of interest (AOI; AOI comprises the molecular and Purkinje cell layer in cerebella from control animals and the area occupied by Purkinje cells in the cerebella of En1Cre/+;Atoh1fl/- mice). (D) Number of Purkinje cells with direct Vglut2+ puncta on their cell bodies. Significance in C and D was established based on the average of each mouse (N=3 mice per genotype, large circles; n=3–5 tissue sections, small dots) using a two-way ANOVA (genotype*age) followed by a Tukey Kramer post-hoc analysis. *p=0.05. The raw data and specific p-values for all the comparisons are presented in Figure 7—source data 1.
-
Figure 7—source data 1
Source data and specific p-values for representative graphs in Figure 7.
- https://cdn.elifesciences.org/articles/68045/elife-68045-fig7-data1-v1.xlsx
Figure 8

Purkinje cell complex spike firing patterns change from P7 to P14 in control mice and are altered in P14 En1Cre/+;Atoh1fl/- mice.
(A) Schematic of in vivo Purkinje cell recordings in P7 control mouse. Top left: cerebellum with recording electrode. Top right: schematic showing the recording electrode extracellular and adjacent to the Purkinje cell body. Bottom right: representative 1 s recording from Purkinje cell, each large vertical line is an action potential. *indicates a doublet/complex spike. Bottom left: doublet indicated on the right. (B) Same as (A) For P14 control mouse. * = a complex spike. (C) Same as (A) for P14 En1Cre/+;Atoh1fl/- mouse, * is a doublet. (D) Example of a Purkinje cell recording with a classical complex spike and doublet occurring in the same cell (trace is 1 s long). Bottom are expanded views of (i) simple spike, (ii) complex spike, and (iii) doublet in top trace. The trace is an example from a Purkinje cell recording in a P14 En1Cre/+;Atoh1fl/- mouse. (E) Example of a Purkinje cell recording with a train of classical complex spikes (trace is 1 s long). Bottom are expanded views for the three complex spikes occurring in rapid succession of one another (i, ii, iii). (F) Frequency of ‘classical’ complex spikes. (G) Frequency of doublets. (H) Frequency of combined complex spikes and doublets. For F-H, significance was determined using an ANOVA between the four control age groups and two En1Cre/+;Atoh1fl/- age groups followed by a Tukey-Kramer post-hoc analysis to assess differences between the groups. Significance was accepted at p<0.05. In the figure, the statistical significance between two groups is indicated as a line starting and ending above the two groups. Gray lines indicate differences within control groups of different ages and orange lines indicate differences between control and En1Cre/+;Atoh1fl/- groups. N/n-numbers: control P7-8: n=22 cells from N=12 mice; control P9-10: n=30/N=12; control P11-12: n=35/N=11; control P13-14: n=32/N=14; En1Cre/+;Atoh1fl/- P10: n=15/N=3; En1Cre/+;Atoh1fl/- P14: n=15/N=6. The raw data and specific p-values for all the comparisons are presented in Figure 8—source data 1.
-
Figure 8—source data 1
Source data and specific p-values for representative graphs in Figure 8.
- https://cdn.elifesciences.org/articles/68045/elife-68045-fig8-data1-v1.xlsx
Figure 9
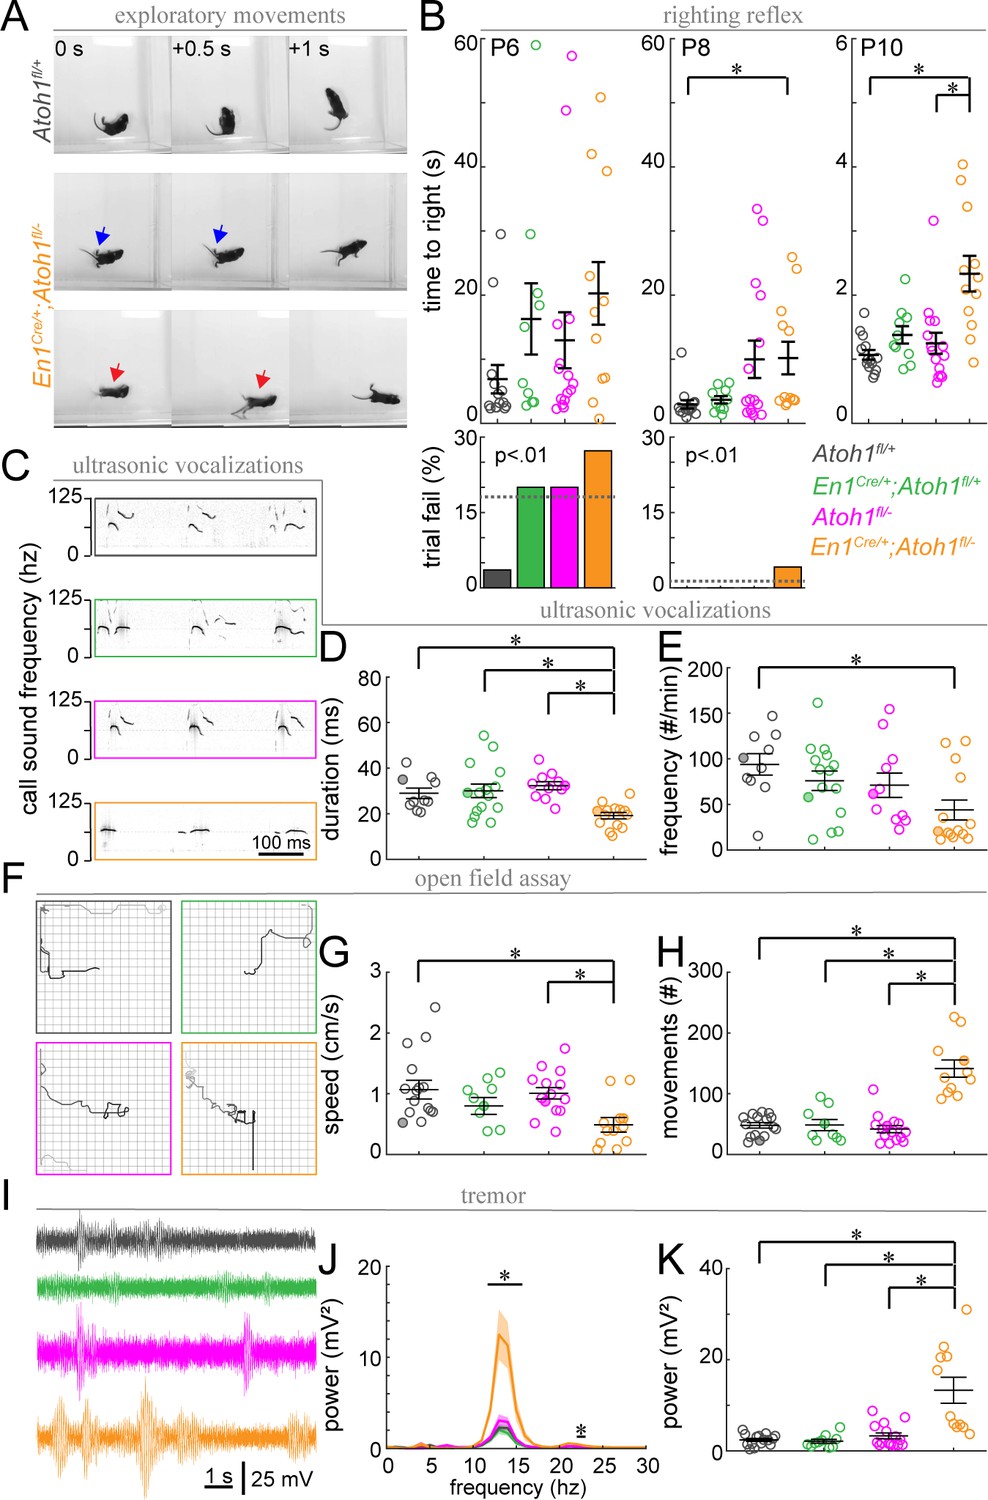
Postnatal En1Cre/+;Atoh1fl/- mice have abnormal motor coordination, enhanced tremor and altered vocalization behavior.
(A) Timed-series photos of Atoh1fl/+ (gray) and En1Cre/+;Atoh1fl/- (orange) mice. En1Cre/+;Atoh1fl/- mice have a wide stance (blue arrows) and fall on their backs (red arrows). (B) Time to right in the righting reflex of P6, P8, and P10 mice (top) and percentage of failed trials (bottom). (C) Representative ultrasonic vocalization traces with intensity of the black line representing the power of the vocalization frequency (filled circles in D and E). (D) Duration of vocalizations. (E) Frequency of vocalizations. (F) Representative tracks of mice in the open field (filled circles in G and H). Box measures 40x40 cm. (G) Movement speed. (H) Number of movements. (I) Representative power spectra of tremor recordings. (J) Tremor power at different frequencies. (K) Peak tremor power. N-numbers: Atoh1fl/+ (gray): N=10–15 mice; En1Cre/+;Atoh1fl/+ (green): N=9–15 mice; Atoh1fl/- (pink): N=11–15 mice; En1Cre/+;Atoh1fl/- (orange): N=11–14 mice. Significance was determined using a non-parametric Kruskal-Wallis test followed by a Tukey-Kramer post-hoc test. *p<0.05. The raw data and specific p-values for all the comparisons are presented in Figure 9—source data 1.
-
Figure 9—source data 1
Source data and specific p-values for representative graphs in Figure 9.
- https://cdn.elifesciences.org/articles/68045/elife-68045-fig9-data1-v1.xlsx
Videos
Video 1
En1Cre/+;Atoh1fl/- mice have a spectrum of visible motor impairments.
At P14, control mice explore the open box smoothly, whereas En1Cre/+;Atoh1fl/- mice have a visible tremor, often fall on their backs, and have dystonia-like postures and movements in their hindlimbs.
Tables
Key resources table
| Reagent type (species) or resource | Designation | Source or reference | Identifiers | Additional information |
|---|---|---|---|---|
| Antibody | Anti-Calbindin (guinea-pig polyclonal) | Synaptic Systems | RRID:AB_2619902 | IF: (1:1,000) |
| Antibody | Anti-GABARα6 (rabbit polyclonal) | Millipore Sigma | RRID:AB_91935 | IF: (1:500) |
| Antibody | Anti-Tbr2 (rabbit polyclonal) | Abcam | RRID:AB_778267 | IF: (1:500) |
| Antibody | Anti-Calretinin (mouse monoclonal) | Swant | RRID:AB_10000320 | IF: (1:500) |
| Antibody | Anti-NFH (mouse monoclonal) | Biolegend | RRID:AB_2564642 | IF: (1:1,000) |
| Antibody | Anti-HCN1 (rabbit polyclonal) | Alomone Lab | RRID:AB_2039900 | IF: (1:500) |
| Antibody | Anti-RORα (goat polyclonal) | Santa Cruz | RRID:AB_2301066 | IF: (1:250) |
| Antibody | Anti-PV (rabbit polyclonal) | Swant | RRID:AB_10000344 | IF: (1:1,000) |
| Antibody | Anti-neurogranin (rabbit polyclonal) | Millipore | RRID:AB_91937 | IF: (1:500) |
| Antibody | Anti-ZebrinII (mouse monoclonal) | Gift from Dr. Hawkes | IF: (1:500) | |
| Antibody | Anti-Vglut1 (rabbit polyclonal) | Synaptic Systems | RRID:AB_887877 | IF: (1:500) |
| Antibody | Anti-Vglut2 (rabbit polyclonal) | Synaptic Systems | RRID:AB_887883 | IF: (1:500) |
| Antibody | Anti-PLCβ4 (rabbit polyclonal) | Santa Cruz Biotechnology | RRID:AB_654082 | IF: (1:150) |
| Chemical compound, drug | WGA-Alexa 555 | Thermo Fisher Scientific | ||
| Chemical compound, drug | Fast green | Sigma-Aldrich | ||
| Chemical compound, drug | PBS | Sigma-Aldrich | ||
| Commercial assay or kit | Golgi-Cox staining kit | FD Neurotechnologies | ||
| Strain, strain background (M. musculus) | Mouse: Atoh1-FlpO | Gift from Dr. Zoghbi | van der Heijden and Zoghbi, 2018 | |
| Strain, strain background (M. musculus) | Mouse: Rosa-FSF-LSL-tdTomato (Ai65(RCFL-tdT), Gt(ROSA)26Sortm65.1(CAG-tdTomato)Hze) | The Jackson Laboratory | RRID:IMSR_JAX:021875 | |
| Strain, strain background (M. musculus) | Mouse: En1-Cre (En1tm2(cre)Wrst/J) | The Jackson Laboratory | RRID:IMSR_JAX:007916 | |
| Strain, strain background (M. musculus) | Mouse: Atoh1-Flox (Atoh1tm3Hzo) | The Jackson Laboratory | RRID:MGI:4420944 | |
| Software, algorithm | MATLAB | MathWorks | RRID:SCR_001622 | |
| Software, algorithm | ImageJ | National Institutes of Health | RRID:SCR_003070 | |
| Software, algorithm | Photoshop | Adobe | RRID:SCR_014199 | |
| Software, algorithm | Illustrator | Adobe | RRID:SCR_010279 | |
| Software, algorithm | Spike2 | CED | RRID:SCR_010279 | |
| Other | Tungsten electrodes | Thomas Recording | ||
| Other | VetBond | 3M |
Additional files
Download links
A two-part list of links to download the article, or parts of the article, in various formats.
Downloads (link to download the article as PDF)
Open citations (links to open the citations from this article in various online reference manager services)
Cite this article (links to download the citations from this article in formats compatible with various reference manager tools)
Maturation of Purkinje cell firing properties relies on neurogenesis of excitatory neurons
eLife 10:e68045.
https://doi.org/10.7554/eLife.68045


