Functional development of a V3/glycan-specific broadly neutralizing antibody isolated from a case of HIV superinfection
- Division of Human Biology, Fred Hutchinson Cancer Research Center, United States
- Department of Medicinal Chemistry, University of Washington, United States
- Division of Basic Sciences, Fred Hutchinson Cancer Research Center, United States
- Division of Public Health Sciences, Fred Hutchinson Cancer Research Center, United States
- Coast Provincial General Hospital, Women’s Health Project, Kenya
- Department of Genome Sciences, University of Washington, United States
- Howard Hughes Medical Institute, United States
Figures
Figure 1 with 4 supplements
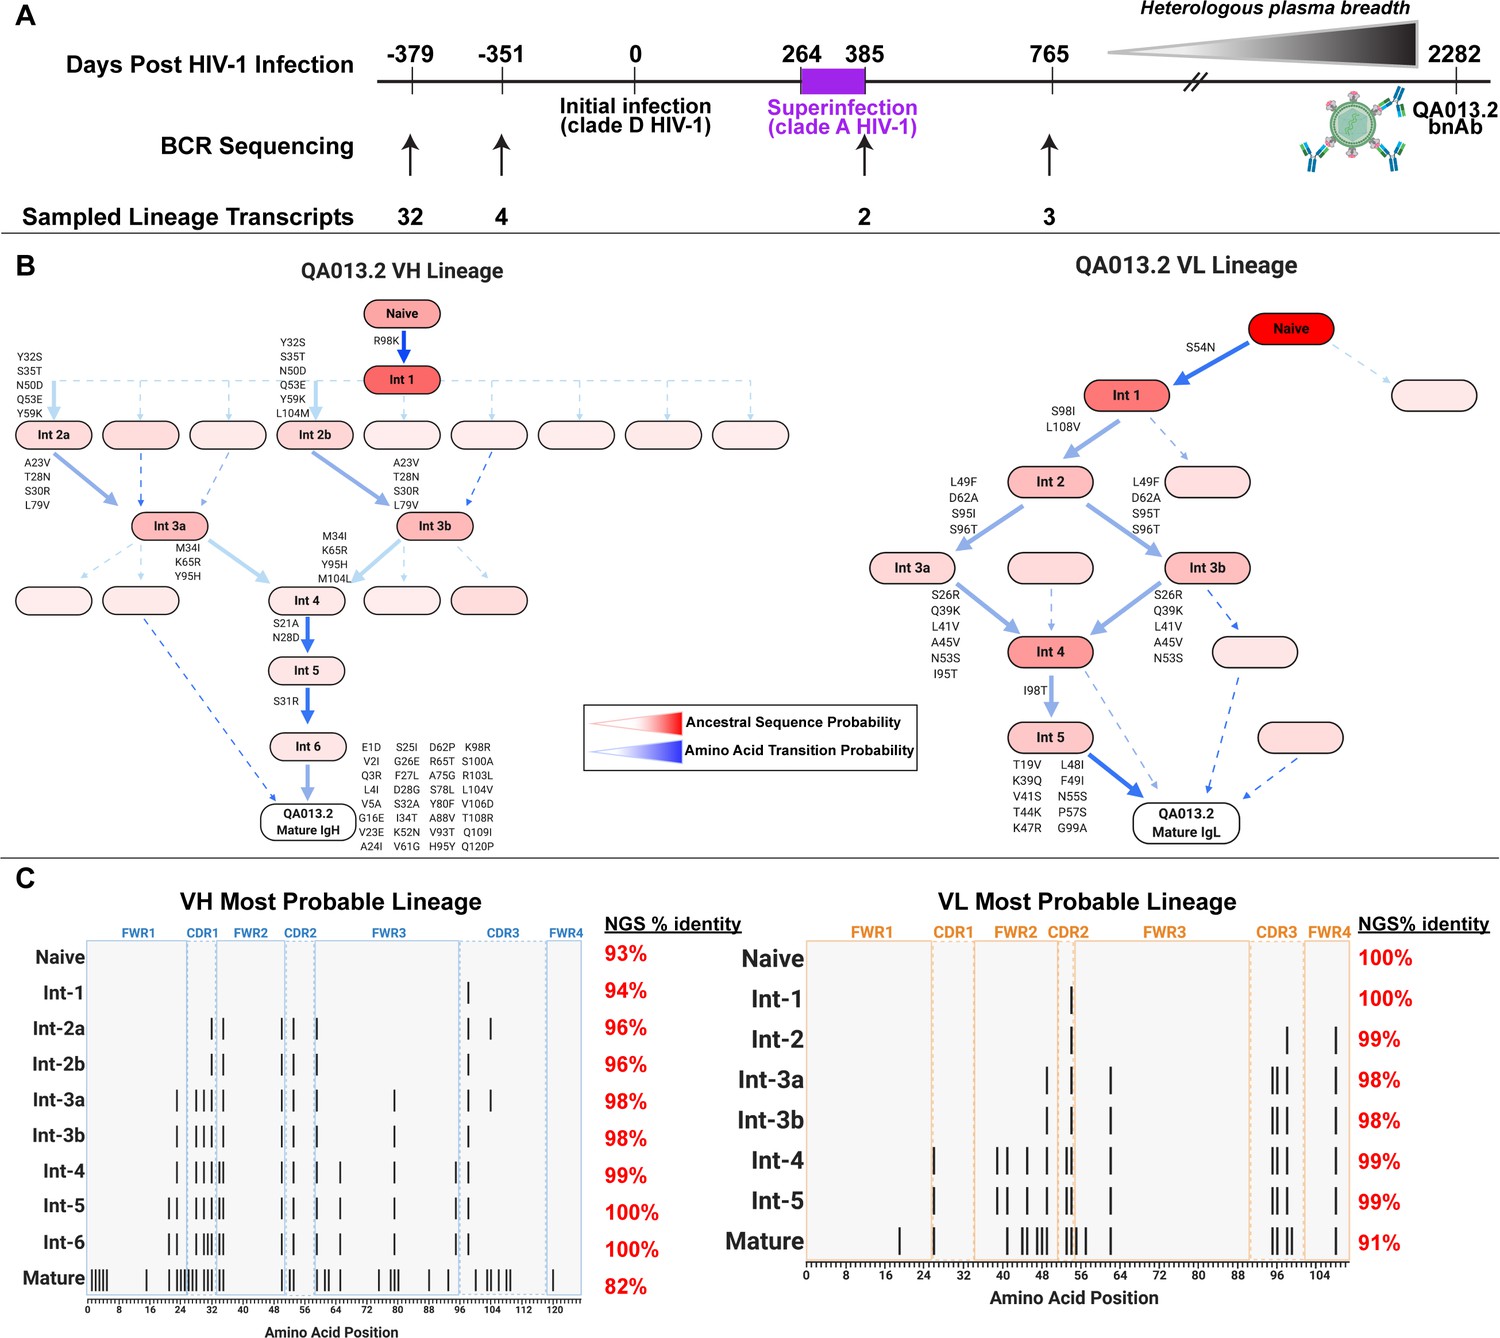
QA013.2 inferred clonal lineage development.
(A) Timeline of HIV infection, isolation of QA013.2 bnAb, and longitudinal PBMC samples used for antibody variable region sequencing. Days post initial HIV infection are listed above the timeline and black arrows below the timeline correspond to the specific PBMC samples that were used for deep sequencing. Approximate heterologous plasma breadth as determined previously (Cortez et al., 2012) is depicted above the timeline, which is not to scale. Estimated timing of superinfection as previously described (Chohan et al., 2005) is shown in purple on the timeline, with the timing of superinfection estimated as the midpoint, 324.5 days post initial infection. The QA013.2 bnAb was not isolated until 2282 days, or about 6.2 years post initial infection, as indicated. (B) Lineage graphics representing probable developmental paths for heavy and light chain lineages between inferred naïve BCR and mature QA013.2 sequences. Nodes represent inferred ancestral sequences, while arrows in between each node represent amino acid transitions. The red shading of nodes is proportional to the posterior probability that this ancestral sequence was present in the true lineage. For each given node, the blue shading of arrows arising from that node is proportional to the corresponding transition probability. Low probability nodes were filtered out, resulting in some incomplete pathways within the graphics. Dashed arrows indicate possible developmental paths that were not chosen based on low probability. See Figure 1—figure supplements 1–4. (C) Probable lineage sequences for the developing QA013.2 heavy (blue) and light chains (orange) are displayed in their inferred chronological order. With respect to the inferred naive sequence at the top of each lineage, variable region amino acid substitutions are indicated by black lines. Dashed lines demarcate the CDRs that are flanked by FWRs. Red percentages to the right of each sequence represent the nucleotide identity of each computationally inferred lineage member to sampled NGS sequences present in the longitudinal B cell repertoire of QA013, rounded to the nearest percent. See also Supplementary files 1 and 2 for fasta files of computationally inferred lineage members and sampled NGS sequences with high nucleotide identity to inferred lineage members.
Figure 1—figure supplement 1

Phylogenetic relationship of sampled QA013.2 heavy and light chain clonal family sequences from four longitudinal PBMC samples.
(A) Maximum-likelihood (ML) tree of the 42 sampled clonal family sequences for QA013.2 heavy chain colored by NGS timepoint. (B) ML tree of the pruned clonal family containing 100 sequences for QA013.2 light chain colored by NGS timepoint. Nodes on each tree represent ancestral sequences that have been computationally inferred using the tool linearham (https://github.com/matsengrp/linearham) (Dhar et al., 2020). ML clonal family trees were visualized using Olmsted (https://github.com/matsengrp/olmsted), Ralph, 2021b. Tree branch width depicts the local branching index (lbi) (Neher et al., 2014). The x-axis depicts the number of nucleotide substitutions per site relative to the inferred naïve BCR for each antibody chain.
Figure 1—figure supplement 2
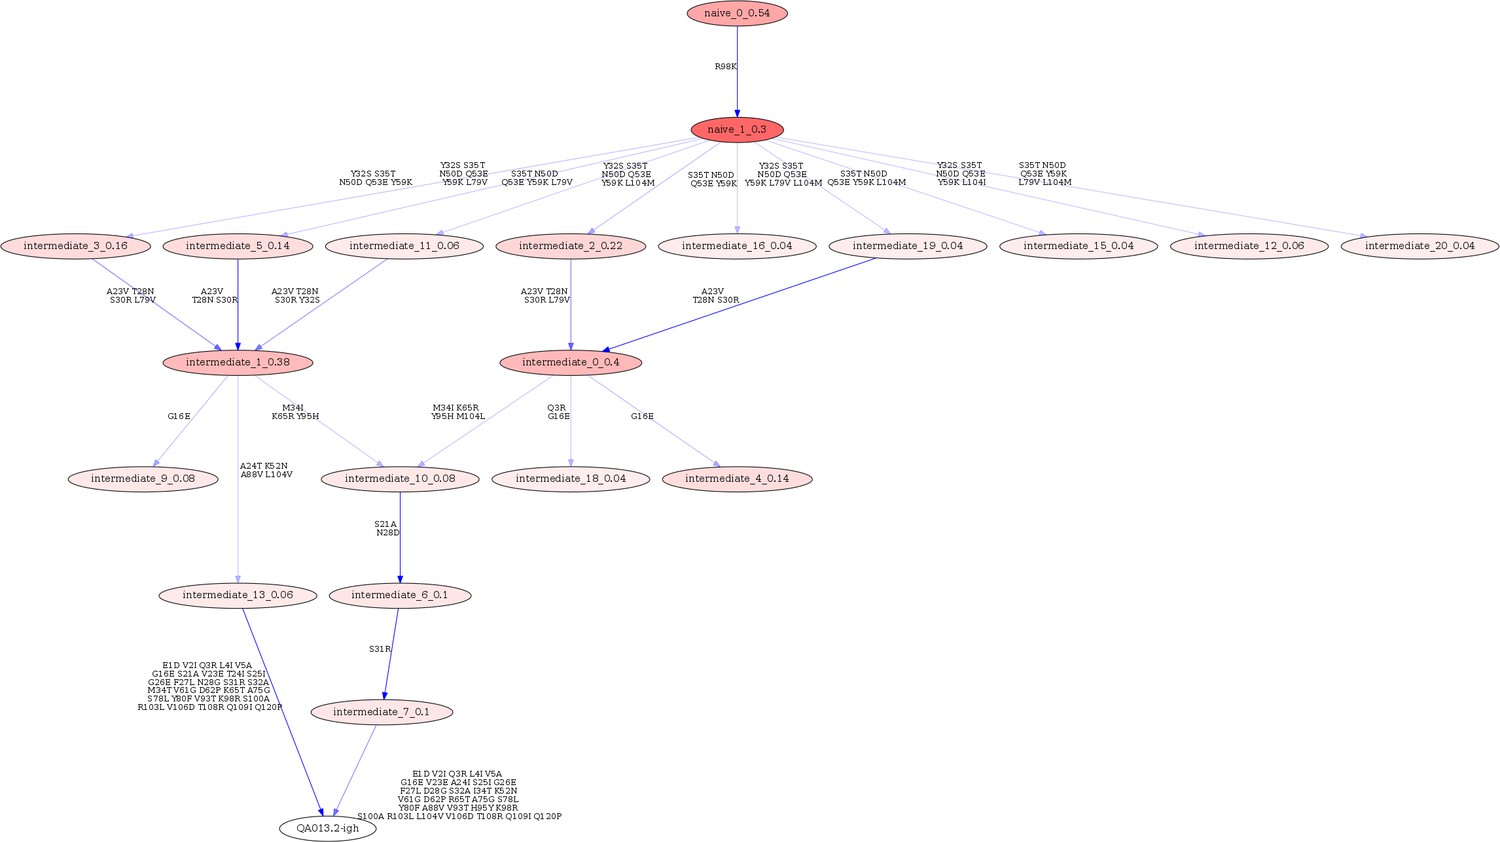
Linearham lineage trajectory graphics of QA013.2 VH inferred lineage members from inferred naive antibody sequence to mature.
Nodes represent inferred ancestral sequences, while arrows in between each node represent amino acid transitions. The red shading of nodes is proportional to the posterior probability that this ancestral sequence was present in the true lineage, and these probability values are listed in each node following each inferred intermediate (i.e. intermediate_x_probability). The VH lineage was analyzed using 0.04 probability cutoff such that any edge with probability less than this threshold was discarded. Since low probability nodes were filtered out, there are some incomplete pathways within the graphics. For each given node, the blue shading of arrows arising from that node is proportional to the posterior probability of the associated amino acid sequence transition. Lineage members have been renamed for clarity in the main text and numbers listed here do not correspond with those in the main text. Refer to Figure 1 for lineage intermediate numbering scheme.
Figure 1—figure supplement 3
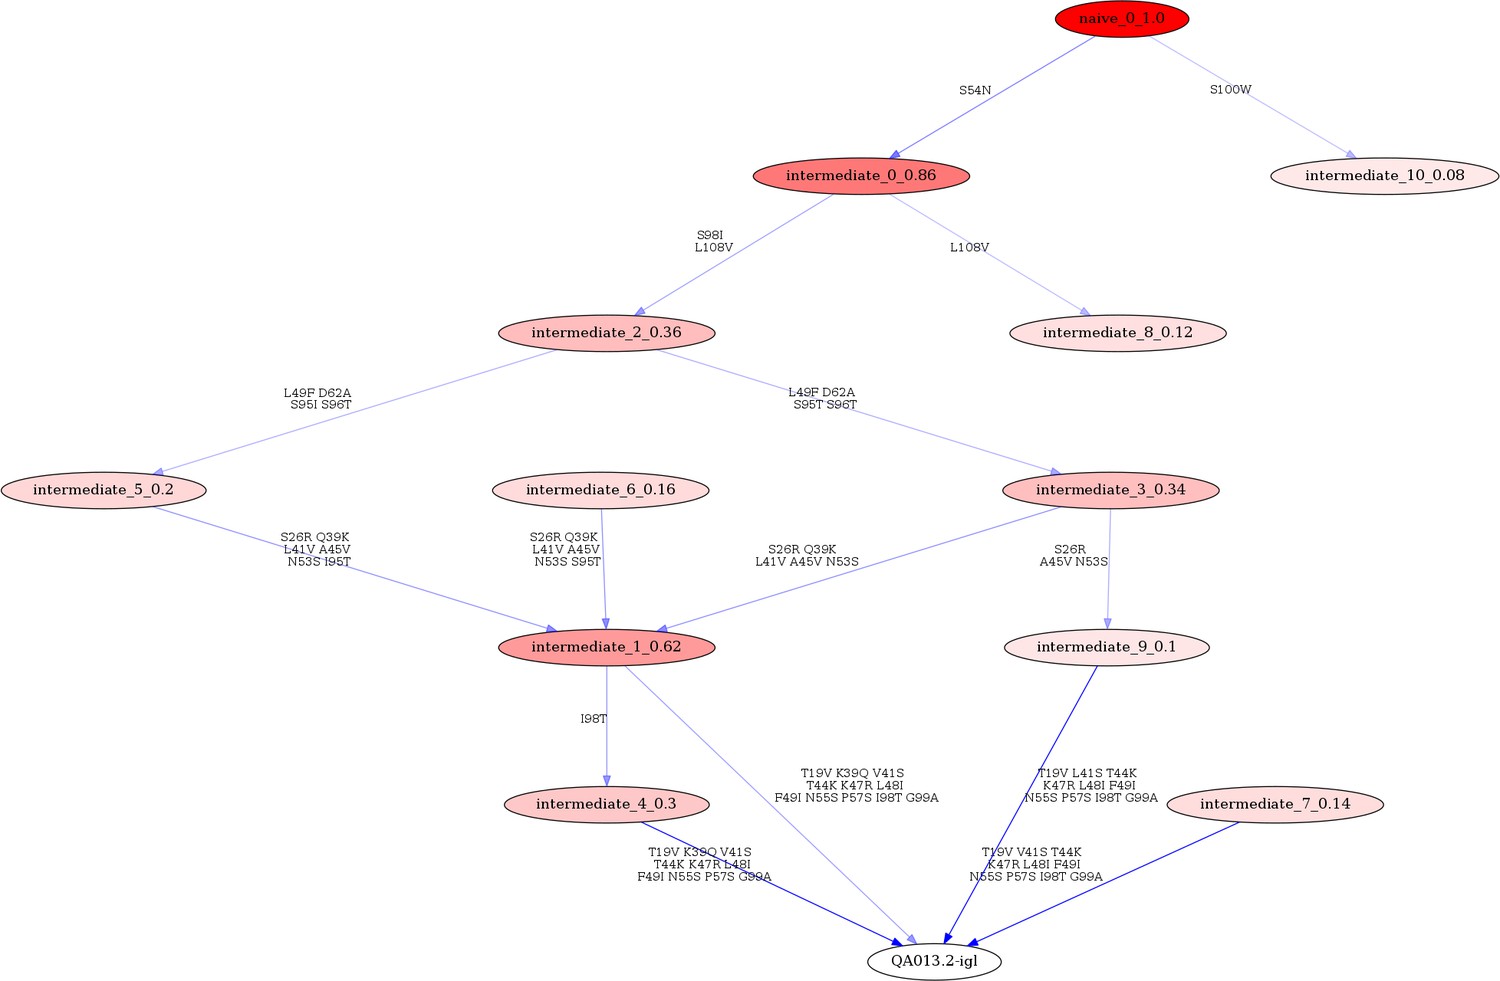
Linearham lineage trajectory graphics of QA013.2 VL inferred lineage members from inferred naive antibody sequence to mature.
Nodes represent inferred ancestral sequences, while arrows in between each node represent amino acid transitions. The red shading of nodes is proportional to the posterior probability that this ancestral sequence was present in the true lineage, and these probability values are listed in each node following each inferred intermediate (i.e. intermediate_x_probability). The VL lineage was analyzed using 0.08 probability cutoff such that any edge with probability less than this threshold was discarded. Since low probability nodes were filtered out, there are some incomplete pathways within the graphics. For each given node, the blue shading of arrows arising from that node is proportional to the posterior probability of the associated amino acid sequence transition. Lineage members have been renamed for clarity in the main text and numbers listed here do not correspond with those in the main text. Refer to Figure 1 for lineage intermediate numbering scheme.
Figure 1—figure supplement 4
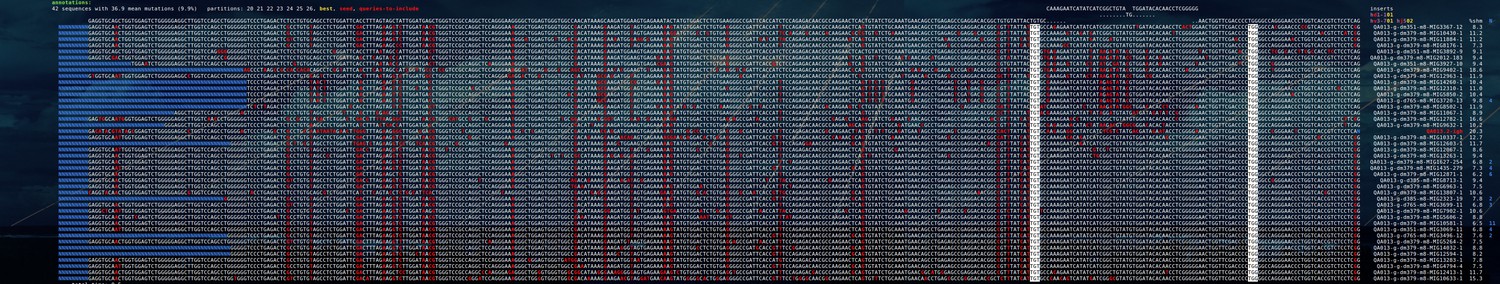
Partis clonal family cluster for QA013.2 clonal family containing VH sequences sampled from QA013 over four longitudinal timepoints.
Partis software was run on the aggregated IgG NGS dataset from QA013 using the ‘seeded’ method (see Materials and methods section) where QA013.2 variable heavy (VH) chain was the seed sequence of interest. These clonal family clustering data demonstrate shared mutations of sampled VH sequences from pre-HIV infection (dm379 and dm351) with the QA013.2 mature bnAb VH sequence. The red nucleotides represent mutated bases relative to the inferred naïve BCR, with germline sequences listed at the top of the alignment.
Figure 2 with 1 supplement
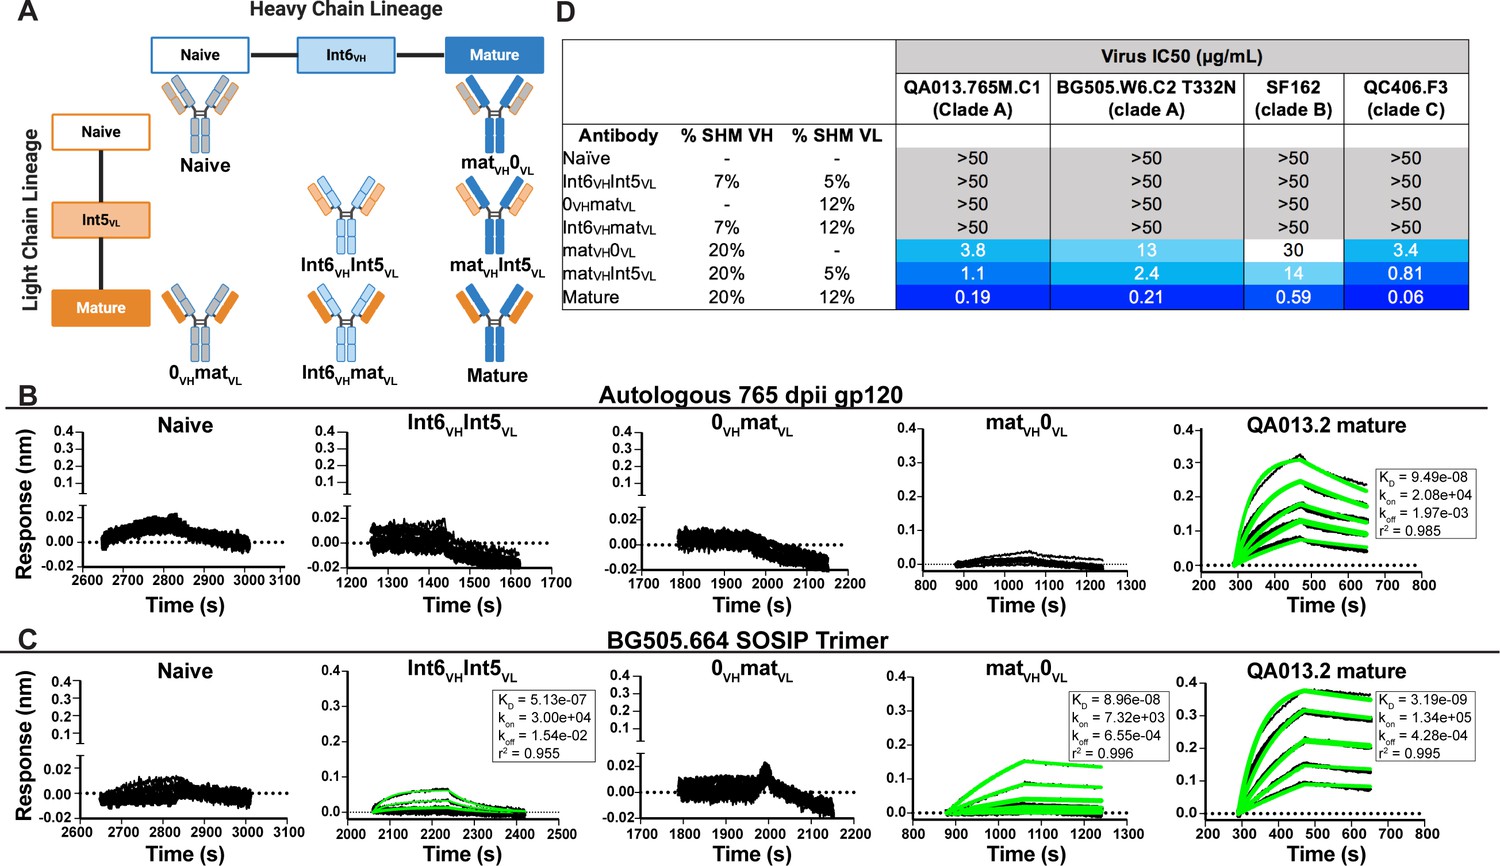
Binding and neutralization analyses of QA013.2 inferred VH and VL antibody chains demonstrates that heavy chain maturation is critical for bnAb function.
(A) Schematic depicting antibody chain pairings of inferred lineage member heavy (blue) and light chains (orange) with one another. (B,C) Biolayer interferometry (BLI) analysis of QA013.2 inferred lineage mAbs at 10 µg mL−1 binding to (B) the Env-gp120 monomer from a clade A autologous superinfecting virus variant from 765 dpii (QA013.765M.C1, 2 µM) and (C) the heterologous clade A Env trimer (BG505.SOSIP.664, 500 nM). All BLI curves were subjected to double reference background subtraction and data were fit to a global model of 1:1 ligand:analyte binding to obtain KD, kon, and kdis values. The resulting lines of best fit are shown in green. Dotted line across the graphs marks 0.00 on the y-axis. All data are representative of at least two independent experiments. (D) QA013.2 inferred lineage mAb neutralization of autologous and heterologous pseudoviruses as measured by the TZM-bl assay. The half maximal inhibitory concentration (IC50) for each tested pseudovirus is shown in a row across the top of the table. Darker blue indicates more potent neutralization, while white demonstrates weak neutralization, and grey represents no neutralization observed at the highest antibody concentration tested. Simian immunodeficiency virus (SIV) was used as a negative control; none of the tested mAbs showed evidence of SIV neutralization (data not shown). IC50 values are the average of at least two independent replicates. See Figure 2—figure supplement 1, Figure 2—source data 2, Figure 2—source data 3 and Figure 2—source data 1.
-
Figure 2—source data 1
Biolayer Interferometry Source Data 1.
- https://cdn.elifesciences.org/articles/68110/elife-68110-fig2-data1-v2.pzfx.zip
-
Figure 2—source data 2
Biolayer Interferometry Source Data 2.
- https://cdn.elifesciences.org/articles/68110/elife-68110-fig2-data2-v2.zip
-
Figure 2—source data 3
Neutralization Source Data.
- https://cdn.elifesciences.org/articles/68110/elife-68110-fig2-data3-v2.xlsx
Figure 2—figure supplement 1

QA013.2 inferred naïve BCR binding to initial infecting virus Env-gp120 monomer.
Biolayer interferometry kinetic curve of inferred naïve antibody (10 µg mL−1) bound to autologous clade D Env-gp120 monomer from the initial virus (2 µM). BLI curves were subjected to double reference background subtraction and data were fit to a global model of 1:1 ligand:analyte binding to obtain KD, kon, and kdis values. Dotted line across the graph marks 0.00 on the y-axis. Data are representative of two independent experiments.
-
Figure 2—figure supplement 1—source data 1
Biolayer Interferometry Source Data 1.
- https://cdn.elifesciences.org/articles/68110/elife-68110-fig2-figsupp1-data1-v2.pzfx.zip
-
Figure 2—figure supplement 1—source data 2
Biolayer Interferometry Source Data 2.
- https://cdn.elifesciences.org/articles/68110/elife-68110-fig2-figsupp1-data2-v2.zip
Figure 3 with 2 supplements
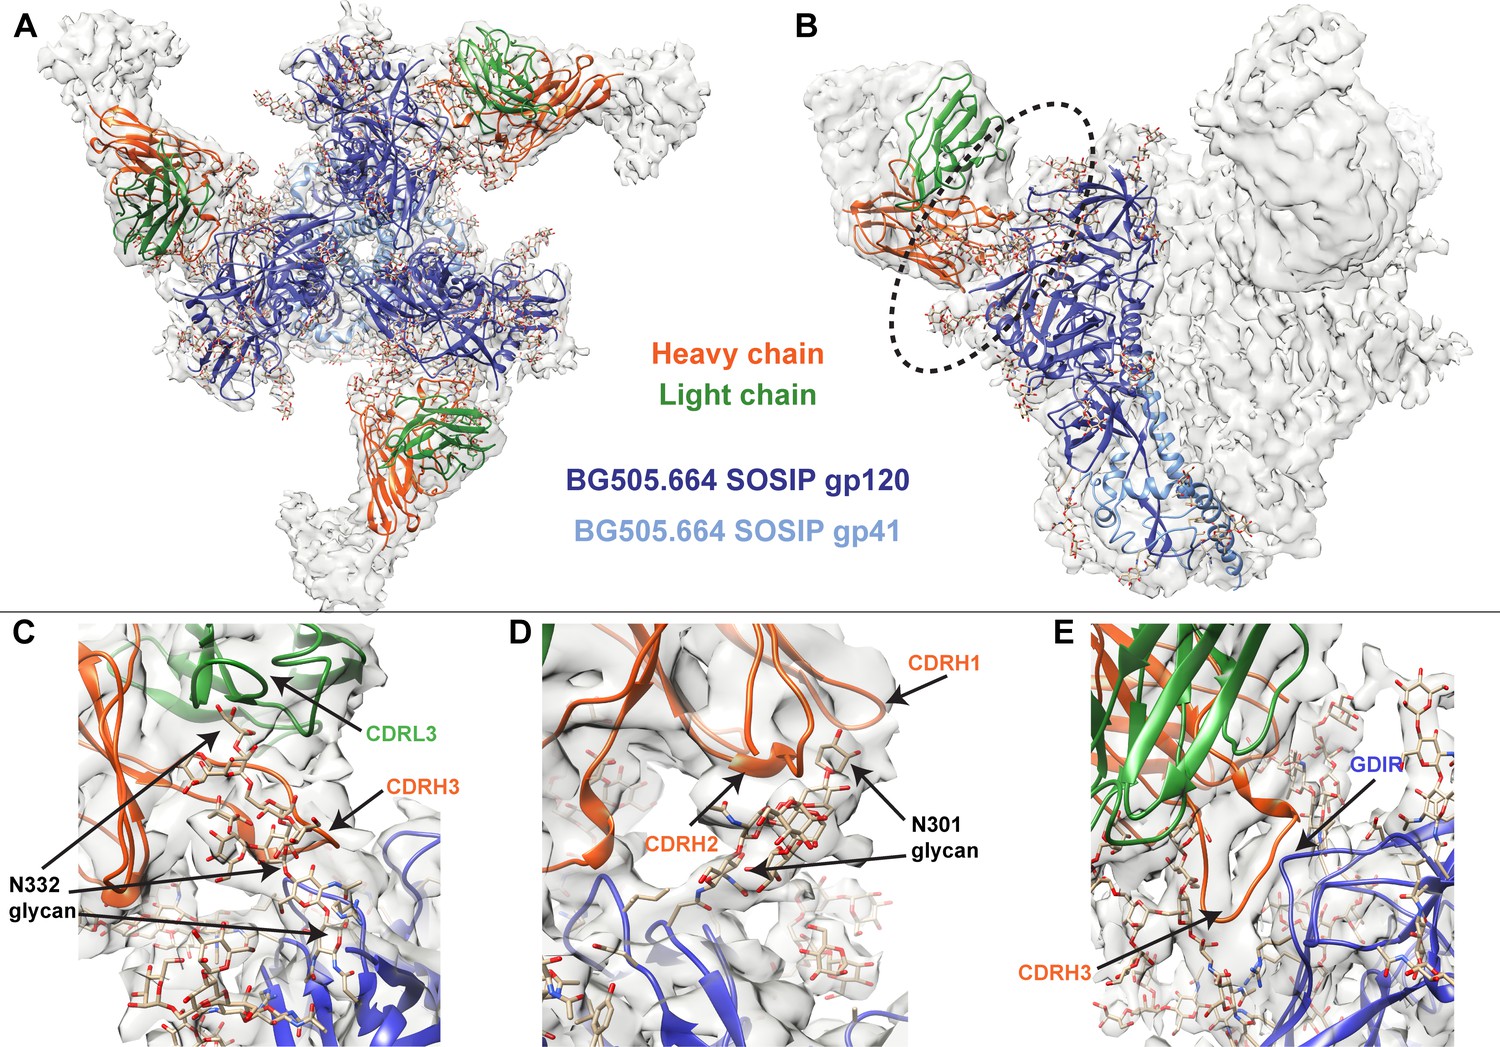
Cryo-EM structure of QA013.2 Fab bound to BG505.SOSIP.664 trimer.
(A) Cryo-EM reconstruction of QA013.2 Fab bound to BG505.SOSIP.664 trimer. Gp120 chains are shown in dark blue, gp41 in light blue, Fab heavy chain in orange, and Fab light chain in green. (B) Side-view of cryo-EM reconstruction with a single copy of the PDB model shown. The black oval indicates the region of interaction between QA013.2 Fab and HIV BG505 gp120 that is enlarged and highlighted in detail in panels C-E. (C) N332 glycan interaction with CDRL3 and CDRH3. (D) N301 glycan interaction with CDRH1 and CDRH2. (E) Heavy chain CDR3 interacts with the linear GDIR motif of gp120. See also Figure 3—figure supplements 1 and 2 and Figure 3—source data 1.
-
Figure 3—source data 1
BG505.SOSIP + QA013.2 Fab cryo-EM data collection, refinement parameters, and model statistics.
- https://cdn.elifesciences.org/articles/68110/elife-68110-fig3-data1-v2.xlsx
-
Figure 3—source data 2
BG505.SOSIP + QA013.2 Fab cryo-EM map and coordinates.
- https://cdn.elifesciences.org/articles/68110/elife-68110-fig3-data2-v2.zip
Figure 3—figure supplement 1
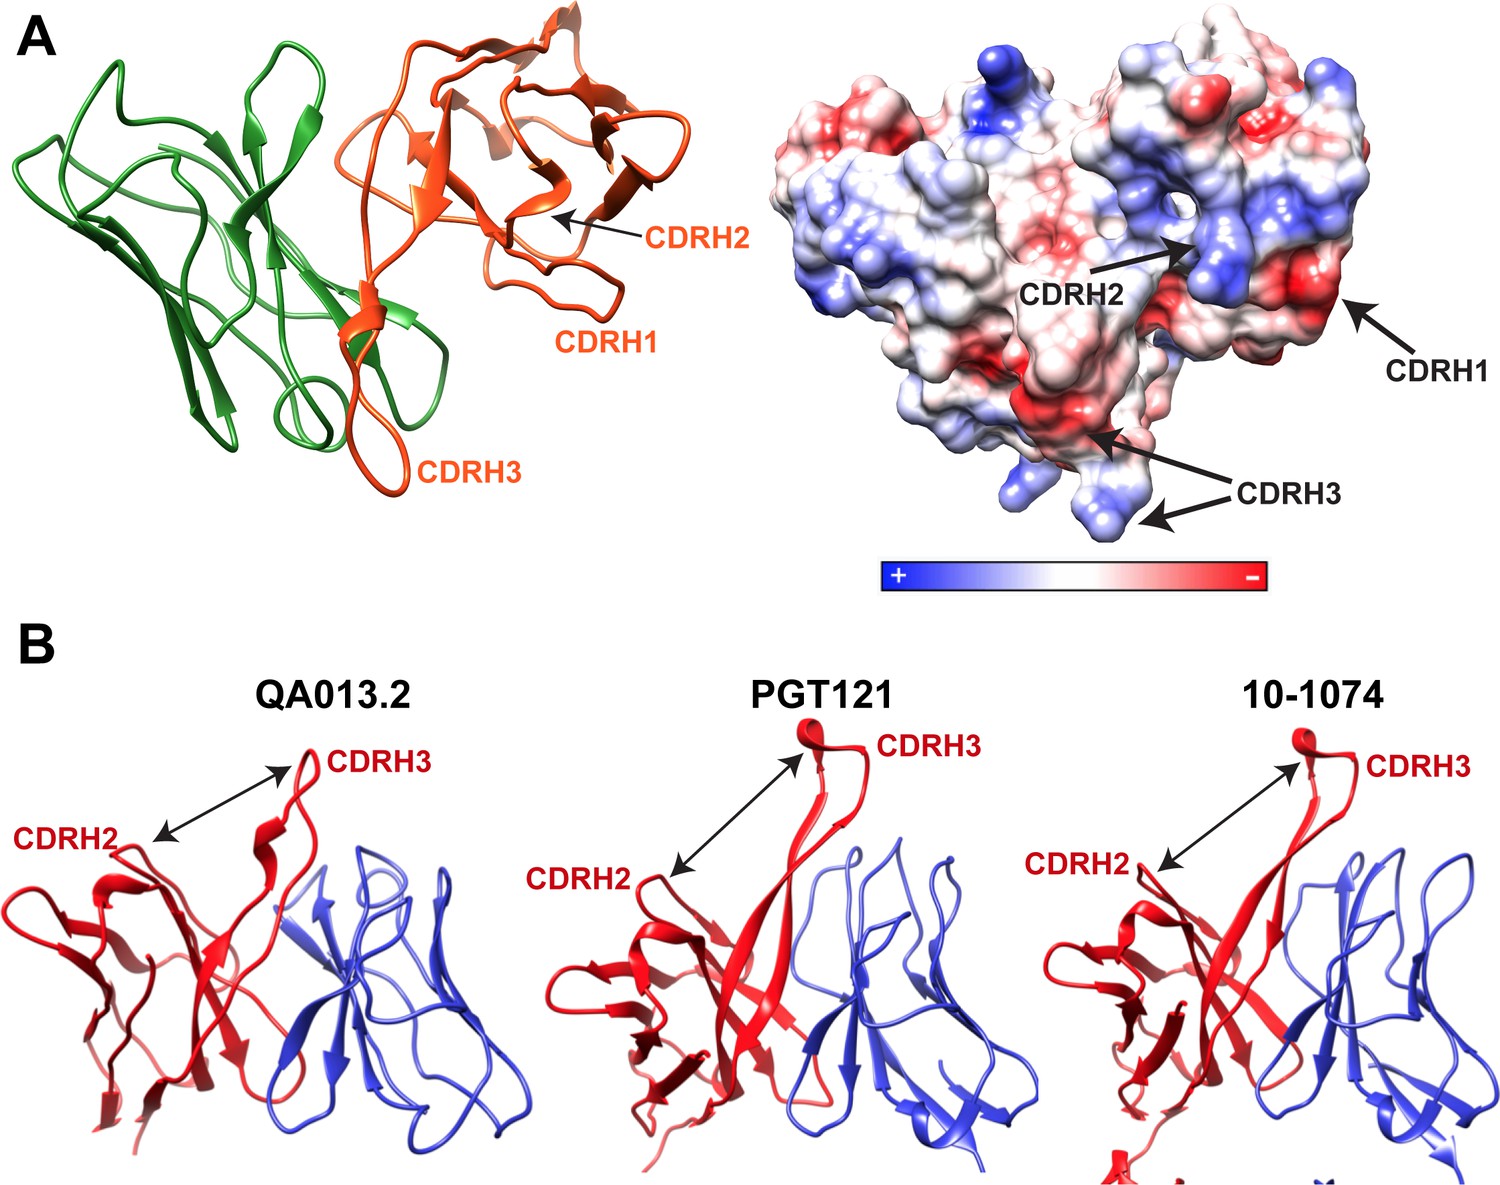
Cryo-EM features of QA013.2 Fab heavy chain.
(A) Left: Ribbon diagram of Fab QA013.2. Light chain in green and heavy chain in orange. Right: Electrostatic coulombic surface coloring of QA013.2 Fab. Red areas indicate negative charge, blue areas indicate positive charge and white areas indicate non-polar regions. (B) QA013.2 Fab exhibits common quaternary architecture to other V3/glycan-specific bNAbs. Ribbon diagram of QA013.2 Fab model, crystal structure of Fab PGT121(PDB ID: 4FQ1), and crystal structure of Fab 10–1074 (PDB ID: 4FQ2). Heavy chains are colored in red and light chains in blue. Cleft formed between CDRH3 and the remainder of Fab heavy chain domain due to tilting toward the light chain is indicated by a black arrow (Mouquet et al., 2012).
Figure 3—figure supplement 2

Fourier Shell Correlation curves.
Lines representing correlation corrected (black), masked (blue), unmasked (green), and phase randomized (red) Fourier Shell correlation curve maps. Dashed line represents the ‘gold-standard’ FSC cutoff of 0.143.
Figure 4
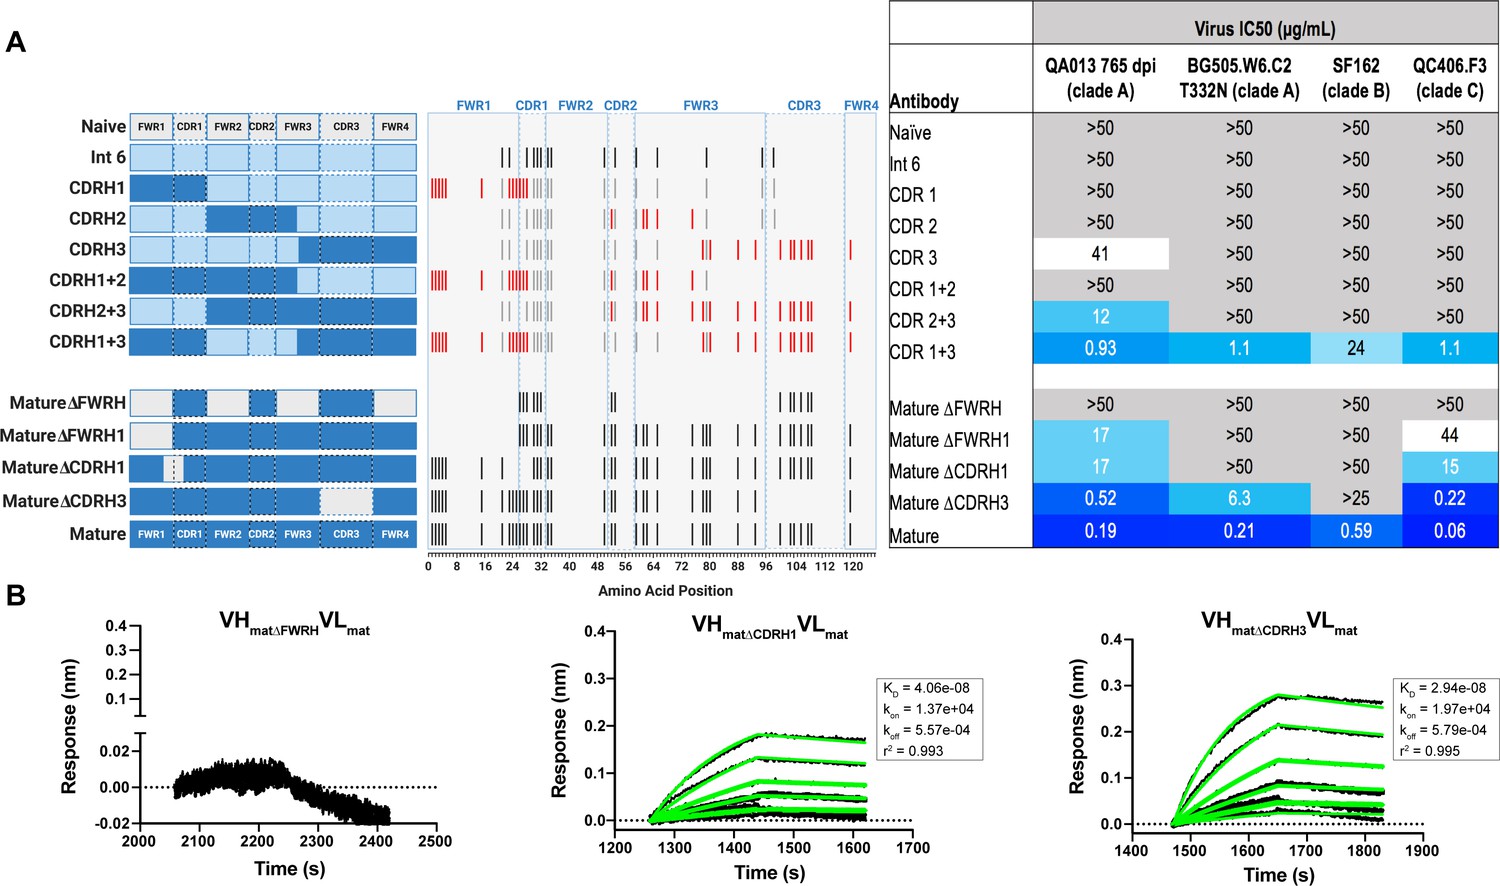
Interrogating the QA013.2 heavy chain paratope through binding and neutralization studies using chimeric antibodies.
(A) Schematic of heavy chain chimeras that were generated and paired with the mature light chain. Names of each heavy chain variant are listed on the left, with colored bars representing the VH region including FWR and CDR loops colored by lineage member to visualize how each variant was generated. Inferred naïve heavy chain is represented in grey, latest inferred heavy chain intermediate (Int6VH) is shown in light blue, and the mature heavy chain is shown in dark blue. The middle plot shows the individual mutations represented as black lines across VH relative to the inferred naïve BCR, with CDRs demarcated by dashed lines. Red lines represent all mutations added to the Int6VH template. Neutralization table on the far right shows the average IC50 values for each tested chimeric antibody across a panel of pseudoviruses shown at the top. Characteristics of the neutralization table are consistent with those listed in the Figure 2 legend. (B) Biolayer interferometry kinetic curves of a select subset of tested antibody variants (10 µg mL−1 against heterologous trimer - BG505.SOSIP.664 at 500 nM). BLI curves were analyzed as described in the Figure 2 legend. See Figure 4—source data 1, Figure 4—source data 2 and Figure 4—source data 3. See also Supplementary file 3 for fasta file of all chimeric and mutant VH and VL antibody chains used in Figures 4, 5, 6.
-
Figure 4—source data 1
Biolayer Interferometry Source Data 1.
- https://cdn.elifesciences.org/articles/68110/elife-68110-fig4-data1-v2.pzfx.zip
-
Figure 4—source data 2
Biolayer Interferometry Source Data 2.
- https://cdn.elifesciences.org/articles/68110/elife-68110-fig4-data2-v2.zip
-
Figure 4—source data 3
Neutralization Source Data.
- https://cdn.elifesciences.org/articles/68110/elife-68110-fig4-data3-v2.xlsx
Figure 5
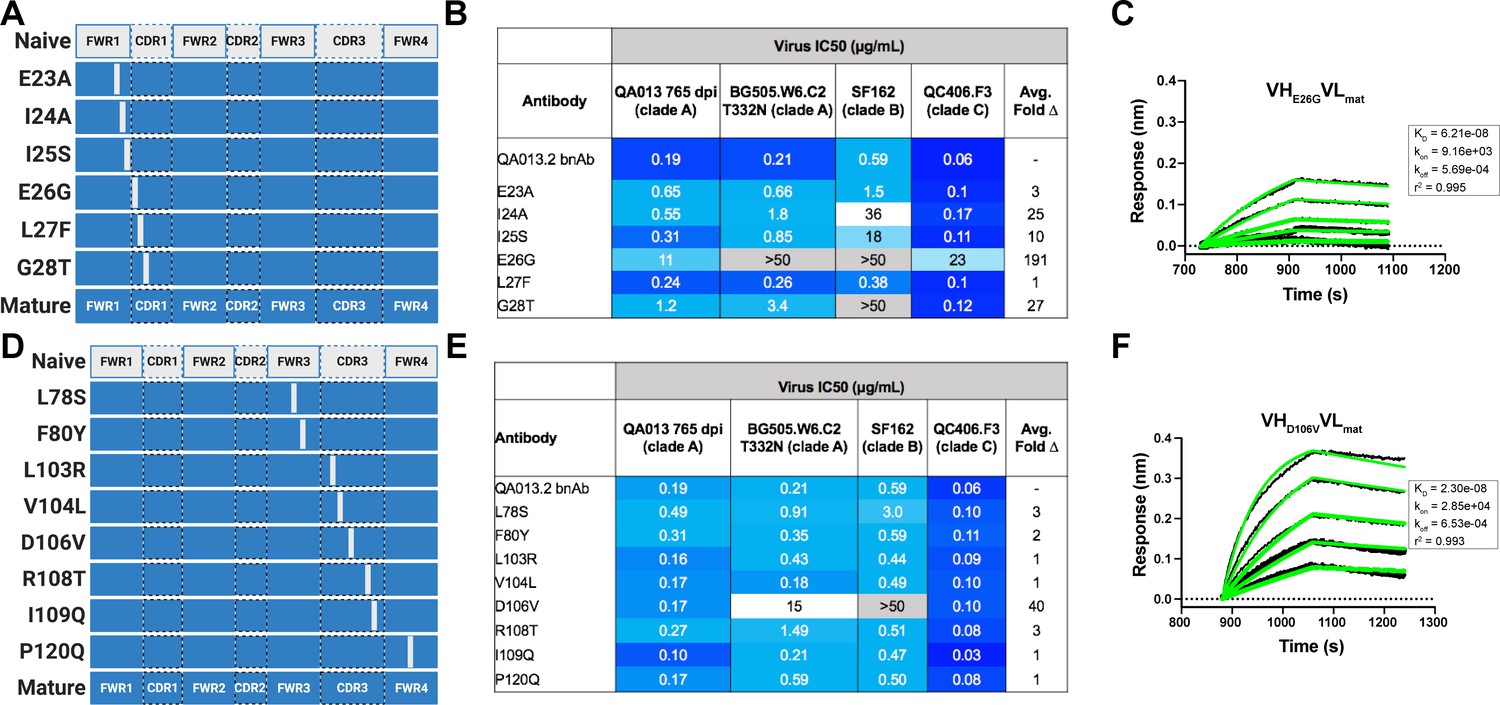
Binding and neutralization of VH point mutant antibodies demonstrates that residues spanning FWRH1-CDRH1 are essential for conferring bnAb neutralization breadth.
Schematic of heavy chain point mutants generated in (A) FWRH1-CDRH1 that were paired with the mature light chain. Names of each heavy chain point mutant are listed on the left, with colored bars representing the VH region including FWR and CDR loops (dashed lines) colored by lineage member to visualize how each point mutant was generated. Inferred naive heavy chain is represented in gray and the mature heavy chain is shown in dark blue. (B) FWRH1-CDRH1 point mutant neutralization of a subset of autologous and heterologous pseudoviruses as measured by the TZM-bl assay. IC50 values of each antibody are shown for each pseudovirus column, where darker blue indicates more potent neutralization and grey indicates no neutralization was observed at the highest antibody concentration tested. Average fold change in IC50 for a particular point mutant relative to the mature bnAb across all pseudoviruses is reported as a final column on the right. (C) BLI kinetic curve of a selected FWRH1-CDRH1 point mutant antibody E26G at 10 µg mL−1 against heterologous trimer (BG505.SOSIP.664 at 500 nM). (D) Schematic of CDRH3 mutants that were paired with the mature light chain. (E) CDRH3 point mutant neutralization of a subset of autologous and heterologous pseudoviruses as measured and displayed in panel B. (F) BLI kinetic curve of a selected CDRH3 point mutant antibody D106V at 10 µg mL−1 against heterologous trimer (BG505.SOSIP.664 at 500 nM). BLI curves were analyzed as described in the Figure 2 legend. See Figure 5—source data 1, Figure 5—source data 2 and Figure 5—source data 3.See also Supplementary file 3 for fasta file of all chimeric and mutant VH and VL antibody chains used in Figures 4, 5, 6.
-
Figure 5—source data 1
Biolayer Interferometry Source Data 1.
- https://cdn.elifesciences.org/articles/68110/elife-68110-fig5-data1-v2.pzfx.zip
-
Figure 5—source data 2
Biolayer Interferometry Source Data 2.
- https://cdn.elifesciences.org/articles/68110/elife-68110-fig5-data2-v2.zip
-
Figure 5—source data 3
Neutralization Source Data.
- https://cdn.elifesciences.org/articles/68110/elife-68110-fig5-data3-v2.xlsx
Figure 6

Construction of chimeric VL antibodies to investigate the contribution of QA013.2 light chain to bnAb breadth and potency.
(A) Schematic of light chain intermediates that were generated and paired with the mature heavy chain. Names of each light chain intermediate are listed on the left, with colored bars representing the VL region including FWR and CDR loops (dashed lines) colored by lineage member to visualize how each variant was generated. Inferred naïve light chain is represented in gray, latest inferred light chain intermediate (Int5VL) is shown in light orange, and the mature light chain is shown in dark orange. The plot in the middle shows the individual mutations across VL relative to the inferred naïve BCR, with FWR regions flanking CDR loops that are demarcated by dashed lines. Neutralization table on the far right shows the average IC50 values for each tested intermediate against a panel of pseudoviruses grouped by clade shown at the top. Characteristics of the neutralization table are the same as those listed in the Figure 2 legend. (B) Biolayer interferometry kinetic curves of a select subset of tested antibody variants (10 µg mL−1 against heterologous trimer BG505.SOSIP.664 at 500 nM). BLI curves were analyzed as described in the Figure 2 legend. All data are representative of at least two independent experiments. (C) Ribbon structure of QA013.2 Fab bound to BG505.SOSIP.664 Env trimer. Protruding N332 glycan on BG505.SOSIP.664 trimer is shown as a stick model, Fab heavy chain is shown in orange, and Fab light chain in green. Key regions of the structure are labeled including the N332 glycan as well as the VL regions that contribute to bnAb potency and antibody-antigen complex formation. FWRL2 interacts with FWRH4 of the heavy chain, while CDRL3 appears to interact with the tip of the N332 glycan. See Figure 6—source data 1, Figure 6—source data 2and Figure 6—source data 3. See also Supplementary file 3 for fasta file of all chimeric and mutant VH and VL antibody chains used in Figures 4, 5, 6.
-
Figure 6—source data 1
Biolayer Interferometry Source Data 1.
- https://cdn.elifesciences.org/articles/68110/elife-68110-fig6-data1-v2.pzfx.zip
-
Figure 6—source data 2
Biolayer Interferometry Source Data 2.
- https://cdn.elifesciences.org/articles/68110/elife-68110-fig6-data2-v2.zip
-
Figure 6—source data 3
Neutralization Source Data.
- https://cdn.elifesciences.org/articles/68110/elife-68110-fig6-data3-v2.xlsx
Figure 7 with 2 supplements
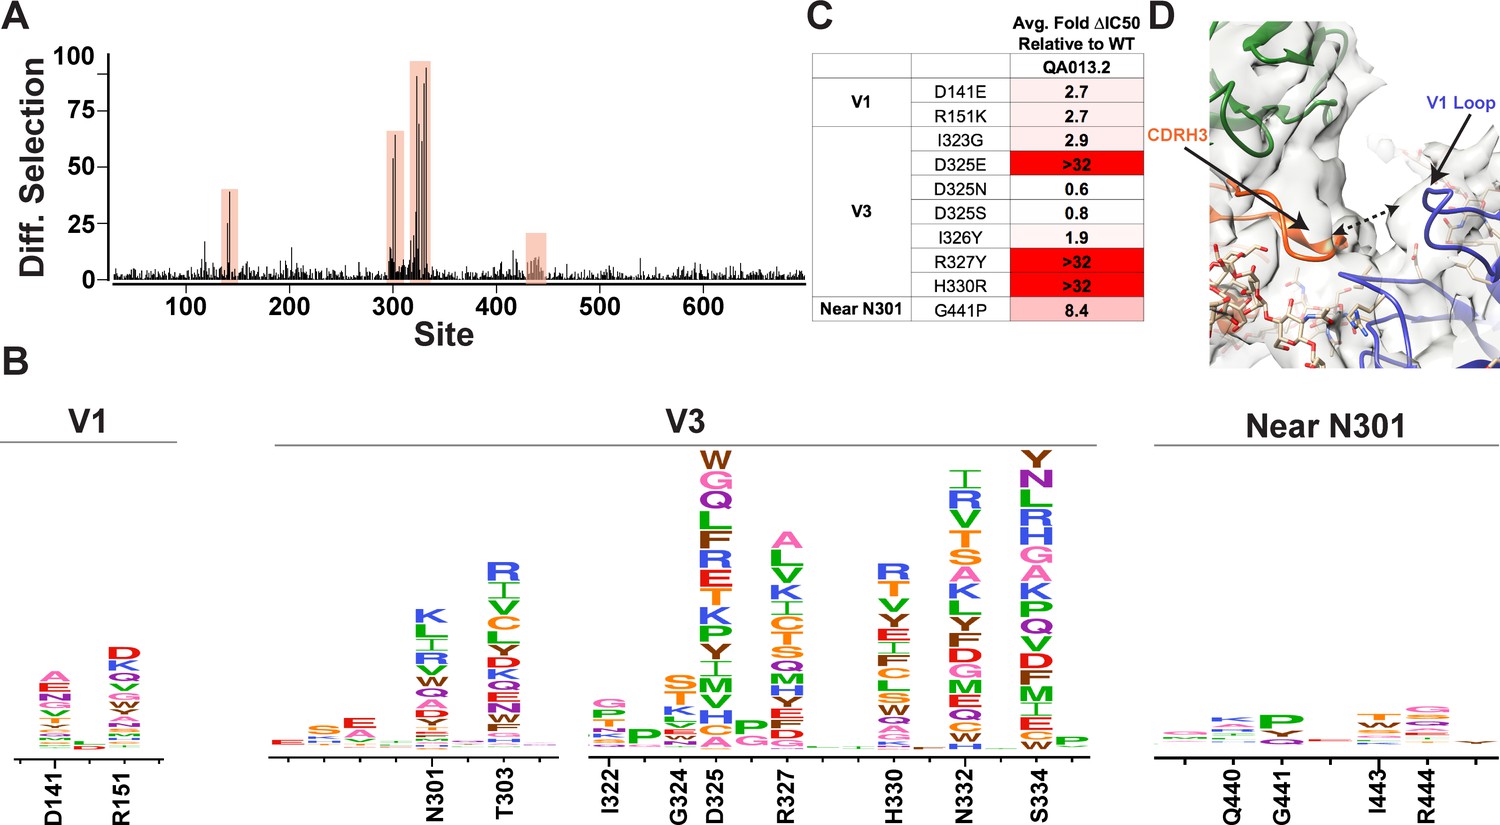
Mutational antigenic profiling of QA013.2 identifies unique viral escape mutations.
(A) Line plot showing the median positive differential selection across the mutagenized portion of BG505.W6.C2 T332N Env. (B) Logoplots showing the mutation-level enrichment for areas of escape in A. (C) Table of average fold change in IC50 for each BG505.W6.C2 T332N viral escape mutant relative to the wildtype BG505.W6.C2 T332N pseudovirus as tested in the TZM-bl neutralization assay. Darker red colors indicate a larger fold change in average IC50. In vitro neutralization data are representative of three independent replicates. (D) Heavy chain CDR3 loop is within 8 Å distance to the V1 loop when measured between the Cα chains. See also Figure 7—figure supplements 1 and 2 and Figure 7—source data 1.
-
Figure 7—source data 1
Neutralization Source Data.
- https://cdn.elifesciences.org/articles/68110/elife-68110-fig7-data1-v2.xlsx
Figure 7—figure supplement 1

Correlation of positive site differential selection between mutational antigenic profiling replicates.
For each replicate, the axes label the concentration of QA013.2 used, which mutant virus library was used, and the percent infectivity (based on qPCR).
Figure 7—figure supplement 2
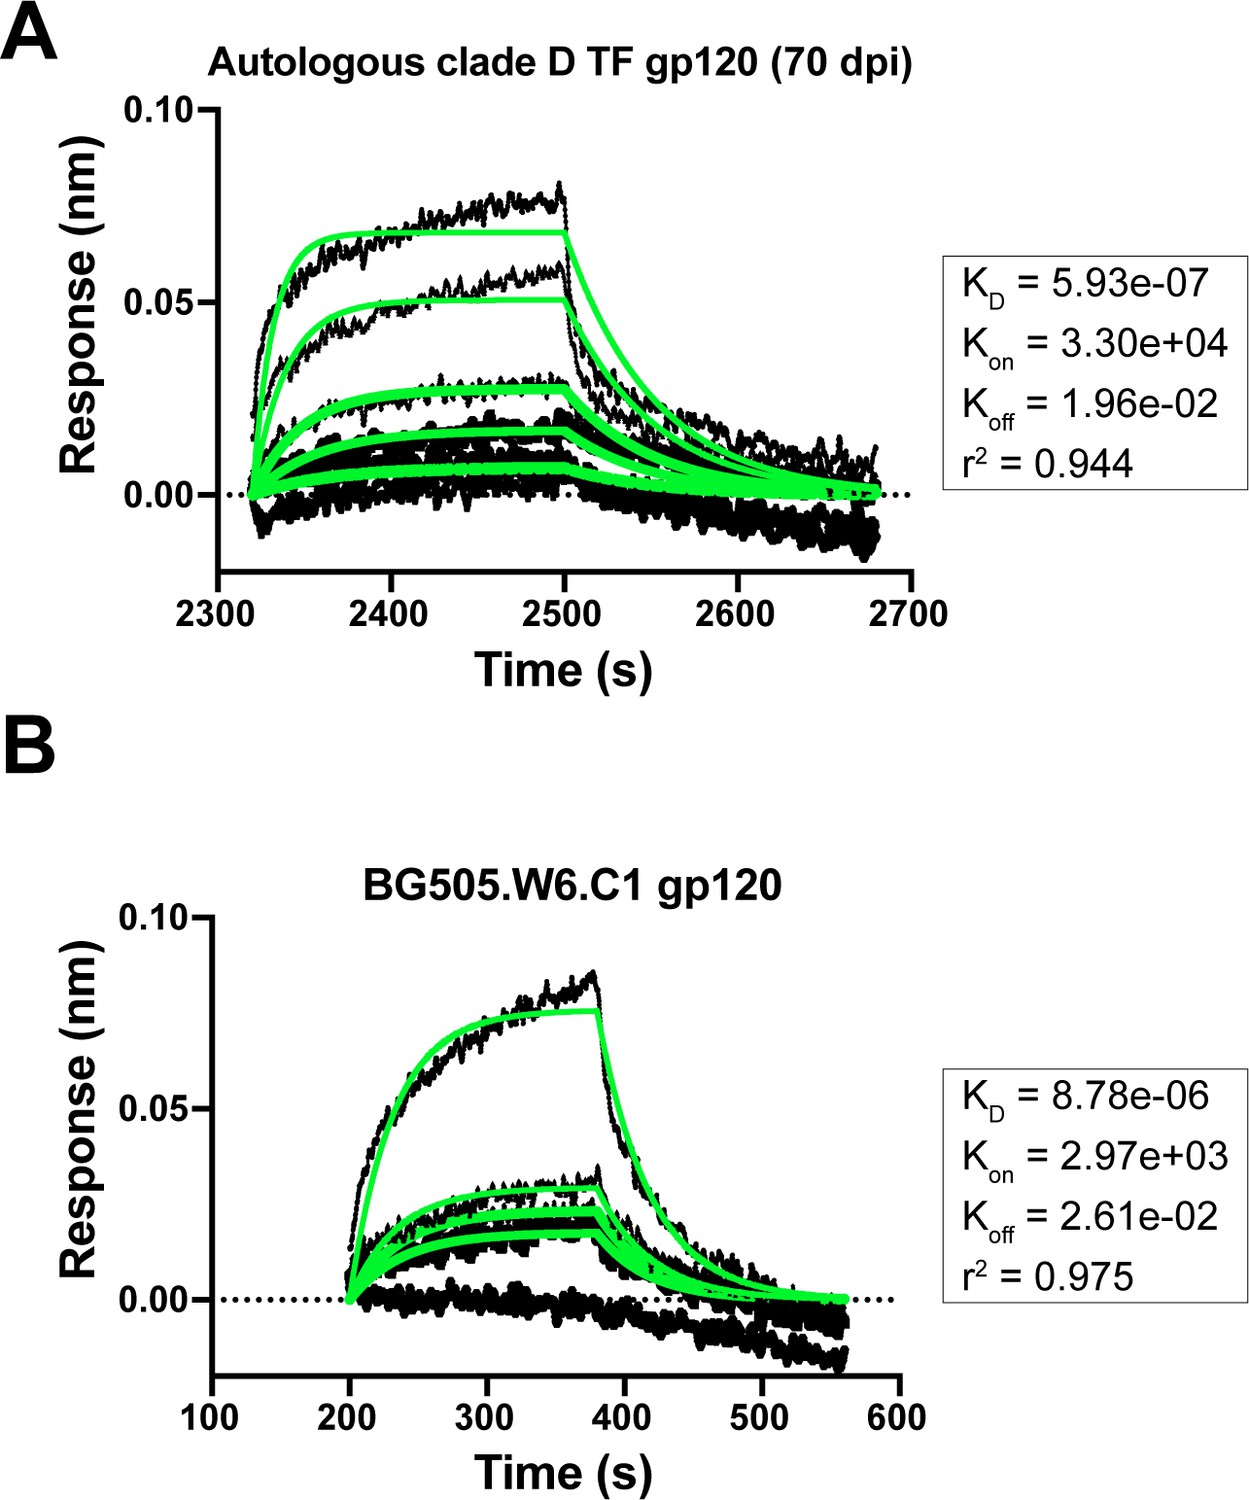
Mature bnAb QA013.2 binding to gp120 monomers that lack the N332 glycan.
(A) Biolayer interferometry kinetic curve of mature bnAb QA013.2 (10 µg mL−1) bound to autologous clade D gp120 monomer from the initial virus (2 µM). (B) Biolayer interferometry kinetic curve of mature bnAb QA013.2 (10 µg mL−1) bound to BG505.W6.C1 gp120 monomer (2 µM). BLI curves were subjected to double reference background subtraction and data were fit to a global model of 1:1 ligand:analyte binding to obtain KD, kon, and kdis values. The resulting lines of best fit are shown in green. Dotted line across the graph marks 0.00 on the y-axis. Data are representative of two independent experiments.
-
Figure 7—figure supplement 2—source data 1
Biolayer Interferometry Source Data 1.
- https://cdn.elifesciences.org/articles/68110/elife-68110-fig7-figsupp2-data1-v2.pzfx.zip
-
Figure 7—figure supplement 2—source data 2
Biolayer Interferometry Source Data 2.
- https://cdn.elifesciences.org/articles/68110/elife-68110-fig7-figsupp2-data2-v2.zip
Figure 8

QA013.2 bnAb neutralization of a virus panel including a virus lacking the N301 glycan.
Tested pseudoviruses are shown with their respective clade in the left hand columns. Envelope characteristics are shown in the middle columns for each pseudovirus, including the presence (or absence) of glycans at N301 and N332 as well as the existence of the conserved G(D/N)IR linear motif at the base of the V3 loop as indicated by a check mark. The final ten residues in the V1 loop are shown for all pseudoviruses tested, in which residues that contain the [negative charge/branched hydrophobic/positive charge] motif are colored in red. The IC50 for each tested pseudovirus is shown in a column on the far right of the table. Darker blue indicates more potent neutralization, while white demonstrates weak neutralization, and grey represents no neutralization observed at the highest antibody concentration tested. Simian immunodeficiency virus (SIV) was used as a negative control; the tested bnAb showed no evidence of SIV neutralization (data not shown). IC50 values are the average of two independent replicates. See Figure 8—source data 1.
-
Figure 8—source data 1
Neutralization Source Data.
- https://cdn.elifesciences.org/articles/68110/elife-68110-fig8-data1-v2.xlsx
Figure 9 with 1 supplement

Summary of QA013.2 determinants of HIV neutralization breadth, potency, and autologous neutralization.
Ribbon structure of QA013.2 Fab variable domain complexed to BG505.SOSIP.664 trimer in two different orientations are shown. Env structure is colored in blue with protruding glycans at sites N301 and N332 shown as stick models, Fab heavy chain in orange, and Fab light chain in green. Key regions of the Fab structure that confer breadth (yellow) or potency (pink) are labeled and colored categorically. Teal colored regions (CDRH2 and FWRH3) confer autologous neutralization. Important Env epitopes of interaction such as the linear GDIR motif and V1 loop are also labeled. See also Figure 9—figure supplement 1.
Figure 9—figure supplement 1

QA013.2 bnAb polyreactivity as measured by ELISA.
Control antibodies were tested at 25 µg/mL in technical duplicate, in which VRC01 serves as a negative control (Li et al., 2011, p. 01) and NIH 45–46, 8ANC195, and 4E10 serve as positive controls (Liu et al., 2015; Prigent et al., 2018). QA013.2 bnAb was tested in technical duplicate in a serial dilution series ranging from 25 µg/mL – 0.4 µg/mL. Tested antigens at 1 µg/mL include double-stranded DNA (dsDNA, blue), single-stranded DNA (ssDNA, light purple), lipopolysaccharide (LPS, pink), keyhole limpet (green), insulin (teal), and cardiolipin (dark purple) as previously described (Wardemann et al., 2003).
Tables
Table 1
Sequencing statistics of longitudinal PBMC samples from subject QA013.
| PBMC time point | Live PBMC count | PBMC viability | Ab chain | Raw MiSeq reads | Productive deduplicated sequences | Sequence coverage of sampled blood PBMCs | Sequence coverage of QA013 D2282 whole-body blood* repertoire |
|---|---|---|---|---|---|---|---|
| D-379 | 2.60E+06 | 96% | IgM | 1358426 | 2700 | 0.8% | 0.002% |
| IgG | 1357742 | 8350 | 14% | 0.03% | |||
| IgK | 1701268 | 21043 | 6% | 0.01% | |||
| IgL | 1528383 | 27458 | 7% | 0.02% | |||
| D-351 | 2.50E+06 | 100% | IgM | 1186865 | 2213 | 0.7% | 0.002% |
| IgG | 1290351 | 7093 | 12% | 0.03% | |||
| IgK | 1724651 | 19835 | 5% | 0.01% | |||
| IgL | 1116583 | 23489 | 6% | 0.01% | |||
| D385 | 3.90E+06 | 100% | IgM | 1299494 | 2039 | 0.4% | 0.001% |
| IgG | 1512588 | 6222 | 7% | 0.02% | |||
| IgK | 2058137 | 22252 | 4% | 0.01% | |||
| IgL | 1454466 | 27107 | 5% | 0.01% | |||
| D765 | 6.80E+06 | 96% | IgM | 1264049 | 2480 | 0.3% | 0.001% |
| IgG | 1465034 | 7424 | 12% | 0.03% | |||
| IgK | 2083938 | 21738 | 2% | 0.00% | |||
| IgL | 1556226 | 26530 | 3% | 0.01% |
-
*Assuming PBMC samples were from a 10 mL blood draw and that adults have 4500 mL total blood volume.
Key resources table
| Reagent type (species) or resource | Designation | Source or reference | Identifiers | Additional information |
|---|---|---|---|---|
| Strain, strain background (HIV-1) | HIV Env clone BG505.W6M.C2 T332N | Wu et al., 2006 | GenBank: DQ208458.1 | |
| Strain, strain background (HIV-1) | HIV Env clone SF162 | Cheng-Mayer et al., 1997 | GenBank: EU123924.1 | |
| Strain, strain background (HIV-1) | HIV Env clone QC406.70M.F3 | Blish et al., 2009 | Genbank: FJ866133.1 | |
| Strain, strain background (HIV-1) | HIV Env clone QA013.765M.C1 | Williams et al., 2018 | Genbank: MG992331 | |
| Strain, strain background (HIV-1) | QB726.70M.B3 | Blish et al., 2009 | Genbank: FJ866111.1 | |
| Strain, strain background (HIV-1) | Q259.W6 | Long et al., 2002 | Genbank: AF407151.1 | |
| Strain, strain background (HIV-1) | QH343.21M.A10 | Blish et al., 2009 | Genbank: FJ866119.1 | |
| Strain, strain background (HIV-1) | QA255.21P.A15 | Bosch et al., 2010 | Genbank: MW383929.1 | |
| Strain, strain background (HIV-1) | BI206.W6RT.A1 | Wu et al., 2006 | Genbank: DQ208465.1 | |
| Strain, strain background (HIV-1) | BF520.W14.B3 | Simonich et al., 2016 | Genbank: KX168093.1 | |
| Strain, strain background (HIV-1) | BL274.W6.A3 | Wu et al., 2006 | Genbank: DQ208499.1 | |
| Strain, strain background (HIV-1) | ML274.W0.D1 | Wu et al., 2006 | Genbank: DQ208495.1 | |
| Strain, strain background (HIV-1) | MS208.W0.B.A3 | Wu et al., 2006 | Genbank: DQ187022.1 | |
| Strain, strain background (HIV-1) | MI206.W0.A1 | Wu et al., 2006 | Genbank: DQ208459.1 | |
| Strain, strain background (HIV-1) | MJ613.W1.A2 | Wu et al., 2006 | Genbank: DQ208444.1 | |
| Strain, strain background (HIV-1) | MG505.W0.A2 | Wu et al., 2006 | Genbank: DQ208449.1 | |
| Strain, strain background (HIV-1) | MF535.W0.F1 | Wu et al., 2006 | Genbank: DQ208429.1 | |
| Strain, strain background (HIV-1) | ML035.W0.A1 | Wu et al., 2006 | Genbank: DQ208468.1 | |
| Strain, strain background (HIV-1) | BF535.W6.A1 | Wu et al., 2006 | Genbank: DQ208431.1 | |
| Strain, strain background (HIV-1) | BL035.W6.B1 | Wu et al., 2006 | Genbank: DQ208479.1 | |
| Strain, strain background (HIV-1) | MK184.W0.D1 | Wu et al., 2006 | Genbank: DQ208484.1 | |
| Strain, strain background (HIV-1) | QA465.59M.A1 | Blish et al., 2009 | Genbank: FJ866136.1 | |
| Strain, strain background (HIV-1) | QB857.110I.B3 | Blish et al., 2009 | Genbank: FJ866138.1 | |
| Strain, strain background (Escherichia coli) | One Shot Top10 | Thermo Fisher | Cat#C404003 | chemically competent cells |
| Cell line (Homo sapiens) | FreeStyle 293F | Invitrogen | Cat#R790-07; RRID:CVCL_D603 | |
| Cell line (Homo sapiens) | Human Embryonic Kidney (HEK) 293T | ATCC | Cat# CRL-3216; RRID:CVCL_0063 | |
| Cell line (Homo sapiens) | TZM-bl | AIDS Reagent Program, Division of AIDS, NIAID, NIH. | Cat# ARP-8129; RRID:CVCL_B478 | |
| Biological sample (Homo sapiens) | Human PBMC samples from subject QA013 | Martin et al., 1998 | N/A | |
| Antibody | VRC01 (human, monoclonal) | Williams et al., 2019 | N/A | ELISA, tested at 25 µg/mL |
| Antibody | NIH 45–46 (human, monoclonal) | Scheid et al., 2009 | N/A | ELISA, tested at 25 µg/mL |
| Antibody | 8ANC195 (human, monoclonal) | Scheid et al., 2011 | N/A | ELISA, tested at 25 µg/mL |
| Antibody | 4E10 (human, monoclonal) | Stiegler et al., 2001 | N/A | ELISA, tested at 25 µg/mL |
| Antibody | Fi6v3 (human, monoclonal) | Jesse Bloom | N/A | ELISA, tested at 25 µg/mL |
| Recombinant DNA reagent | Human Igγ1 expression vector | Tiller et al., 2008 | Addgene: 80795 | |
| Recombinant DNA reagent | Human Igκ expression vector | Tiller et al., 2008 | Addgene: 80796 | |
| Recombinant DNA reagent | Human Igλ expression vector | Tiller et al., 2008 | Addgene: 99575 | |
| Peptide, recombinant protein | BG505.SOSIP.664 | Sanders et al., 2013; Verkerke et al., 2016 | Courtesy of Kelly Lee | |
| Peptide, recombinant protein | Protein G agarose | Pierce | Cat#20397 | |
| Peptide, recombinant protein | BG505.W6.C1 gp120 monomer | Immune Technology Corp. | Cat#IT-001–176 p | |
| Peptide, recombinant protein | QA013.70I.H1 gp120 monomer | Cambridge Biologics | GenBank: MG992347 | custom protein synthesis |
| Peptide, recombinant protein | QA013.765M.C1 gp120 monomer | Cambridge Biologics | Genbank: MG992331 | custom protein synthesis |
| Commercial assay or kit | Gal-Screen | Thermo Fisher | Cat#T1028 | |
| Commercial assay or kit | AllPrep DNA/RNA Mini Kit | Qiagen | Cat#80204 | |
| Commercial assay or kit | SMARTer RACE 5’/3’ Kit | Takara Bio USA | Cat#634858 | |
| Commercial assay or kit | KAPA library quantification kit | Kapa Biosystems | Cat#KK4824 | |
| Commercial assay or kit | 600-cycle MiSeq Reagent Kit v3 | Illumina | Cat#MS-102–3003 | |
| Commercial assay or kit | Nextera XT 96-well index kit | Illumina | Cat#FC-131–1001 | |
| Commercial assay or kit | QIAquick PCR Purification Kit | Qiagen | Cat#28104 | |
| Chemical compound, drug | FreeStyle MAX | Thermo Fisher | Cat#16447500 | |
| Chemical compound, drug | 293F FreeStyle Expression media | Invitrogen | Cat#12338–026 | |
| Chemical compound, drug | Q5 High-Fidelity Master Mix | New England BioLabs | Cat#M0492S | |
| Chemical compound, drug | DEAE-dextran | VWR | Cat#97061–684 | |
| Software, algorithm | FLASH v1.2.11 | Magoč and Salzberg, 2011 | http://ccb.jhu.edu/software/FLASH/ | |
| Software, algorithm | Cutadapt 1.14 with Python 2.7.9 | Martin, 2011 | http://cutadapt.readthedocs.io/en/stable/ | |
| Software, algorithm | FASTX toolkit 0.0.14 | Hannon Lab, Cold Spring Harbor | http://hannonlab.cshl.edu/fastx_toolkit/ | |
| Software, algorithm | Partis | Ralph and Matsen, 2016 | https://github.com/psathyrella/partis | |
| Software, algorithm | FastTree 2 | Price et al., 2010 | https://github.com/matsengrp/cft/blob/master/bin/prune.py | |
| Software, algorithm | Linearham | Dhar et al., 2020 | https://github.com/matsengrp/linearham | |
| Software, algorithm | RevBayes | Höhna et al., 2016, Höhna et al., 2021 | https://revbayes.github.io/ | |
| Software, algorithm | Local BLAST | Biopython | https://github.com/matsengrp/cft/blob/master/bin/blast.py | |
| Software, algorithm | WebLogo | Crooks et al., 2004 | RRID:SCR_010236 | |
| Software, algorithm | Geneious v11.1.2 | Kearse et al., 2012 | RRID:SCR_010519 | |
| Software, algorithm | Excel | Microsoft | RRID:SCR_016137 | |
| Software, algorithm | ForteBio’s Octet Software ‘Data Analysis 7.0’ | Pall ForteBio (now Sartorius) | N/A | |
| Software, algorithm | Prism 9.0 | GraphPad | RRID:SCR_002798 | |
| Software, algorithm | Relion v3.0.7 | Scheres, 2012 | RRID:SCR_016274 | |
| Software, algorithm | MotionCor2 | Zheng et al., 2017 | RRID:SCR_016499 | |
| Software, algorithm | CTFFIND4 | Rohou and Grigorieff, 2015 | RRID:SCR_016732 | |
| Software, algorithm | UCSF Chimera | Pettersen et al., 2004 | RRID:SCR_004097 | |
| Software, algorithm | SWISS-MODEL | Waterhouse et al., 2018 | RRID:SCR_013032 | |
| Software, algorithm | Phenix software suite | Liebschner et al., 2019 | RRID:SCR_014224 | Autosharpen program (Terwilliger et al., 2018); ‘Dock In Map’ program; Realspace RefinementOo |
| Other | Anti-human IgG Fc capture biosensors | Sartorius | Cat#18–5063 | |
| Other | QA013 antibody variable gene sequencing data | This paper | BioProject SRA: PRJNA674442 | |
| Other | cryo-EM map and atomic coordinates | This paper | EMD-24195 and PDB 7N65 |
Additional files
-
Supplementary file 1
Fasta file of all computationally-inferred QA013.2 lineage members.
Sequence file includes inferred naive BCRs, computationally inferred lineage intermediates, and mature sequences for both VH and VL lineages.
- https://cdn.elifesciences.org/articles/68110/elife-68110-supp1-v2.fasta
-
Supplementary file 2
Fasta file of sampled NGS sequences with high percent identity to computationally inferred lineage members.
Sequence file includes sampled NGS sequences with the highest nucleotide identity to all QA013.2 inferred lineage members and mature sequences.
- https://cdn.elifesciences.org/articles/68110/elife-68110-supp2-v2.fasta
-
Supplementary file 3
Fasta file of all QA013.2 VH and VL chimeras and mutant variants.
- https://cdn.elifesciences.org/articles/68110/elife-68110-supp3-v2.fasta
-
Transparent reporting form
- https://cdn.elifesciences.org/articles/68110/elife-68110-transrepform-v2.docx
Download links
A two-part list of links to download the article, or parts of the article, in various formats.
Downloads (link to download the article as PDF)
Open citations (links to open the citations from this article in various online reference manager services)
Cite this article (links to download the citations from this article in formats compatible with various reference manager tools)
Functional development of a V3/glycan-specific broadly neutralizing antibody isolated from a case of HIV superinfection
eLife 10:e68110.
https://doi.org/10.7554/eLife.68110


