Gjd2b-mediated gap junctions promote glutamatergic synapse formation and dendritic elaboration in Purkinje neurons
- National Centre for Biological Sciences, Tata Institute of Fundamental Research, India
Figures
Figure 1 with 2 supplements
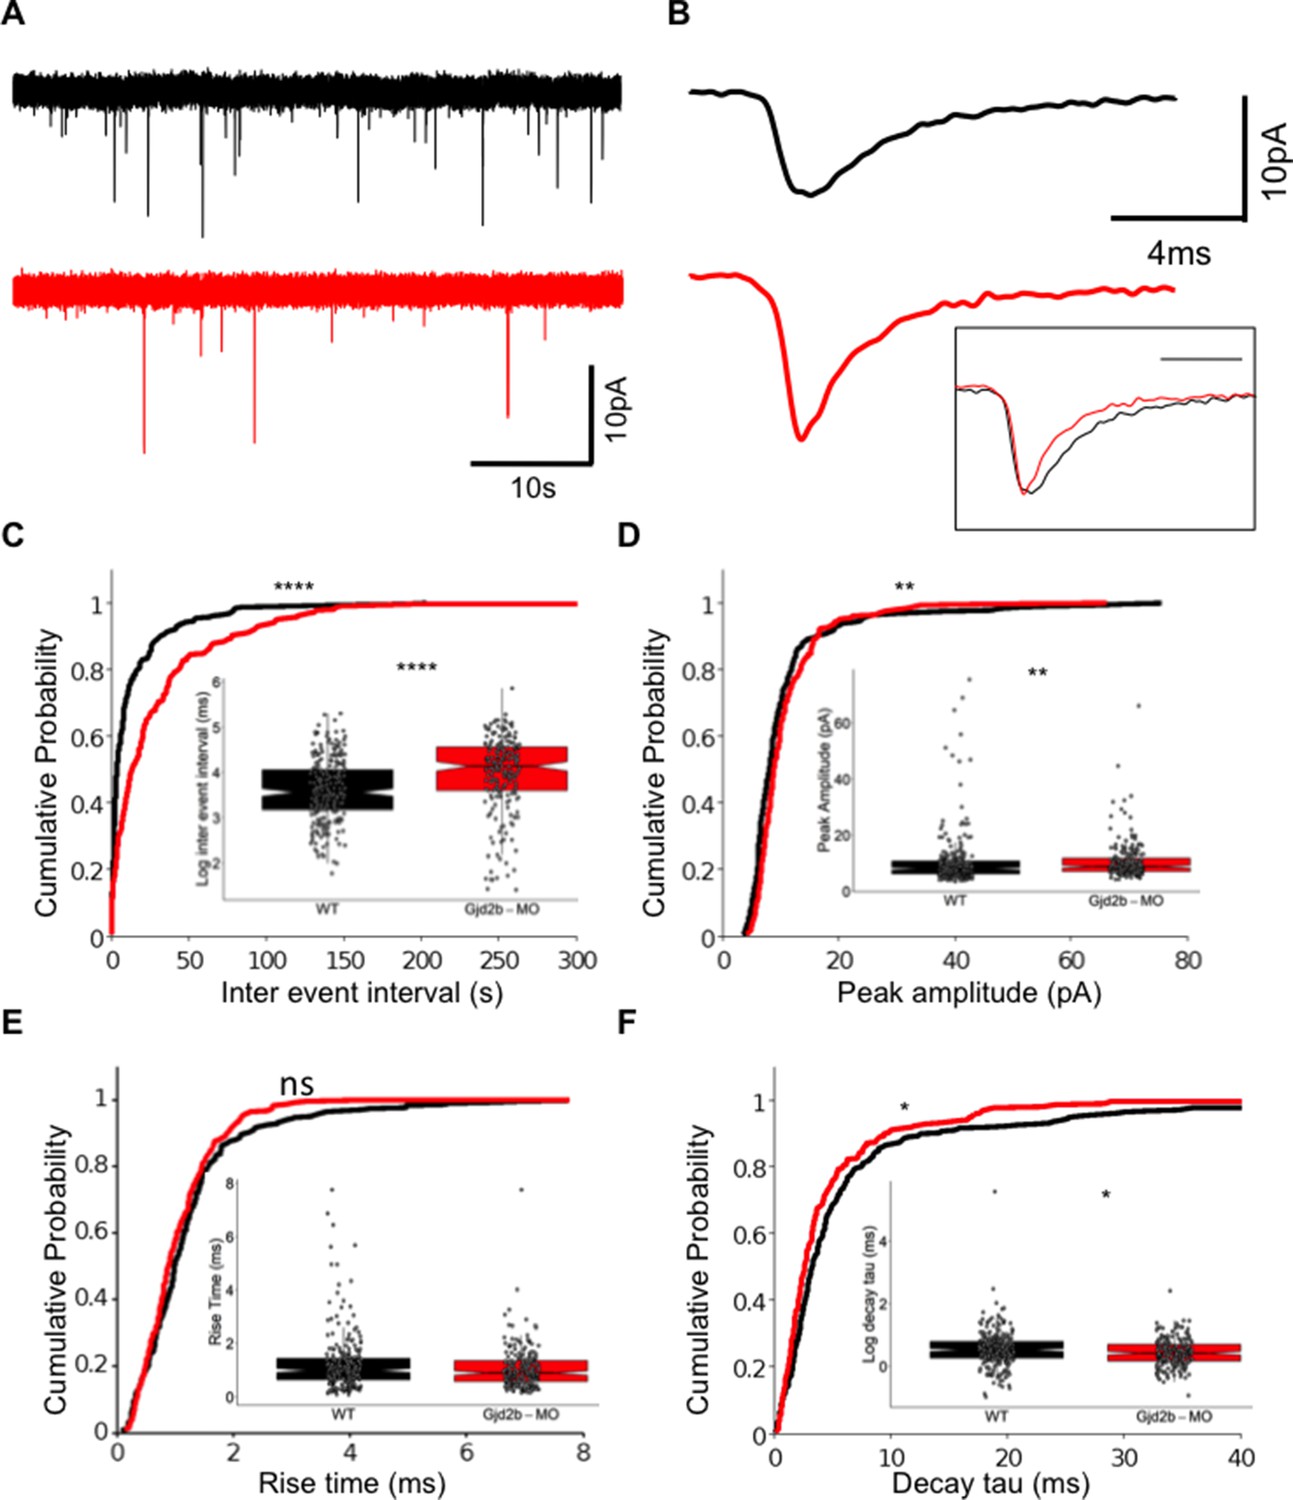
Knocking down Gjd2b reduces glutamatergic miniature excitatory postsynaptic current (mEPSC) frequency in Purkinje neurons (PNs) by potentially decreasing synaptic number.
(A) Raw traces of mEPSC recordings from PNs in control (black) and Gjd2b-MO-injected (red) larvae. (B) Average mEPSC waveforms from control and Gjd2b-MO-injected larvae. Inset: scaled mEPSC to show faster decay time of mEPSCs in morphants. Neurons were held at −65 mV. (C–F) Cumulative probability distributions and boxplots of mEPSC inter-event intervals (C), peak amplitudes (D), 10–90% rise times (E), and decay tau (F) in control (black) and Gjd2b-MO-injected (red) larvae. N = 7 cells from 7 larvae from 5 clutches for control and 12 cells from 12 larvae from 8 clutches for the Gjd2b-MO group. **p<0.01; ***p<0.001; ****p<0.0001; Mann–Whitney U test. See also Figure 1—figure supplements 1 and 2. Data used for quantitative analyses are available in Figure 1—source data 1.
-
Figure 1—source data 1
mEPSC data.
- https://cdn.elifesciences.org/articles/68124/elife-68124-fig1-data1-v2.xlsx
Figure 1—figure supplement 1
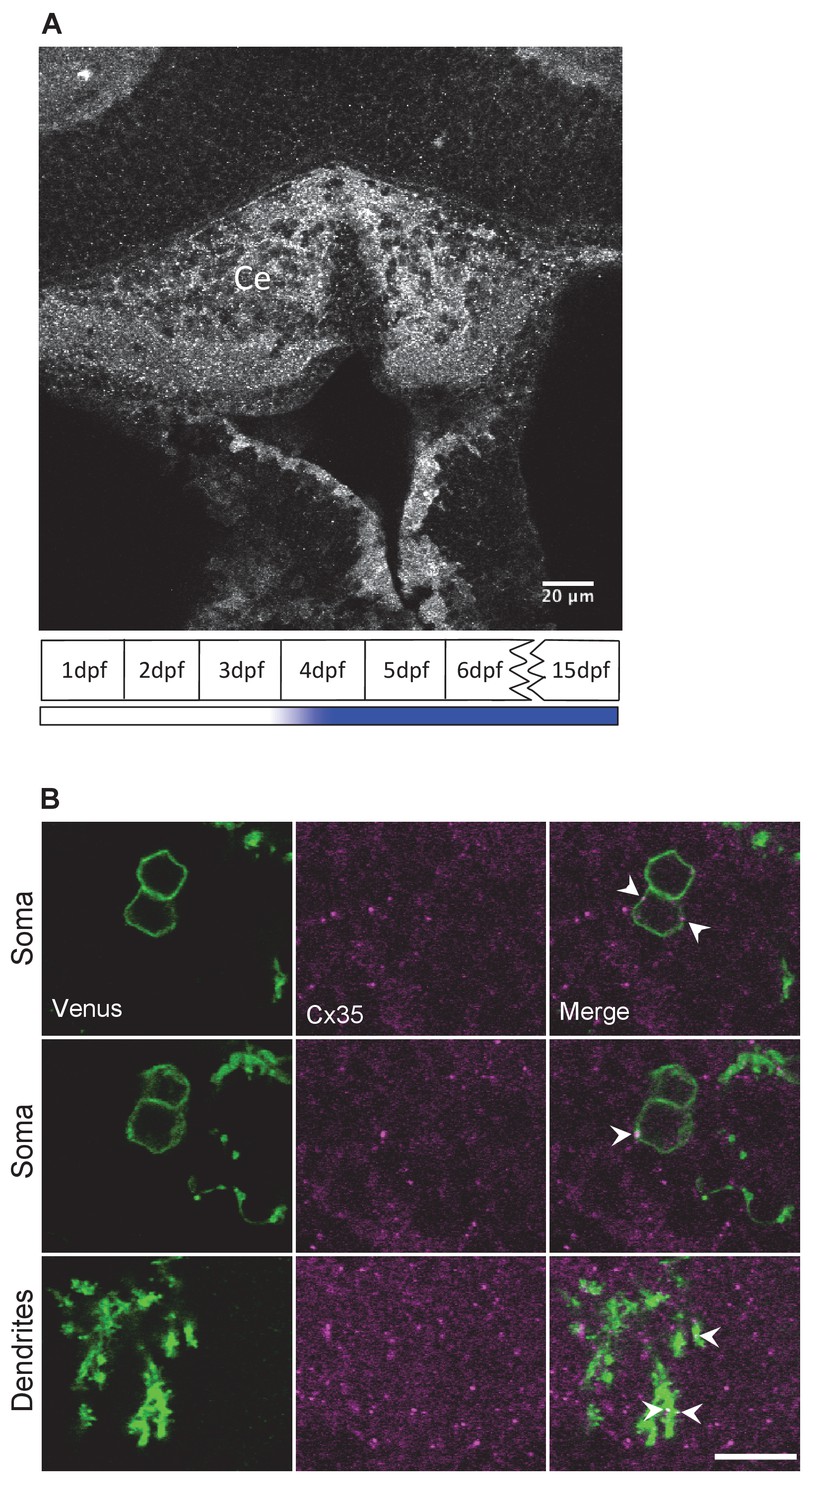
Connexin 35 (Cx35) is expressed in the cerebellum in Purkinje neurons (PNs).
(A) Cx35 immunoreactivity in the cerebellum (Ce) of 6 days post fertilization larvae. Schematic in the bottom shows the timeline for appearance of Cx35 immunoreactivity in the cerebellum of developing zebrafish. Adapted from Figures 5 and 9 of Jabeen and Thirumalai, 2013. (B) PNs labeled with aldoca: gap43-Venus (green) also show Cx35 immunoreactive puncta (red) in their somata (top two rows) and dendrites (bottom row).
Figure 1—figure supplement 2
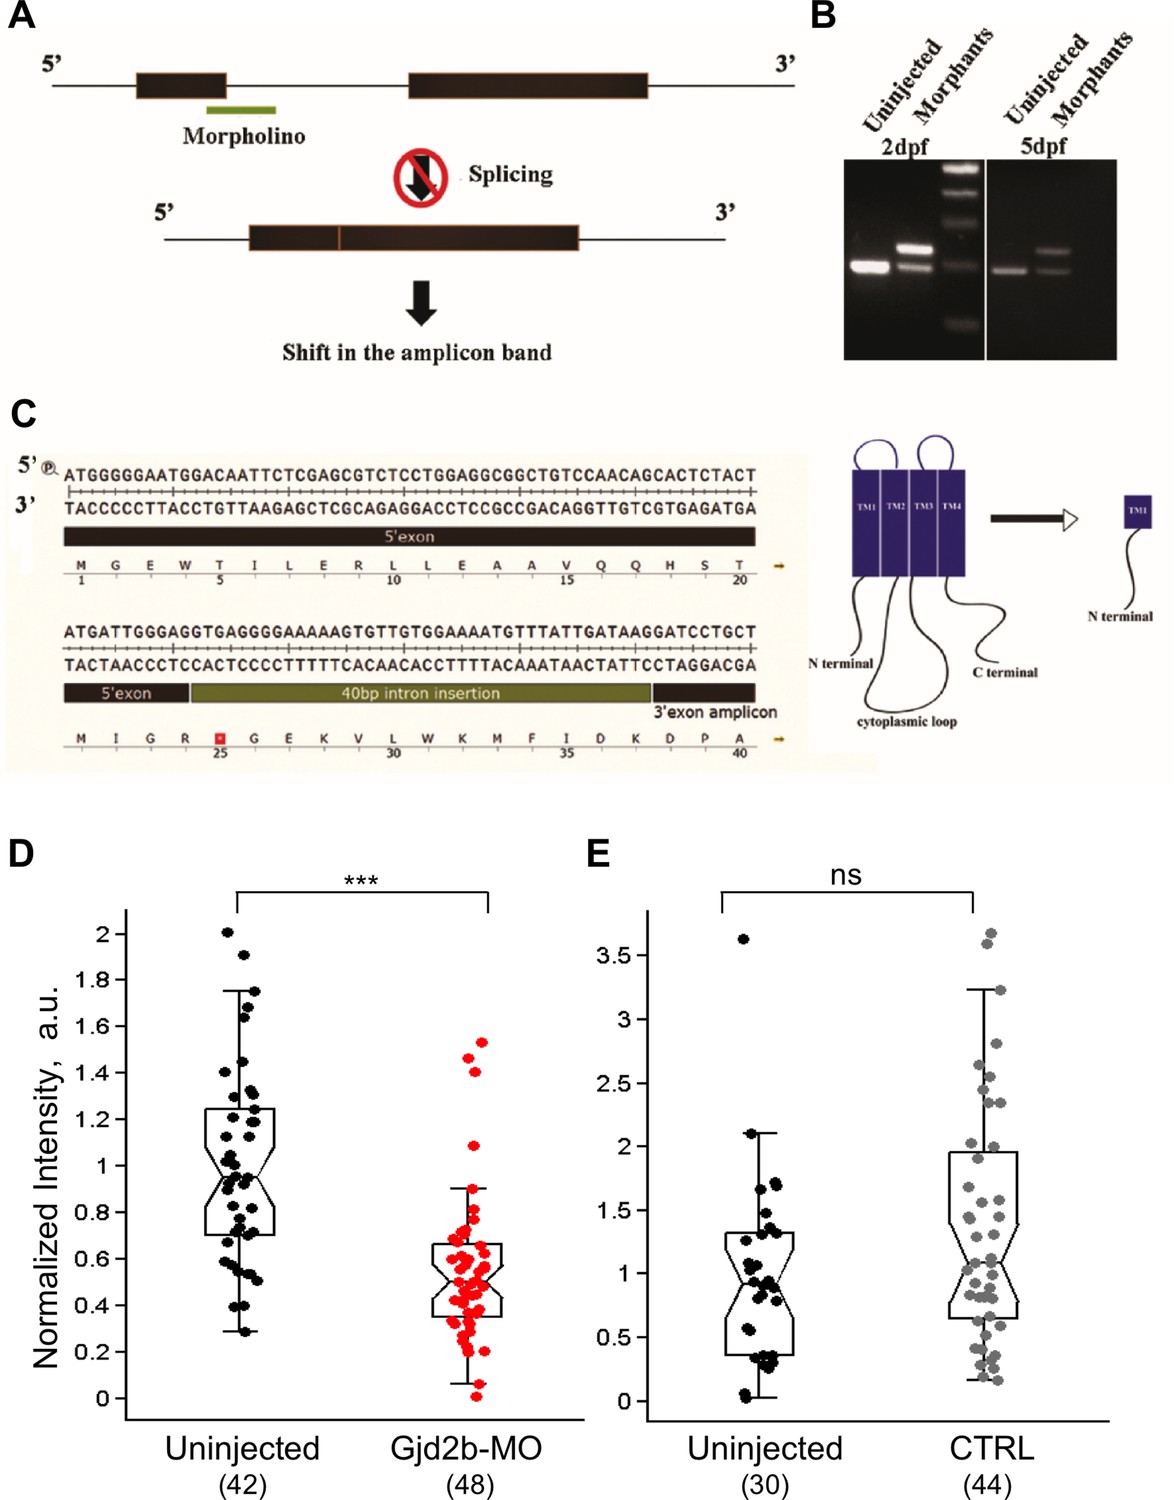
Effective knockdown of Gjd2b after injection of splice-blocking morpholino.
(A) Schematic indicating the binding location of Gjd2b-MO at the junction of exon 1 and intron 1 of gjd2b and blockade of normal splicing out of intron 1. (B) RT-PCR reveals a single amplicon in uninjected larvae but two amplicons, one of higher apparent molecular weight corresponding to the mis-spliced product, appearing in Gjd2b-MO larvae at 2 days post fertilization (dpf) and 5 dpf. (C) Sequence of the mis-spliced gene product with a premature stop codon indicated by the red square. Predicted sequence of translated polypeptide is shown below and truncated Gjd2b with domain structure shown on the right. (D) Reduced intensity of Gjd2b immunostaining in the cerebellum of Gjd2b-MO larvae compared to uninjected larvae (p<0.001, Mann–Whitney test). Uninjected and morphant embryos were from the same clutch and processing was done in parallel. (E) Injection of a control morpholino with 5-base mismatch with target sequence (CTRL) does not alter Gjd2b immunostaining intensity in the cerebellum (p=0.14, Mann–Whitney test). Uninjected and control morphant embryos were from the same clutch and processing was done in parallel. Number of images sampled in each group is indicated in parentheses at the bottom. Data used for quantitative analyses are available in Figure 1—figure supplement 2—source data 1.
-
Figure 1—figure supplement 2—source data 1
Fluorescence intensity data.
- https://cdn.elifesciences.org/articles/68124/elife-68124-fig1-figsupp2-data1-v2.xlsx
Figure 2

Generation of gjd2b mutant zebrafish.
(A) Genomic region around the start codon (green box) of gjd2b gene was selected for TALEN design, where TALEN-1 recognition sequence (blue line) spans the 5′UTR, the start codon sequence, and a few nucleotides after the start codon. The TALEN-2 recognition sequence (purple line) begins after the 18 nucleotide spacer region. (B) Chromatograms of sequence read from wild-type (WT) and homozygous gjd2bncb215 fish generated in this study indicate an insertion of nucleotide G (red arrowhead) within the Xho1 restriction site (blue line). (C) Representative gel image after Xho1 restriction digestion analysis of an 800 bp amplicon (includes ~300 bp upstream and 500 bp downstream sequences from the point of insertion) shows undigested and partially digested bands in the homozygous and heterozygous mutants, respectively, compared to complete digestion in WT siblings. (D) Predicted amino acid sequences of various gjd2b mutant alleles generated in this study aligned with the WT Gjd2b sequence. gjd2bncb215 is predicted to code for the first six amino acid residues of Gjd2b followed by a nonsense sequence up to the 54th amino acid position. Presence of a premature stop codon terminates translation at this position. (E) Representative images of Gj2b-like immunoreactivity from WT and mutant fish. Staining was not completely abolished as the antibody also recognizes Gjd2a. (F) Gjd2b-like immunoreactivity is reduced in PNs of gjd2bncb215 compared to WT larvae (Mann–Whitney U test; ***p<0.001). Number of images analyzed is indicated in parentheses. Data used for quantitative analyses are available in Figure 2—source data 1.
-
Figure 2—source data 1
Fluorescence intensity data.
- https://cdn.elifesciences.org/articles/68124/elife-68124-fig2-data1-v2.xlsx
Figure 3 with 1 supplement
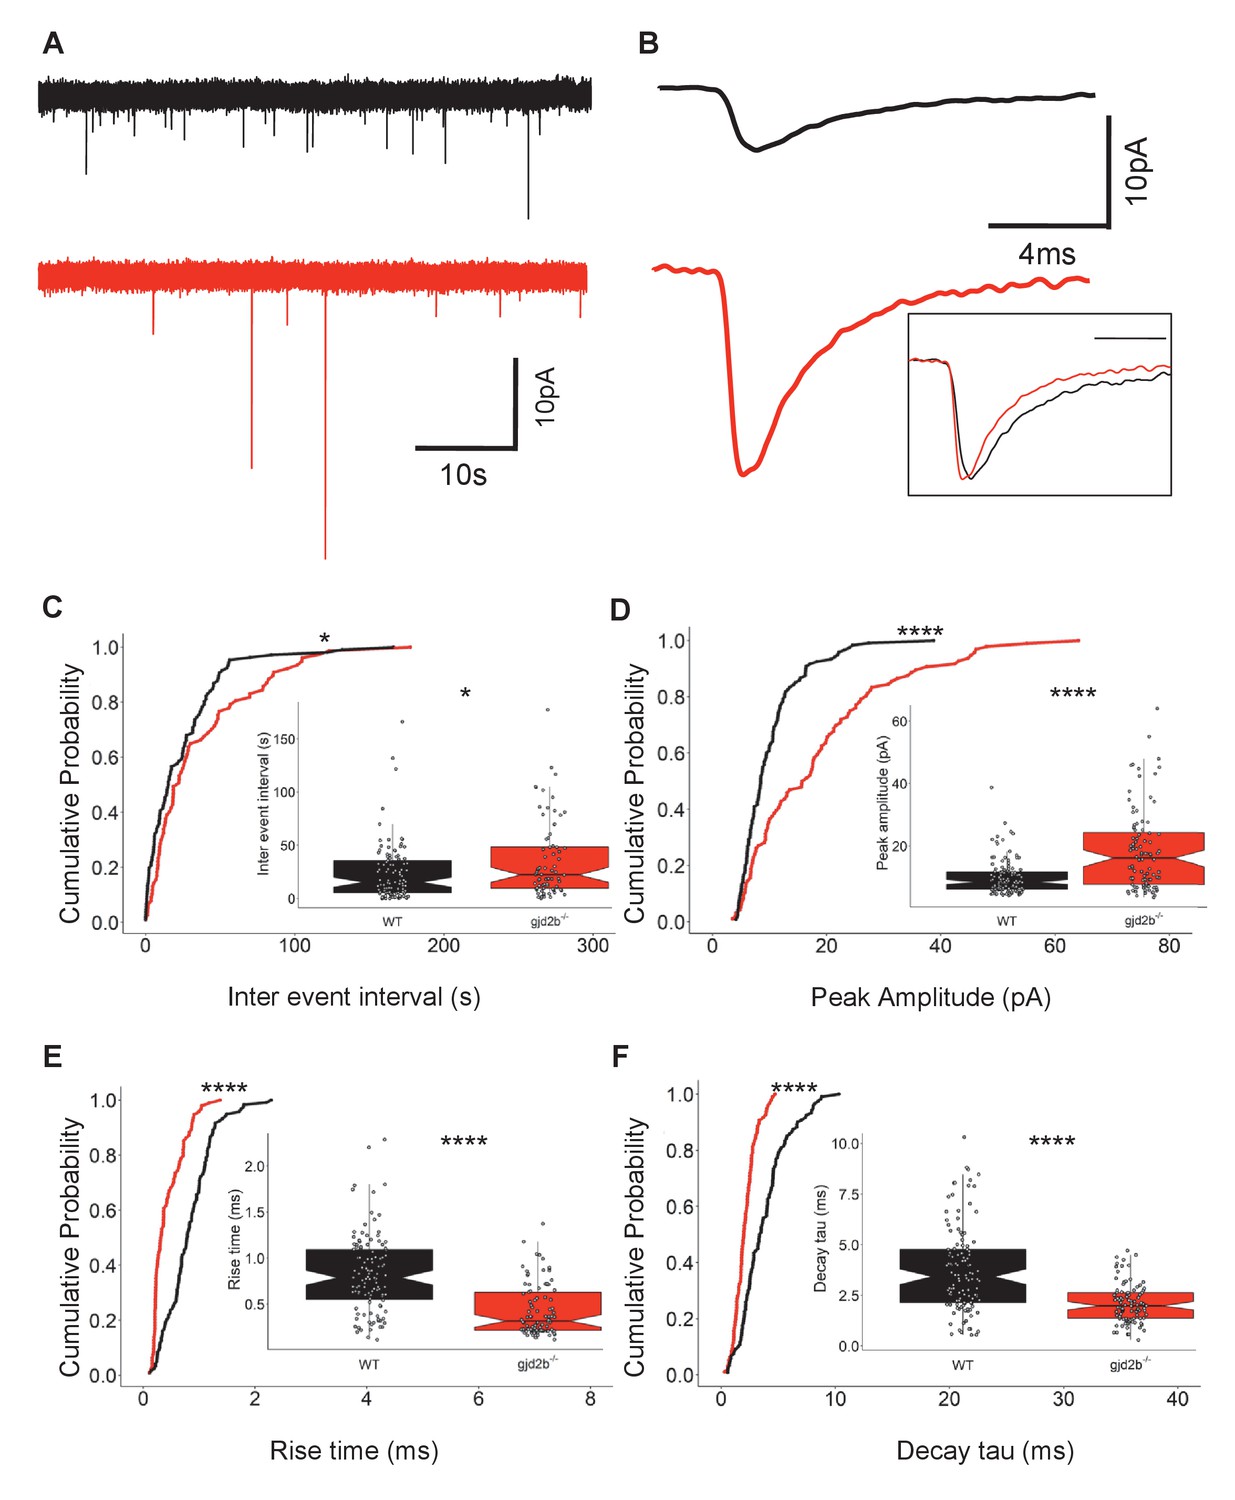
Knocking out Gjd2b results in decrease of glutamatergic synaptic number.
(A) Representative miniature excitatory postsynaptic current (mEPSC) recordings from Purkinje neurons (PNs) of wild-type (black trace) and gjd2b-/- (red) larvae. (B) Average mEPSC shown on expanded time base recorded from wild-type (black) and gjd2b-/- (red) larvae. Neurons were held at −65 mV. Inset: scaled mEPSC to show faster rise time and decay time of mEPSCs in mutants. (C–F) Cumulative probability histograms and boxplots reveal increased inter-event intervals (C), increased peak amplitudes (D), decreased 10–90% rise times (E), and decreased decay time constants (F) of mEPSCs in gjd2b-/- larvae (red lines) compared to wild type (black lines). N = 8 cells in wild type and 10 cells in gjd2b-/- larvae. *p<0.05; ****p<0.0001; Mann–Whitney U test. Data used for quantitative analyses are available in Figure 3—source data 1. See also Figure 3—figure supplement 1.
-
Figure 3—source data 1
Mutant mEPSC and Rin data.
- https://cdn.elifesciences.org/articles/68124/elife-68124-fig3-data1-v2.xlsx
Figure 3—figure supplement 1
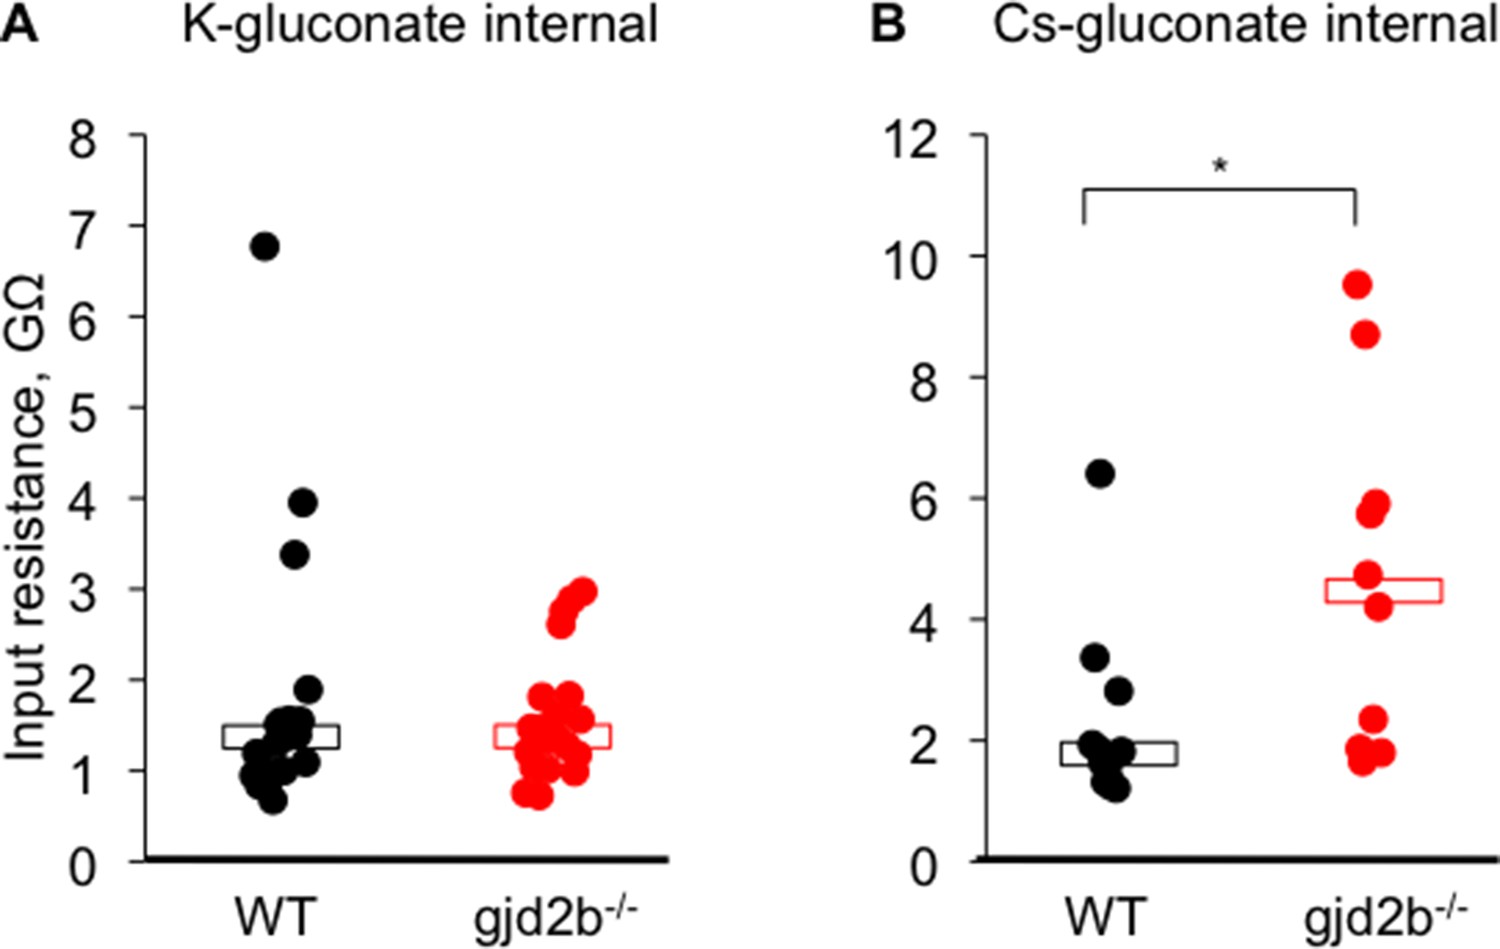
Input resistance of wild-type and mutant Purkinje neurons.
(A) Input resistance measured using potassium gluconate internal solution. (B) Input resistance measured using cesium gluconate internal solution. Wild-type neurons are shown in black and mutant neurons in red. Black open bar indicates median value for wild-type neurons. Red open bar indicates median value for mutant neurons. Mann–Whitney test, p=0.62 in K-gluconate and 0.02 in Cs-gluconate. Data used for quantitative analyses are available in Figure 3—source data 1.
Figure 4
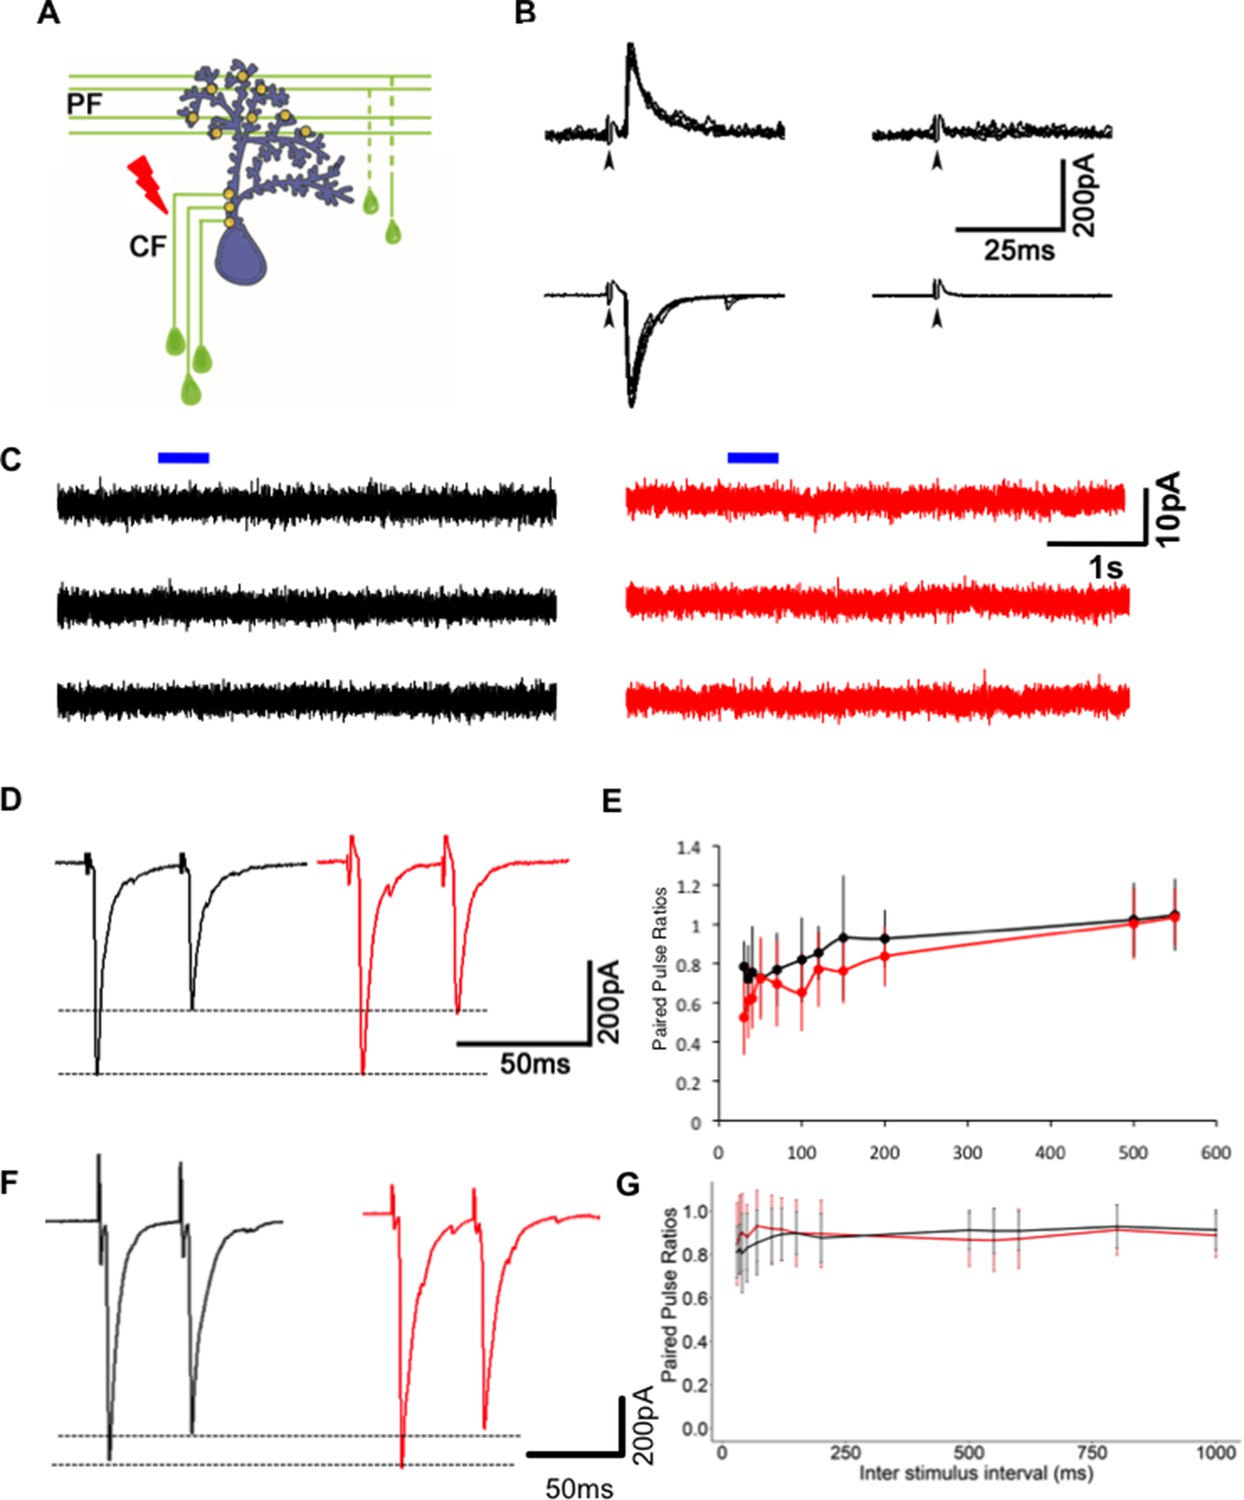
Reduction in miniature excitatory postsynaptic current (mEPSC) frequency in Gjd2b-KD and KO animals is not due to silent synapses or change in probability of transmitter release.
(A) Schematic of experimental setup for stimulating climbing fibers (CFs) while recording EPSCs in Purkinje neurons (PNs; blue). (B) EPSCs recorded at a hyperpolarized holding potential (bottom row traces) and at a depolarized holding potential (top traces) in normal saline (left side traces) and in saline containing the AMPAR blocker CNQX (right-side traces). No EPSCs were detected in the presence of CNQX at −65 or +60 mV at 7 days post fertilization (dpf) (N = 4 cells) or at 19 dpf (N = 2 cells). Data from 19 dpf shown above. (C) Voltage clamp recordings from wild-type (WT) and mutant PNs at 7 dpf at a holding potential of −20 mV show no detectable response to brief pulses (blue bars) of N-methyl-D-aspartate (NMDA). Recordings were done in the presence of 1 µM tetrodotoxin (TTX). (D) Paired pulse depression of EPSCs in PNs of control (black) and Gjd2b-MO-injected (red) larvae. (E) Paired pulse ratios were not significantly different between control and Gjd2b-MO-injected larvae at any of the interstimulus intervals (ISIs) tested (mean ± SD; N = 5 cells from five larvae each in control and Gjd2b-MO groups; two-way repeated-measures ANOVA, p=0.081 for groups [control, Gjd2b-MO] and p<0.001 for ISIs). (F) Paired pulse depression of EPSCs in PNs of WT (black) and gjd2b-/- (red) larvae. (G) Paired pulse ratios were not significantly different between WT and mutant larvae. Mean ± SD; two-way repeated-measures ANOVA, p=0.17 for groups (control, Gjd2b-MO) and p<0.001 for ISI. Data used for quantitative analyses are available in Figure 4—source data 1.
-
Figure 4—source data 1
Morphant and mutant PPR data.
- https://cdn.elifesciences.org/articles/68124/elife-68124-fig4-data1-v2.xlsx
Figure 5
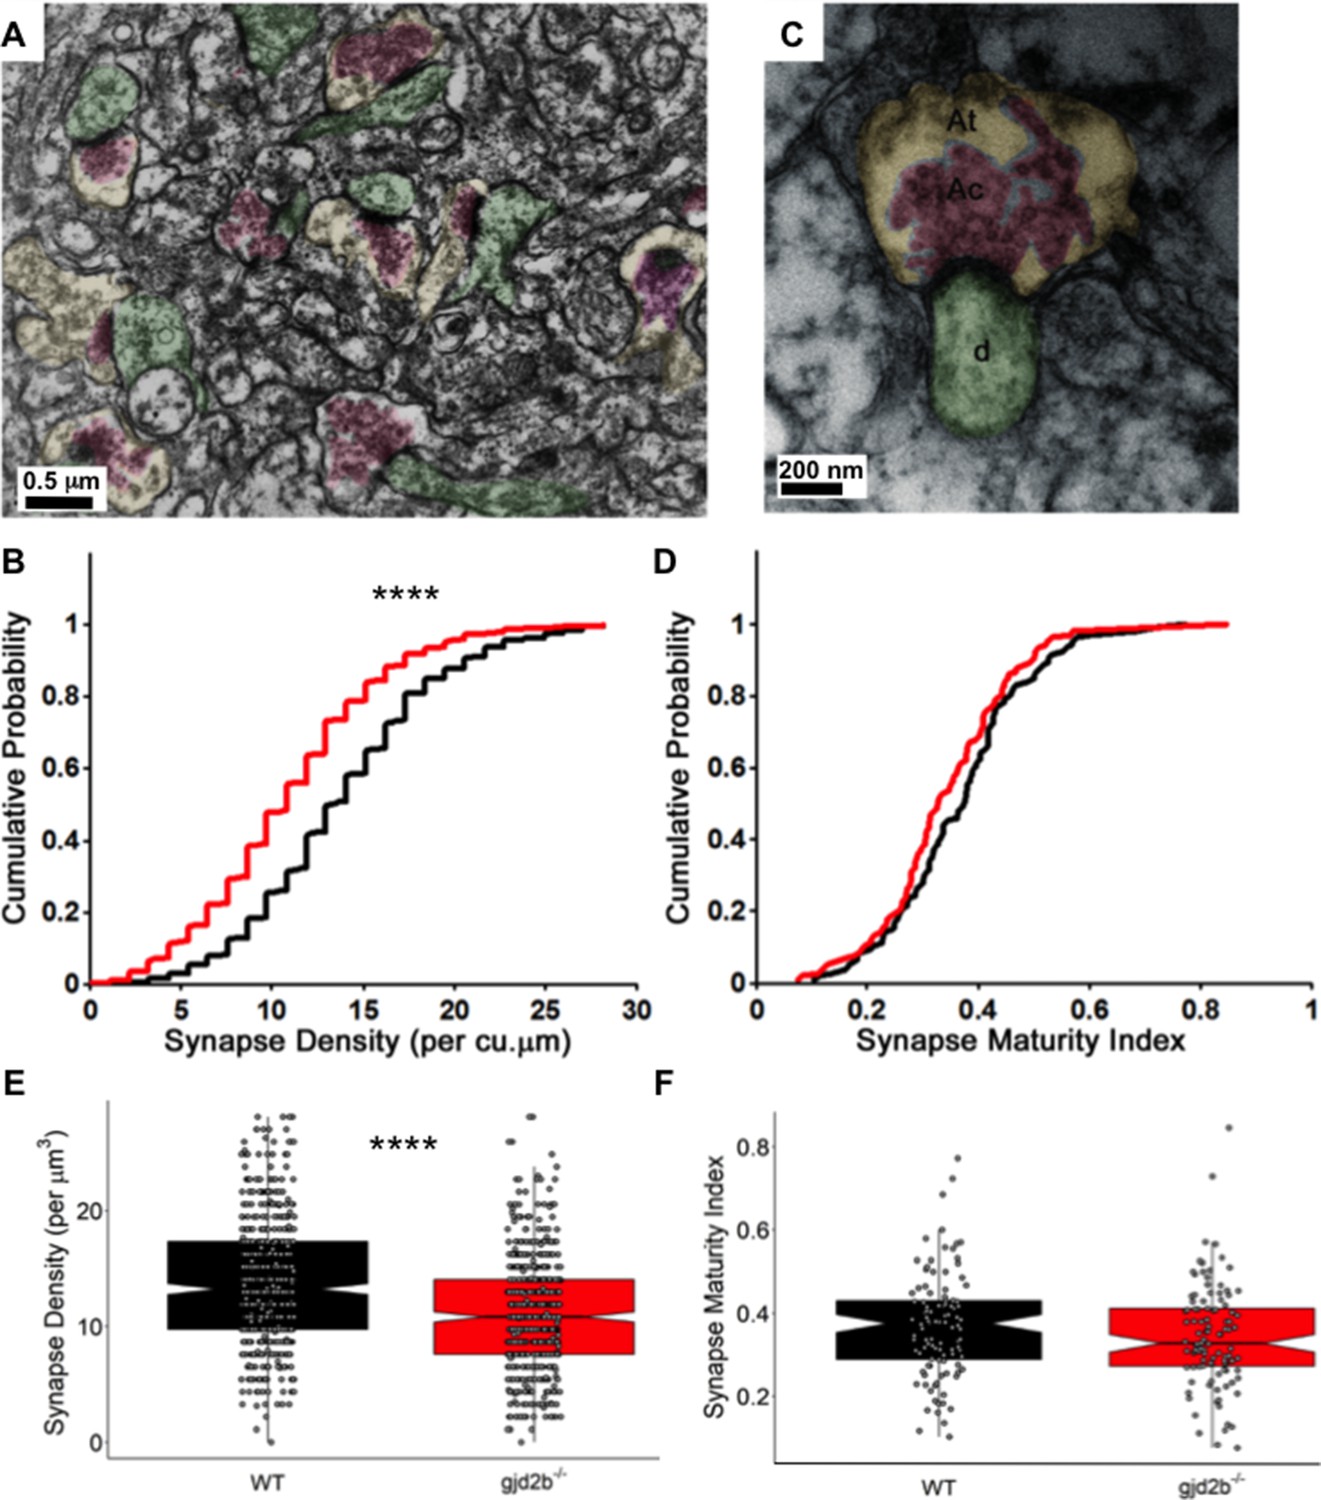
Knocking out Gjd2b leads to reduction in synaptic density in the cerebellar molecular layer.
(A) Transmission electron micrograph illustrating synapses identified using clustered vesicles (pink areas) in presynaptic terminals (yellow areas) apposed to postsynaptic density in dendritic profiles (green areas). (B) Cumulative probability plot and (E) boxplot, showing distribution of synapse density per cubic micrometer in wild type (black) and gjd2b-/- larvae (red). 637 micrographs from three wild-type larvae and 550 micrographs from three mutant larvae were analyzed. ****p<0.0001; Mann–Whitney U test. (C) Transmission electron micrograph at high magnification used for quantification of synapse maturation index. The area occupied by clustered vesicles (pink, Ac) was divided by the total area of the presynaptic terminal (yellow, At) to obtain the maturation index. (D) Cumulative probability plot and (F) boxplot, showing the distribution of synapse maturation indices in wild type (black) and gjd2b-/- larvae. 106 micrographs from three larvae each in wild-type and mutant groups were analyzed. p=0.12, Mann–Whitney U test. See also Supplementary file 1. Data used for quantitative analyses are available in Figure 5—source data 1.
-
Figure 5—source data 1
Synapse density and maturity index data.
- https://cdn.elifesciences.org/articles/68124/elife-68124-fig5-data1-v2.xlsx
Figure 6 with 1 supplement
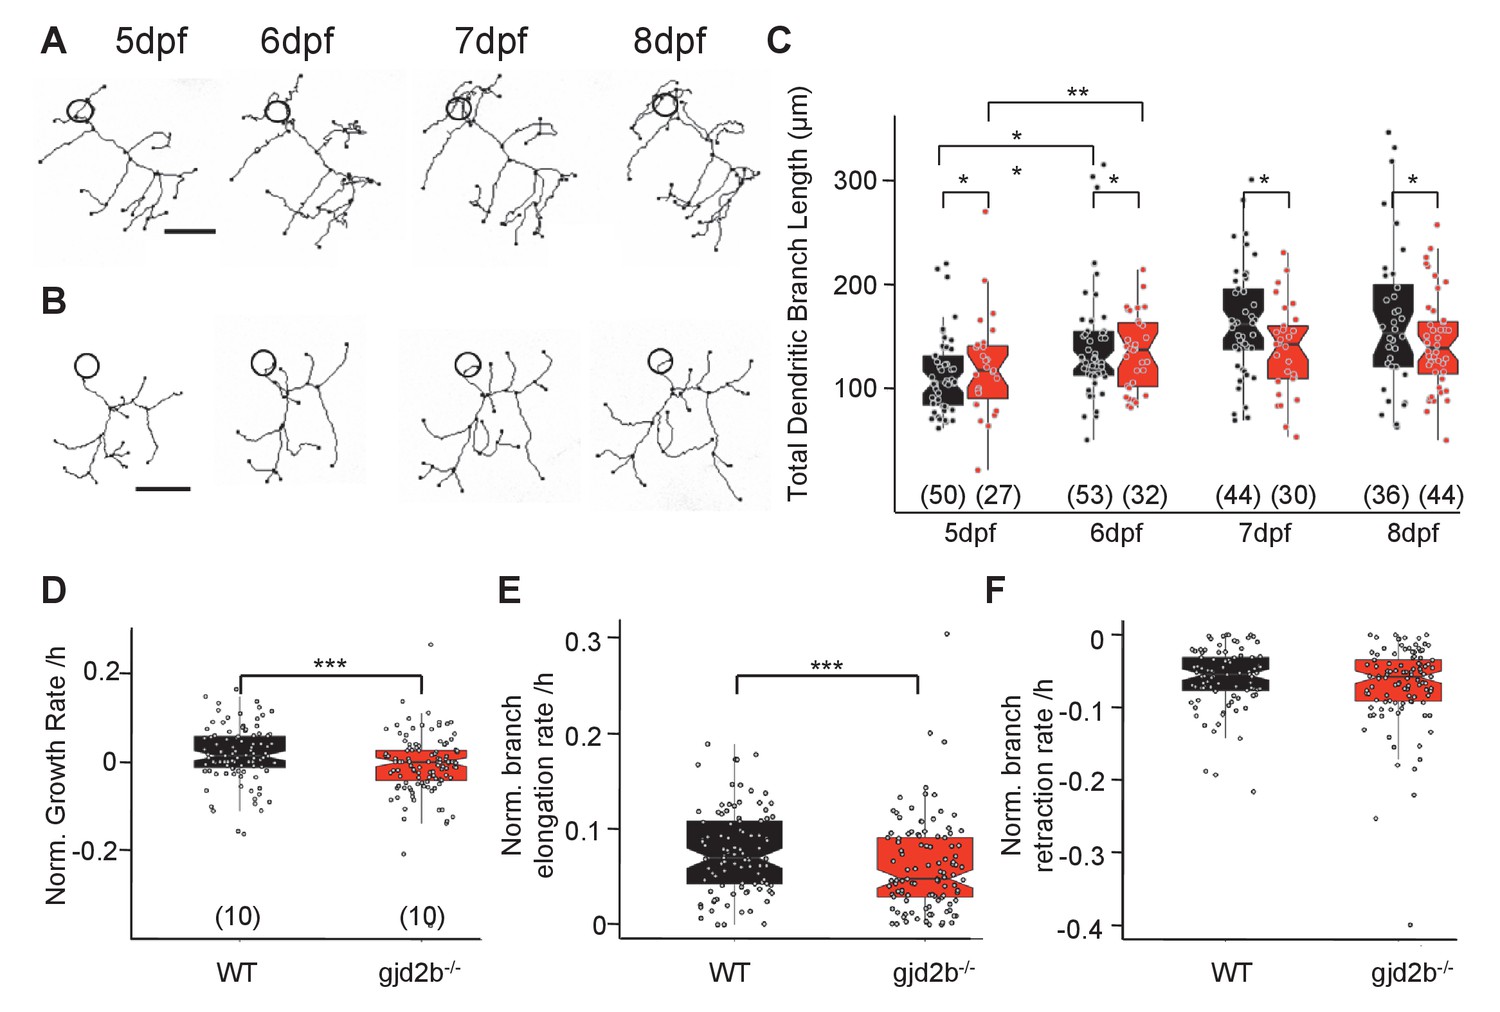
Dendritic arbor growth of gjd2b-/-Purkinje neurons (PNs) is impaired.
(A) Representative traces of a wild-type (WT) PN from 5 to 8 days post fertilization (dpf). (B) Representative traces of a gjd2b-/- mutant PN from 5 to 8 dpf; scale bar is 10 µm; circle represents the position of the soma and is not to scale. (C) Total dendritic branch length (TDBL) of WT (black) and gjd2b-/- (red) PNs from 5 to 8 dpf. WT and gjd2b-/- neurons show significant growth from 5 to 6 dpf (p=0.0021). WT neurons show significantly higher TDBL values at all days (p=0.048). Statistical comparison was done using a general linear model with an inverse Gaussian error distribution. Post-hoc comparisons were done with the emmeans package in R. (D) Average rate of normalized hourly net branch growth in WT and gjd2b-/- PNs at 6 dpf. Mutant neurons show a significantly reduced rate over 10 hr of observation (p=0.005). (E) Rate of branch elongation in WT and mutant PNs at 6 dpf. Mutant PNs show a significantly reduced rate of branch length elongations (p=0.022). (F) Rate of branch length retractions in WT and mutant PNs at 6 dpf. No significant difference is observed between the two groups (p=0.185). Statistical comparisons in (D–F) were done using general linear models with Gaussian error distribution. Ns (number of neurons sampled) are indicated in parentheses in (C–E). See also Figure 6—figure supplement 1. Data used for quantitative analyses are available in Figure 6—source data 1.
-
Figure 6—source data 1
Daily and hourly imaging analysis.
- https://cdn.elifesciences.org/articles/68124/elife-68124-fig6-data1-v2.xlsx
Figure 6—figure supplement 1
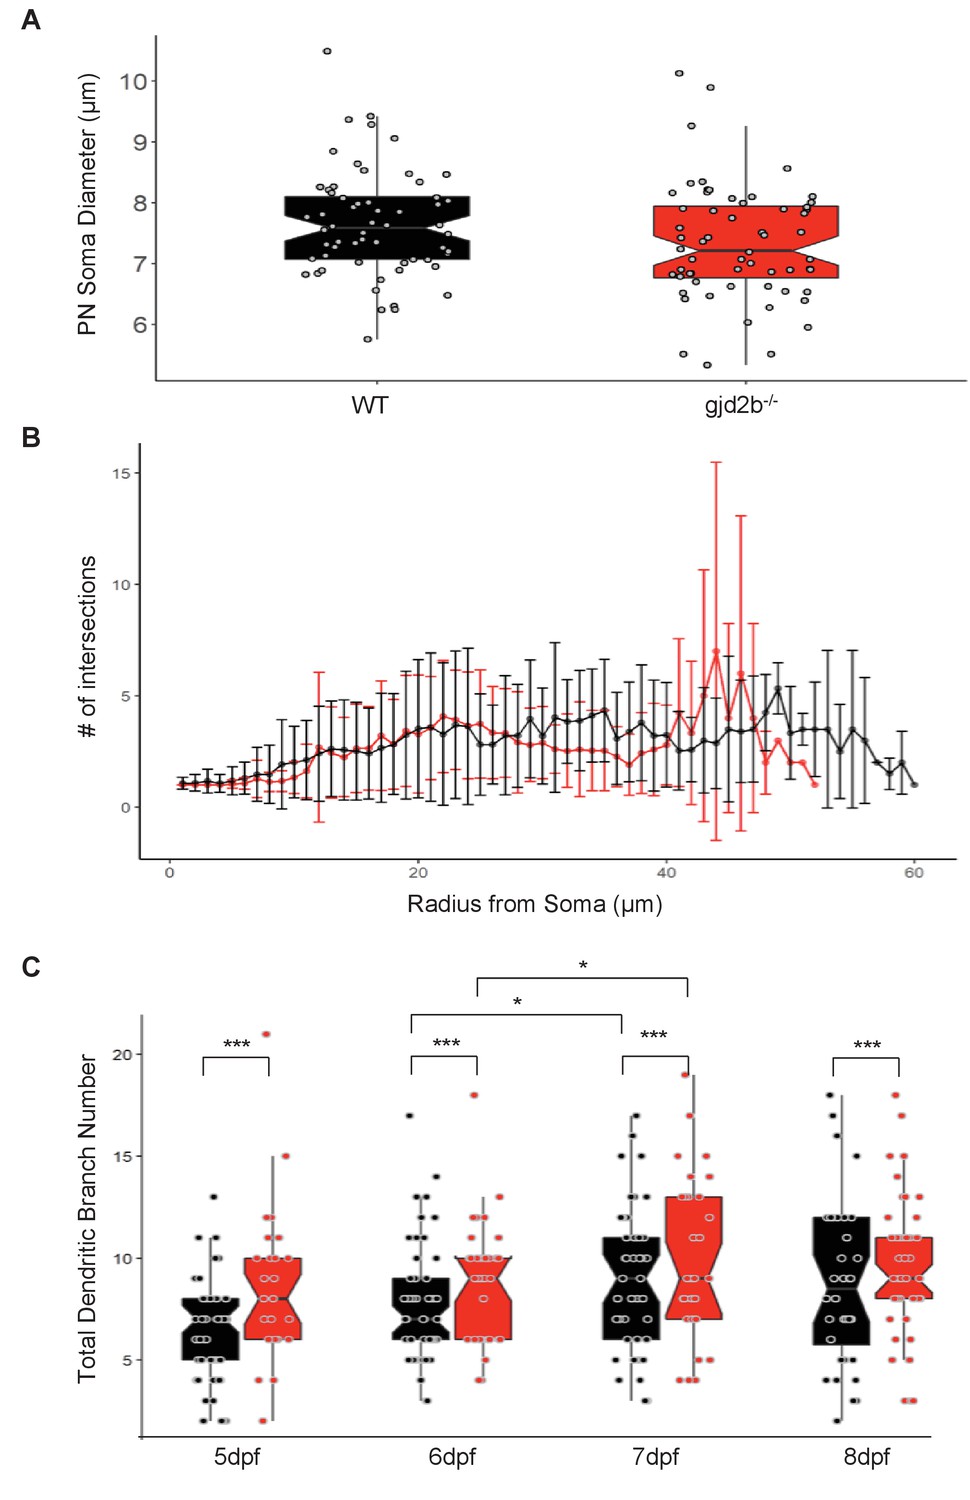
Additional morphometric comparison of Purkinje neurons (PNs) from wild-type (WT) and gjd2b-/- larvae.
(A) Soma diameter of WT (black) and gjd2b-/-(red) PNs do not show any significant difference. [n(WT) = 44, n(gjd2b-/-) = 30] (generalized linear model with inverse Gaussian error distribution, p=0.054). Related to Figure 6. (B) Sholl analysis for WT (black; n = 43) and gjd2b-/- (red; n = 29) neurons at 7 days post fertilization (dpf) showing the average number of dendritic intersections at 1 µm radius steps. (C) Total dendritic branch number (TDBN) for WT (black) and gjd2b-/- (red) PNs from 5 to 8 dpf. WT and gjd2b-/- neurons show significant increase in branch number from 6 to 7 dpf (p=0.0123). Gjd2b-/- neurons show significantly higher TDBN values at all days (p=0.0002). [WT N(5 dpf) = 50 neurons; N(6 dpf) = 53 neurons; N(7 dpf) = 44 neurons; N(8 dpf) = 36 neurons] [gjd2b-/- N(5 dpf) = 27 neurons; N(6 dpf) = 32 neurons; N(7 dpf) = 30 neurons; N(8 dpf) = 44 neurons]. Data used for quantitative analyses are available in Figure 6—source data 1.
Figure 7 with 1 supplement

Expressing Gjd2b in Purkinje neurons (PNs) alone is sufficient to rescue dendritic growth deficits.
(A) Representative image of a zebrafish PN expressing cytoplasmic GFP (green) and Gjd2b tagged with mCherry (magenta) at 7 days post fertilization (dpf); scale bar is 5 µm. (B) Total dendritic branch length (TDBL) of wild type (WT), gjd2b-/-, gjd2b-rescue, and gjd2bΔ5-21 rescue (pore dead variant) PNs at 7 dpf. TDBL of gjd2b-rescue neurons is significantly increased from that of mutant PNs. TDBL of gjd2bΔ5-21 rescue PNs is not significantly different from that of gjd2b-/- PNs. (C) Change in the lengths of WT PN dendritic branches with and without Gjd2b-mCherry expression. Elongation of branches with Gjd2b is significantly more than branches without (p<0.05). Retraction of branches is similar with and without Gjd2b-mCherry puncta (Mann–Whitney U test; N = 7 neurons). (D) Copy number of CaMKII mRNA in WT and gjd2b-/- larvae. The normalized copy number of CaMKII in the mutant group is significantly higher than the WT group (p<0.05). (E) TDBL of WT, untreated gjd2b-/-, 1 µM KN-93 treated, 1 µM KN-92 treated, and 1% DMSO-treated gjd2b-/- PNs at 7 dpf. TDBL of only KN-93-treated gjd2b-/- PNs are rescued to WT levels (WT vs. KN-93, p=0.23), whereas all other groups are significantly different and lower than WT (Kruskal–Wallis, post-hoc comparison with Mann–Whitney test). Ns (number of neurons sampled) are indicated in parentheses in (B) and (D). See also Figure 7—figure supplement 1 and Supplementary file 2. Data used for quantitative analyses are available in Figure 7—source data 1.
-
Figure 7—source data 1
Rescue and Branch dynamics data.
- https://cdn.elifesciences.org/articles/68124/elife-68124-fig7-data1-v2.xlsx
Figure 7—figure supplement 1
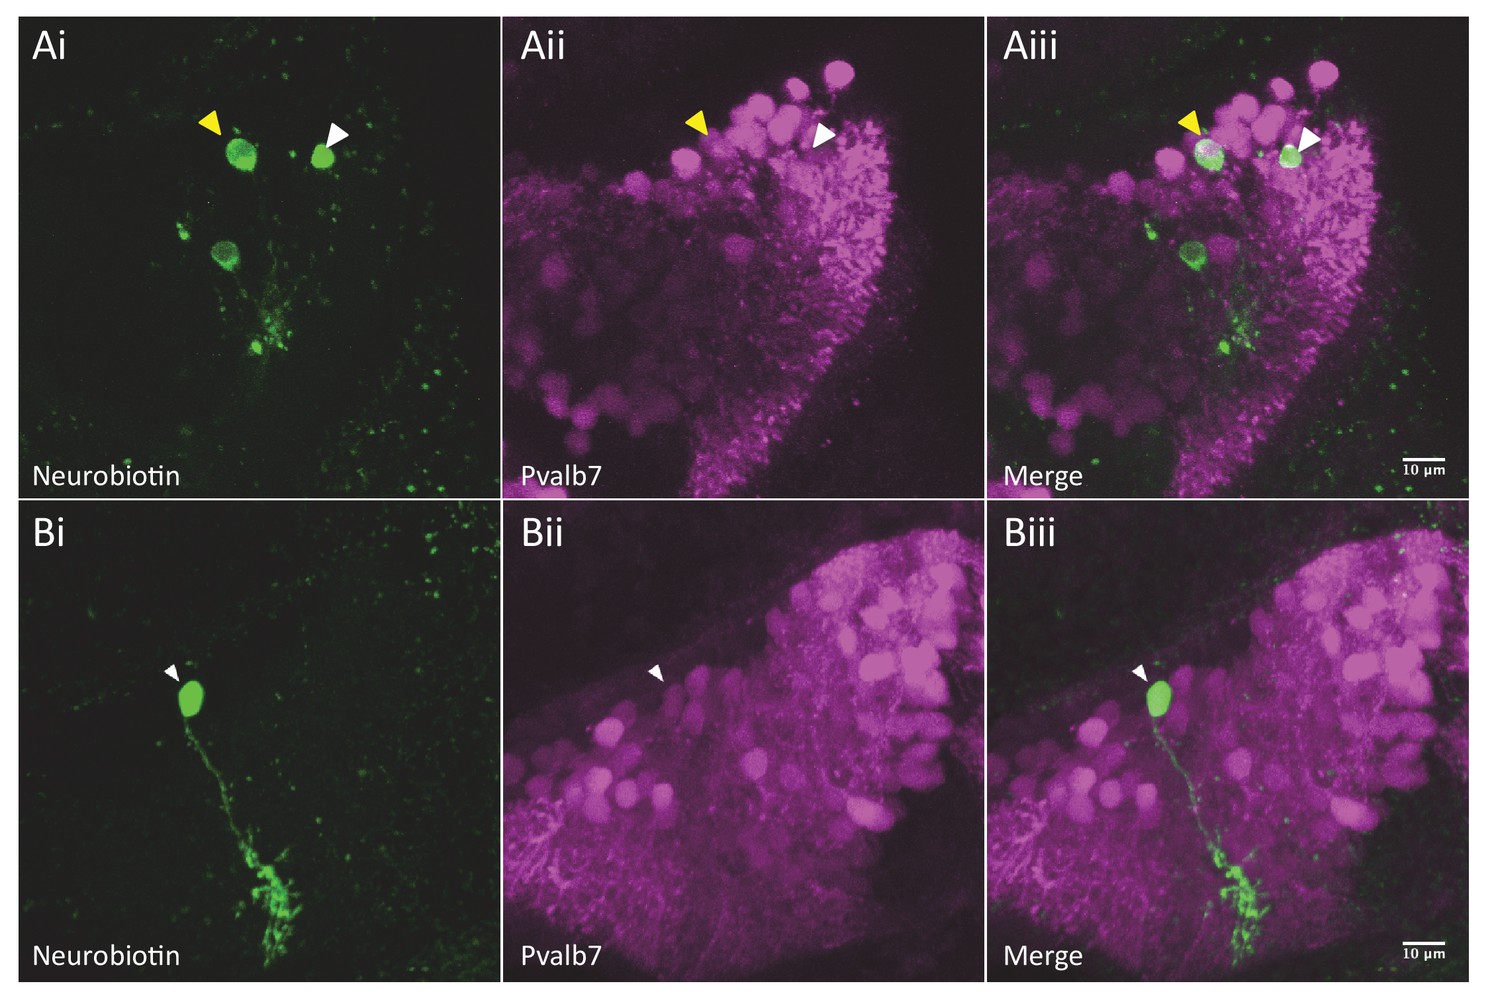
Purkinje neurons (PNs) are dye coupled to other cerebellar cell types via putative rectifying junctions.
(Ai–Aiii) Electroporation of neurobiotin (green) into a non-PN reveals several dye-coupled neurons of which one neuron is also Pvalb7 positive (magenta), indicating that it is a PN. (Bi–Biii) Electroporation of neurobiotin into a PN reveals no other dye-coupled neurons.
Tables
Key resources table
| Reagent type (species) or resource | Designation | Source or reference | Identifiers | Additional information |
|---|---|---|---|---|
| Genetic reagent (Danio rerio) | gjd2bncb215 | This paper | RRID:ZDB-ALT-201215-7 | Gjd2b null zebrafish allele ncb215 |
| Recombinant DNA reagent | aldoca:gap43-Venus | Prof. Masahiko Hibi, Nagoya University, Japan Tanabe et al., 2010 | Microinjected in single-cell zebrafish embryos | |
| Recombinant DNA reagent | Arch:TagRFP-T:PC:GCAMP5G | Dr. Hideaki Matsui, Niigata University, Japan Matsui et al., 2014 | Microinjected in single-cell zebrafish embryos | |
| Recombinant DNA reagent | Ca8-cfos:GFP | This paper | PN enhancer to drive GFP expression | Microinjected in single-cell zebrafish embryos |
| Recombinant DNA reagent | Ca8-cfos:Gjd2b-mCherry | This paper | PN enhancer to drive Gjd2b-mCherry expression | Microinjected in single-cell zebrafish embryos |
| Recombinant DNA reagent | Ca8-cfos:Gjd2b⊗5-21-mCherry | This paper | PN enhancer to drive Gjd2b deletion mutant | Microinjected in single-cell zebrafish embryos |
| Recombinant DNA reagent | pTNT | Promega Corp, Madison, WI | Vector for in vitro transcription | |
| Transfected construct (Danio rerio) | gjd2b-TALEN-1 | This paper | TALEN construct | GAACAGCCATGGGGGAATGGA |
| Transfected construct (Danio rerio) | gjd2b-TALEN-2 | This paper | TALEN construct | GCTGTTGGACAGCCGCCTCCA |
| Commercial assay or kit | T7-mMessage mMachine | Life Technologies | For generating TALEN mRNAs | |
| Antibody | Anti-Cx35/36 (Mouse) | Millipore | Cat# MAB3045 | 1:250 |
| Antibody | Anti-Parvalbumin-7 (mouse) | Millipore | MAB1572 | 1:1000 |
| Antibody | Donkey anti-mouse Alexa Fluor 488 | Invitrogen | A21202 | 1:500 |
| Antibody | Goat anti-rabbit Alexa Fluor 488 | Invitrogen | A21052 | 1:1000 |
| Other | Prolong gold antifade reagent | Molecular Probes | Catalog #P10144 | Mounting reagent |
| Sequence-based reagent | Gjd2b-MO | Gene Tools | Splice block morpholino | 5′ACAACACTTTTTCCCCTCACCTCCC3′ |
| Sequence-based reagent | CTRL | Gene Tools | Control morpholino | 5′ACTAGACTTATTCCCGTGACCTCCC3′ |
| Sequence-based reagent | Gjd2b forward | This paper | PCR primers | 5′GATCGGTACCTCCGAATGAACAGCCAT3′ |
| Sequence-based reagent | Gjd2b reverse | This paper | PCR primers | 5′TAGCGCTAGCAACGTAGGCAGAGTCACTGG3′ |
| Sequence-based reagent | Gjd2b⊗5-21 forward | This paper | PCR primers | 5′ATTGCCATGGGGGAATGGATTGGGAGGATCCTGCTAAC3′ |
| Sequence-based reagent | Gjd2b⊗5-21 reverse | This paper | PCR primers | 5′TAGCGCTAGCAACGTAGGCAGAGTCACTGG3′ |
| Chemical compound, drug | MS-222 (Tricaine) | Sigma-Aldrich | CAS #886862 | |
| Chemical compound, drug | Paraformaldehyde | Alfa Aesar | Catalog #47392-9M | |
| Chemical compound, drug | Tetrodotoxin | Hello Bio | Catalog #1069 | 1 µM |
| Chemical compound, drug | NMDA | Tocris | Catalog #0114 | 10 mM |
| Software | R statistical software | R core team https://www.r-project.org | RRID:SCR_001905 | |
| Software | MATLAB | MathWorks https://www.mathworks.com/products/matlab.html | RRID:SCR_001622 | |
| Software | Clampfit 10.2 | Molecular Devices | RRID:SCR_011323 | |
| Software | Fiji | NIH | http://fiji.sc RRID:SCR_002285 | |
| Software | Quantsoft | Bio-Rad | Version 1.7.4 | |
| Other | QX200 AutoDG Droplet Digital PCR system | Bio-Rad | 1864100 | Equipment |
| Other | LSM 780 confocal microscope | Zeiss | RRID:SCR_020922 | Equipment |
| Other | SP5 point scanning confocal microscope | Leica | Equipment | |
| Other | FV3000 confocal microscope | Olympus | RRID:SCR_017015 | Equipment |
| Other | Ultramicrotome | Power Tome-PC | Equipment | |
| Other | Diamond knife | Electron Microscopy Sciences | ||
| Other | Formavar/Carbon 2 × 1 mm copper or nickel slot grids | Electron Microscopy Sciences | ||
| Other | TECNAI T12 G2Spirit BioTWIN transmission electron microscope | FEI Company | Equipment | |
| Other | Borosilicate glass capillaries | Warner Instruments | OD: 1.5 mm; ID: 0.86 mm | |
| Other | Flaming-Brown P-97 pipette puller | Sutter Instruments | RRID:SCR_020540 | Equipment |
| Other | Bipolar electrode | FHC, Bowdoin | ||
| Other | Multiclamp 700b amplifier | Molecular Devices | RRID:SCR_018455 | Equipment |
| Other | Digidata 1440A digitizer | Molecular Devices | Equipment |
Additional files
-
Supplementary file 1
Fish-level synapse density (mean ± SEM) measurements in wild type and mutants.
- https://cdn.elifesciences.org/articles/68124/elife-68124-supp1-v2.docx
-
Supplementary file 2
Single-cell electroporation into Purkinje neurons (PNs) or non-PNs to identify electrically coupled neurons.
When PNs were electroporated (animal nos. 1–8), no other dye-coupled neurons were detected. When non-PNs were electroporated (animal nos. 9–13), several other dye-coupled cells were seen, of which a couple were PNs. See also Figure 7—figure supplement 1.
- https://cdn.elifesciences.org/articles/68124/elife-68124-supp2-v2.docx
-
Supplementary file 3
A summary of the statistical analysis for data presented in the respective figures.
- https://cdn.elifesciences.org/articles/68124/elife-68124-supp3-v2.docx
-
Supplementary file 4
Summary of experimental manipulations, advantages, caveats, controls for caveats, and conclusions.
- https://cdn.elifesciences.org/articles/68124/elife-68124-supp4-v2.docx
-
Transparent reporting form
- https://cdn.elifesciences.org/articles/68124/elife-68124-transrepform-v2.docx
Download links
A two-part list of links to download the article, or parts of the article, in various formats.
Downloads (link to download the article as PDF)
Open citations (links to open the citations from this article in various online reference manager services)
Cite this article (links to download the citations from this article in formats compatible with various reference manager tools)
Gjd2b-mediated gap junctions promote glutamatergic synapse formation and dendritic elaboration in Purkinje neurons
eLife 10:e68124.
https://doi.org/10.7554/eLife.68124


