Cellular, circuit and transcriptional framework for modulation of itch in the central amygdala
- Washington University Pain Center and Department of Anesthesiology, Washington University School of Medicine, United States
- Medical Scientist Training Program, Washington University School of Medicine, United States
- Neuroscience Program, Washington University School of Medicine, United States
- Department of Pathology & Immunology, Washington University School of Medicine, United States
- Genome Technology Access Center, Washington University School of Medicine, United States
- Department of Biomedical Engineering, University of Washington, United States
- Departments of Anesthesiology and Pharmacology, University of Washington, United States
- Departmentsof Neuroscience and Biomedical Engineering, Washington University School of Medicine, United States
Figures
Figure 1 with 1 supplement
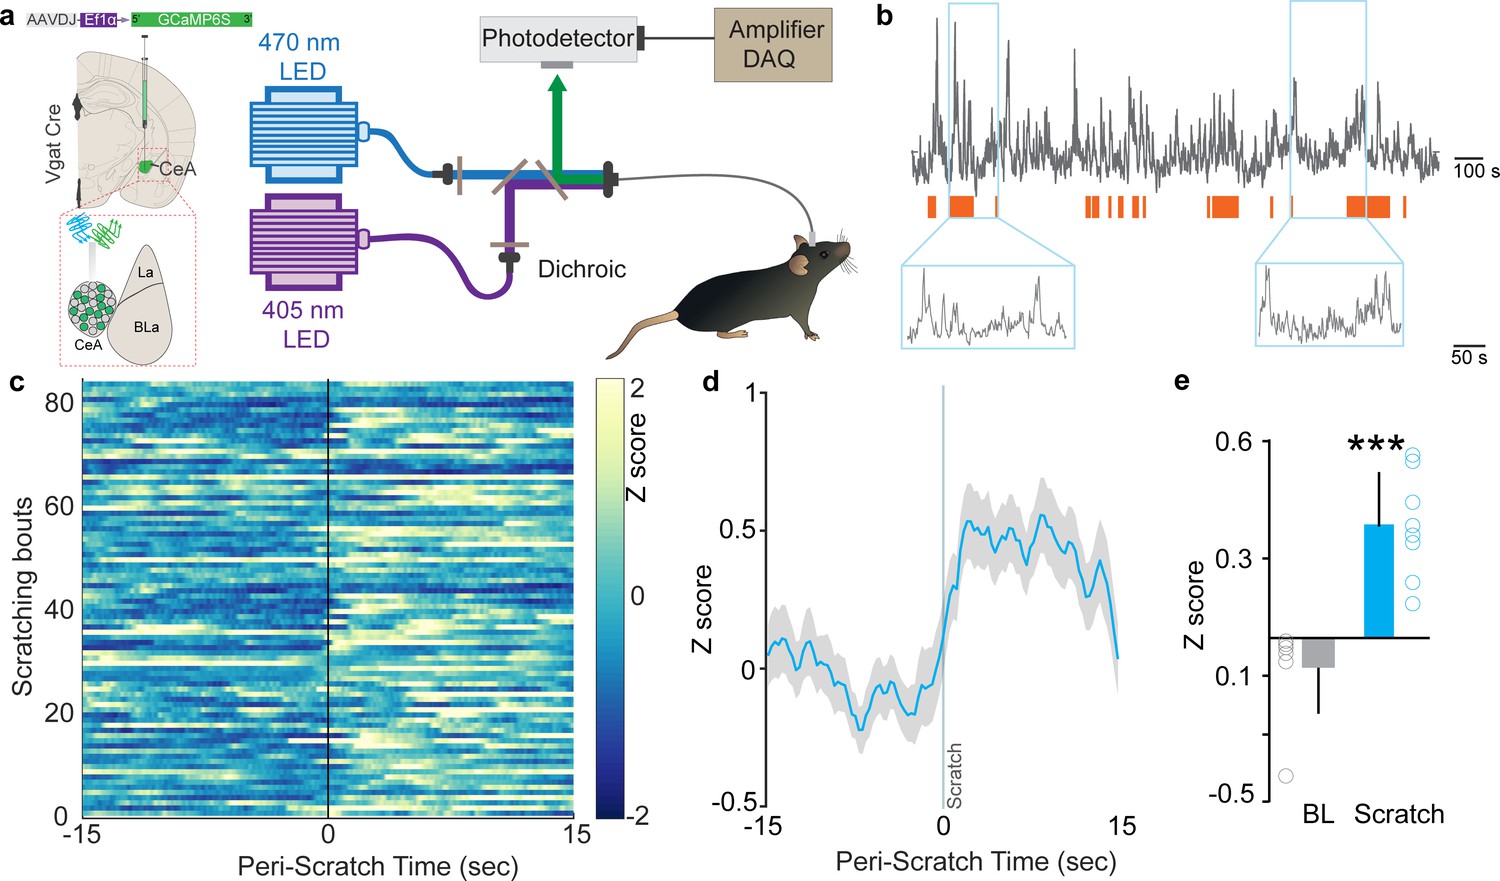
Neural dynamics of itch activated with central amygdala (CeA) neurons.
(a) Scheme demonstrating viral injection strategy and fiber placement to record CeA Vgat neural activity in response to chloroquine. (b) Raw Ca2+ dynamics recorded from CeA Vgat neurons and their relationship to chloroquine-evoked scratching bouts (orange bars). (c) Heatmap showing Ca2+ dynamics of all trials of Vgat+ve vlPAG neurons relative to the initiation of chloroquine-evoked scratching bouts (time zero). (d) Averaged GCaMP6s fluorescence signal of CeA Vgat neurons showing rapid increases in fluorescence on the initiation of scratching bouts. Trace plotted as mean (blue line) ± SEM (gray shading), and the vertical line indicates initiation of scratching bouts. (e) Chloroquine-evoked scratching resulted in a significant increase in CeA Vgat neuronal activity as measured by this change in GCaMP6s fluorescence (N = 8, t test, t = 5.923, df = 14, p<0.0001).
Figure 1—figure supplement 1
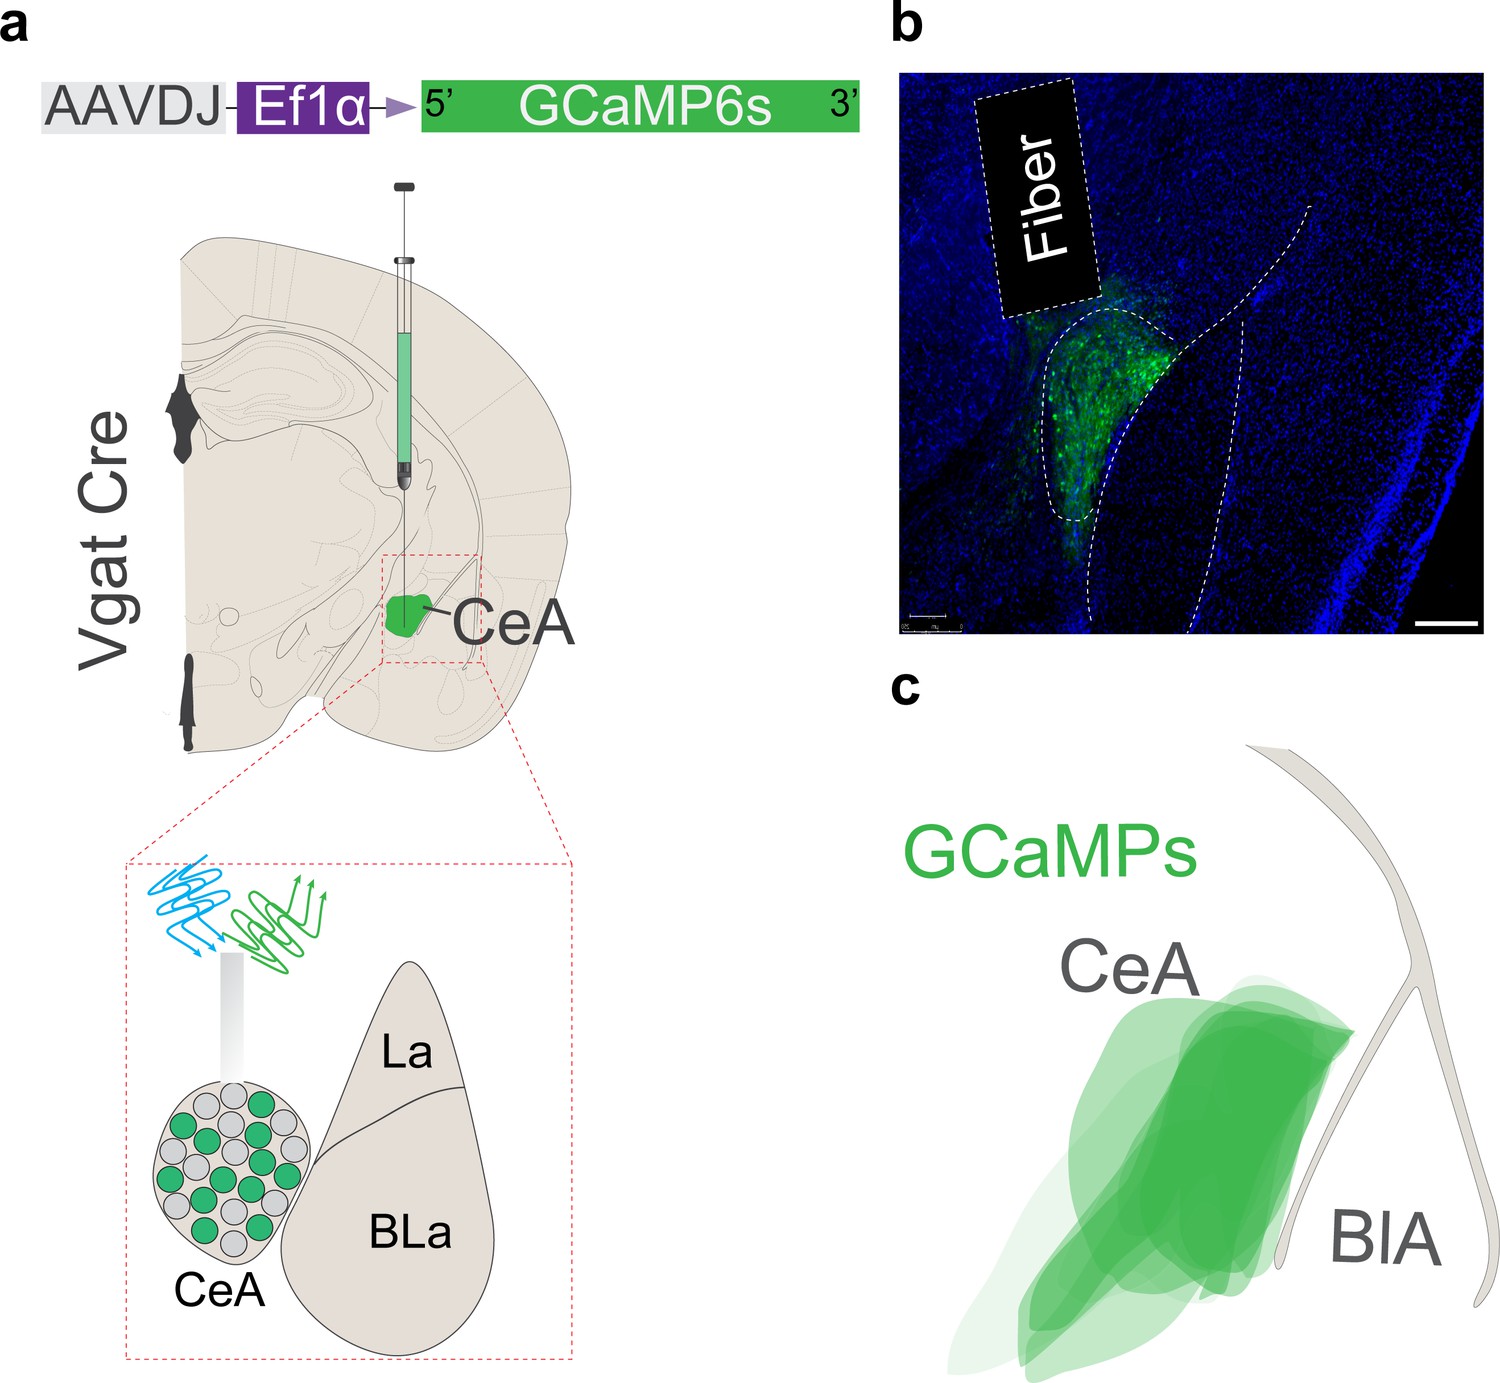
Anatomical location of the GCaMP6s-expressing central amygdala (CeA) neurons and fiber placements for imaging activity during itch behaviors.
(a) Scheme demonstrating viral injection strategy and fiber placement to record CeA Vgat neural activity in response to chloroquine. (b) Representative image of the CeA of Vgat Cre mice in which AAV-DJ-DIO-GCaMP6s is expressed and fiber placement for photometry. Scale bar, 200 μm. (c) Illustration showing the CeA viral spread of AAV-DJ-DIO-GCaMP6S injection.
Figure 2 with 4 supplements
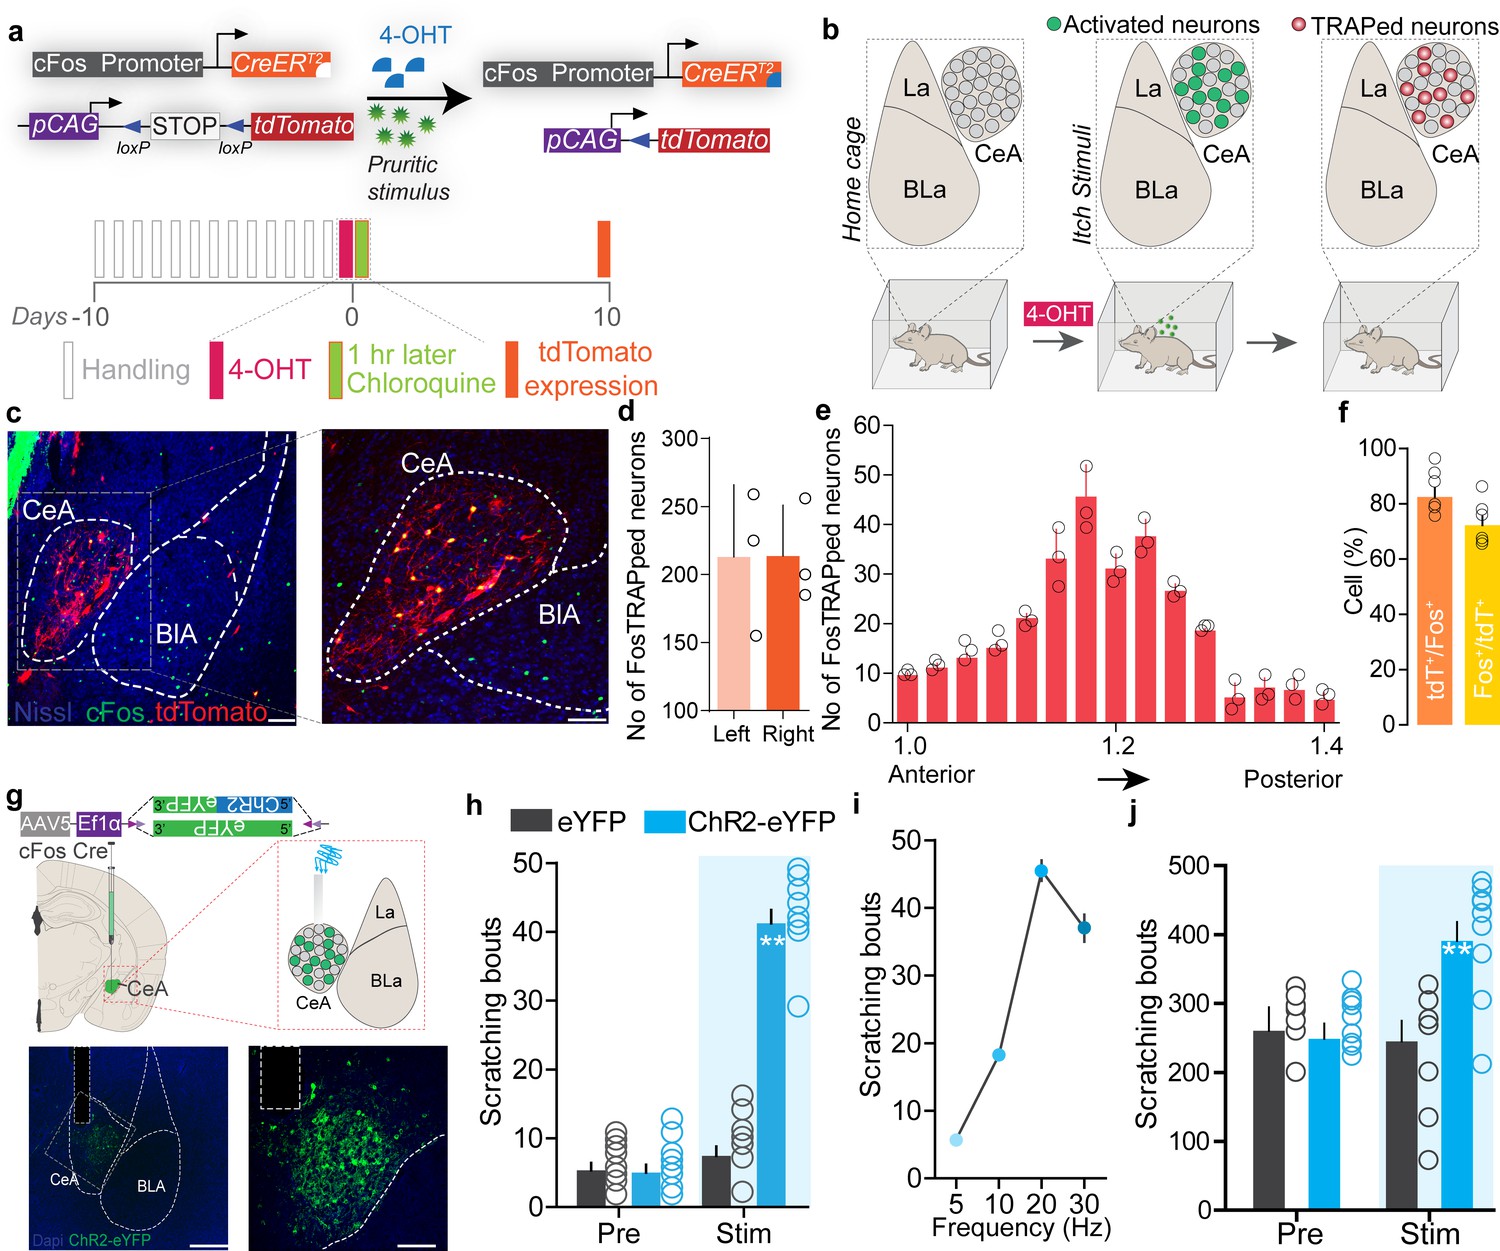
Chloroquine-activated central amygdala (CeA) neurons can drive pruritic behaviors.
(a) FosTRAP strategy to selectively label chloroquine-activated neurons in the CeA. (b) Scheme illustrating experimental strategy. (c) FosTRAPing with chloroquine-evoked scratching produces robust tdTomato expression in the CeA. Colocalization of chloroquine-TRAPed neurons (red) in the CeA with cFos immunoreactivity (green) following a second administration of chloroquine 7 days post. Scale bar = 85 and 250 μm. (d) Quantification of the number of FosTRAPed neurons in left and right CeA after chloroquine injection. n = 3 per group. t test, t = 0.4339, df = 2, p=0.70. (e) Rostro-caudal distribution of chloroquine-TRAPed CeA neurons after chloroquine injection. (f) Colocalization of chloroquine-activated cFos with tdTomato+ve chloroquine-TRAPed neurons. Relative percentages of Fos+ve neurons that are tdTomato+ve and tdTomato+ve neurons that are Fos+ve. n = 6 per group. t test, t = 2.04 df = 10, p=0.048. (g) Scheme to selectively express optogenetic constructs in chloroquine-TRAPed CeA neurons. Illustration and representative section showing fiber optic placement above FosTRAPed CeA neurons expressing ChR2-eYFP (green). Scale bar, 100 μm. (h) Photostimulation (20 Hz) of chloroquine-TRAPed CeA neurons produces robust spontaneous scratching. n = 6–11 per group. Pre vs. Stim, F (1,30) = 3; eYFP vs. ChR2, F (1,14) = 3.24, p=0.0001, ANOVA and Bonferroni's for post hoc tests. (i) Increases in scratching are frequency dependent. n = 6 per group. (j) Optical activation of chloroquine-TRAPed CeA neurons potentiates chloroquine-evoked scratching while no changes were observed in control mice. n = 7 per group. Pre vs. Stim, F (1,12) = 33.15; BL vs. Stim in ChR2, F (1, 6) = 6.915, p=0.0391, ANOVA and Bonferroni's for post hoc tests.
Figure 2—figure supplement 1
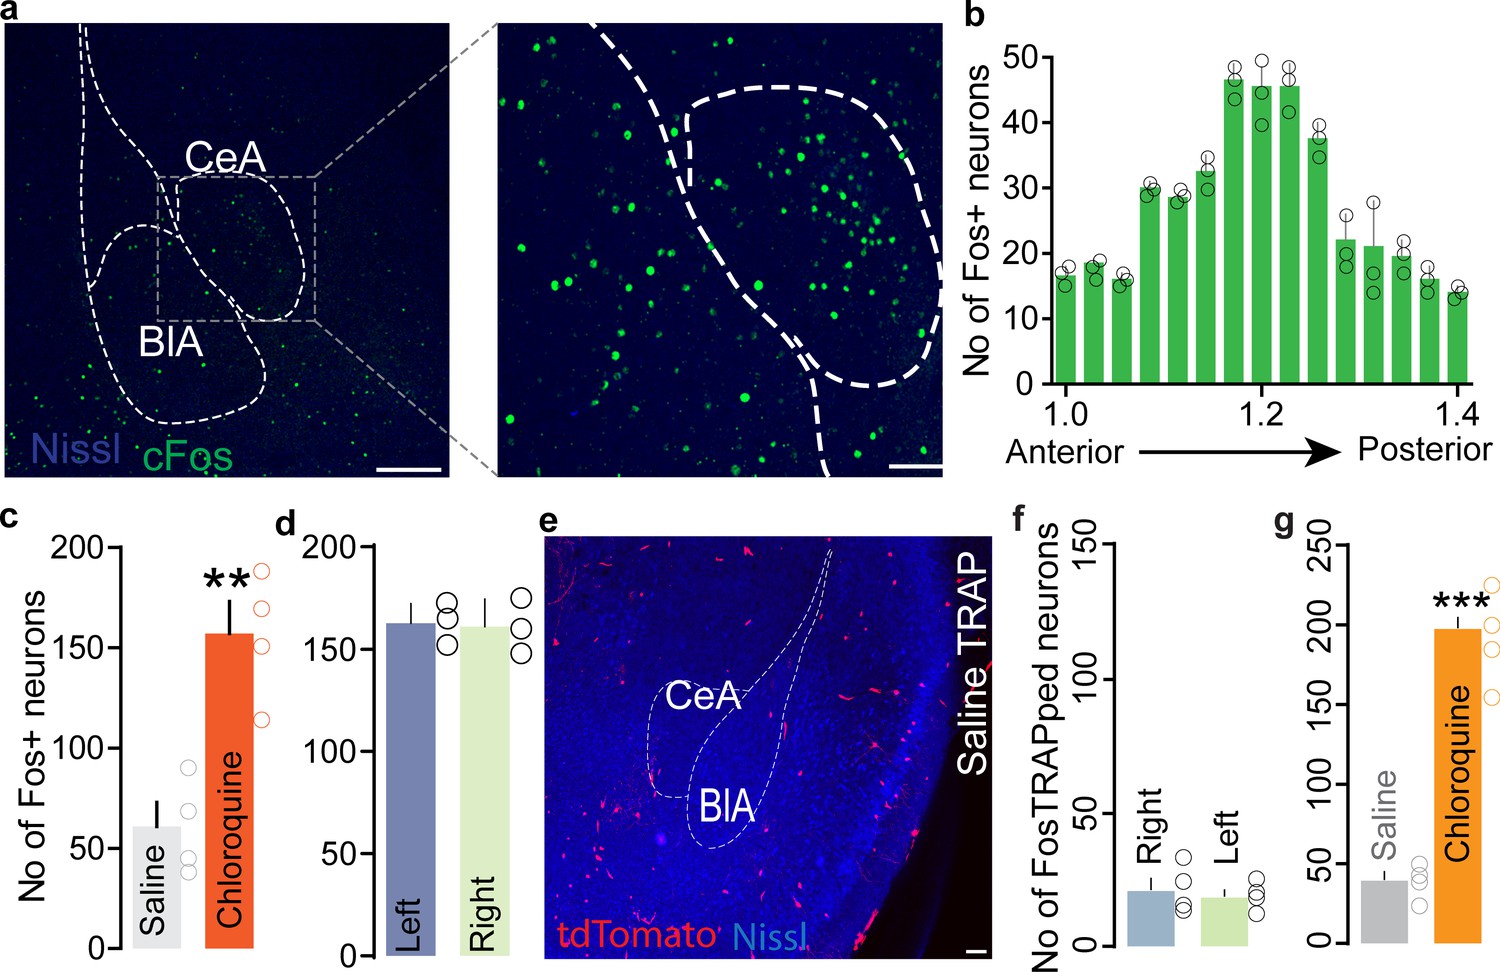
Anatomical location of cFos-expressing (itch-activated) neurons in the central amygdala (CeA) following chloroquine injection in the nape of the neck.
(a) Representative sections showing cFos labeling at low and high magnification following chloroquine injection in the nape of the neck. Scale bar 250 μm in left panel, 50 μm in the right panel. (b) Rostro-caudal distribution of CeA cFos+ ve neurons in CeA. (c) Number of c-Fos+ve neurons in the CeA after administering either saline or chloroquine. n = 4 per group, t = 4.801 df = 6, **p<0.01. (d) Quantification of total number of c-Fos+ve neurons in the left and the right CeA after administering chloroquine stimuli. n = 3 per group, t test, t = 0.01779, df = 4, p=0.9867. (e) FosTRAPing with saline produced very few tdTomato+ve cells. Scale bar, 75 μm. (f) Quantification of total number of saline FosTRAPed neurons in left and right CeA. n = 3 per group, t test, t = 0.188, df = 2, p=0.85. Scale bar, 75 μm. (g) FosTRAPing with chloroquine significantly increased the number of tdTomato+ve neurons compared to saline. n = 3 per group, t test, t = 3.155, df = 6, ***p<0.001.
Figure 2—figure supplement 2
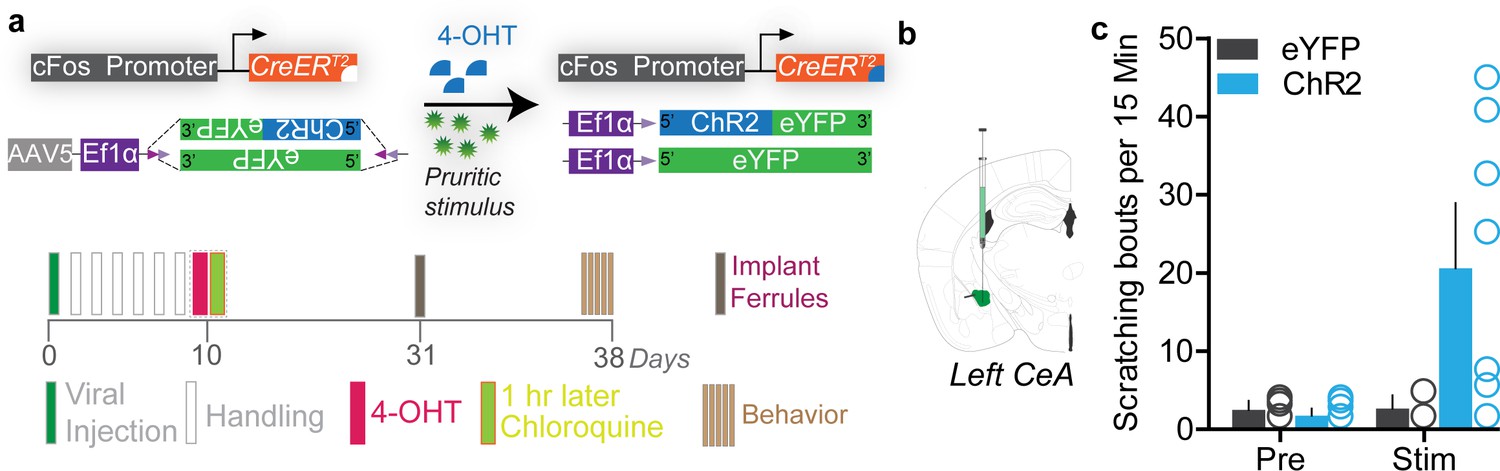
Optogenetic reactivation of itch-TRAPed neurons in the left central amygdala (CeA) neurons promotes scratching.
(a) Viral strategy to selectively express ChR2 or eYFP in chloroquine-activated neurons of the left CeA. Experimental timeline to FosTRAP ChR2/eYFP in CeA. (b) Viral strategy to selectively express optogenetic constructs in CeA FosTRAPed neurons. (c) Photostimulation of chloroquine-activated neurons in the left CeA produces significant scratching in ChR2 FosTRAPed mice, but not in eYFP FosTRAPed controls. n = 6–8 per group, p<0.05, ANOVA and Bonferroni's for post hoc tests.
Figure 2—figure supplement 3
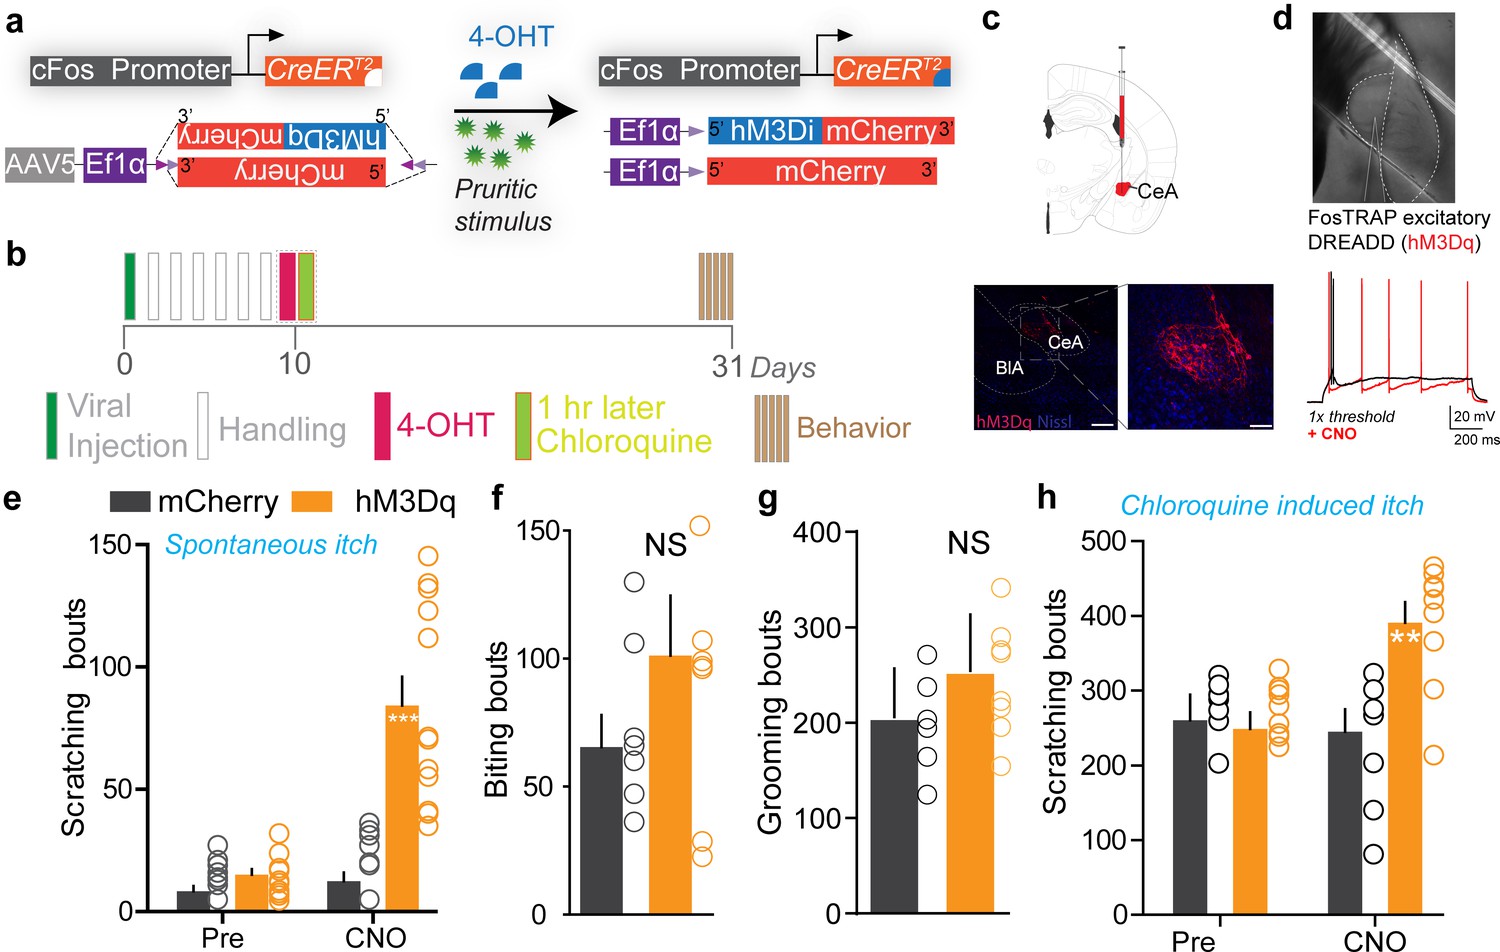
Chemogenetic activation of the central amygdala (CeA) neurons promotes itch behaviors.
(a) Viral strategy to selectively express excitatory DREADDs in chloroquine-activated CeA neurons. (b) Experimental timeline to FosTRAP DREADDs in CeA. (c) Representative section showing CeA FosTRAPed neurons expressing hM3Dq-mCherry (red). Scale bar, 300 μm. (d) IR DIC image of CeA FosTRAPed neurons expressing hM4Di-mCherry. In hM4Di+ve CeA neurons, clozapine N-oxide (CNO) bath application increased neuronal excitability in response to a 1 s current injection at 1× rheobase. Black trace is pre-CNO, red trace is after bath application of CNO (10 μM). (e) Chemogenetic activation of CeA chloroquine-TRAPed neurons significantly increases spontaneous scratching. CNO had no effect on chloroquine-evoked scratching in mice expressing mCherry. n = 8–11 per group, p=0.0001, ANOVA and Bonferroni's for post hoc tests. Chemogenetic activation of CeA chloroquine-TRAPed neurons had no significant effects on biting (f) or grooming behaviors (g). t test, n = 7–8 per group, n-0.0641 for biting, t test, n = 7–8 per group, n-0.141 for grooming. (h) Chemogenetic activation of CeA chloroquine-TRAPed neurons potentiates chloroquine-evoked scratching. CNO had no effect on chloroquine-evoked scratching in mice expressing mCherry. n = 9 per group, p=0.0039, ANOVA and Bonferroni's for post hoc tests.
Figure 2—figure supplement 4
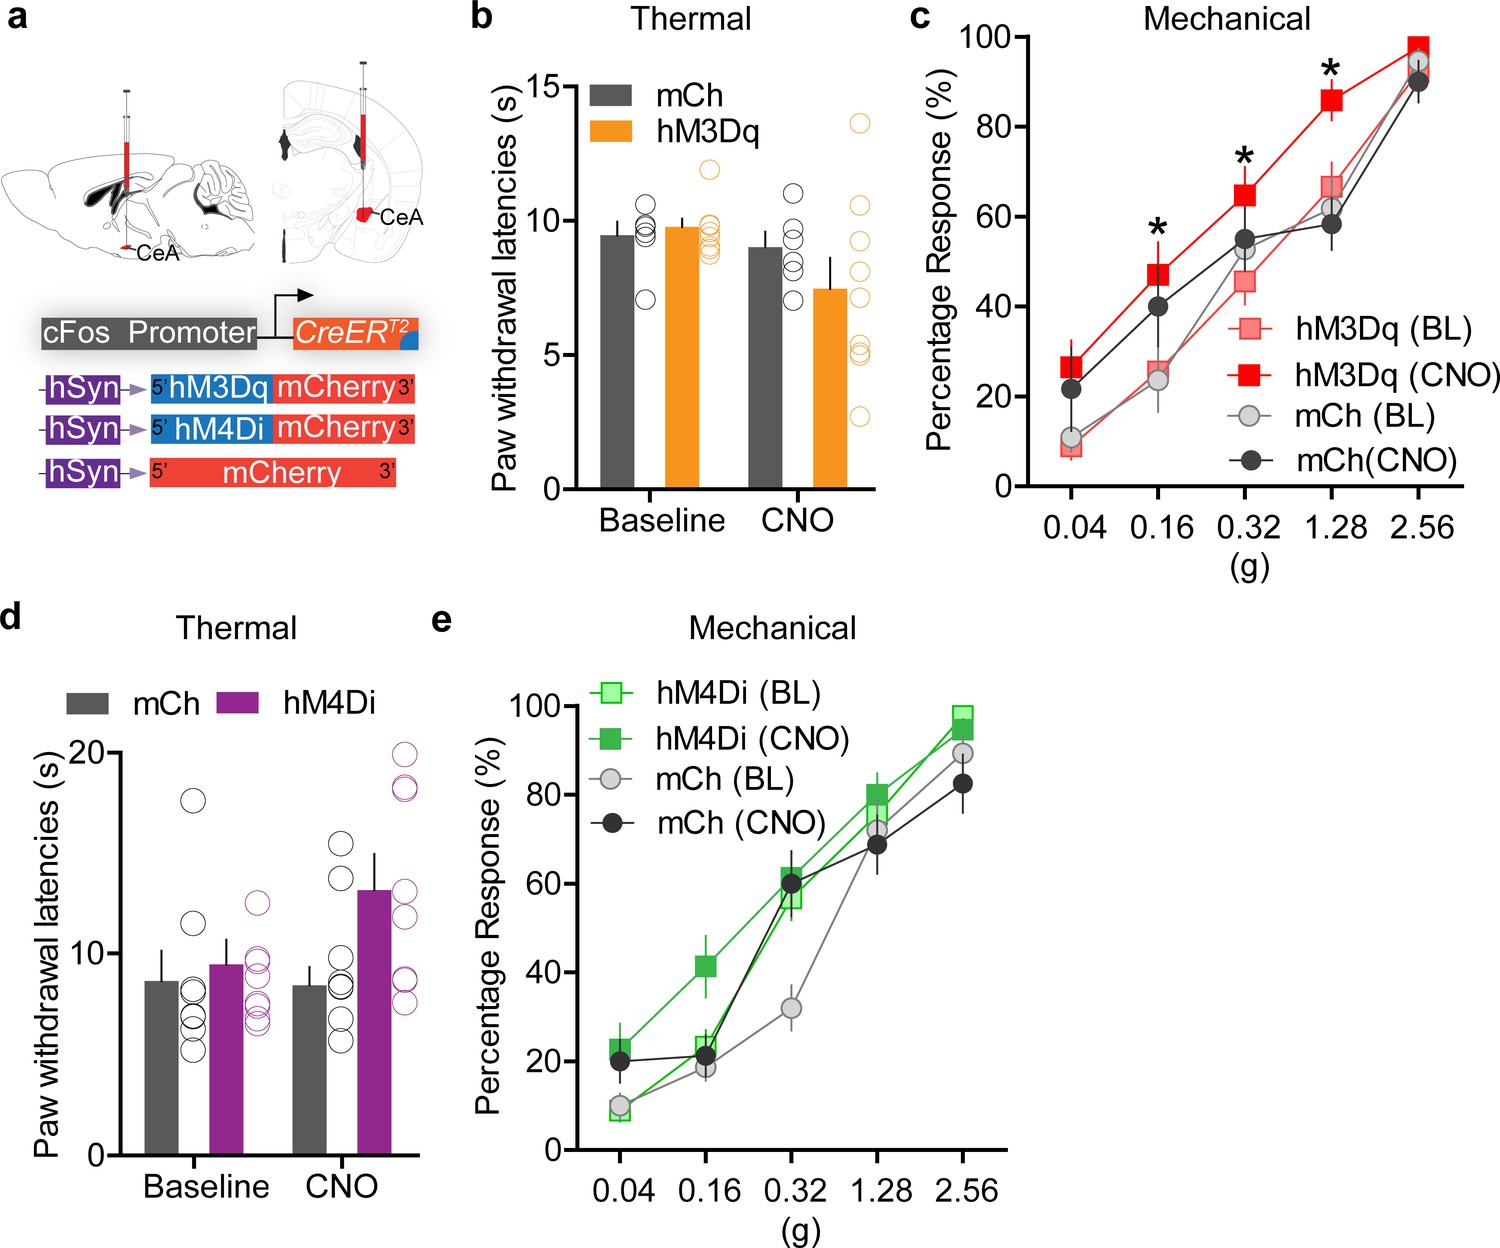
Chemogenetic manipulation of FosTRAPed central amygdala (CeA) neurons modulates nociceptive behaviors.
(a) Viral strategy to selectively express excitatory and inhibitory DREADDs in itch-activated CeA neurons. (b) Chemogenetic activation of chloroquine-TRAPed CeA neurons does not significantly alter thermal paw withdrawal latencies. n = 7–9 per group, p=0.46, but significantly increases paw withdrawal sensitivity to mechanical (von Frey) stimulation (c). n = 7–9 per group, *p<0.05, ANOVA and Bonferroni's for post hoc tests. Chemogenetic inhibition of chloroquine-TRAPed CeA neurons has no significant effect on thermal (d) or mechanical (e) sensitivity. n = 7–9 per group, p=0.22 and p=0.38, ANOVA and Bonferroni's for post hoc tests.
Figure 3 with 3 supplements
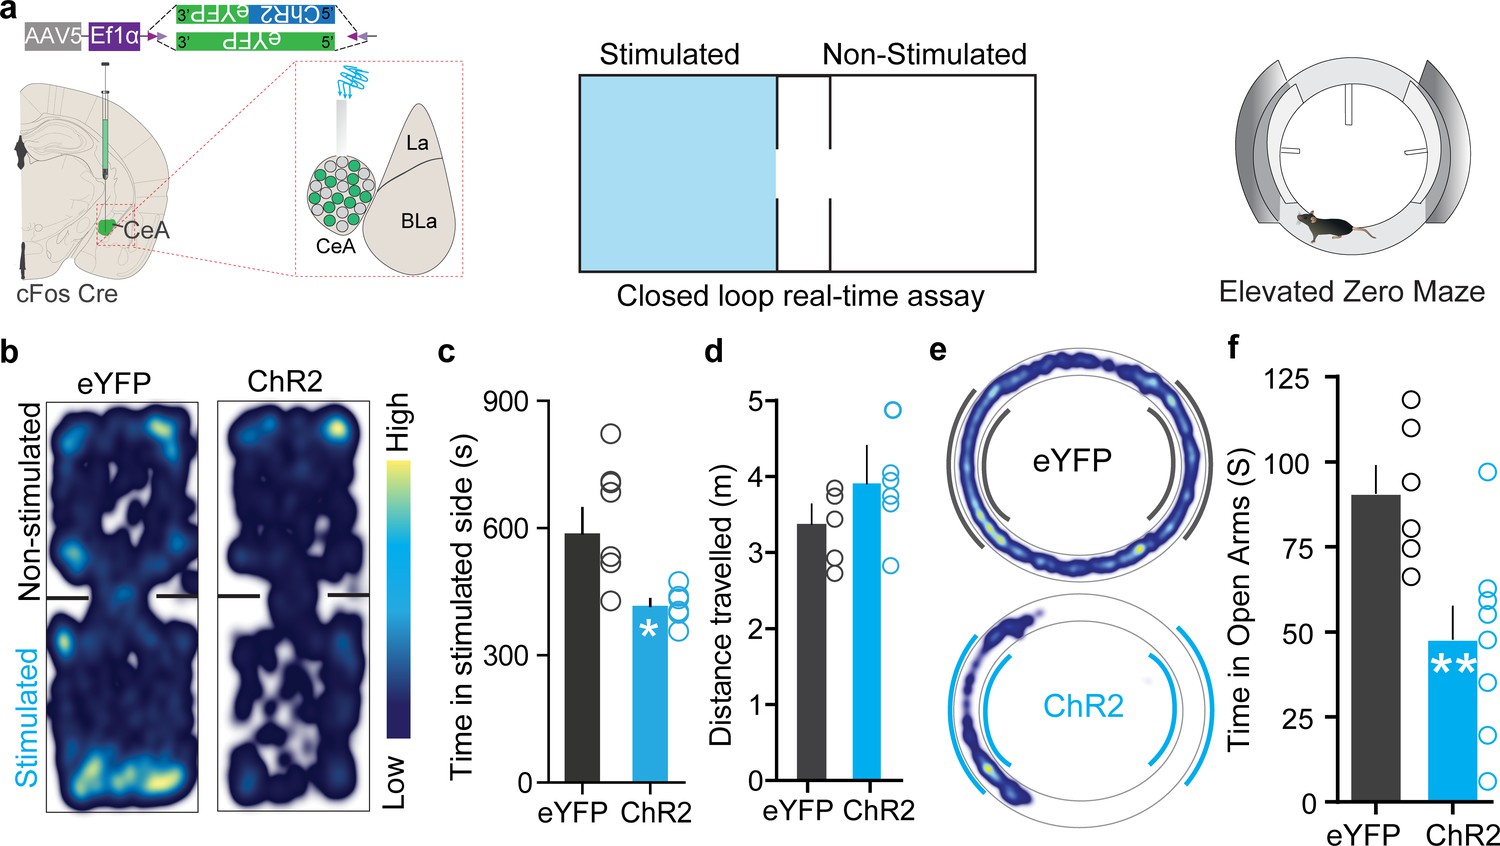
Chloroquine-activated central amygdala (CeA) neurons are negatively reinforcing.
(a) Illustration of strategy to express ChR2/eYFP selectively in chloroquine-TRAPed neurons of the CeA. Experimental schematic of closed loop real-time assay and elevated zero maze (EZM). (b) Real-time place aversion assay with spatial location heatmaps of ChR2 and eYFP mice during closed loop optical stimulation. (c) Total time spent and (d) distance traveled in the photostimulation-paired chamber for ChR2 and eYFP mice. n = 7 per group, t test, t = 2.806, df = 12, p=0.0159, t test, t = 0.7510, df = 12, p=0.4142. (e) Representative occupancy heatmap showing spatial location in the EZM of a control mouse (eYFP) and a mouse injected with DIO-ChR2. (f) Optogenetic activation of chloroquine-TRAPed CeA neurons causes a significant reduction in time spent in open arms in EZM. Light stimulation was delivered entire time mice were on EZM n = 6–10 per group. t test, t = 5.922, df = 12, p=0.0086.
Figure 3—figure supplement 1
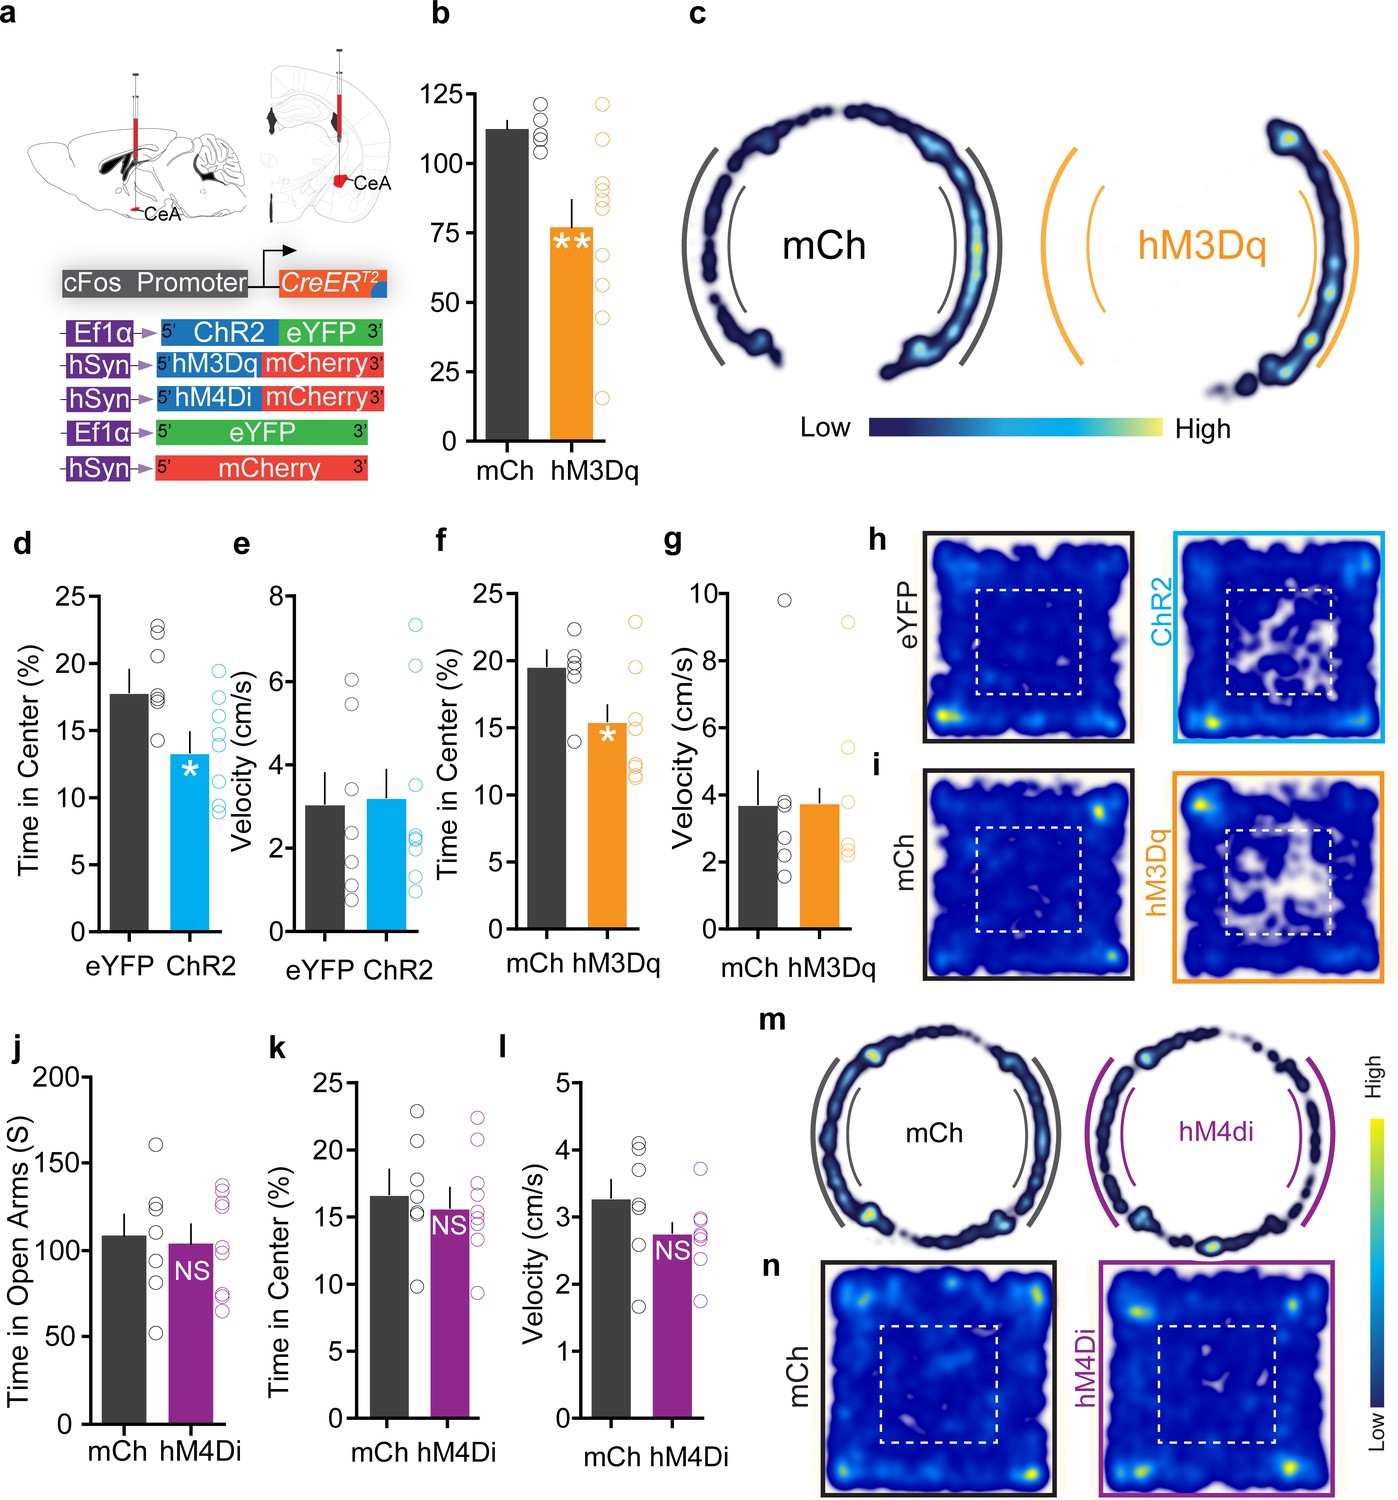
Optogenetic and chemogenetic activation of FosTRAPed central amygdala (CeA) neurons causes anxiety but no freezing, whereas inhibition of these neurons does not affect anxiety state.
(a) Viral strategy to selectively express various constructs in chloroquine-activated CeA neurons. (b) Chemogenetic activation of chloroquine-TRAPed CeA neurons significantly reduces time spent in open arms in an elevated zero maze (EZM). n = 6–10 per group. t test, t = 2.439, df = 14, p=0.029. (c) Representative occupancy heatmap showing spatial location of a control mouse (mCh) and a mouse injected with DIO-hM3Dq in the EZM. (d) Optogenetic and (f) chemogenetic activation of chloroquine-TRAPed CeA neurons causes a significant decrease in time spent in center in the open-field test (OFT). n = 7–10 per group. t test, t = 2.86, df = 14, p=0.012, for optogenetic group and n = 6–10 per group. t test, t = 2.331, df = 14, p=0.036 for chemogenetic group. (e, g) Optogenetic and chemogenetic activation of chloroquine-TRAPed CeA neurons had no effect on mean velocity in the OFT. n = 7–10 per group. t test, t = 0.4346, df = 13, p=0.67, for optogenetic group and n = 6–10 per group. t test, t = 1.043, df = 14, p=0.31 for chemogenetic group. (h, i) Representative occupancy heatmap showing spatial location of a control mouse (eYFP, mCh) and a mouse injected with DIO-ChR2 and DIO-hM3Dq in the OFT. (j) Chemogenetic inhibition of chloroquine-TRAPed CeA neurons has no effect on time spent in open arms in EZM, n = 7–9 per group. t test, t = 0.18, df = 14, p=0.70; and (k) time spent in center in OFT. n = 7–9 per group. t test, t = 0.39, df = 14, p=0.85 (l) Chemogenetic inhibition of chloroquine-TRAPed CeA neurons has no effect on mean velocity of mice in OFT. n = 8–9 per group. t test, t = 1.59, df = 15, p=0.13. (m, n) Representative occupancy heatmap showing spatial location of a control mouse (mCh) and mouse injected with DIO-hM4Di in the EZM and OFT. n = 8–9 per group.
Figure 3—figure supplement 2
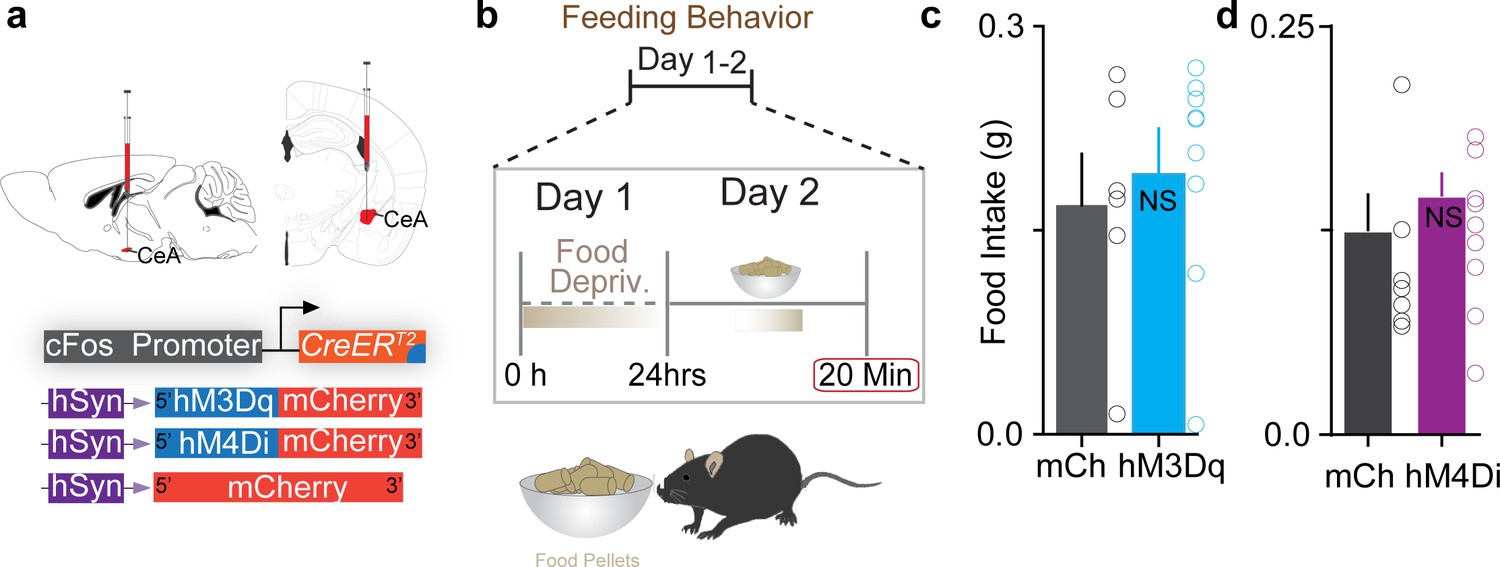
Chemogenetic manipulation of FosTRAPed central amygdala (CeA) neurons does not affect feeding behaviors.
(a, b) Viral constructs used and schematic of experimental timeline. Chemogenetic activation (c) or inhibition (d) of chloroquine-TRAPed CeA neurons has no effect on food intake. n = 6–9 per group. t test, t = 0.52, df = 13, p=0.60 for activation; n = 7–9 per group. t test, t = 0.67, df = 14, p=0.50 for inhibition.
Figure 3—figure supplement 3
Chemogenetic manipulation of FosTRAPed central amygdala (CeA) neurons does not affect reward-seeking behaviors.
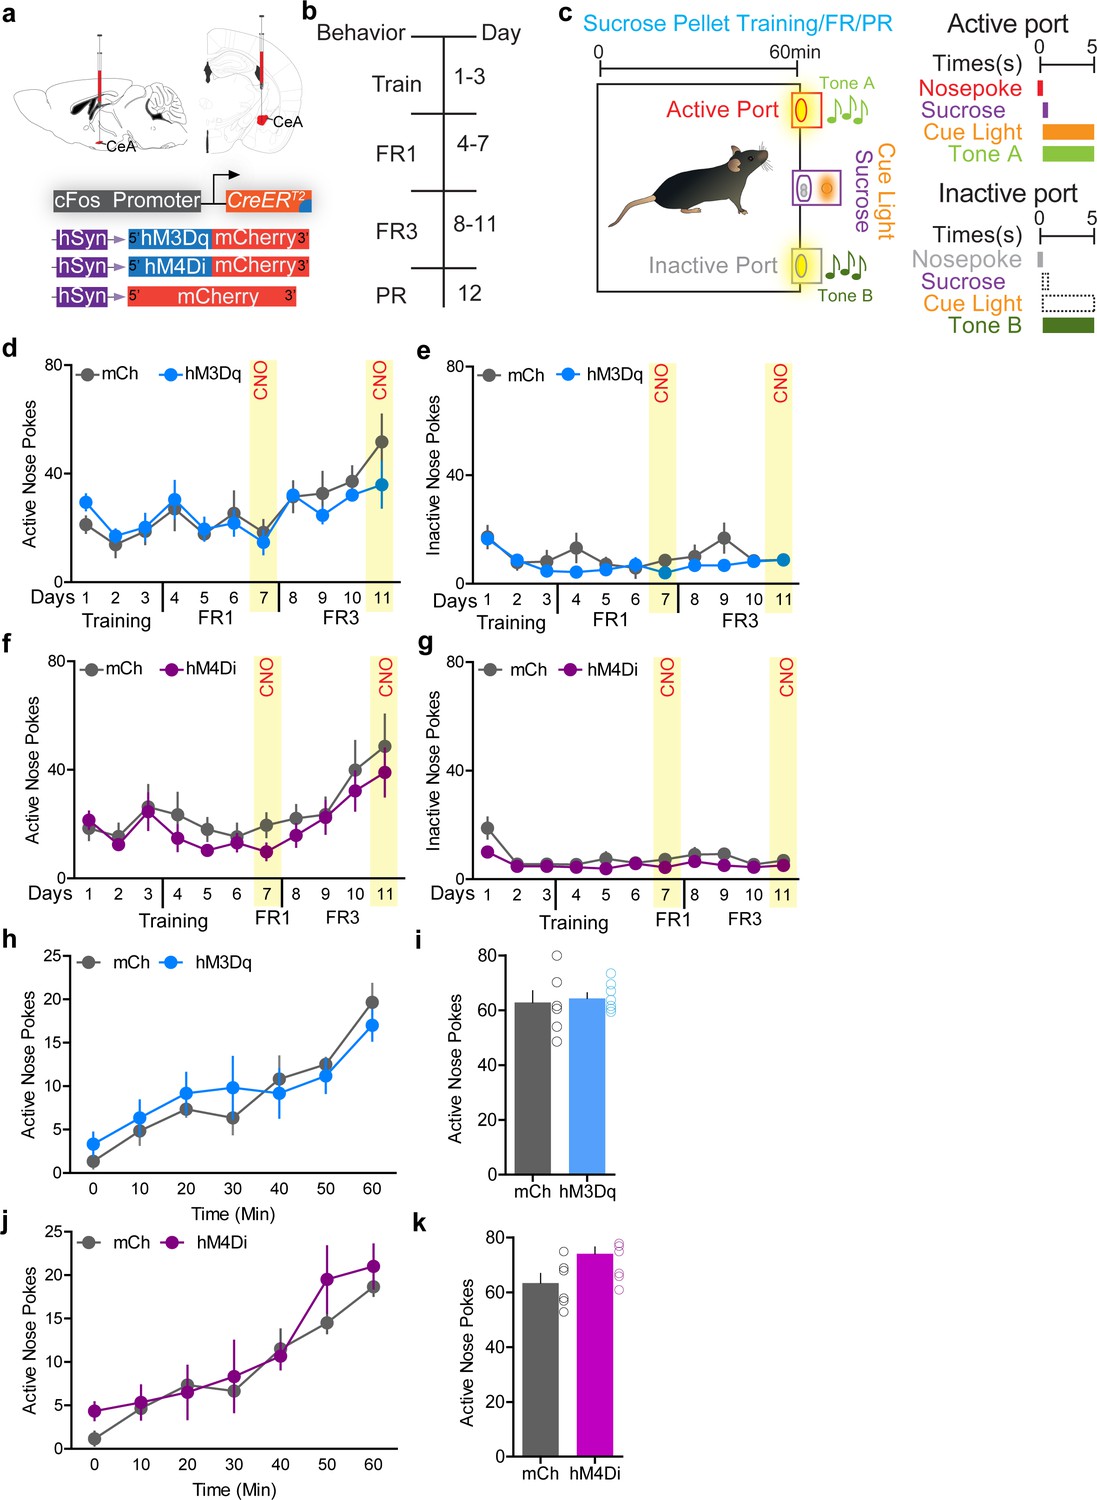
(a) Viral strategy to selectively express excitatory and inhibitory DREADDs in itch-activated CeA neurons. (b) Experimental timeline (FR1 = fixed ratio 1; FR3 = fixed ratio 3; PR = progressive ratio). (c) Sucrose pellet training paradigm. Chemogenetic activation (d, e) and inhibition (f, g) of chloroquine-TRAPed CeA neurons does not alter performance in FR1 or FR3 paradigms where nose pokes are used to obtain sucrose pellets. Activation of these neurons also has no effect on the number of inactive nose pokes. For activation (n = 8–9 per group, F(6,60) = 5.95, p=0.28 for active nose pokes and F(6,60) = 1.25, p=0.95 for inactive nose pokes) and for inhibition (n = 7–9 per group, F(6,84) = 1.23, p=0.73 for active nose pokes and F(6,84) = 8.20, p=0.11 for inactive nose pokes), ANOVA and Bonferroni's for post hoc tests. (h–k) Chemogenetic activation/inhibition of chloroquine-TRAPed CeA neurons has no effect on performance in the sucrose progressive ratio (PR) schedule, and also has no effect on the number of inactive nose pokes (not shown). t test, t = 1, df = 10, p=0.62, t test, t = 1.63, df = 10, p=0.13.
Figure 4
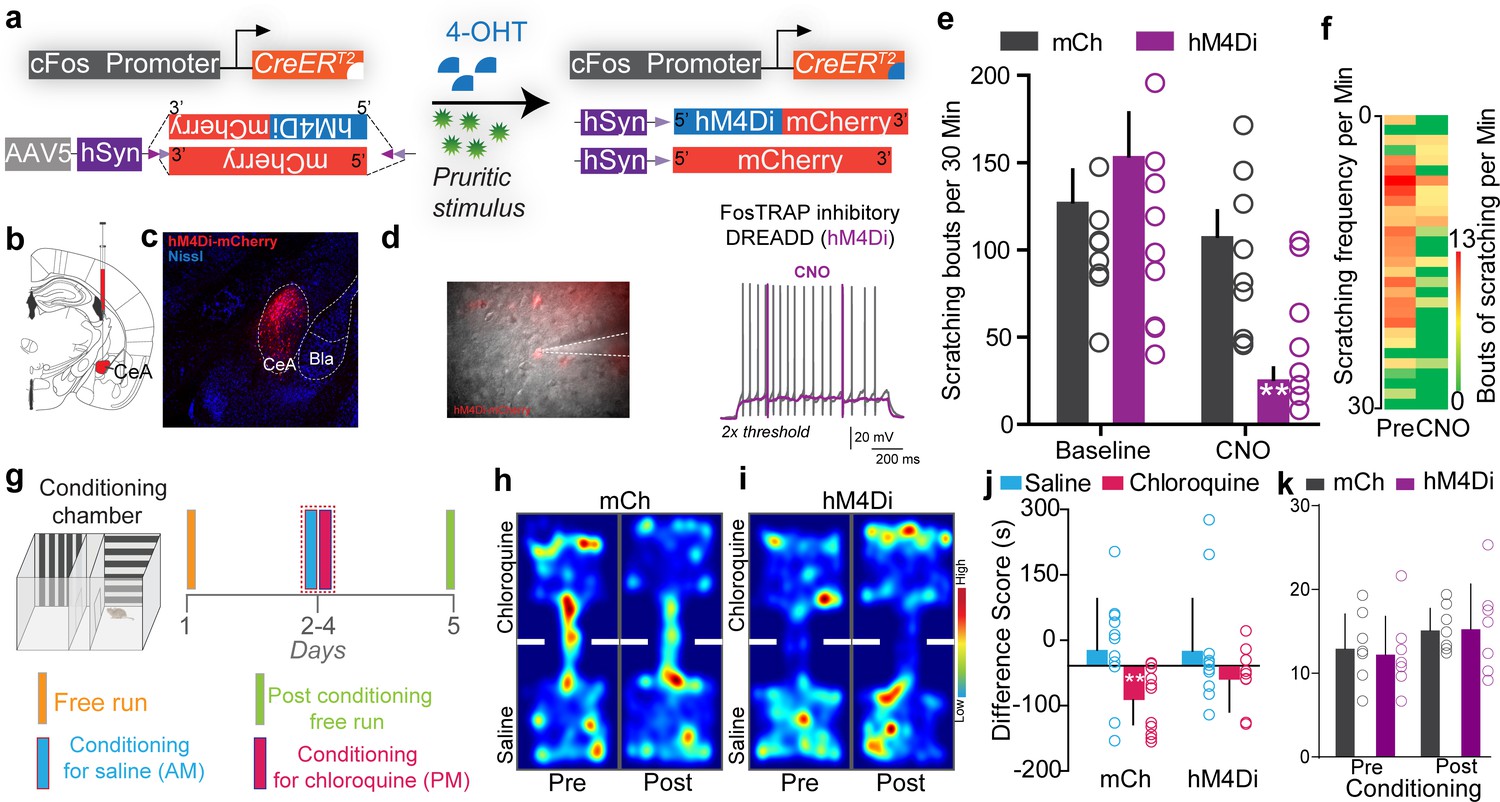
Inhibiting chloroquine-activated central amygdala (CeA) neurons impairs aversive learning associated with itch.
(a) Illustration of strategy to express inhibitory DREADDs selectively in chloroquine-TRAPed neurons of the CeA. (b) Experimental timeline to FosTRAP DREADDs in CeA neurons. (c) Representative section showing chloroquine-TRAPed CeA neurons expressing hM4Di-mCherry (red). Scale bar, 75 μm. (d) Infrared DIC image of CeA chloroquine-TRAPed neurons expressing hM4Di-mCherry. In hM4Di+ve CeA neurons, clozapine N-oxide (CNO) bath application decreased neuronal excitability to suprathreshold stimuli. (e) Chemogenetic inhibition of chloroquine-TRAPed CeA neurons leads to a significant reduction in chloroquine-evoked scratching. CNO has no effect on chloroquine-evoked scratching in control mice expressing mCherry. n = 8–9 per group. p=0.0011, ANOVA and Bonferroni's for post hoc tests. (f) Heatmap showing averaged chloroquine-evoked scratching bouts pre- and post-CNO in mice expressing hM4Di in CeA. (g) Schematic and timeline of conditioned place aversion experimental design with chemogenetic silencing. Representative heatmap showing spatial location of a control mouse injected with the DIO-mCh (h) and the DIO-hM4Di DREADD virus (i), pre- and post-chloroquine conditioning. (j) Change in chamber occupancy time in the chloroquine-paired chamber compared to the saline-paired chamber after chemogenetic silencing. n = 11 per group. p=0.044, ANOVA and Bonferroni's for post hoc tests. (k) Distance traveled in chloroquine-paired chamber did not differ pre- and post-conditioning in mCh and hM4Di mice. n = 0.769 per group, ANOVA and Bonferroni's for post hoc tests.
Figure 5 with 1 supplement
Identification of the downstream circuit of chloroquine-activated central amygdala (CeA) neurons.
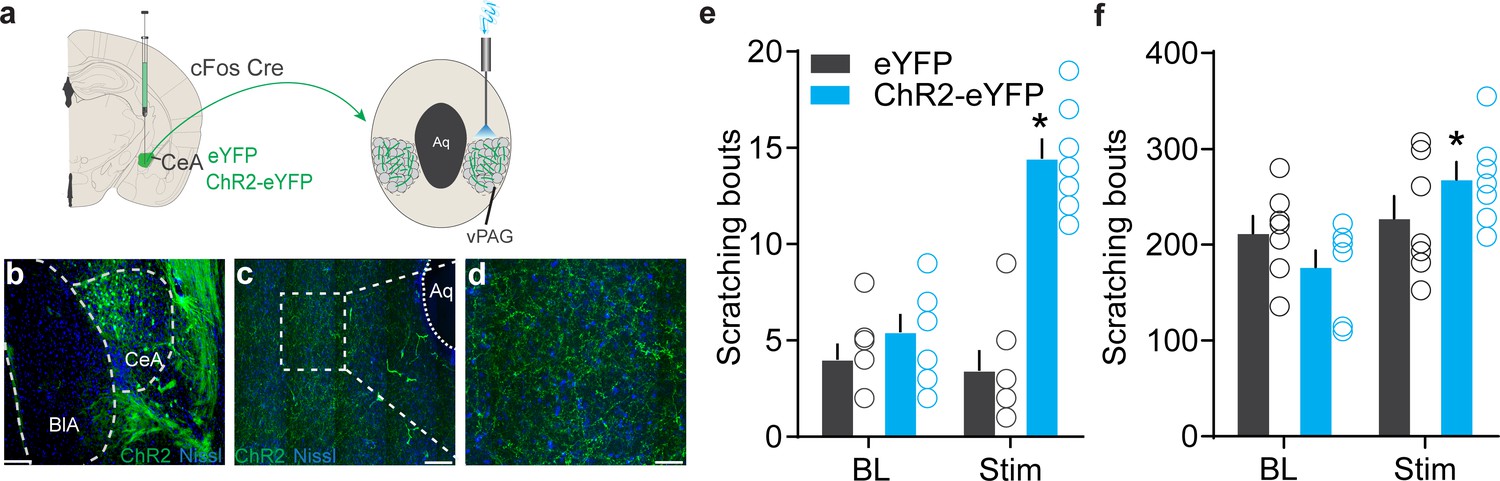
(a) Scheme showing expression of ChR2 in chloroquine-TRAPed CeA neurons and their axonal photostimulation in the ventral periaqueductal gray (vPAG). (b) FosTRAPed CeA neurons expressing ChR2-eYFP. Scale bar, 125 μm. (c, d) Chloroquine-TRAPed ChR2+ve CeA axonal terminals ramify densely in the vPAG. Scale bar, 100 and 25 μm. (e) Optogenetic stimulation of FosTRAPed ChR2+ve axonal projections from CeA in the vPAG resulted in significant spontaneous scratching, whereas photostimulation had no effect on scratching in control mice. Pre vs. Stim, F (1,12) = 33.15, p<0.0001, n = 5–7 per group, ANOVA and Bonferroni's for post hoc tests. (f) Optical activation of chloroquine-TRAPed CeA neurons potentiates chloroquine-evoked scratching while no changes were observed in control mice. n = 7 per group. BL vs. Stim in eYFP, F (1,6) = 0.019, p=0.8924; BL vs. Stim in ChR2, F (1, 6) = 9.109, p=0.0235, ANOVA and Bonferroni's for post hoc tests.
Figure 5—figure supplement 1
Anatomical tracing to identify connections between the central amygdala (CeA) and the periaqueductal gray (PAG).
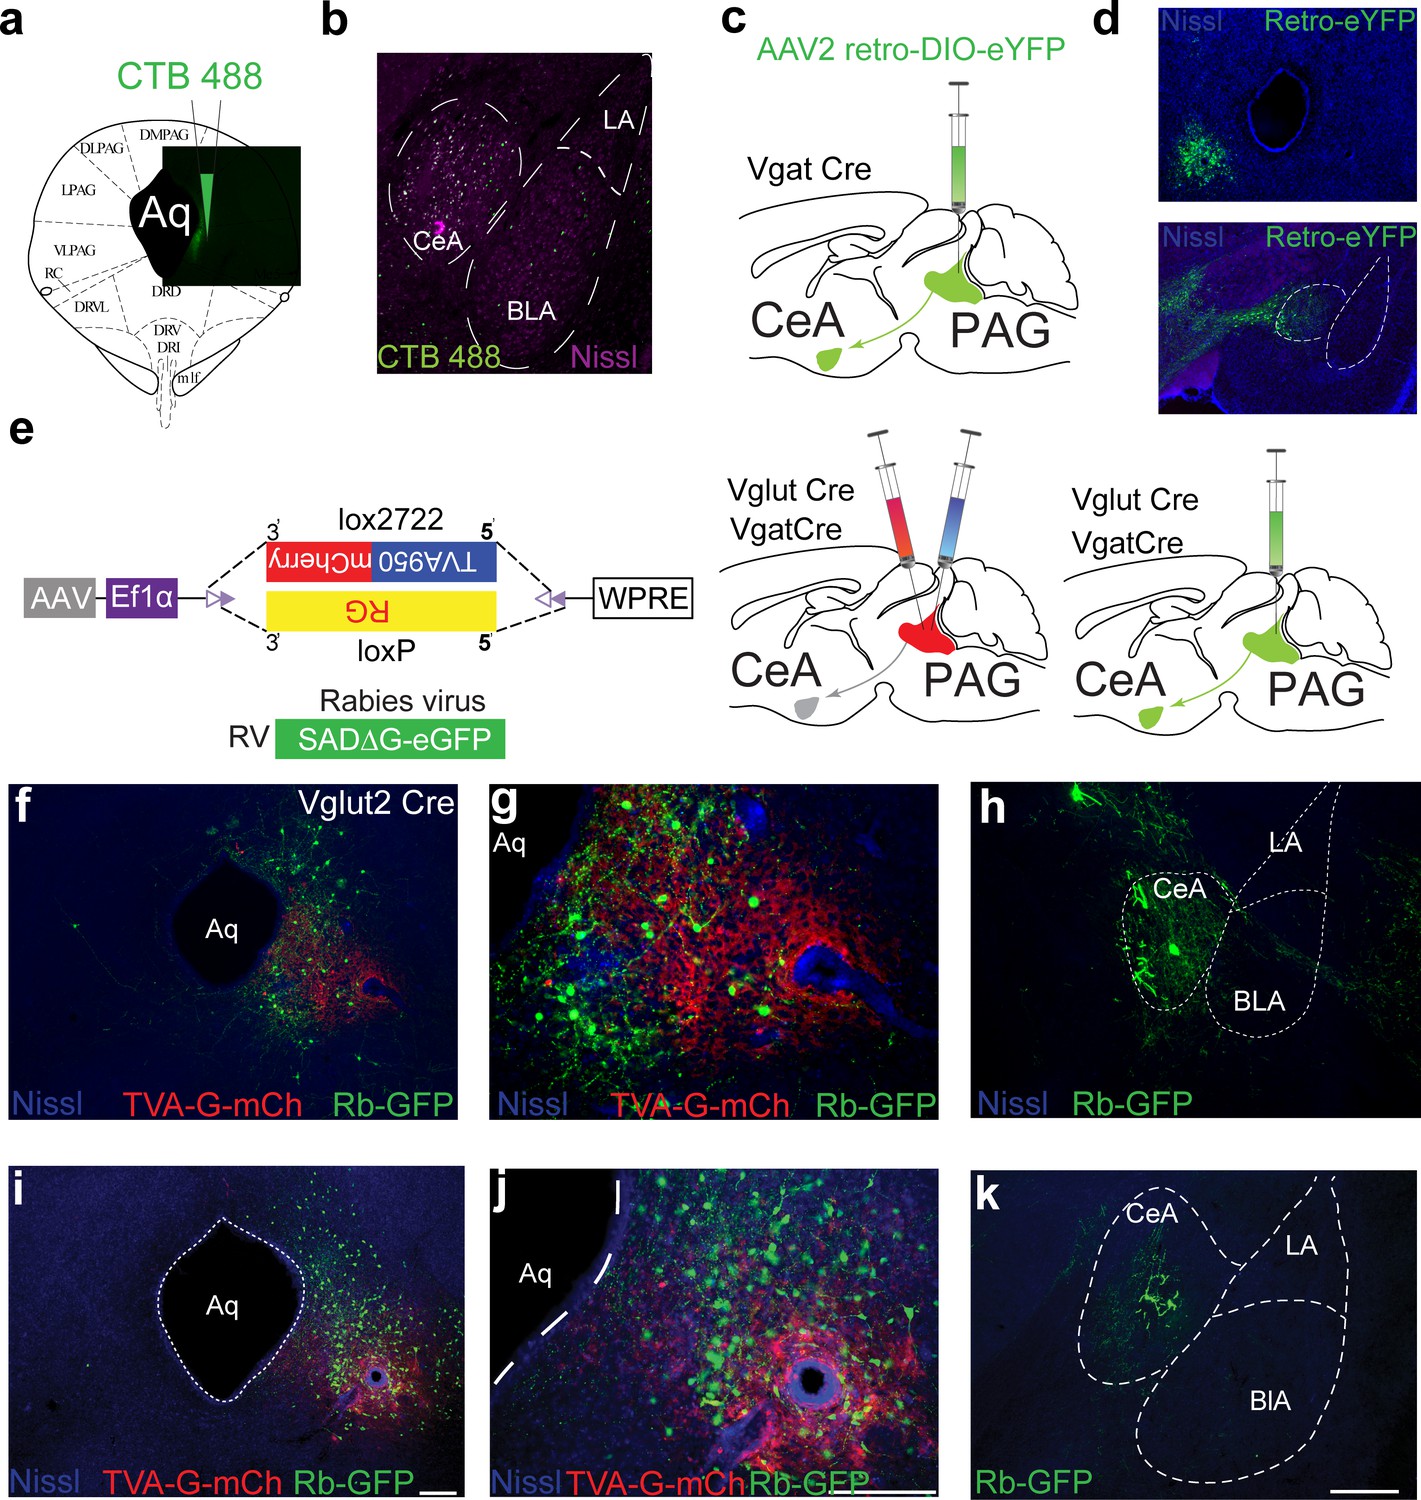
(a) Retrograde tracer CTB 488 injection into the ventral periaqueductal gray (vPAG) to confirm projections from CeA in C57BL/6J mice. Representative image of vPAG showing CTB488 injection. (b) CeA neurons show clear CTB 488 labeling following injection into the vPAG in C57BL/6J mice. (c) Cre-dependent retrograde virus AA2-DIO-eYFP is injected into the vPAG of Vgat Cre mice. (d) CeA neurons show expression of Cre-dependent eYFP in Vgat+ve neurons following injection into vPAG. (e) Strategy for monosynaptic retrograde rabies tracing to confirm the CeA→PAG connection. (f, g) mCherry fluorescence from Vglut2 neurons selectively transduced with TVA in the vPAG. GFP fluorescence in PAG following SADΔG-GFP(EnvA) injection into the PAG. (h) SADΔG-GFP expression in the CeA following injection into the vPAG in a mouse expressing TVA in Vglut2 neurons. (i, j) mCherry fluorescence from Vgat neurons selectively transduced with TVA in the vPAG. GFP fluorescence in the PAG following SADΔG-GFP(EnvA) injection into the PAG. Scale bar, 75 μm and 250 μm. (k) SADΔG-GFP expression in the CeA following injection into the vPAG in a mouse expressing TVA in Vgat neurons. Scale bar, 300 μm.
Figure 6 with 2 supplements
Cell-type-specific transcriptomic profiling of chloroquine-activated central amygdala (CeA) cells.
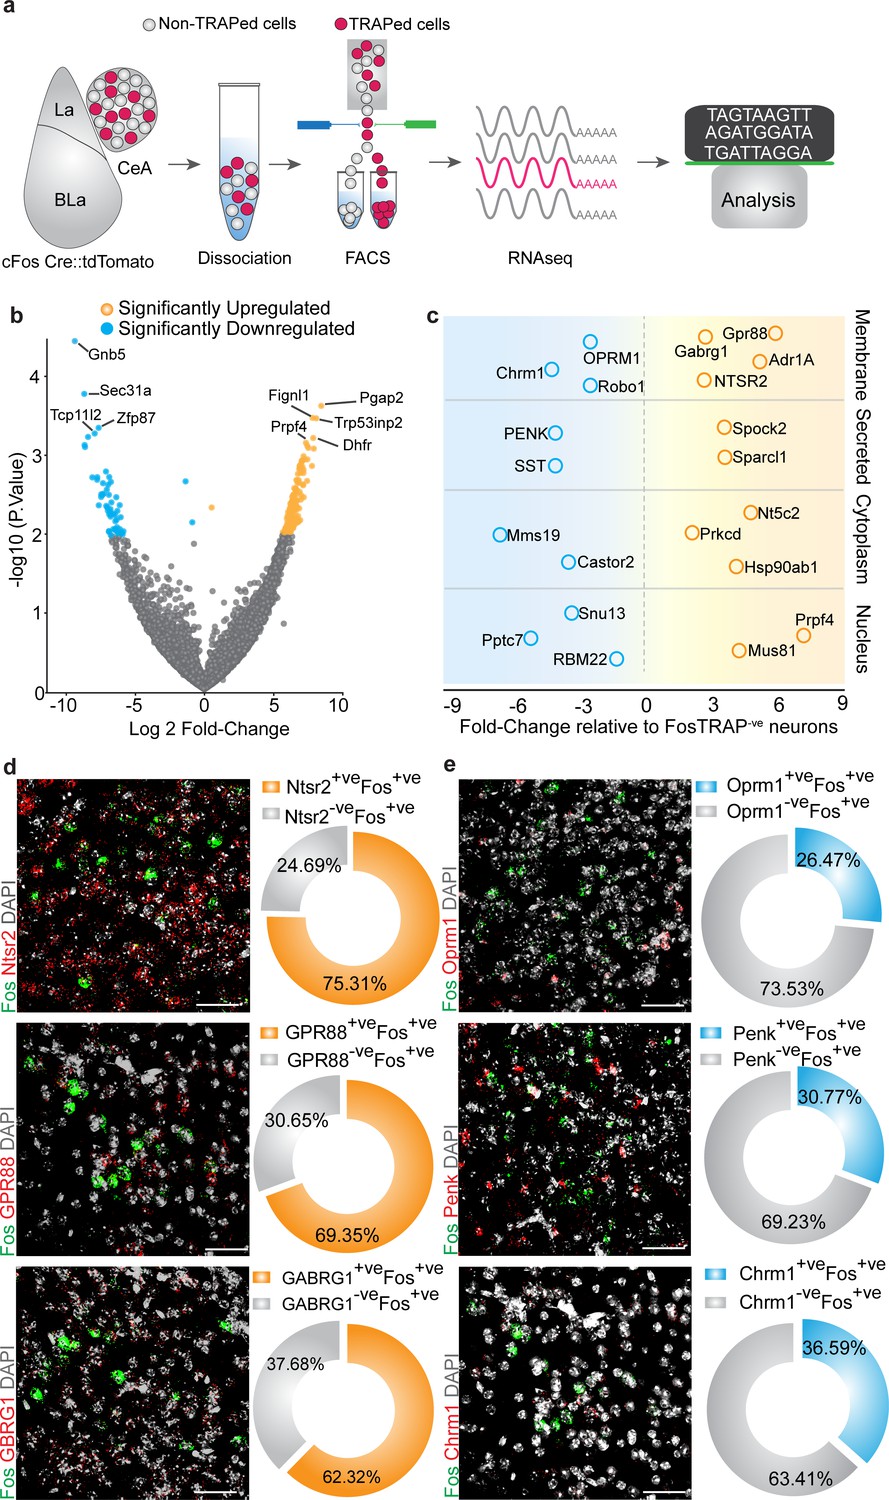
(a) Experimental workflow outlining fluorescence-activated cell sorting (FACS) of the FosTRAPed tdTomato+ve and tdTomato-ve CeA neurons for whole-cell transcriptomics analyses. (b) Volcano plot of log2-fold change (x axis) and p values (y axis) showing the transcripts that are differentially expressed in the chloroquine-TRAPed tdTomato+ve CeA cells. Significantly differentially expressed genes are color coded, and genes that have p≤0.001 are indicated on the plot. (c) Candidate genes identified by fold change in expression of genes in significantly enriched KEGG pathways from the FosTRAPed tdTomato+ve CeA cells. (d) Multiplexed fluorescent in situ hybridization (FISH) was used in validating the expression of NTSR2, GPR88 and GABARG1 in itch-activated Fos+ve CeA cells. We observed considerable overlap between NTSR2+ve (75.31% cells), GPR88+ve (69.35%) and Gabrg1+ve (62.32% cells) cells with itch-activated Fos+ve cells in the CeA. (e) Multiplexed FISH was used to verify the overlap of OPRM1, Penk and Chrm1 in itch-activated Fos+ve CeA cells. We find their partial overlap of Fos+ve cells in the CeA with cells that express OPRM1+ve (26.47% cells), Penk+ve (30.77% cells) and Chrm1+ve (36.50% cells). Right corner of each image shows magnification of the inset (yellow box).
Figure 6—figure supplement 1
Fluorescence-activated cell sorting (FACS) of central amygdala (CeA) FosTRAPed neurons to perform RNA-seq and transcriptional analysis of chloroquine-TRAPed CeA neurons.
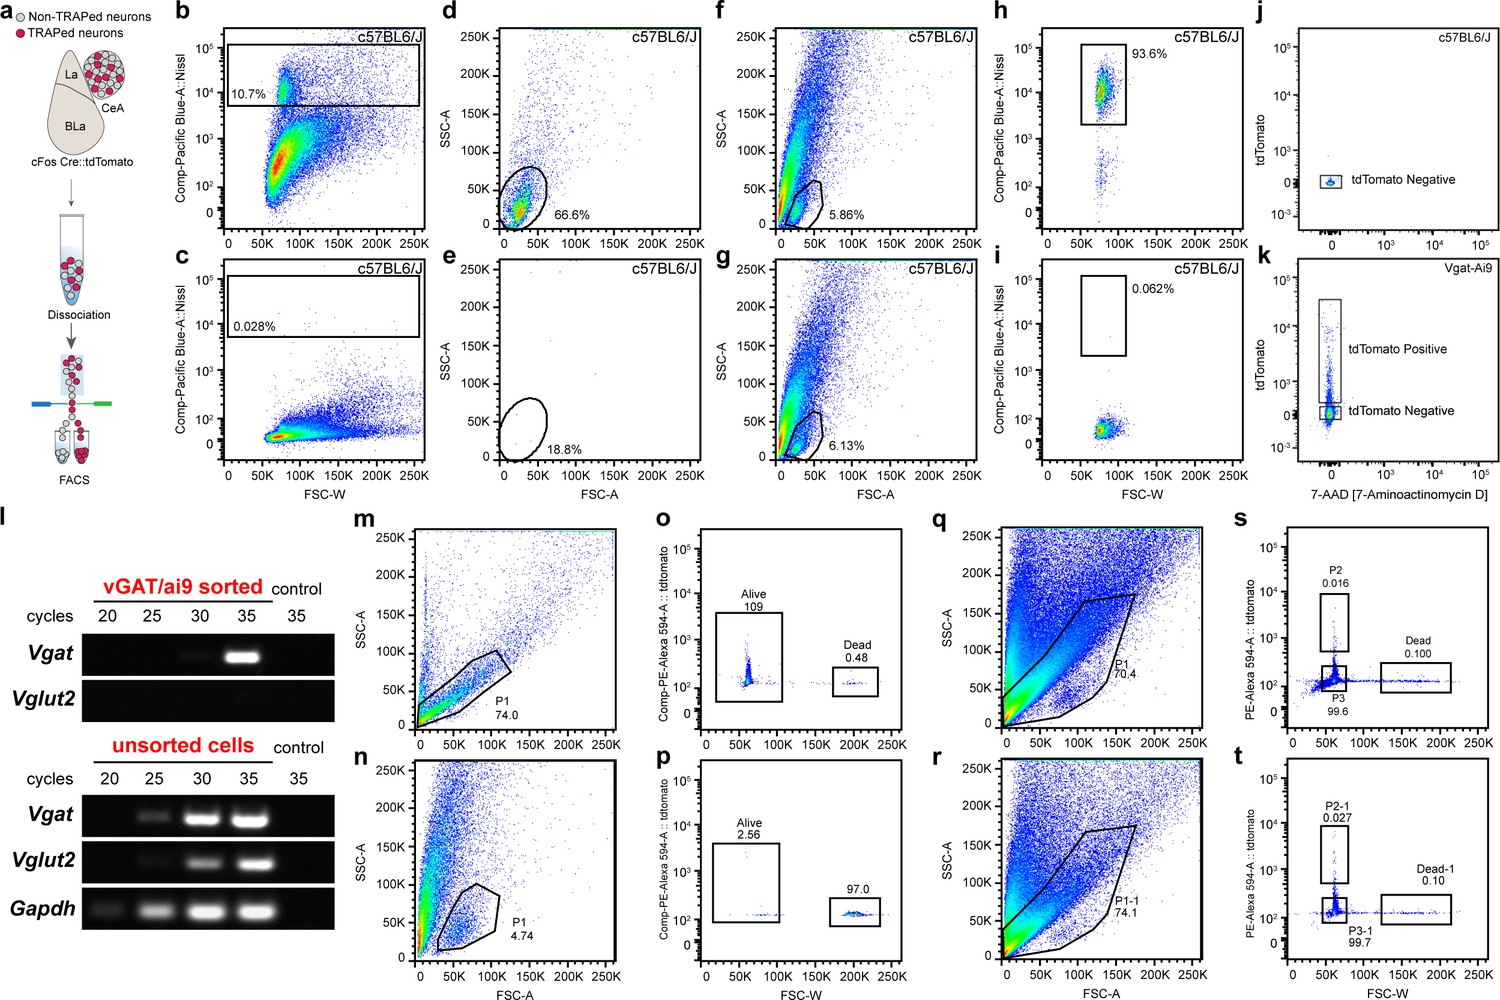
(a) Schematic showing dissociation and FACS of CeA FosTRAPed neurons. (b, d) Labeling of dissociated neurons with Neurotrace reveals a clear subset of events that can be found in the bottom of the scatterplot. (c, e) Absence of Neurotrace staining confirms labeling and rules out an autofluorescence artifact. (f, h) Selection of the identified Neurotrace subset in the FACS scatterplot reveals that it contains 93.6% of all Neurotrace-positive events. (g, i) Absence of Neurotrace staining confirms labeling and rules out an autofluorescence artifact. (j) Negative fluorescence FACS control using dissociated tdTomato (Ai9)-negative tissue from C57BL/6J animals. (k) Positive fluorescence FACS control using dissociated tdTomato (Ai9)-positive tissue from Vgat/Ai9 animals. (l) PCR validation of sorted samples, demonstrating enrichment of population of interest (Vgat). (m, o) Assessment of neuron viability after dissociation. (n, p) Positive dead control for neuronal viability. (q, s) Example of CeA cFos TRAP FACS #1. (r, t) Example of CeA FosTRAP FACS #2.
Figure 6—figure supplement 2
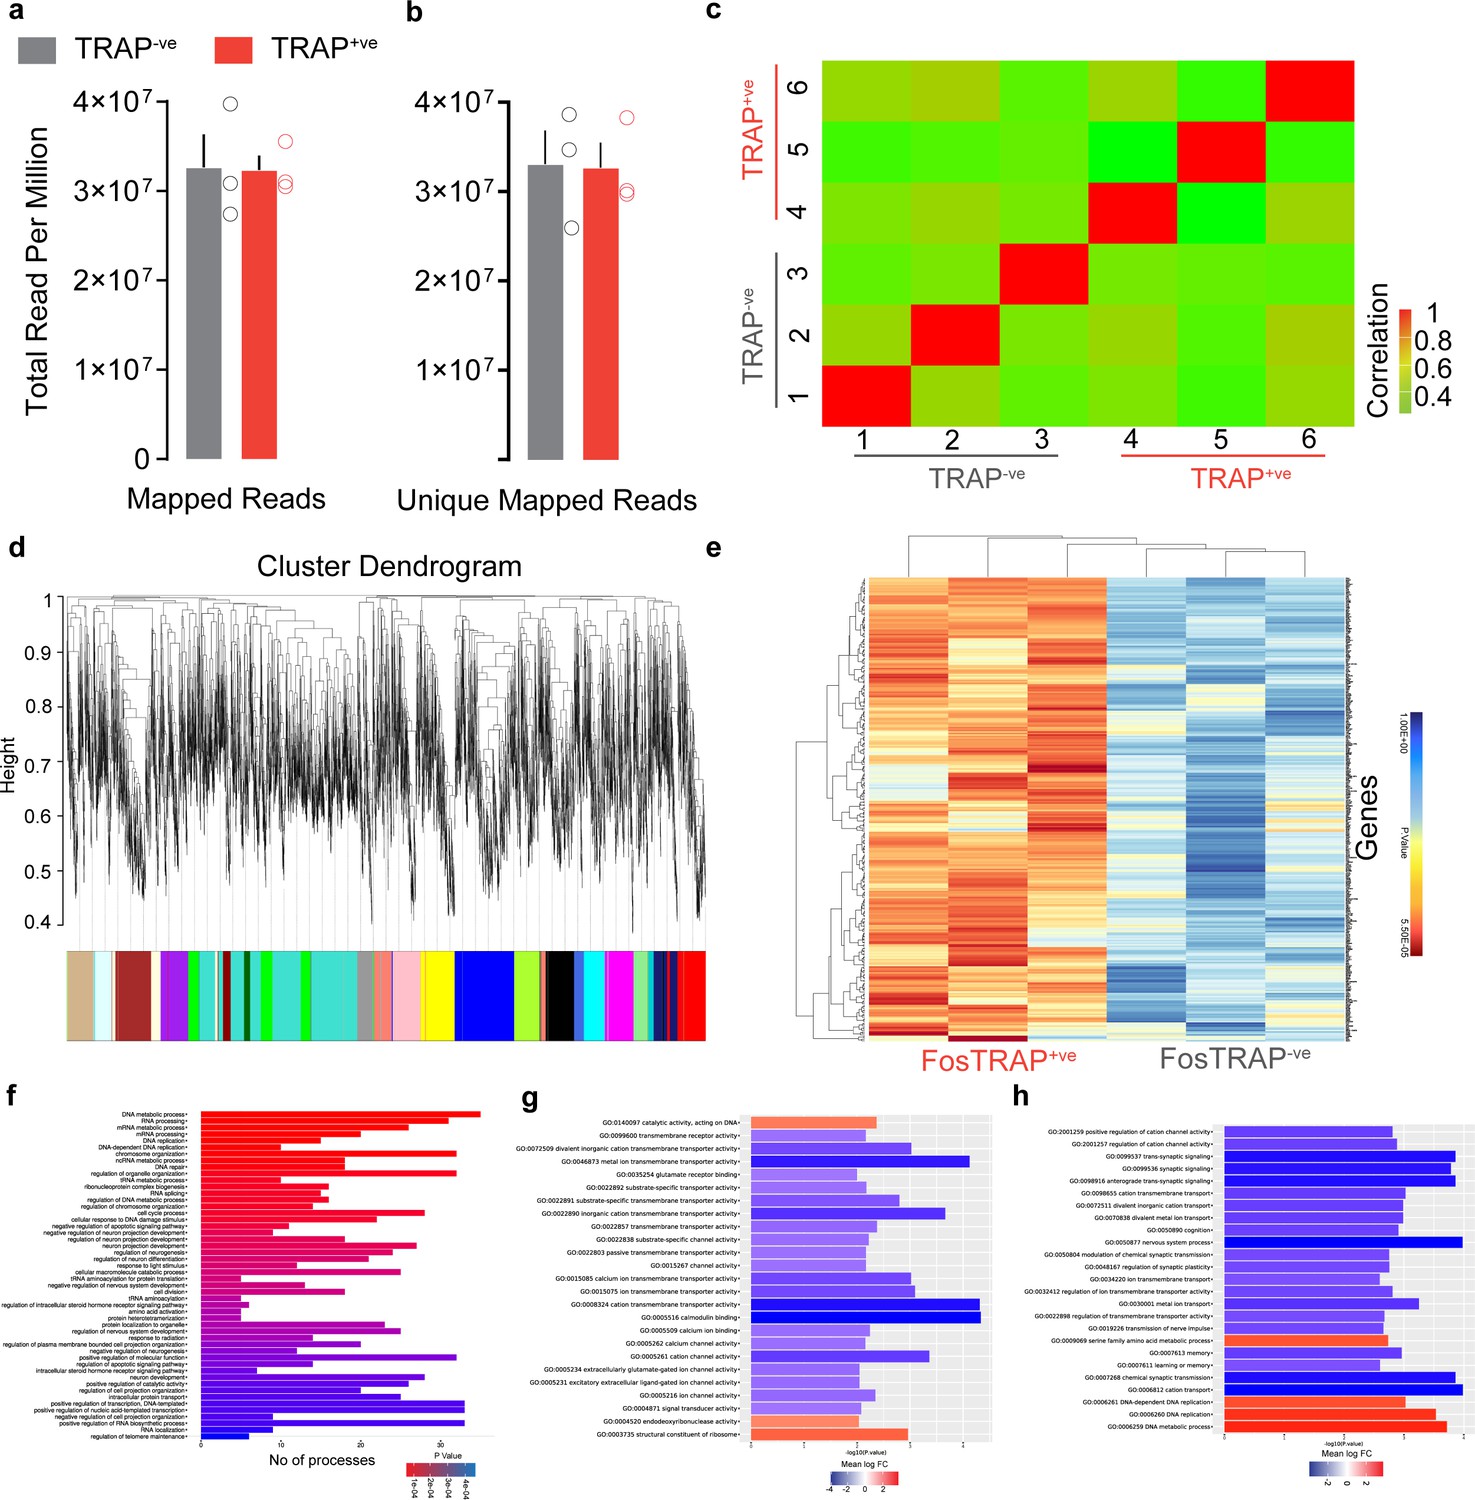
Transcriptional analysis of central amygdala (CeA) FosTRAPed neurons.
Total (a) mapped and (b) unique mapped reads per million are similar between tdTomato+ve and tdTomato-ve neurons. t test, t = 0.07, df = 4, p=0.94 for mapped reads and t = 0.08, df = 4, p=0.93 for unique mapped reads. (c) Correlation analysis of RNA quality obtained from tdTomato+ve and tdTomato-ve neurons. This matrix supports our prior expectation that the summation of expressed isoforms to the level of their parent genes in the data follows a positive trend with high correlation. This also highlights that there is no cross-contamination from different sorting events. (d) Sample cluster dendrogram of tdTomato+ve neurons showing all weighted gene correlation network analysis de novo modules of genes identified as random color names where each module eigengene was correlated to tdTomato treatment. The GreenYellow module is uniquely 99% correlated and significant for tdTomato+ve neurons. (e) Heatmap of significantly correlated genes filtered from the GreenYellow module. (f) Bar plots showing Gene Ontology (GO) biological processes that are significantly upregulated in the tdTomato+ve neurons compared to the tdTomato-ve neurons. (g, h) Top-enriched GO biological processes and molecular function for upregulated genes (log2FC > 0.5) and downregulated (log2FC < 0.5) in the tdTomato+ve neurons.
Tables
Key resources table
| Reagent type (species) or resource | Designation | Source or reference | Identifiers | Additional information |
|---|---|---|---|---|
| Species (Mus musculus), strain | Ai9-tdTomato mice (B6.Cg-Gt(ROSA)26Sortm9(CAG-tdTomato)Hze/J) | The Jackson Laboratory | 007909 | Ai9 |
| Species (Mus musculus), strain | FosCreERT2 mice (B6.129(Cg)-Fostm1.1(cre/ERT2)Luo/J) | The Jackson Laboratory | 21882 | FosCreER |
| Species (Mus musculus), strain | Vgat-ires-Cre (Slc32a1tm2Lowl) | The Jackson Laboratory | 028862 | Vgat Cre |
| Species (Mus musculus), strain | Vglut2-ires-Cre (Slc17a6tm2) | The Jackson Laboratory | 028863 | Vglut2 Cre |
| Species (Mus musculus), strain | C57BL\6J | In bred | NA | NA |
| Recombinant DNA reagent | rAAV5/hSyn-DIO-hM3Dq-mCherry | University of North Carolina Vector Core | NA | 75 nL of virus |
| Recombinant DNA reagent | rAAV5/hSyn-DIO-hM4Di-mCherry | University of North Carolina Vector Core | NA | 75 nL of virus |
| Recombinant DNA reagent | rAAV5-DIO-ChR2-eYFP | University of North Carolina Vector Core | NA | 100 nL of virus |
| Recombinant DNA reagent | rAAV5/hSyn-DIO-mCherry | University of North Carolina Vector Core | NA | 75 nL of virus |
| Recombinant DNA reagent | rAAV5-DIO-eYFP | University of North Carolina Vector Core | NA | 100 nL of virus |
| Recombinant DNA reagent | rAAV5/EF1α-FLEX-TVAmCherry | University of North Carolina Vector Core | NA | 75 nL of virus (1:1 with RG) |
| Recombinant DNA reagent | rAAV5/CAG-FLEX-RG | University of North Carolina Vector Core | NA | 75 nL of virus (1:1 with TVA) |
| Recombinant DNA reagent | EnvA G-deleted Rabies-GFP | University of North Carolina Vector Core | NA | 100 nL of virus |
| Chemical compound, drug | Clozapine-N-oxide (CNO) | Enzo Life Sciences | BML-NS105 | NA |
| Chemical compound, drug | 4-Hydroxytamoxifen | Sigma–Aldrich | H6278-10MG | NA |
| Chemical compound, drug | Chloroquine | Sigma–Aldrich | C6628 | NA |
| Antibody | Rb-mCherry | Clontech | Cat. #: 632543 | 1:1000, RRID:AB_2307319 |
| Antibody | Ch-GFP | AVES | A11122 | 1:2000, AB_10000240 |
| Antibody | Rb-cFos | Cell Signaling | Cat. #: D82C12 | 1:1000, RRID:AB_10557109 |
| Sequence-based reagent (smFISH) | mm-Fos | Advanced Cell Diagnostics | 316921 | NA |
| Sequence-based reagent (smFISH) | mm- Ntsr2 | Advanced Cell Diagnostics | 452311 | NA |
| Sequence-based reagent (smFISH) | mm- GPR88 | Advanced Cell Diagnostics | 317451 | NA |
| Sequence-based reagent (smFISH) | mm-Penk | Advanced Cell Diagnostics | 318761 | NA |
| Sequence-based reagent (smFISH) | mm-Gabarg1 | Advanced Cell Diagnostics | 501401 | NA |
| Sequence-based reagent (smFISH) | mm-Oprm1 | Advanced Cell Diagnostics | 315841 | NA |
| Sequence-based reagent (smFISH) | mm-Chrm1 | Advanced Cell Diagnostics | 495291 | NA |
| Software, algorithm | Ethovision XT | Noldus | https://www.noldus.com/ethovision-xt | NA |
| Software, algorithm | Prism7 | GraphPad | https://identifiers.org/RRID/RRID:SCR_002798 | NA |
| Software, algorithm | MATLAB, 2018b | MathWorks | https://www.mathworks.com/products/matlab.html | NA |
| Software, algorithm | RZ5P | Tucker-Davis Technologies | https://www.tdt.com/system/fiber-photometry-system/ | NA |
Additional files
Download links
A two-part list of links to download the article, or parts of the article, in various formats.
Downloads (link to download the article as PDF)
Open citations (links to open the citations from this article in various online reference manager services)
Cite this article (links to download the citations from this article in formats compatible with various reference manager tools)
Cellular, circuit and transcriptional framework for modulation of itch in the central amygdala
eLife 10:e68130.
https://doi.org/10.7554/eLife.68130


