Functional insights from a surface antigen mRNA-bound proteome
- Centre for Molecular Biology of Heidelberg University (ZMBH), Germany
- Division of Immune Diversity, Deutsche Krebsforschungszentrum (DKFZ), Germany
Figures
Figure 1 with 1 supplement
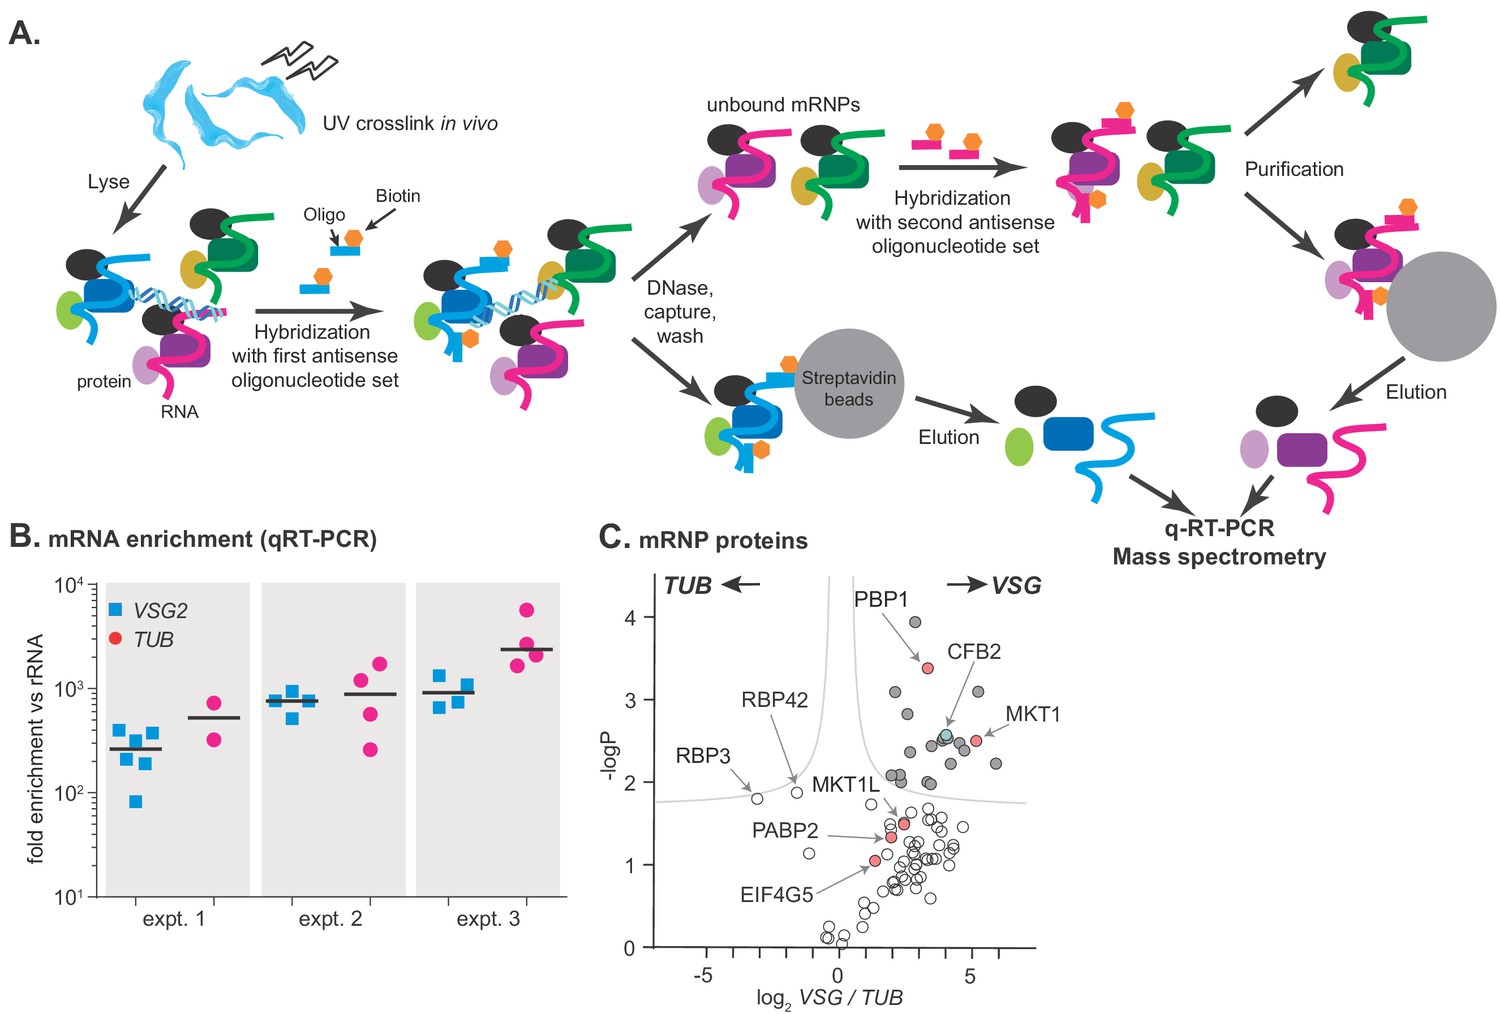
RNA antisense purification identifies proteins that interact directly with variant surface glycoprotein (VSG) mRNA.
(A) A schematic overview of the method. Bloodstream-form Trypanosoma brucei were subjected to UV irradiation. After cell lysis, the lysate was incubated with streptavidin-coated magnetic beads. The unbound portion was then incubated with biotinylated 90-nt-long DNA probes, to hybridize to either alpha-tubulin (TUB) or VSG2 mRNA, then probe-target complexes were captured by streptavidin-coated magnetic beads. To decrease background, samples were treated with DNase I. The supernatant was collected, and the second set of ribonucleoprotein complexes (VSG2 or TUB) was captured in a similar way. Protein and RNA were eluted from the beads, and subjected to mass spectrometry (LC-MS/MS) for protein identification and real-time quantitative PCR (RT-qPCR) for relative RNA quantification. (B) Enrichment of VSG2 and TUB transcripts after RNA antisense purification. The individual data points show RNA levels relative to rRNA for each independent pull-down, measured by RT-qPCR, and bars represent means. Experiment 1 includes some preparations that were purified using only VSG. Before mass spectrometry of VSG or TUB preparations from each experiment, the material for all pull-downs shown was pooled. (C) The triplicate experiments identified proteins that reproducibly enriched with VSG2 relative to TUB and vice versa. Proteins significantly enriched (FDR 1%; s0 = 0.1) are filled dark grey. Proteins associated with the MKT1 complex are in pink and CFB2 (cyclin F-box protein 2) is cyan. The data for this graph are in Supplementary file 2, sheet 2.
Figure 1—figure supplement 1
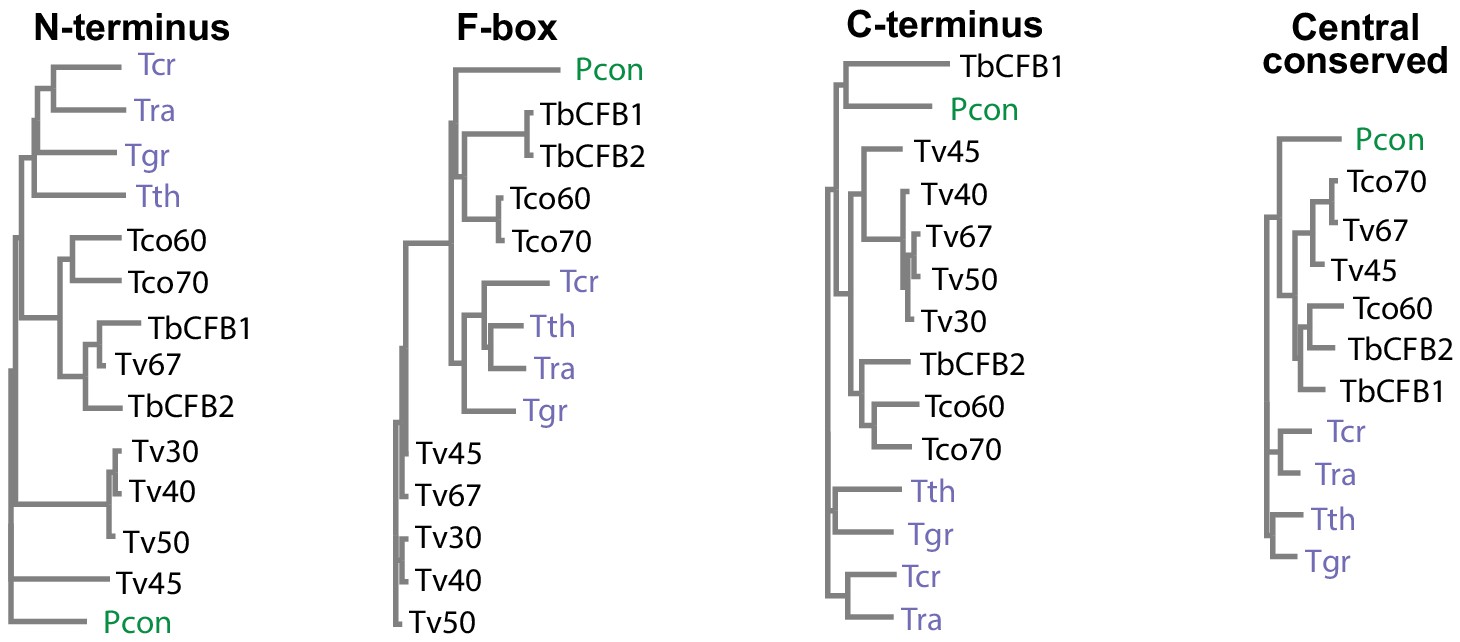
CFB2 (cyclin F-box protein 2) domain conservation and evolution.
Evolutionary trees, made with CLUSTALW, for different portions of CFB proteins from different kinetoplastids. Tb927.1.4650 was chosen as representative of CFB1 and Tb927.1.4540 is CFB2. Trypanosoma vivax genes shown are TvY486_0102030 (Tv30), TvY486_0102040 (Tv40), TvY486_0404500 (Tv45), Tv486_0102050 (Tv50), and TvY486_0011670 (Tv67). Trypanosoma congolense genes are TcIL3000_1_1860 (Tco60) and TcIL3000_1_1870 (Tco70). Others are TRSC58_03601 (Trypanosoma rangeli, Tra), TM35_000322060 (Trypanosoma theileri, Tth), TcCLB.506529.80 (Trypanosoma cruzi, Tcr), PCON_0072200 (Paratrypanosoma confusum, Pcon), and DQ04_06951020 (Trypanosoma grayi, Tgr).
Figure 2 with 1 supplement
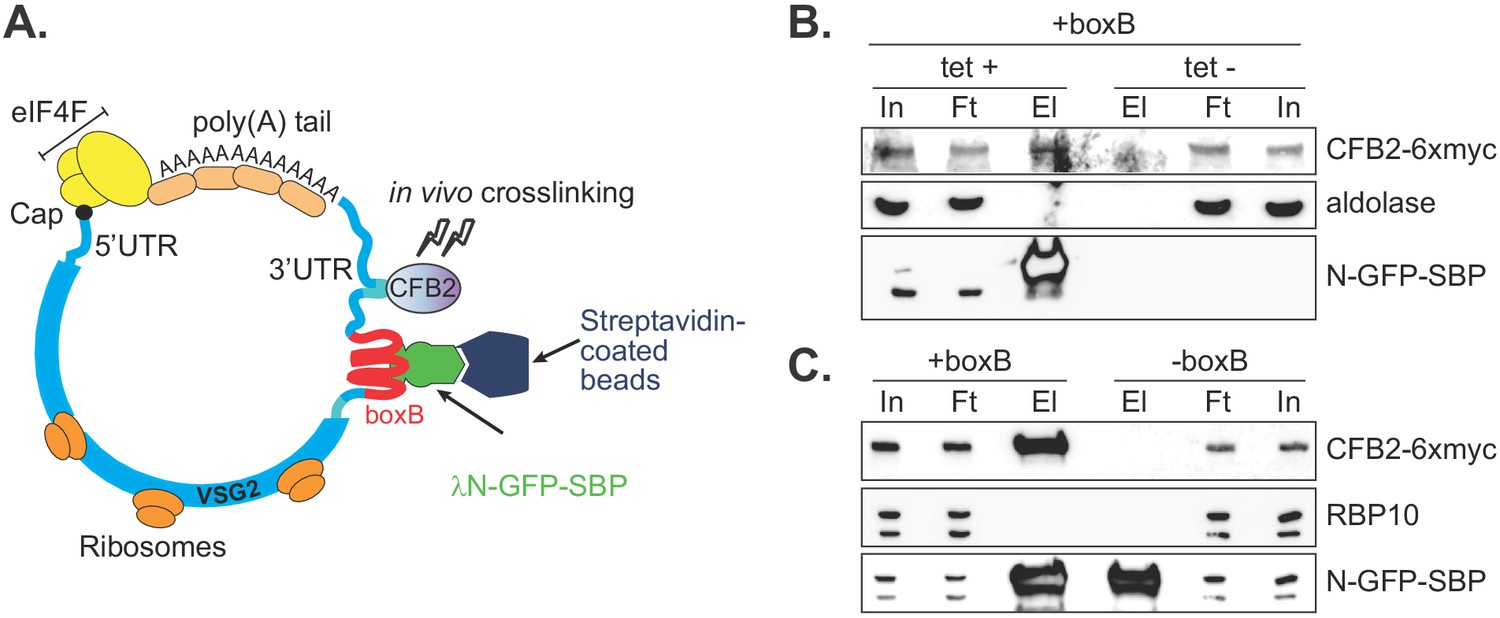
CFB2 (cyclin F-box protein 2) associates with VSG2 mRNA.
(A) Method used. The lambda-GFP-SBP binds to boxB aptamer-tagged VSG2 mRNAs via the lambda moiety located at the N-terminal and interacts with immobilized streptavidin via the SBP moiety at the C-terminus. (B) CFB2-myc is pulled down with boxB-containing VSG2 mRNA. Bloodstream cells expressing boxB-tagged VSG2 mRNA from the active expression site, CFB2-6xmyc from the RRNA locus, and tetracycline-inducible lambdaN-GFP-SBP were grown; one culture was treated with tetracycline for 6 hr (+tet) and the other was not (-tet). The lambdaN-GFP-SBP, with associated mRNA and protein, was purified from cell lysates (25 mg of the total protein). For Western analysis, 85% of the eluates (El; corresponding to ~21 mg of input protein) and 40 µg total input (In) or flowthrough (Ft) proteins were resolved by SDS-PAGE and analysed by Western blotting using specific antibodies (eluate: flowthrough loading of 500:1). Panel B shows that pull-down of CFB2-6xmyc was dependent on the presence of lambdaN-GFP-SBP. Raw data for this figure are in Figure 2—figure supplement 1. (C) This is similar to B, except that all cells expressed lambdaN-GFP-SBP, but one line did not have boxB sequences in the VSG mRNA. This shows that pull-down of CFB2-6xmyc by lambdaN-GFP-SBP depended on the boxB sequences.
Figure 2—figure supplement 1
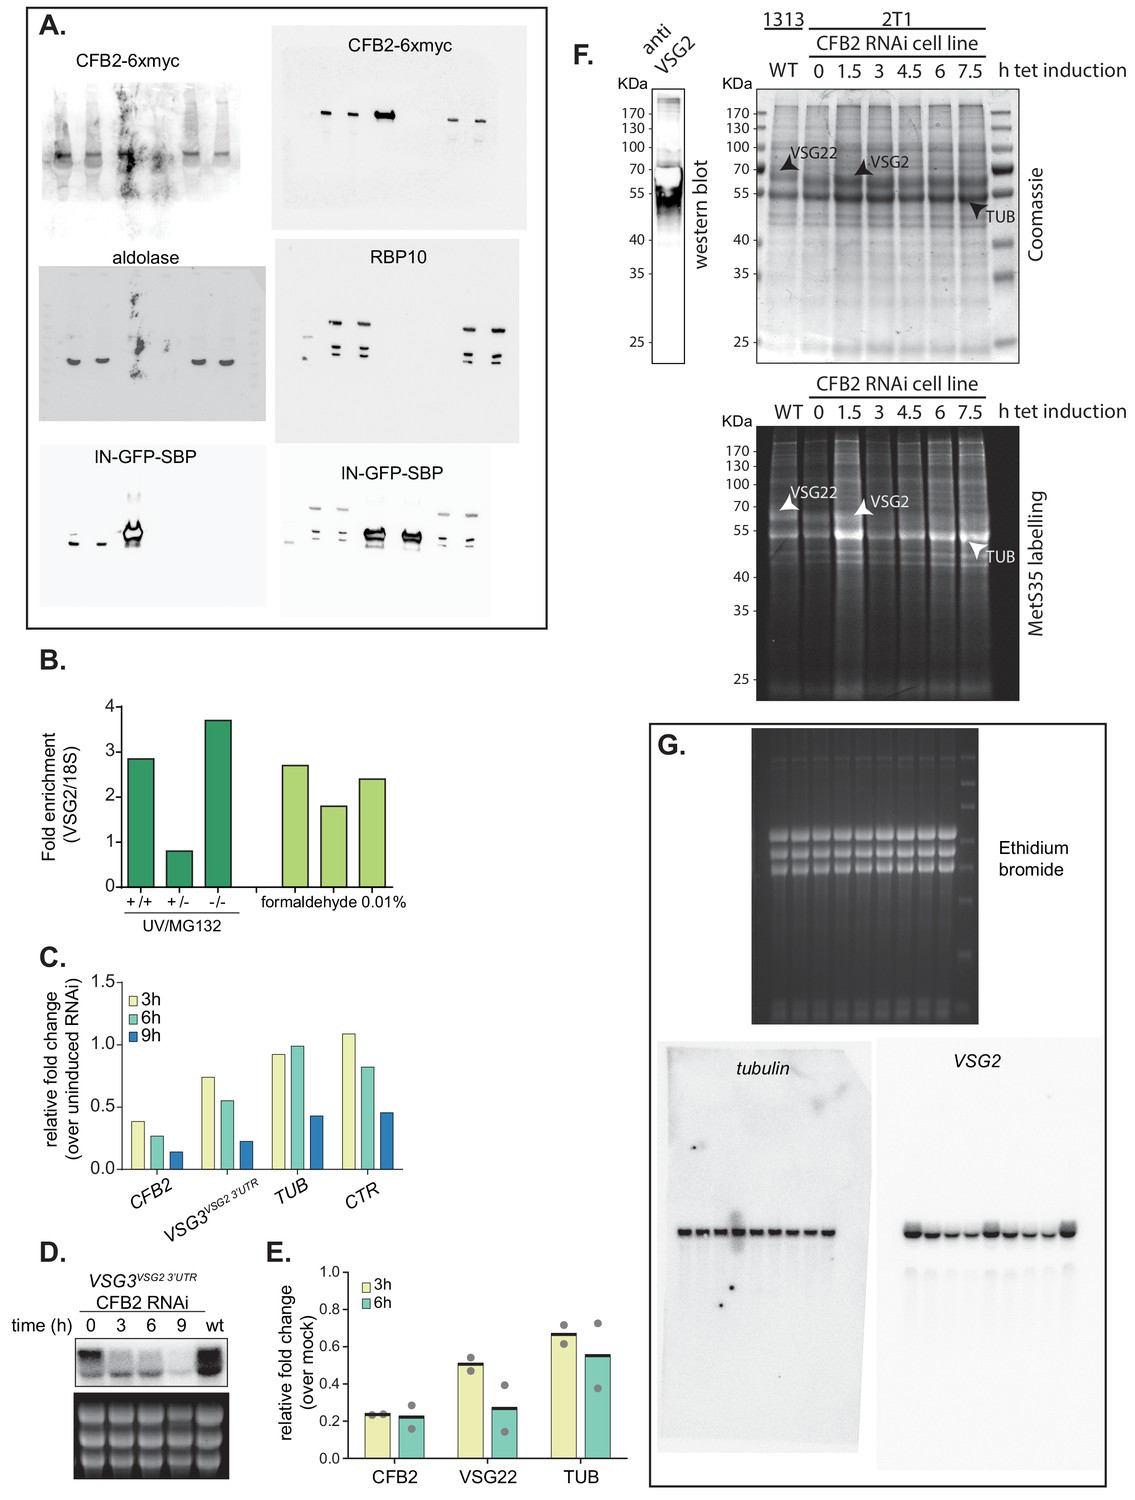
Effects of CFB2 (cyclin F-box protein 2) RNAi and uncropped images for Figure 2 and Figure 4.
(A) Uncropped images for Figure 2. (B) Cells expressing VSG2 and CFB2-6xmyc were used. Some were pre-incubated with MG132, with or without UV irradiation; others were mildly fixed with formaldehyde. After lysis and immunoprecipitation, the amounts of VSG2 mRNA and rRNA were measured by reverse transcription and RT-PCR. The ratios were then compared to those in the input extracts. VSG2 mRNA was enriched in 5/6 experiments. (C) The cells used expressed VSG3 with the VSG2 3'-UTR, from the active expression site. The figure shows relative quantification of RNA transcript levels corresponding to VSG3 and alpha-tubulin (TUB) mRNAs detected at different sampling time-points (3, 6, 9 hr) after induction of CFB2 RNAi. CTR (co-transposed region) is a sequence located upstream of the VSG gene, which is transcribed from the same promoter but present only in the mRNA precursor. Results were normalized against 18S. This is a single experiment. The decreases in all mRNAs after 9 hr may have been caused by decreasing cell viability. (D) Northern blot analysis corresponding to panel (C). (E) Double-stranded CFB2 RNA was introduced into trypanosomes naturally expressing VSG22 by electroporation. Cells that were electroporated with no dsRNA served as the control. RNA was prepared 3 and 6 hr after electroporation, and levels of CFB2, VSG22, and alpha-TUB mRNA were assayed by reverse transcription and RT-PCR. CFB2 mRNA was reduced within 3 hr, and a marked reduction in VSG22 mRNA had occurred after 6 hr. There was a reduction in TUB also, but it was not so marked. (F) CFB2 RNAi for 8 hr does not cause a general suppression of translation. Trypanosomes expressing VSG2 and with inducible RNAi targeting CFB2 were used. Tetracycline was added for the times shown. Cells were then harvested, washed, and incubated with [35S]-methionine for 20 min. Afterwards the reactions were run on a polyacrylamide gel, which was dried before detection. Parallelly and before drying, one lane was blotted and probed with anti-VSG2 antibodies. The stained gel is above and the signal from [35S]-methionine is shown below. The prominent band just below 50 KDa is probably tubulin , the ones above it are probably VSG22 and VSG2 naturally expressed in the 1313 and 2T1 cell lines, respectively. Note that VSG22 runs slightly slower than VSG2. After 7.5 hr the VSG2 band is much less prominent. (G) Uncropped images for Figure 4B.
Figure 3 with 1 supplement
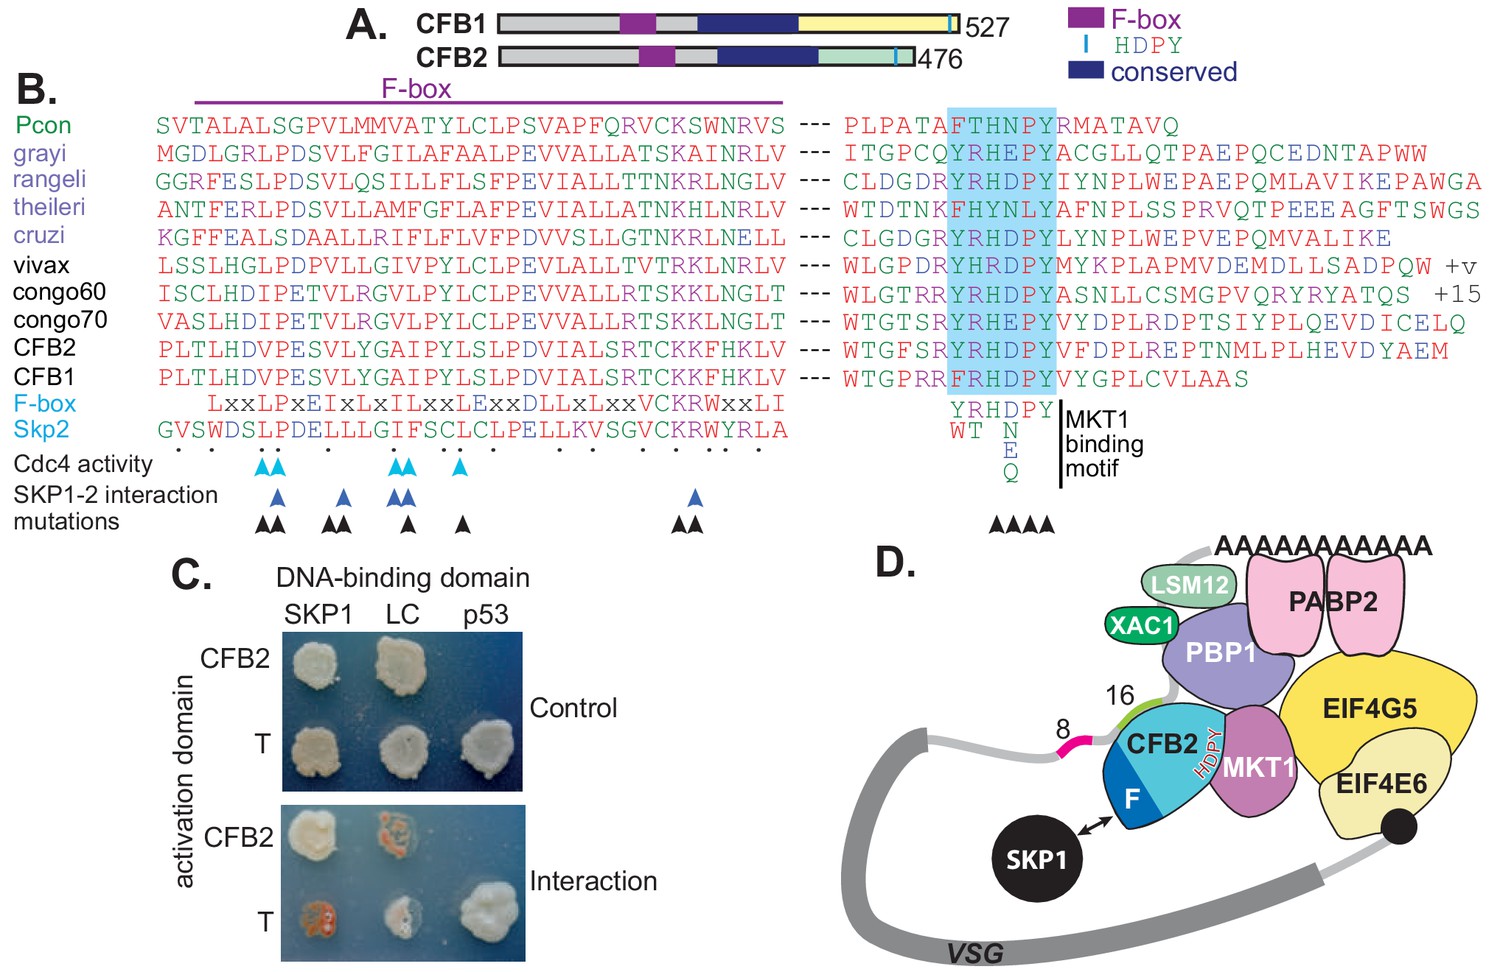
CFB2 (cyclin F-box protein 2) has three conserved domains.
(A) Schematic depiction of Trypanosoma brucei CFB1 and CFB2. Similar sequences outside the F-box and HDPY region are in grey and regions conserved in Trypanosoma and Paratrypanosoma are in other colours as indicated. (B) Sequence alignments created in ClustalOmega. The F-box is on the left and the region with C-terminal HNPY (highlighted in blue) on the right. The colour code for residues is red: non-polar; green: polar; blue: acidic; purple: basic. The Paratrypanosoma sequence (green label) is at the top. Stercoraria (Trypanosoma grayi, Trypanosoma rangeli, Trypanosoma theileri, and Trypanosoma cruzi) are labelled in mauve and Salivaria are in black (Trypanosoma vivax, Trypanosoma congolense, and T. brucei CFB1 and CFB2). Most organisms shown have several very similar CFB gene copies; only one is shown unless sequences are different. ‘+v’ indicates variable C-termini of different T. vivax orthologues; ‘+15’ indicates 15 more amino acid residues. At the bottom are a mammalian F-box consensus (‘F-box’) and human SKP2. The points below SKP2 indicate residues implicated in its interaction with SKP1 (Schulman et al., 2000). Cyan arrows indicate residues required for yeast Cdc4 activity (Bai et al., 1996) and dark blue arrows the residues required for the human SKP1-SKP2 interaction (Chan et al., 2013). Black arrows indicate residues mutated to alanine in our studies. Phosphorylation of CFB2 was detected at tyrosine 431, 16 residues N-terminal to the HDPY signal (Urbaniak et al., 2013). (C) The F-box of CFB2 interacts with SKP1: yeast two-hybrid assay. Fusions of SKP1, LaminC (negative control), and p53 with the DNA-binding domain were co-expressed with CFB2 or SV40 T-antigen fused with the transcription activation domain. The interaction between SV40 T-antigen and p53 is the positive control. The upper panel shows selection of transformants on ‘double drop-out’ medium and the lower panel shows selection for the interaction on ‘quadruple drop-out’ medium. (D) A model for CFB2 function. The HDPY motif of CFB2 interacts with MKT1, which recruits PBP1 and EIF4G5. PBP1 recruits PABP2, XAC1, and LSM12, and EIF4G5 is complexed with EIF4E6. Meanwhile, the F-box of CFB2 interacts with SKP1; this might, or might not, be compatible with MKT1 and mRNA binding. CFB2 is shown bound to the 16-mer; some evidence to support this hypothesis is presented later.
Figure 3—figure supplement 1
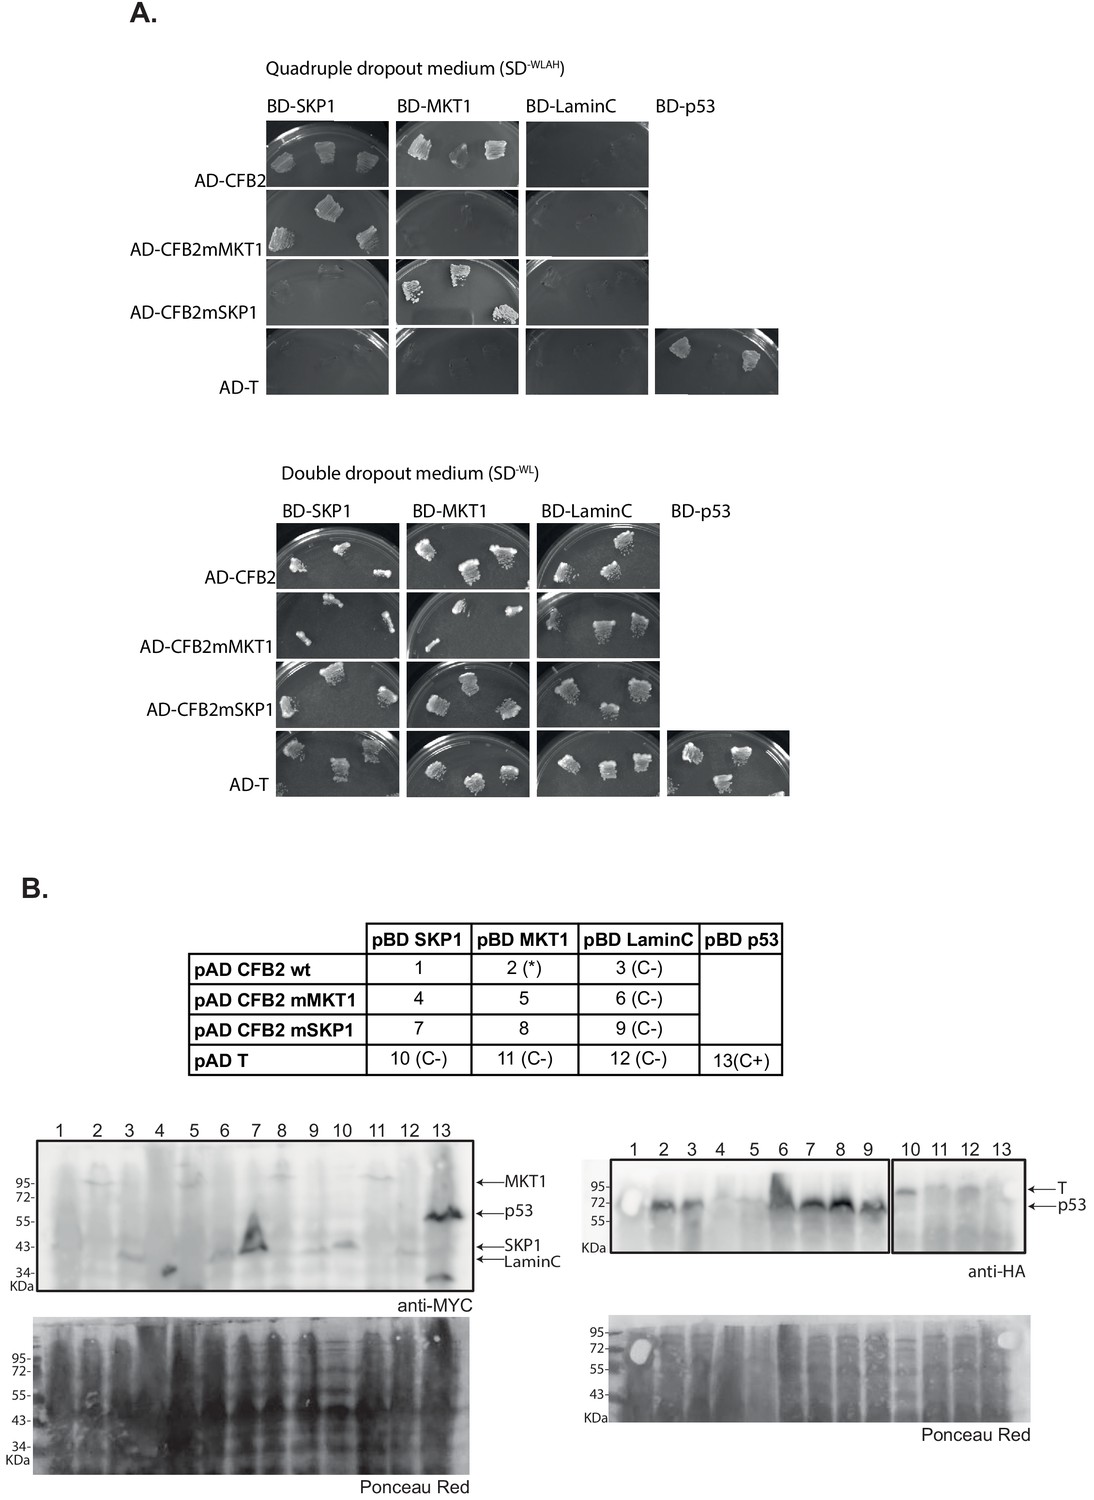
Roles of the F-box and HDPY sequence in protein-protein interactions.
Yeast two-hybrid assays were done using CFB2 (cyclin F-box protein 2) with critical residues of the F-box or MKT1 interaction motif mutated to alanine, as indicated in Figure 3A. (A) Growth of yeast expressing the proteins as indicated; the upper panel group shows growth under selection for the interaction (minus tryptophan, leucine, alanine, and histidine) and the lower panel shows selection only for the presence of the plasmids. (B) Expression of the fusion proteins. The table indicates which lane is which. (*), previously published interaction.
Figure 4 with 1 supplement
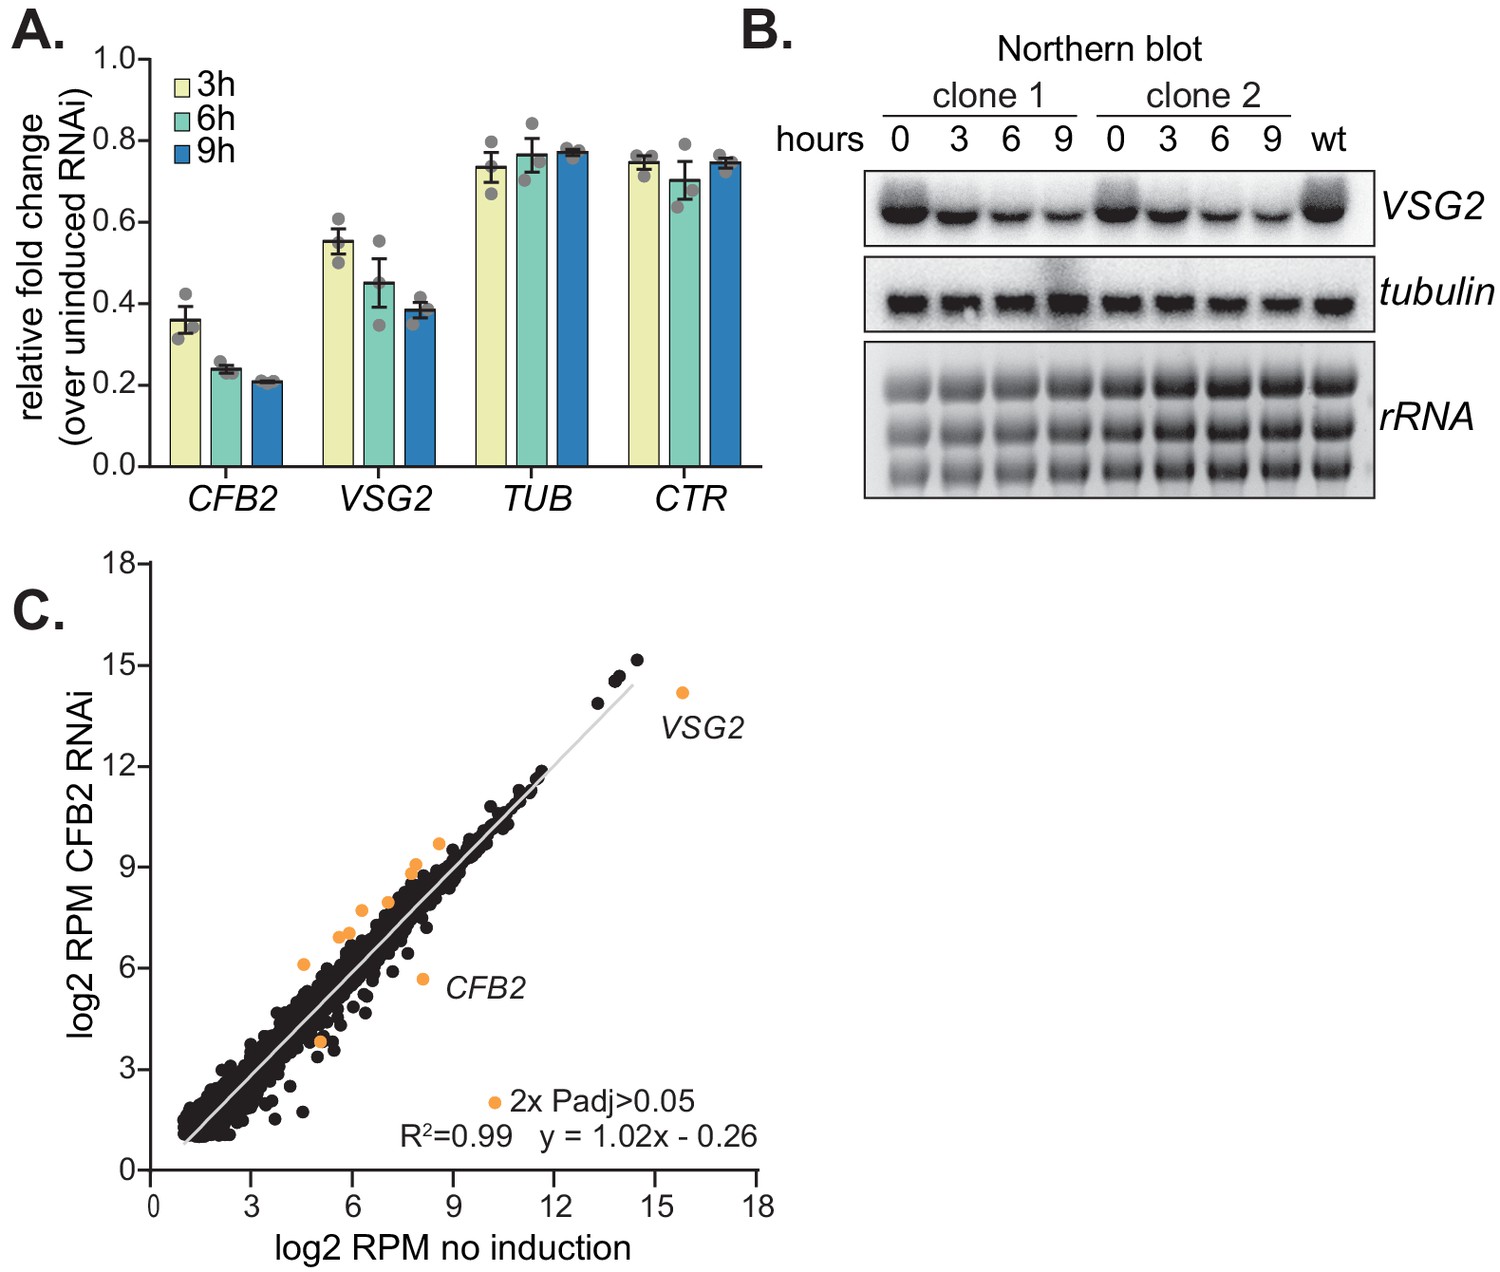
Depletion of CFB2 (cyclin F-box protein 2) results in selective loss of variant surface glycoprotein (VSG) mRNA.
(A) Relative quantification of RNA transcript levels corresponding to the active VSG2 and alpha-tubulin (TUB) mRNAs detected at different sampling time-points (3, 6, 9 hr) after induction of CFB2 RNAi. CTR (co-transposed region) is a sequence located upstream of the VSG gene, which is transcribed from the same promoter but present only in the mRNA precursor. Results were derived from three biological replicate experiments with standard deviation indicated with error bars, normalized against 18S. (B) Representative Northern blot analysis of transcript levels after depletion of CFB2 in cells expressing VSG2; details as in (A). Raw data for this figure are in Figure 2—figure supplement 1. (C) Effect of CFB2 RNAi on the transcriptome. Cells with tetracycline-inducible CFB2 RNAi were used. The average reads per million (RPM) from two replicates were plotted for each open reading frame. Values below two were excluded. Results for Lister427 coding regions are shown (Supplementary file 3). Data for genes which gave an RPM ratio of more than two-fold increase or decrease, and a DeSeq2 adjusted p-value of less than 0.05, are highlighted in orange.
Figure 4—figure supplement 1
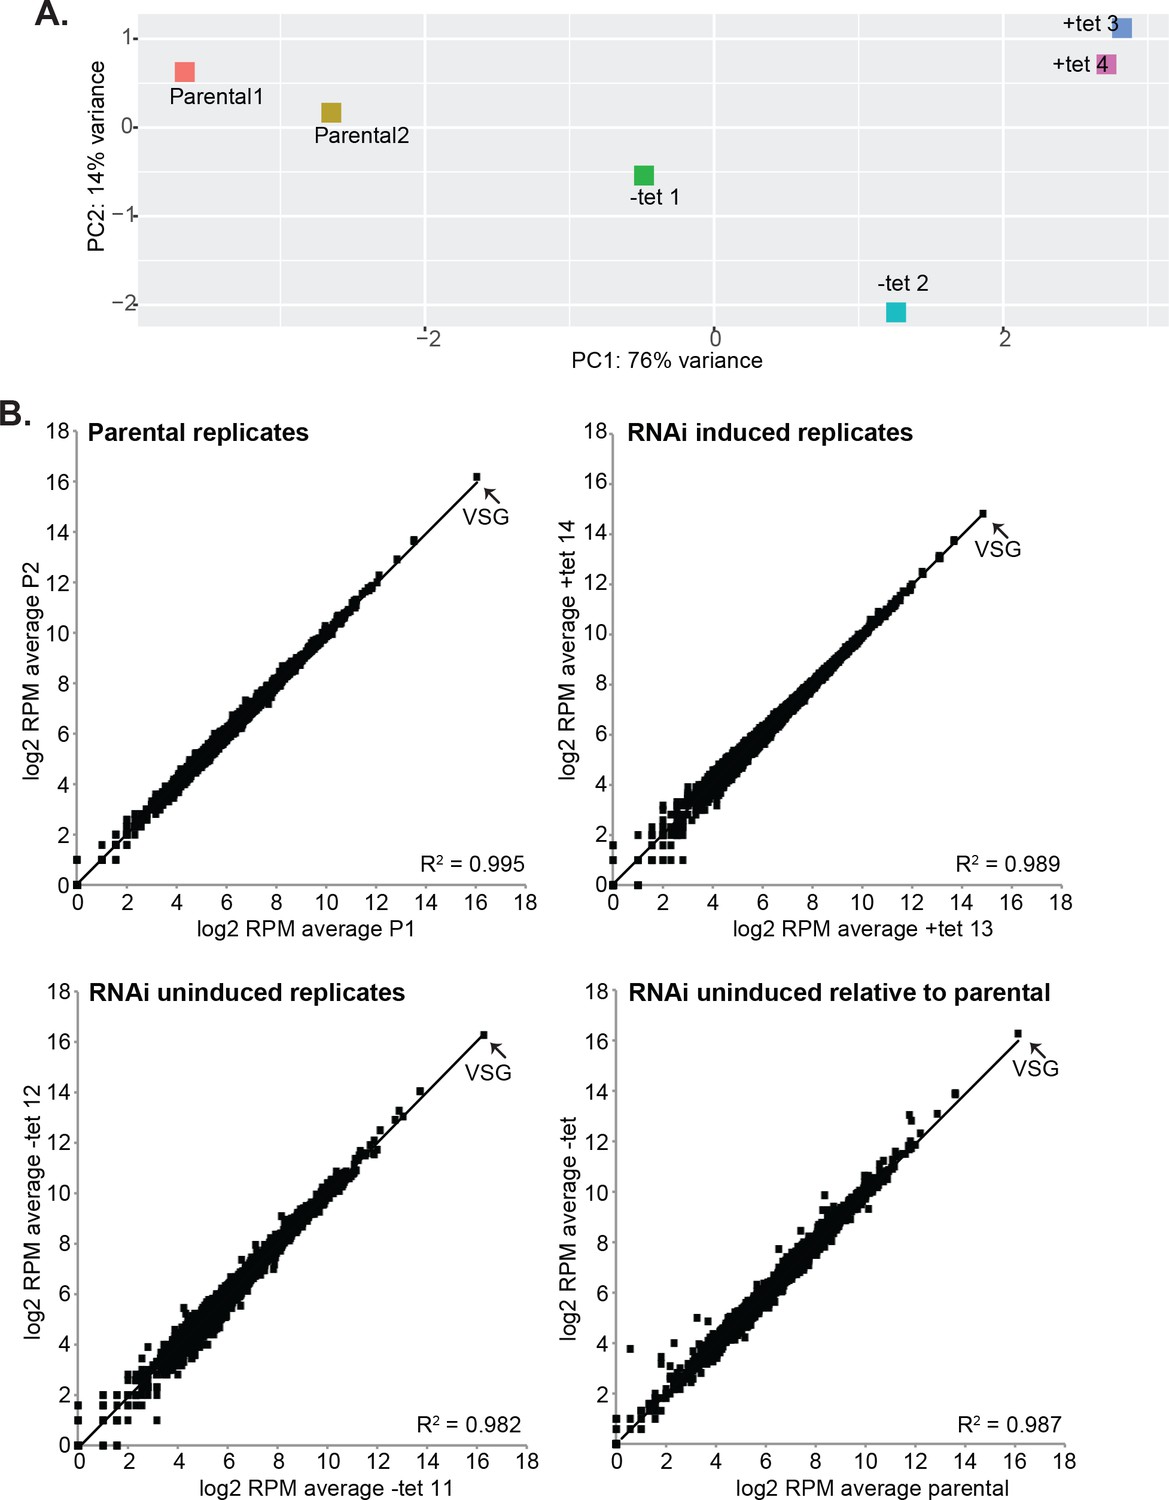
Effects of CFB2 (cyclin F-box protein 2) RNAi on the transcriptome.
Reads were aligned to the Lister427 (2018) genome. (A) Principal component analysis. (B) Correlations between replicates, and between the parental cell line and the RNAi cell line without tetracycline. Every spot represents a single open reading frame.
Figure 5
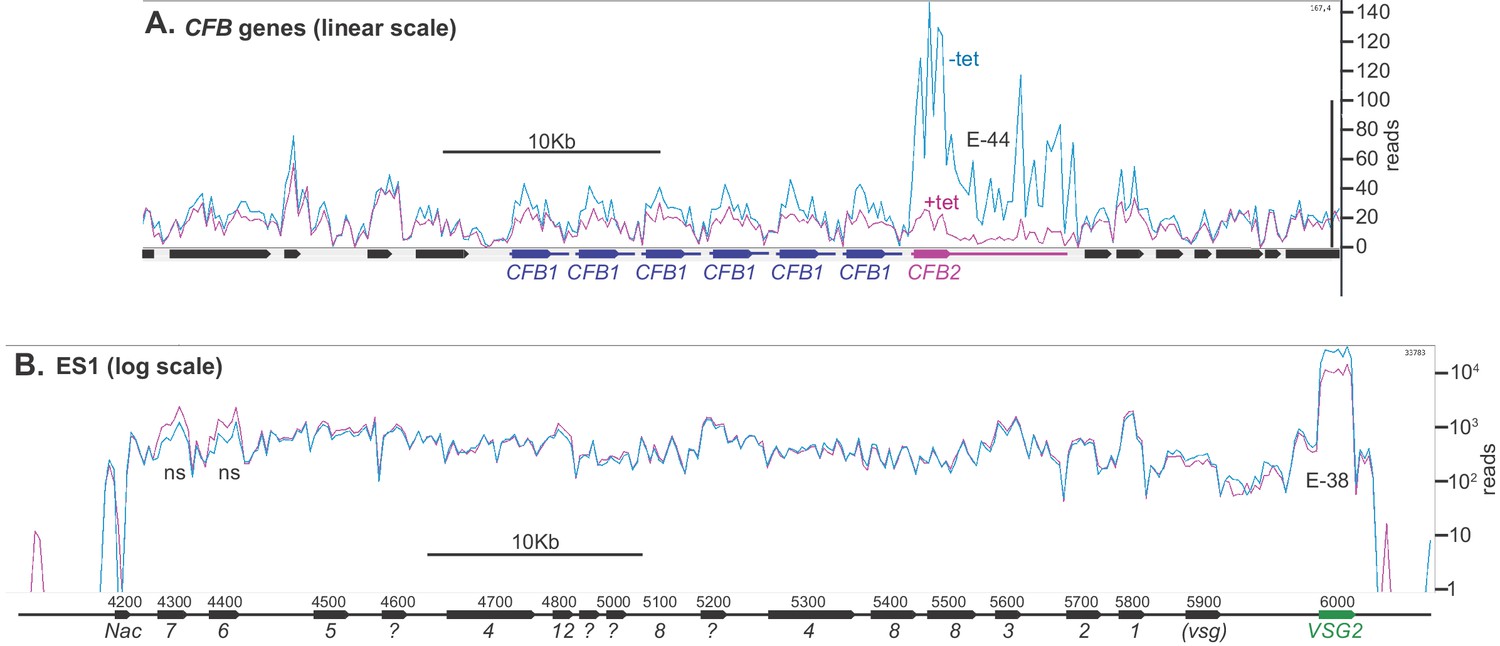
Depletion of CFB2 (cyclin F-box protein 2) does not affect expression site transcripts.
Reads were aligned to the Lister427 genome, allowing one match per read, and visualized using Artemis. Reads from two samples, one with, and one without, tetracycline, were compared because they had similar overall read counts. (A) CFB1 and CFB2 genes, shown on a linear scale. CFB1 open reading frames are in blue and CFB2 in magenta, and the approximate extents of the untranslated regions are indicated by lines. CFB1 and CFB2 share some coding region sequence, but the untranslated regions are different. After tetracycline addition, some reads seen over the CFB2 open reading frame probably actually originate from CFB1 genes. E values are the significance of the change from DeSeq2. (B) Reads aligned over bloodstream-form expression site 1 (BES1), shown on a log10 scale. Most ESAG genes are present in multiple copies in the genome, in expression sites and elsewhere. ESAG mRNAs are less abundant and presumably less stable than the VSG mRNA. ESAGs are normally transcribed from the expression site, although some matching mRNAs may arise from copies elsewhere in the genome. The effect of CFB2 RNAi was exclusive to VSG2. The p-values for significant differences are shown. NS, no significant differences.
Figure 6 with 2 supplements
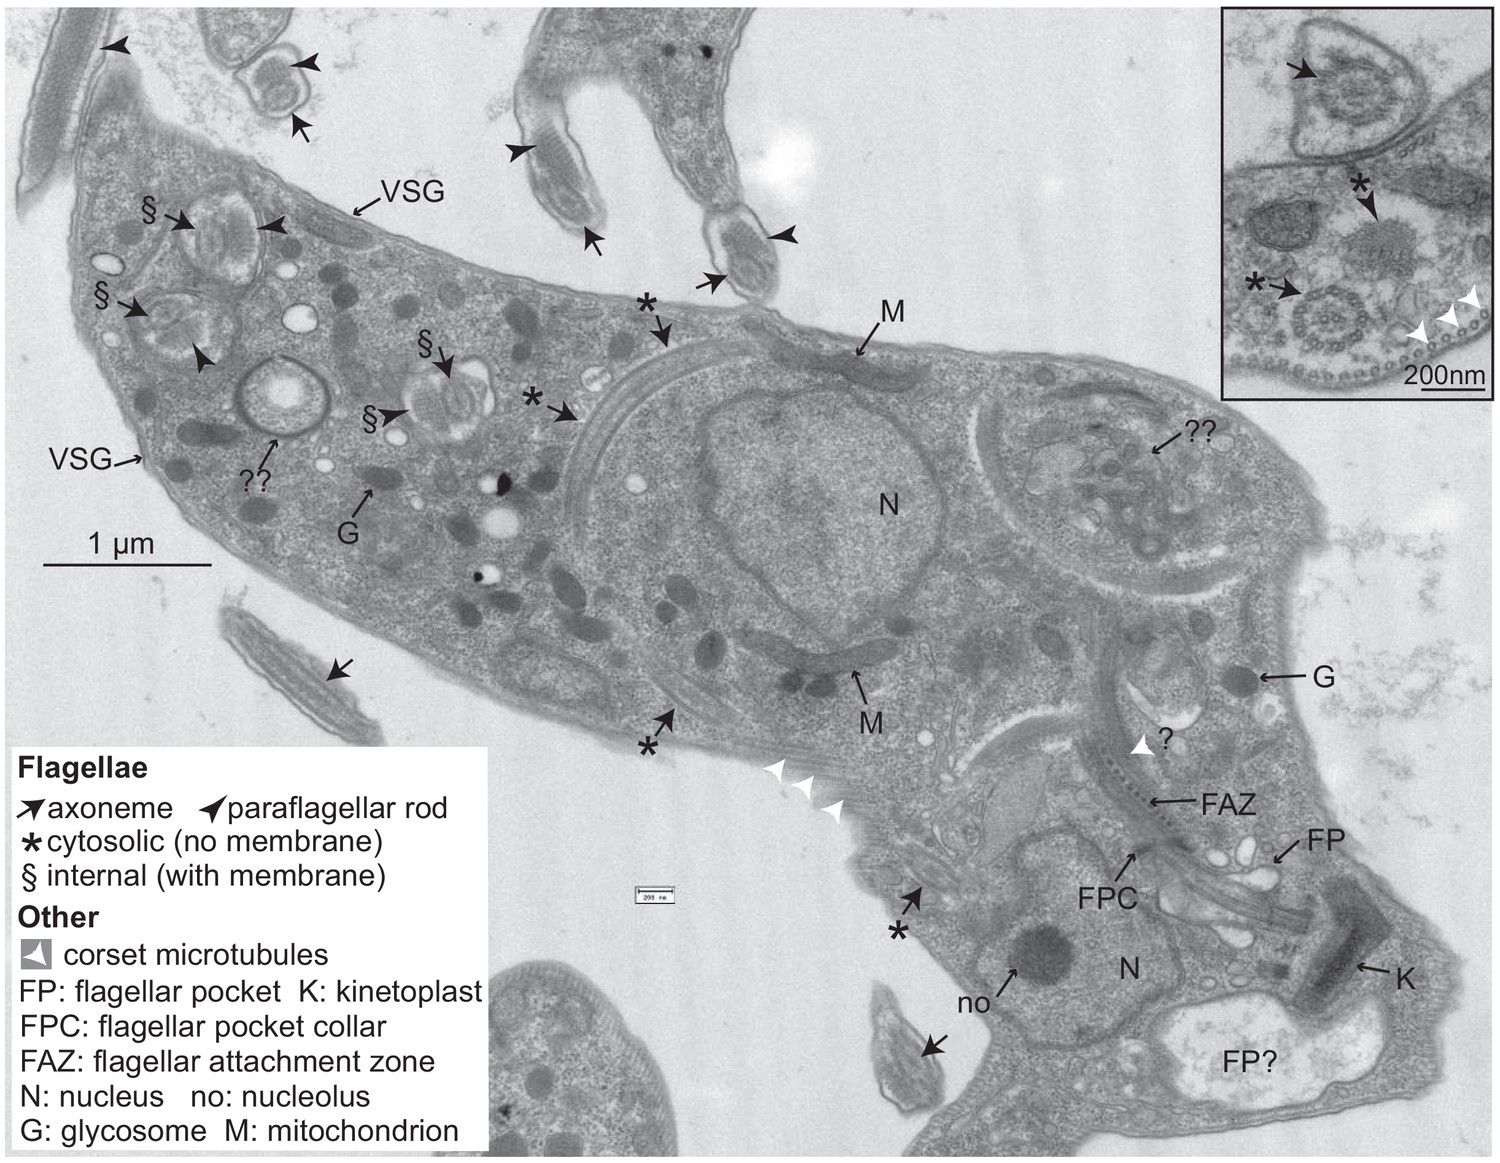
Trypanosomes lacking CFB2 (cyclin F-box protein 2) have internal flagella.
A typical trypanosome 16 hr after induction of RNAi targeting CFB2. The central cell has one flagellar pocket (FP) of normal appearance; the base of the emerging flagellum can be seen. This should exit the cell at the flagellar pocket collar (FPC) and may then run beneath the indicated flagellar attachment zone (FAZ). Next to the neighbouring kinetoplast (K), which has normal morphology, there is a second vacuole that contains low-density material; this could be part of a second, much enlarged, flagellar pocket (the usual FP diameter does not exceed 500 nm; Lacomble et al., 2009). The cell has two nuclei (N), and in one the section passes through the nucleolus (no). The cell contains at least three additional flagellar axonemes. One (*) is found in both longitudinal and transverse cross-sections and lacks a surrounding membrane. Additional axonemes with paraflagellar rods (§) are surrounded by double membranes that may lack the thick variant surface glycoprotein (VSG) coat (indicated at two positions on the cell exterior). The paraflagellar rod is normally seen only on flagella that have exited the FP. The glycosomes (G) and mitochondrion (M) appear normal. Double question marks indicate abnormal membrane structures that are suggestive of autophagy and internal membrane proliferation. The inset shows part of an enlarged flagellar pocket with a membrane-enclosed axoneme; beneath it are the four specialized microtubules that are found next to the FAZ; these usually, however, are associated with endoplasmic reticulum. The section also includes a membrane-less internal flagellum and flagellar rod. More images are in Figure 6—figure supplements 1 and 2.
Figure 6—figure supplement 1
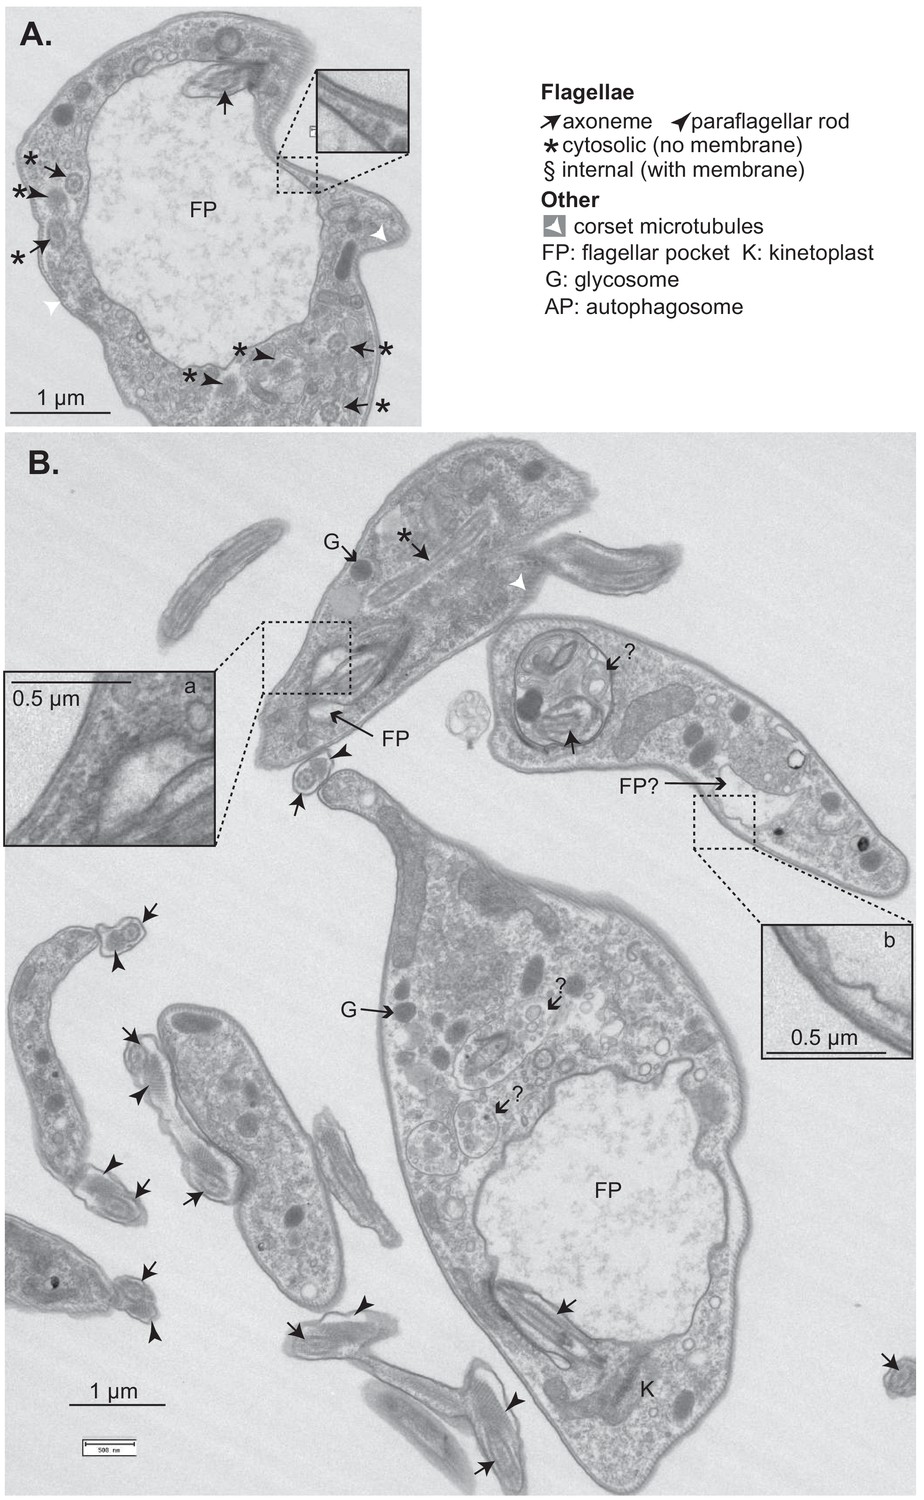
Effects of CFB2 (cyclin F-box protein 2) RNAi on ultrastructure – additional images.
Cells were fixed and stained after 16 hr in tetracycline. (A) Cell with a large flagellar pocket and numerous cytosolic axonemes and paraflagellar rods. The enlargement shows that the variant surface glycoprotein (VSG) layers on the surface and flagellar pocket appear similar. The upper cell has a normal flagellar pocket (enlarged, a) as well as a cytosolic flagellum. The enlarged vesicle or flagellar pocket ‘b’ appears to lack an electron-dense coat. The structures marked ? look like multivesicular bodies or autophagosomes; one of them contains part of an axoneme.
Figure 6—figure supplement 2
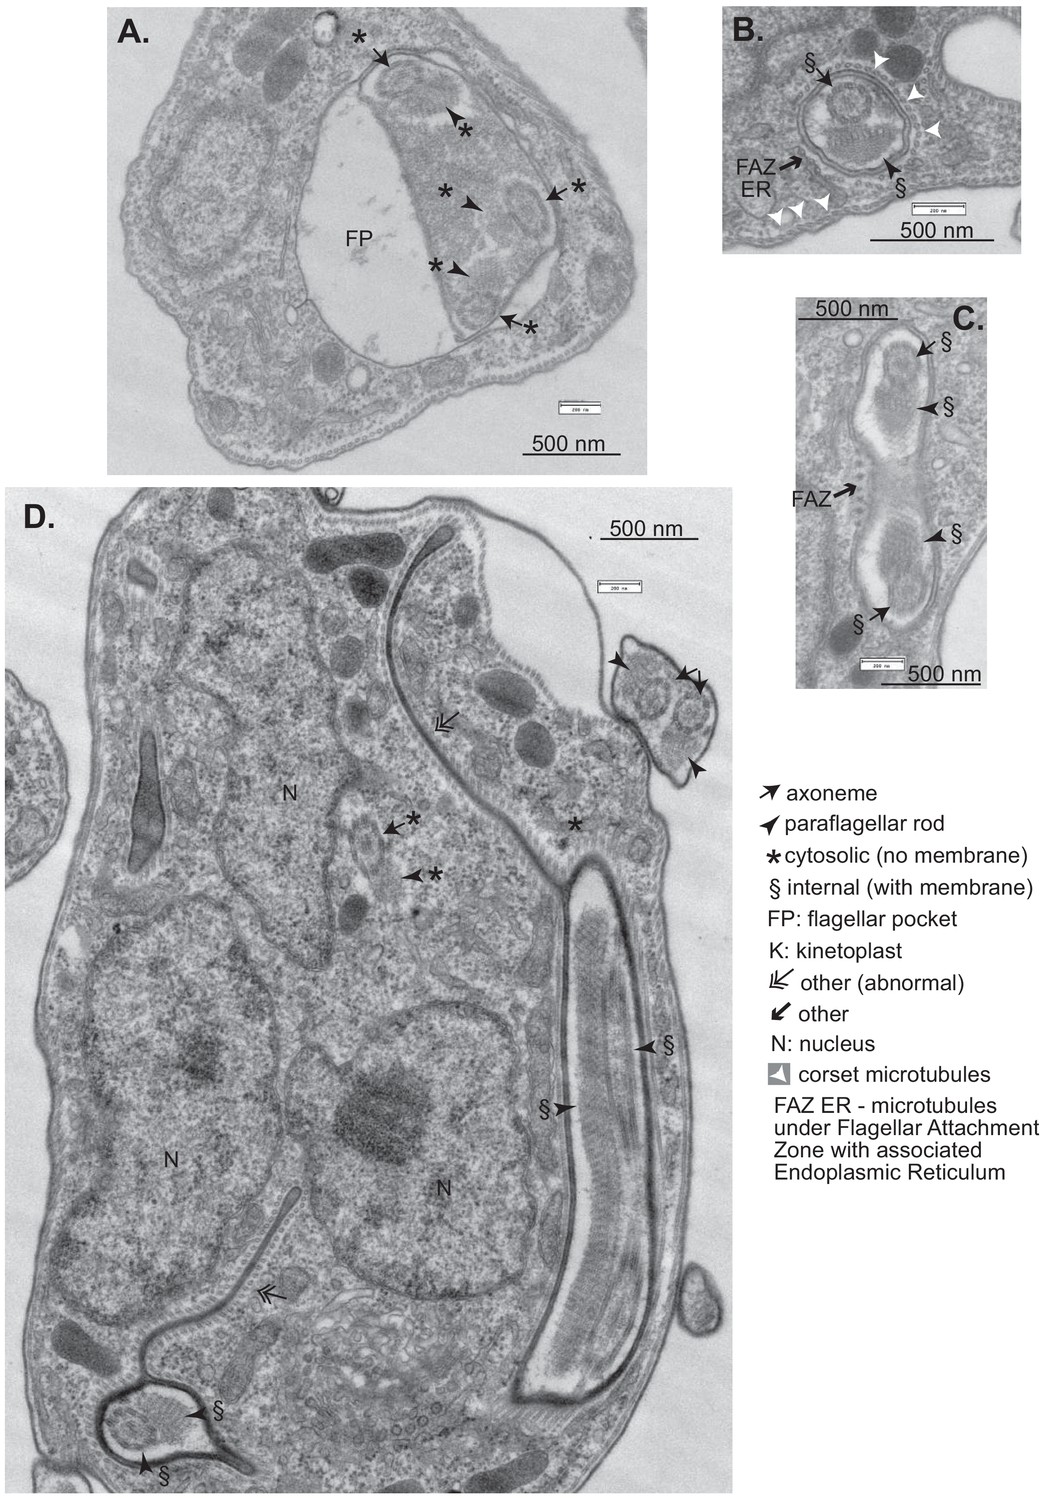
Effects of CFB2 (cyclin F-box protein 2) RNAi on ultrastructure – additional images.
Cells were fixed and stained after 16 hr in tetracycline. (A) Cell containing a cytosolic invagination that includes three axoneme-PFR structures. (B) Full flagellum enclosed in membrane with underlying corset microtubules. There is also a set of four microtubules with underlying ER (endoplasmic reticulum), characteristic of the flagellar attachment zone (FAZ) (Khong and Parker, 2020). (C) Cross-section of a similar tube containing a flagellum. The dots to the left are a FAZ (Khong and Parker, 2020). (D) Cell with extended internal membranes with underlying corset microtubules. This was seen more rarely than the other abnormalities shown.
Figure 7 with 3 supplements
Roles of the SKP1 and MKT1 interaction domains of CFB2 (cyclin F-box protein 2).
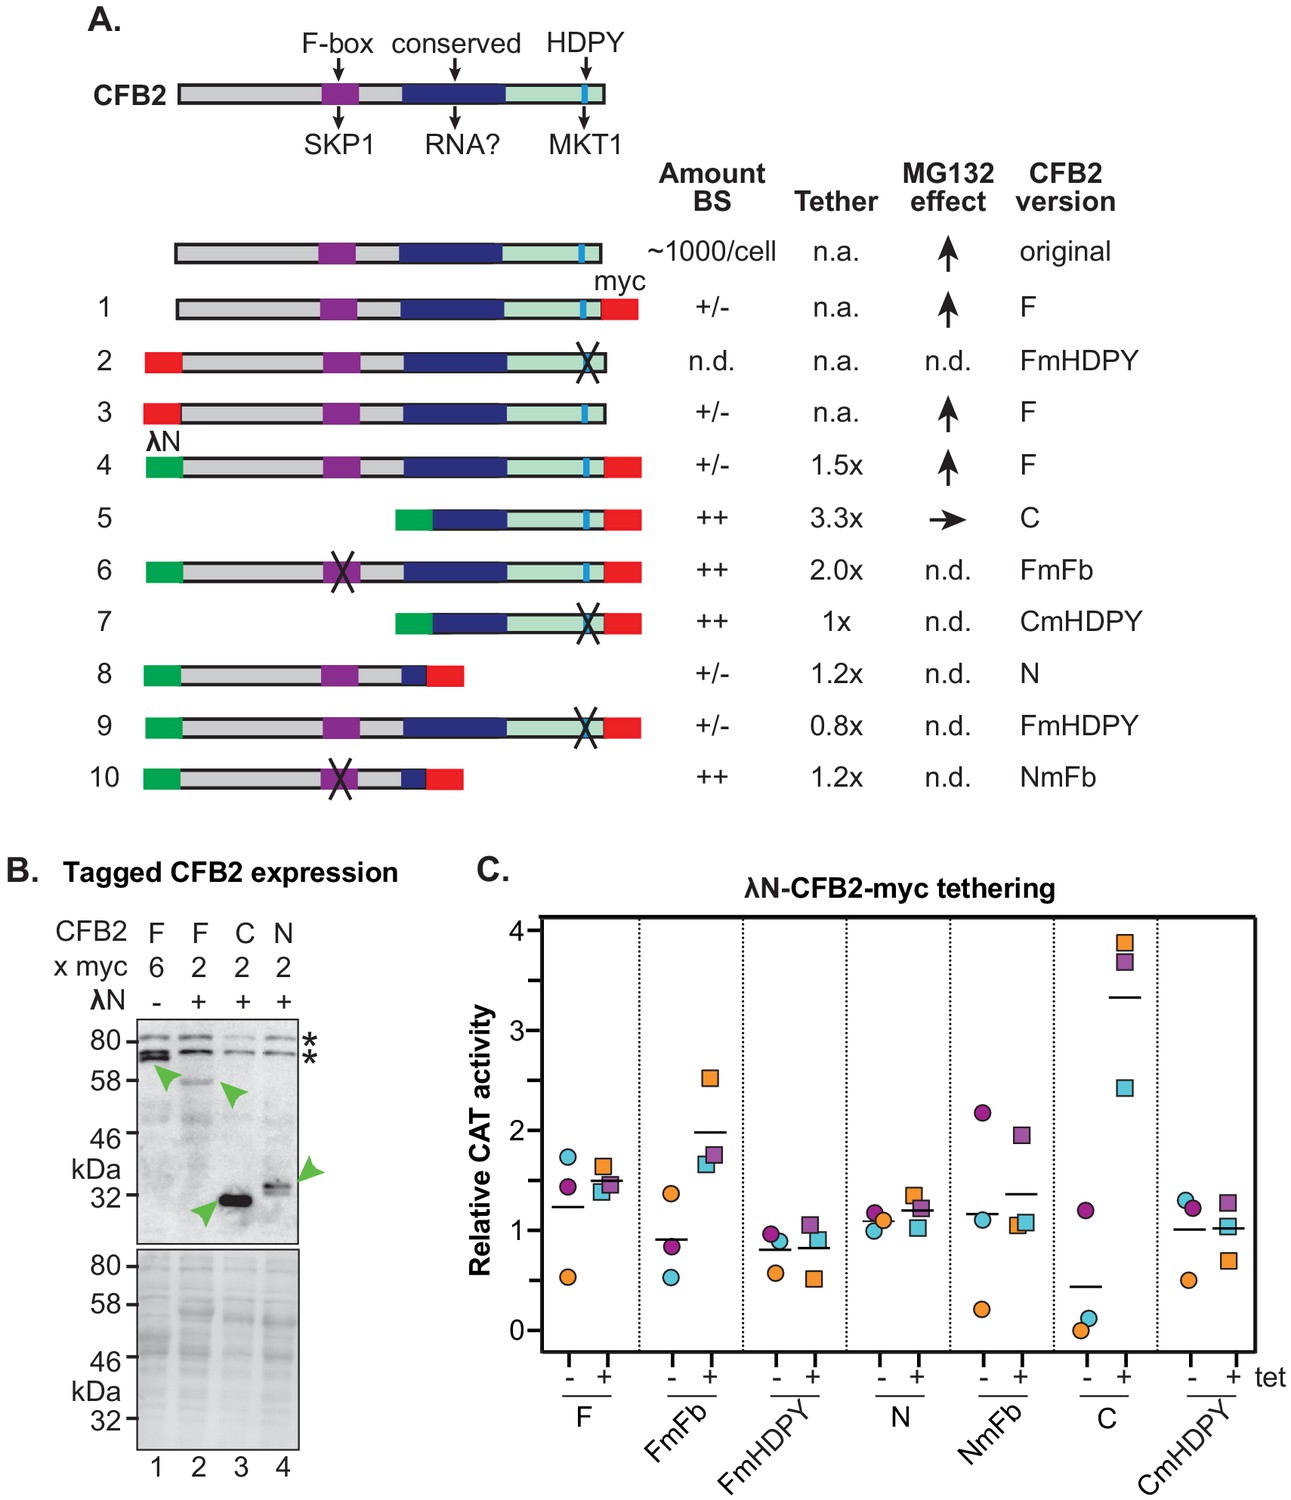
(A) Structures of different expressed versions of CFB2, with expression level, effects when tethered, and effect of MG132 on the expression level as shown in panels B and C. For expression, +/- means difficult to detect, and ++ is very easy to detect using anti-myc antisera, with double myc tags at either N- or C-terminus as indicated. Constructs 1 and 3 exist in two versions. Versions with an rRNA promoter and 6xmyc tags were used for measurement of the MG132 effect in bloodstream forms. Versions with an inducible promoter and two myc tags were used to assess the effect of CFB2 expression in procyclic forms. All other constructs have two myc tags and an inducible promoter. Versions 4–10 have the N-terminal lambdaN peptide. ‘F’ means ‘full length’, ‘C’ means C-terminal portion, ‘N’ means N-terminal portion. Mutations in the F-box (Fb) and in the HDPY motif are illustrated in Figure 3. Abbreviations: n.a., not applicable; n.d., not determined. (B) Expression of fusion proteins in bloodstream forms. Lane 1 shows constitutive expression of CFB2-6xmyc (construct 1) from an rRNA promoter, while lanes 2–4 show expression of different lambdaN-2xmyc-tagged fragments (Lueong et al., 2016; Zoltner et al., 2018; Günzl et al., 2003) after 24 hr induction of expression from a tetracycline-inducible EP procyclin promoter. The myc epitope was detected (green arrow). Whole-cell proteins were visualized by Ponceau (bottom). (C) Graph showing effects of tethering different versions of CFB2 (constructs 4–10). The bloodstream-form trypanosomes used expressed a CAT mRNA followed by five boxB loops, then the actin 3'-untranslated region (3'-UTR). Three independent cell lines were selected for each CFB2 plasmid and CAT activity was measured with or without a 24 hr incubation with 100 ng/ml tetracycline to induce fusion protein expression (Figure 7—figure supplement 1).
Figure 7—figure supplement 1
Antibody tests and CFB2 (cyclin F-box protein 2) protein expression.
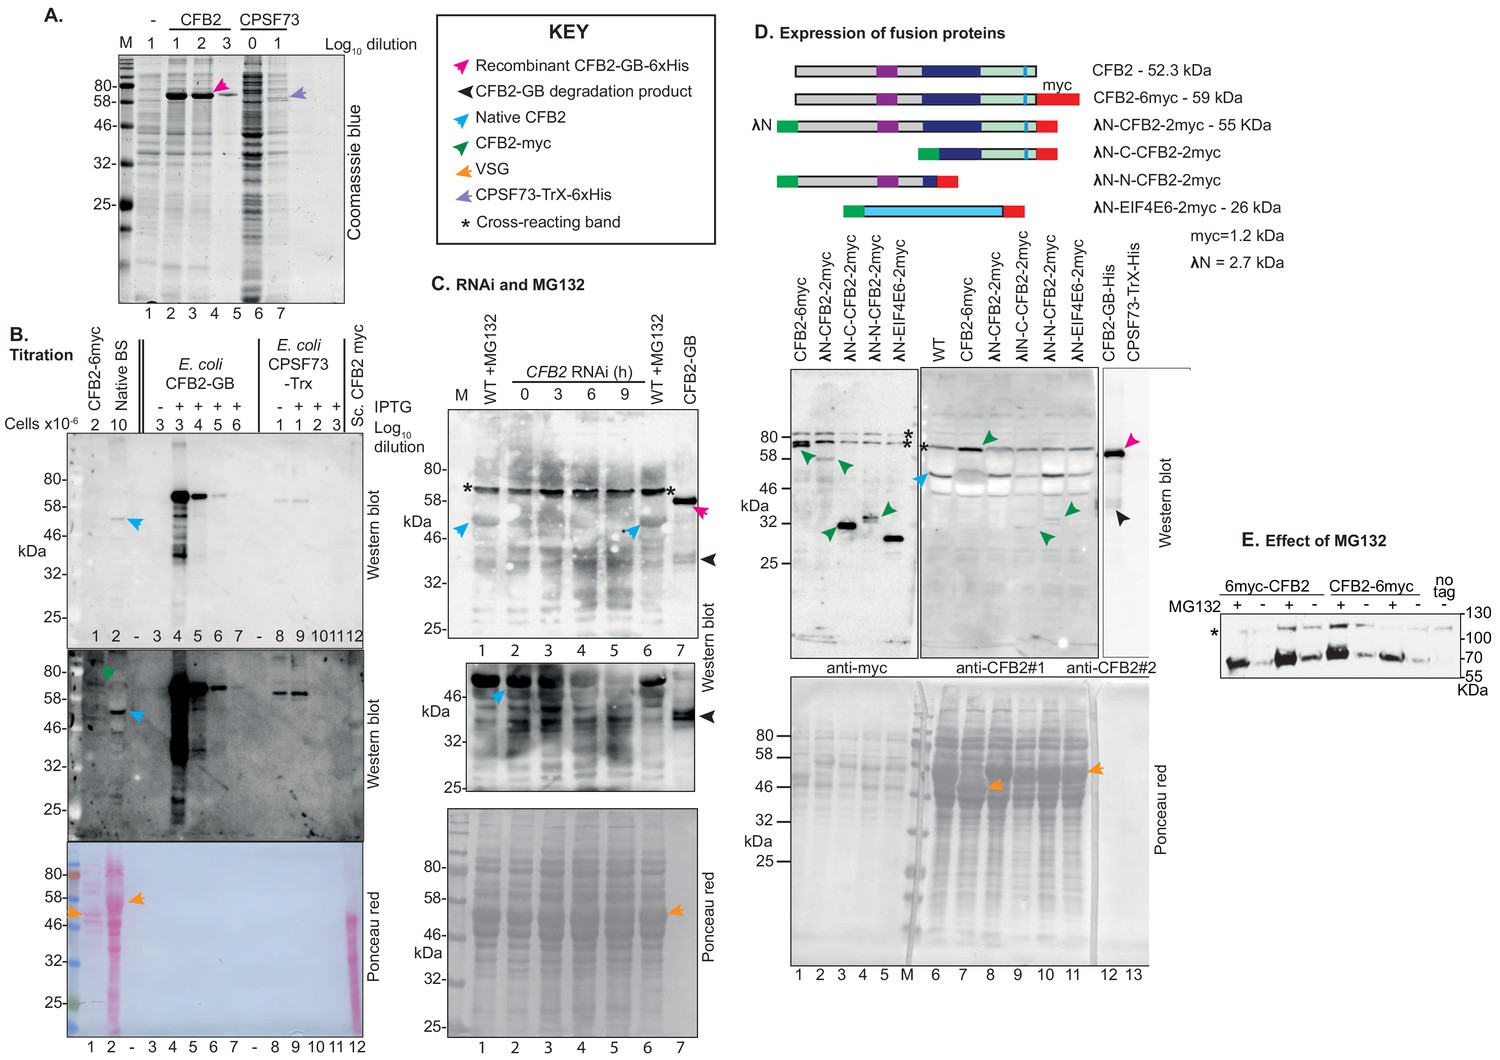
CFB2 was expressed as a fusion with six His tags and NusA at the N-terminus, in BL12 Escherichia coli. Purified inclusion bodies were solubilized in 8 M urea and subjected to denaturing SDS-PAGE. The band containing 6×-His-NusA-CFB2 was used to raise antibodies in a rabbit. For affinity purification, membrane-bound 6×His-GB-CFB2 was used. (A) Coomassie-stained gel showing bacterial lysates, with or without induction of expression of either 6×His-GB-CFB2 or 6×His-Trx-CPSF73 (negative control). Serial dilutions of E. coli extracts are shown. A key for the different arrows is to the right at the top. The 100-fold dilution of 6×His-GB-CFB2 expressing cells (lane 3) gives roughly the same CFB2 band intensity as the markers (probably 1–5 µg each, data not available). The 100-fold dilution exceeds the Coomassie blue detection limit of ~100 ng. (B) CFB2 has relatively low abundance in bloodstream-form trypanosomes. The upper two panels are different exposures of a Western blot, and the third panel is the Ponceau red-stained membrane. In lane 1, lysate of 2 × 10⁶ bloodstream forms expressing CFB2-6xmyc from an rRNA promoter was boiled in Laemmli buffer before loading; in lane 2, 107 bloodstream forms without tagged CFB2 expression were used and the extract was not boiled. Lane 3 is a 10−3× dilution of E. coli containing the 6×His-GB-CFB2 plasmid, but not induced; lane 4 is the same, but induced. Lanes 5–7 are successive 10-fold dilutions of the same extract. Lanes 8–11 are equivalent E.coli extracts, but the cells express 6×His-Trx-CPSF73; larger amounts of input protein were used because the recombinant protein was poorly expressed (see panel A). Lane 12 is an extract of Saccharomyces cerevisiae expressing AD-CFB2-myc; insufficient is present for detection. The top panel shows that the antibody interacts with 6×His-GB-CFB2, and not with 6×His-Trx-CPSF73, although there is a faint cross-reaction with a constitutively expressed E. coli protein of around 60 kDa. The purified antibody, which was raised against CFB2-NusA, is therefore interacting predominantly with CFB2 (trypanosomes do not contain NusA). The CFB2 band in lane 2 has approximately the same intensity as the 105-fold dilution of 6×His-GB-CFB2 E. coli lysate. From panel A, this dilution probably contains 1–10 ng of CFB2, which corresponds to between 1000 and 10,000 protein molecules per cell. (C) Purified anti-CFB2 antibody recognizes a band of the expected size that decreases after CFB2 RNAi and increases after proteasome inhibition. In lanes 1–6, 1 × 10⁷ cells were lysed in sample buffer and loaded onto the gel. In lane 6 and also lane 7, which contains a lysate of E. coli expressing recombinant protein (CFB2-GB), the samples were boiled before loading. Lanes 1 and 6 are wild-type trypanosomes that had been incubated with MG132 for 1 hr. For lanes 2–5, cells with inducible RNAi were used, incubated with tetracycline inducer for the times indicated. The upper image was obtained after the membrane had been incubated with affinity-purified antibody (1/1000 dilution) for 1 hr. For the central panel, the membrane was cut to remove the region above 56 kDa that contains a cross-reacting band, then incubated overnight with the antibody. The lowest panel is the blotted membrane stained with Ponceau red. The key to the different arrows is above the membrane panels. (D) Cells used expressed various fusion proteins as shown in the top diagram. Separate Western blots from the same gel were used, with 2 × 10⁶ loaded for detection of the myc epitope and 2 × 10⁷ for CFB2. The affinity-purified anti-CFB2 antibody was incubated with the membrane overnight. Arrows are as in panel A. The cells expressing CFB2-6myc express VSG2 and the remaining cells express VSG22. (E) The effect of MG132 does not depend on an intact CFB2 N-terminus. Cells constitutively expressing CFB2 with 6myc tags at the N- or C-terminus were used, with or without a 1 hr incubation with MG132. The Western blot was incubated with anti-myc antibodies. The slower-migrating cross-reacting band also serves as a loading control.
Figure 7—figure supplement 2
Tethering screen results and the conserved region C-terminal to the F-box.
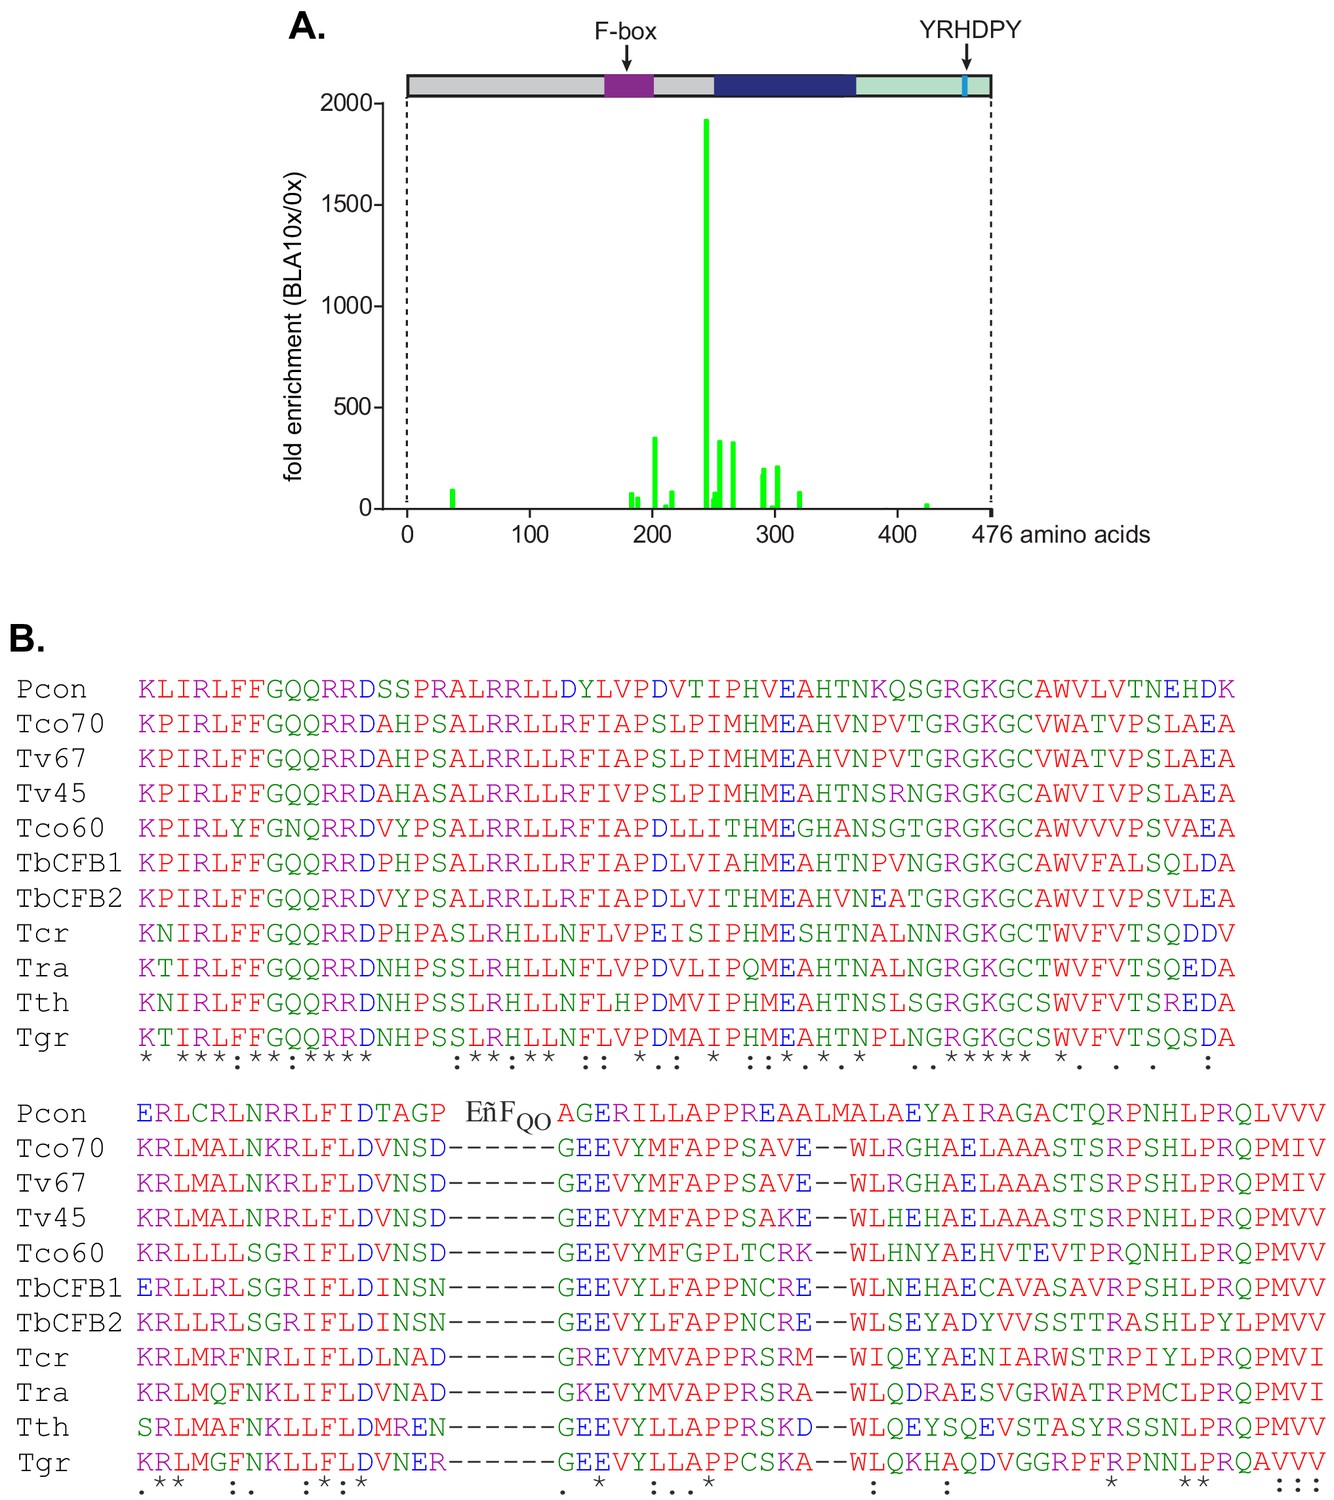
(A) CFB2 (cyclin F-box protein 2) fragments lacking the F-box-activated expression in a tethering screen. The cell line used expressed a blasticidin deaminase mRNA with five copies of box. A library that contained random ~1 kb genomic fragments was transfected, and cells were selected with increasing amounts of blasticidin. Afterwards, the genomic fragments were amplified and sequenced in order to locate the N-termini of expressed fusion proteins. The graph shows the fold enrichment of sequences grown in 10× the normal level of blasticidin, relative to no blasticidin (Theil et al., 2019). High representation of a sequence indicates that a protein starting at that residue was able to increase blasticidin deaminase expression. Only fusion proteins lacking the F-box were active in the assay. A separate assay of complete open reading frames yielded no enrichment of CFB2 (Lueong et al., 2016). (B) Alignment of the conserved domain downstream of the F-box. The colour code for residues is red: non-polar; green: polar; blue: acidic; purple: basic.
Figure 7—figure supplement 3
Expression of CFB2 (cyclin F-box protein 2) lambdaN fusion proteins in bloodstream forms.
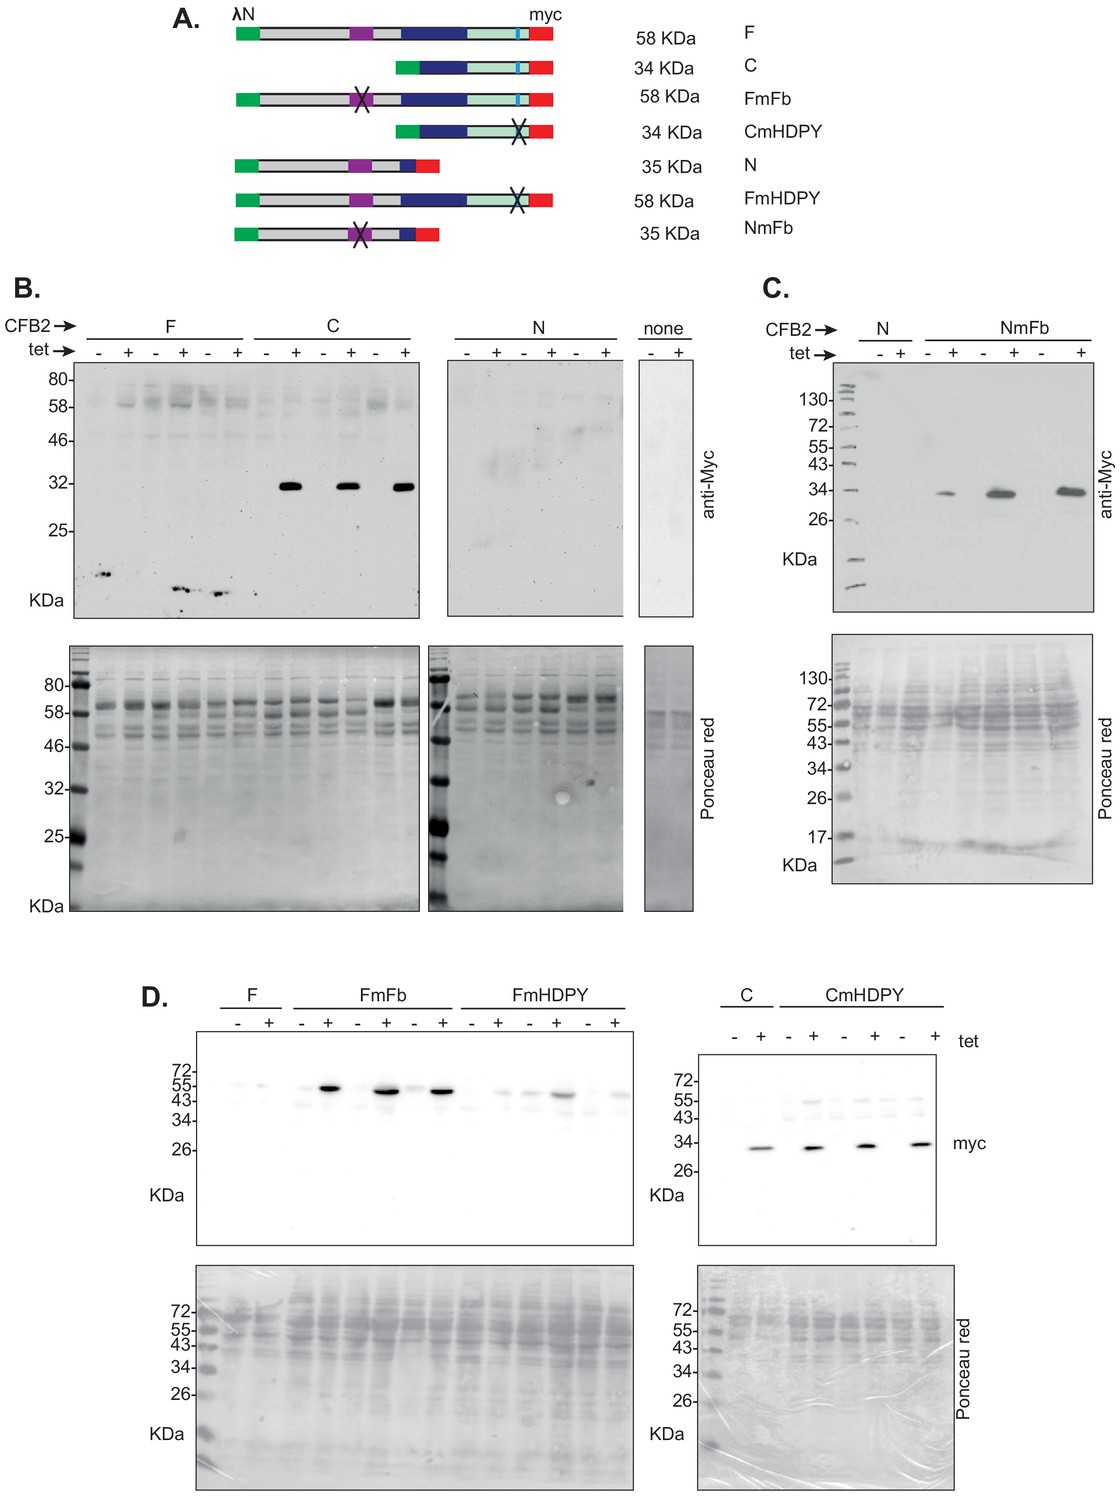
(A) Diagram showing the different fusion proteins and their names: this is the same as the relevant part of Figure 7. (B) Western blots for 2 × 10⁶ cells with or without 24 hr induction with tetracycline. The blots were incubated together with anti-myc antibody, and the signals were detected together in order to have identical exposures. This panel shows that the C-terminal half of CFB2 is much easier to detect than the full-length protein or the N-terminal half. (C) As B: Mutation of the SKP1 binding site results in the N-terminal half becoming detectable. (D) As B: Mutation of the SKP1 binding site results in the full-length protein becoming readily detectable, whereas mutation of the MKT1 binding site has little effect on expression of either full-length CFB2 or the C-terminal half.
Figure 8 with 4 supplements
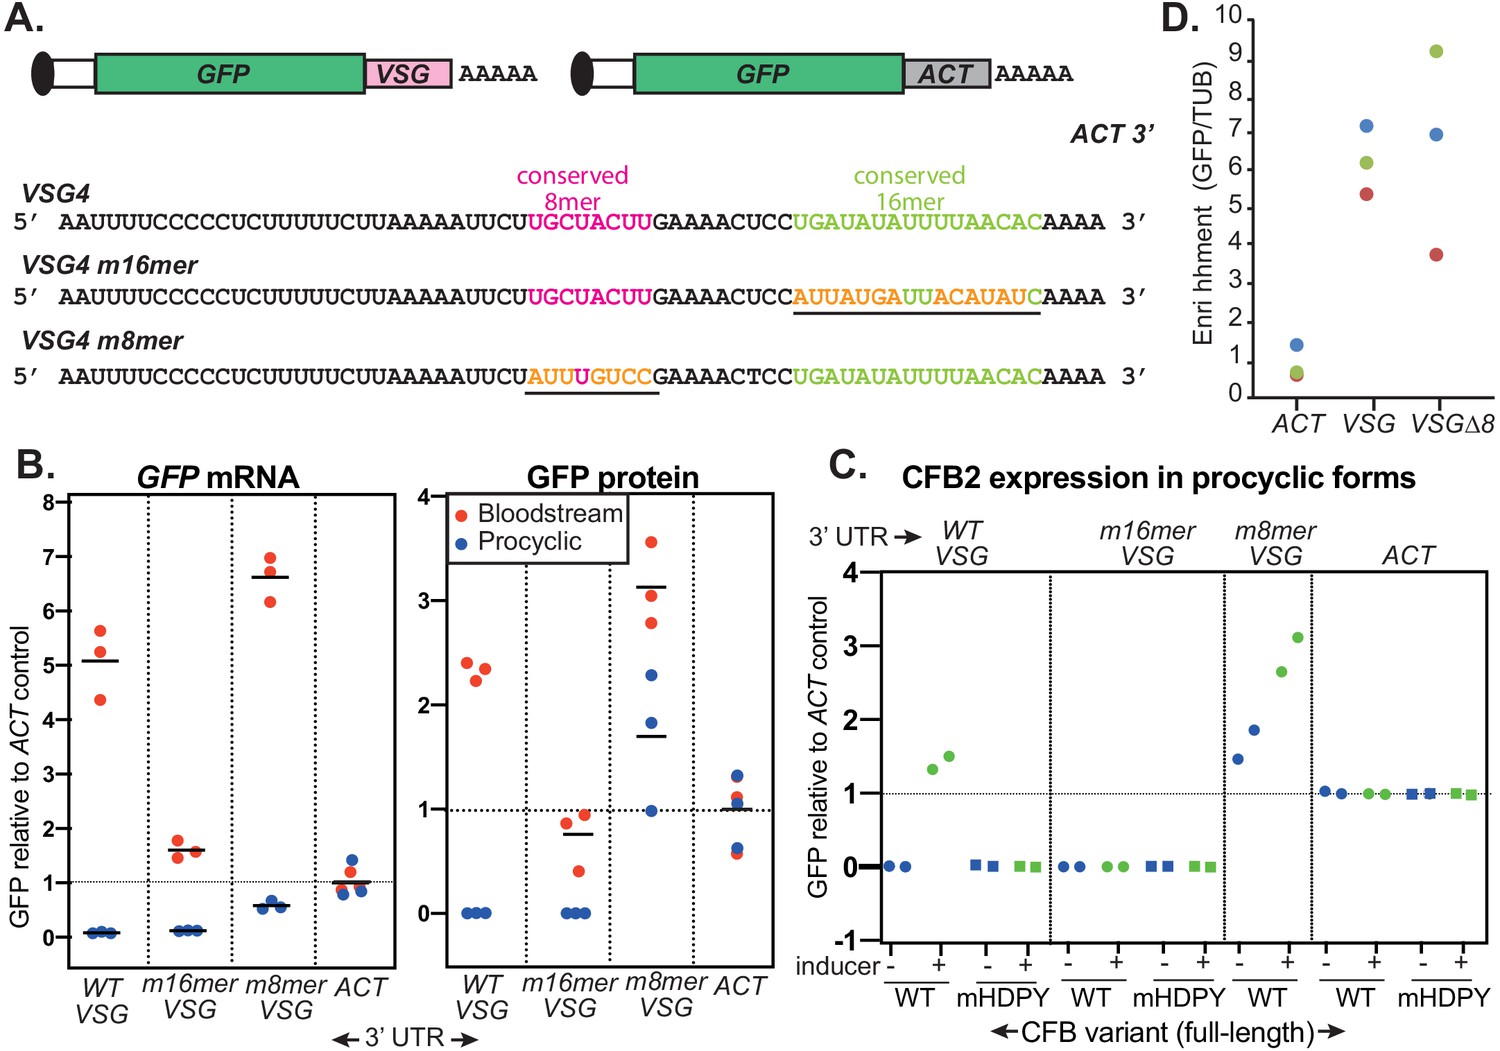
The role of the variant surface glycoprotein (VSG) 3'-untranslated region (3'-UTR).
(A) Diagram of alternative reporters and sequences of the 3'-UTRs. The 3'-UTR from the VSG4 gene was cloned downstream of GFP, with polyadenylation directed by the trans splicing signal of the puromycin resistance cassette. After transfection of the linearized plasmid into trypanosomes, it integrates into an rRNA spacer and is transcribed from an rRNA promoter. (B) EATRO1125 Trypanosoma brucei were transfected with the reporters as bloodstream forms (red), then three independent cloned lines for each construct were transformed to procyclic forms (blue). Levels of GFP were quantified by Western blotting (Figure 8—figure supplement 2), and of mRNA by Northern blotting (Figure 8—figure supplement 3). All mRNAs were of the expected size. Results were normalized to the average for three controls expressing GFP mRNA with an actin (ACT) 3'-UTR. The left-hand panel shows GFP mRNA expression, and the right-hand panel, GFP protein. Individual measurements are shown; the bar is the arithmetic mean. (C) Effect of CFB2 (cyclin F-box protein 2)-2xmyc expression on GFP expression in procyclic forms. For each GFP reporter from (B), we selected the procyclic clone with median expression. This was transfected with CFB2-inducible expression constructs 2 (FmHDPY mutant; green) and 3 (wt; blue) from Figure 7A and two independent cell lines were selected for each CFB2 plasmid. GFP protein was measured after 24 hr incubation with 100 ng/ml tetracycline and quantified by Western Blot (Figure 8—figure supplement 4), and results were normalized to the average for four controls expressing GFP mRNA with an actin (ACT) 3'-UTR. (D) Tagged CFB2 binds to GFP mRNAs via the VSG 3'-UTR. CFB2-2xmyc was immunoprecipitated from the cells shown in (C), and RNA was prepared. The relative amounts of GFP and tubulin (TUB) RNA were then measured by qPCR and the amount in the bound, relative to the unbound, fraction was calculated. Results were then normalized by dividing the result for GFP by the result for TUB. On the graph, results for three biological replicates are shown in different colours.
Figure 8—figure supplement 1
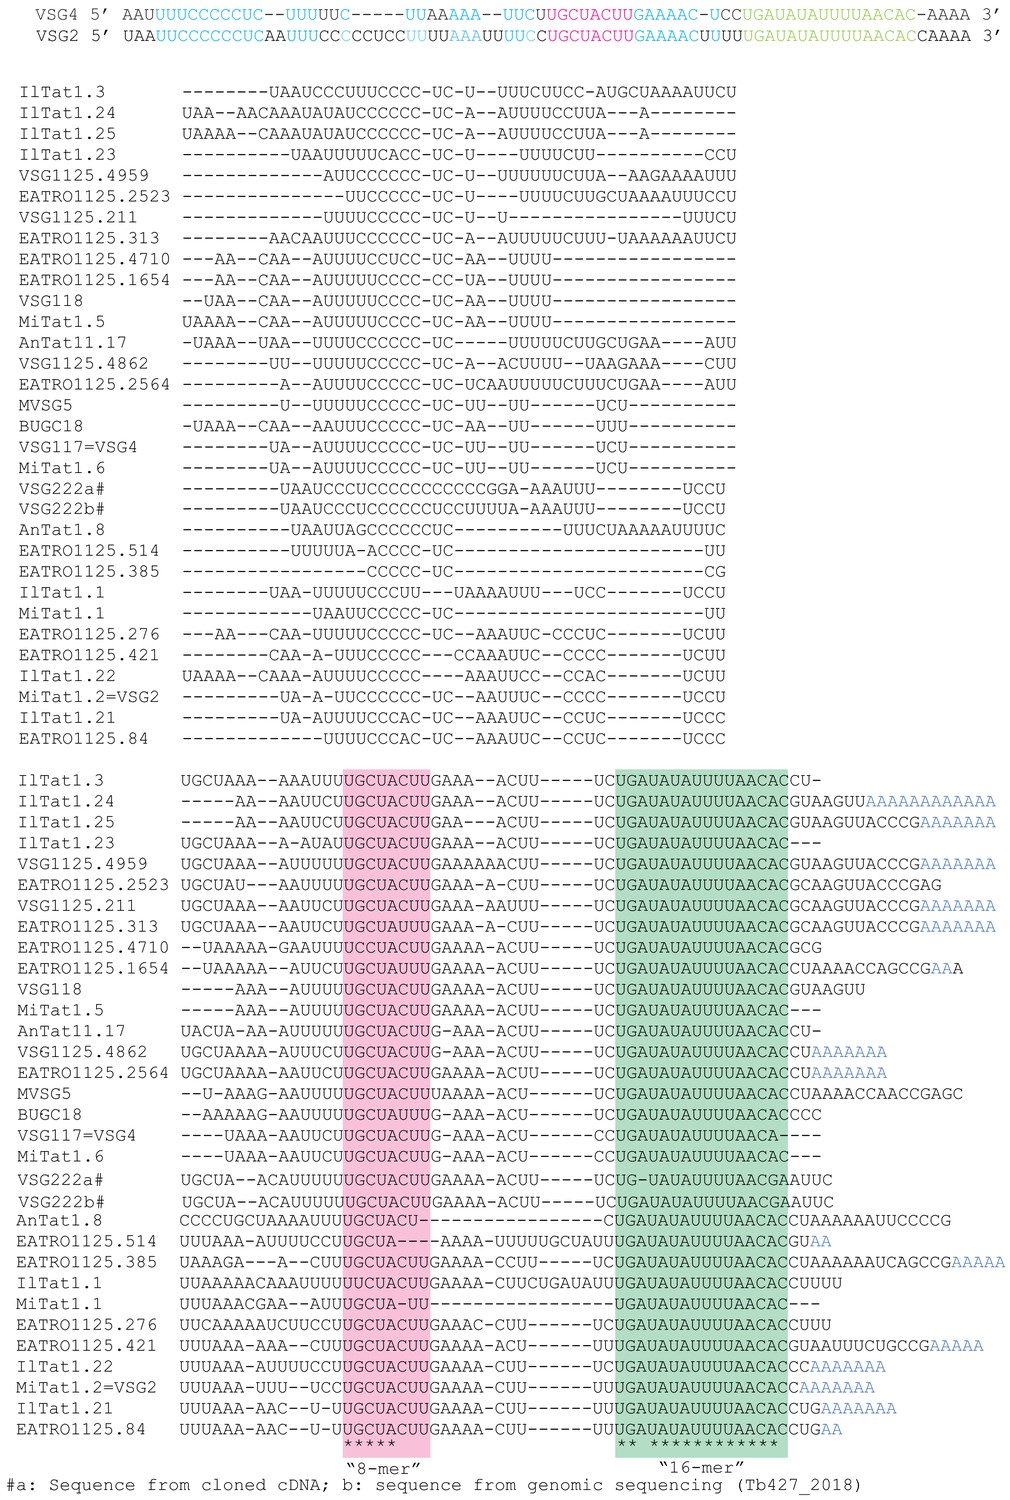
Alignment of variant surface glycoprotein (VSG) 3'-untranslated regions (3'-UTRs), downloaded from GenBank.
Nearly all of the sequences include the conserved C-rich region, 8-mer (pink) and 16-mer (green). Many of the sequences are from cDNA, and in the few cases where the conserved regions are changed, there might be cloning or sequencing error – for example, the apparently mutant cDNA sequence of VSG22 does not match the genomic copy. On the top two lines, the VSG2 3'-UTR is compared with that of VSG4, which was used for GFP reporter experiments; the colour code is the same as that in Figure 8.
Figure 8—figure supplement 2
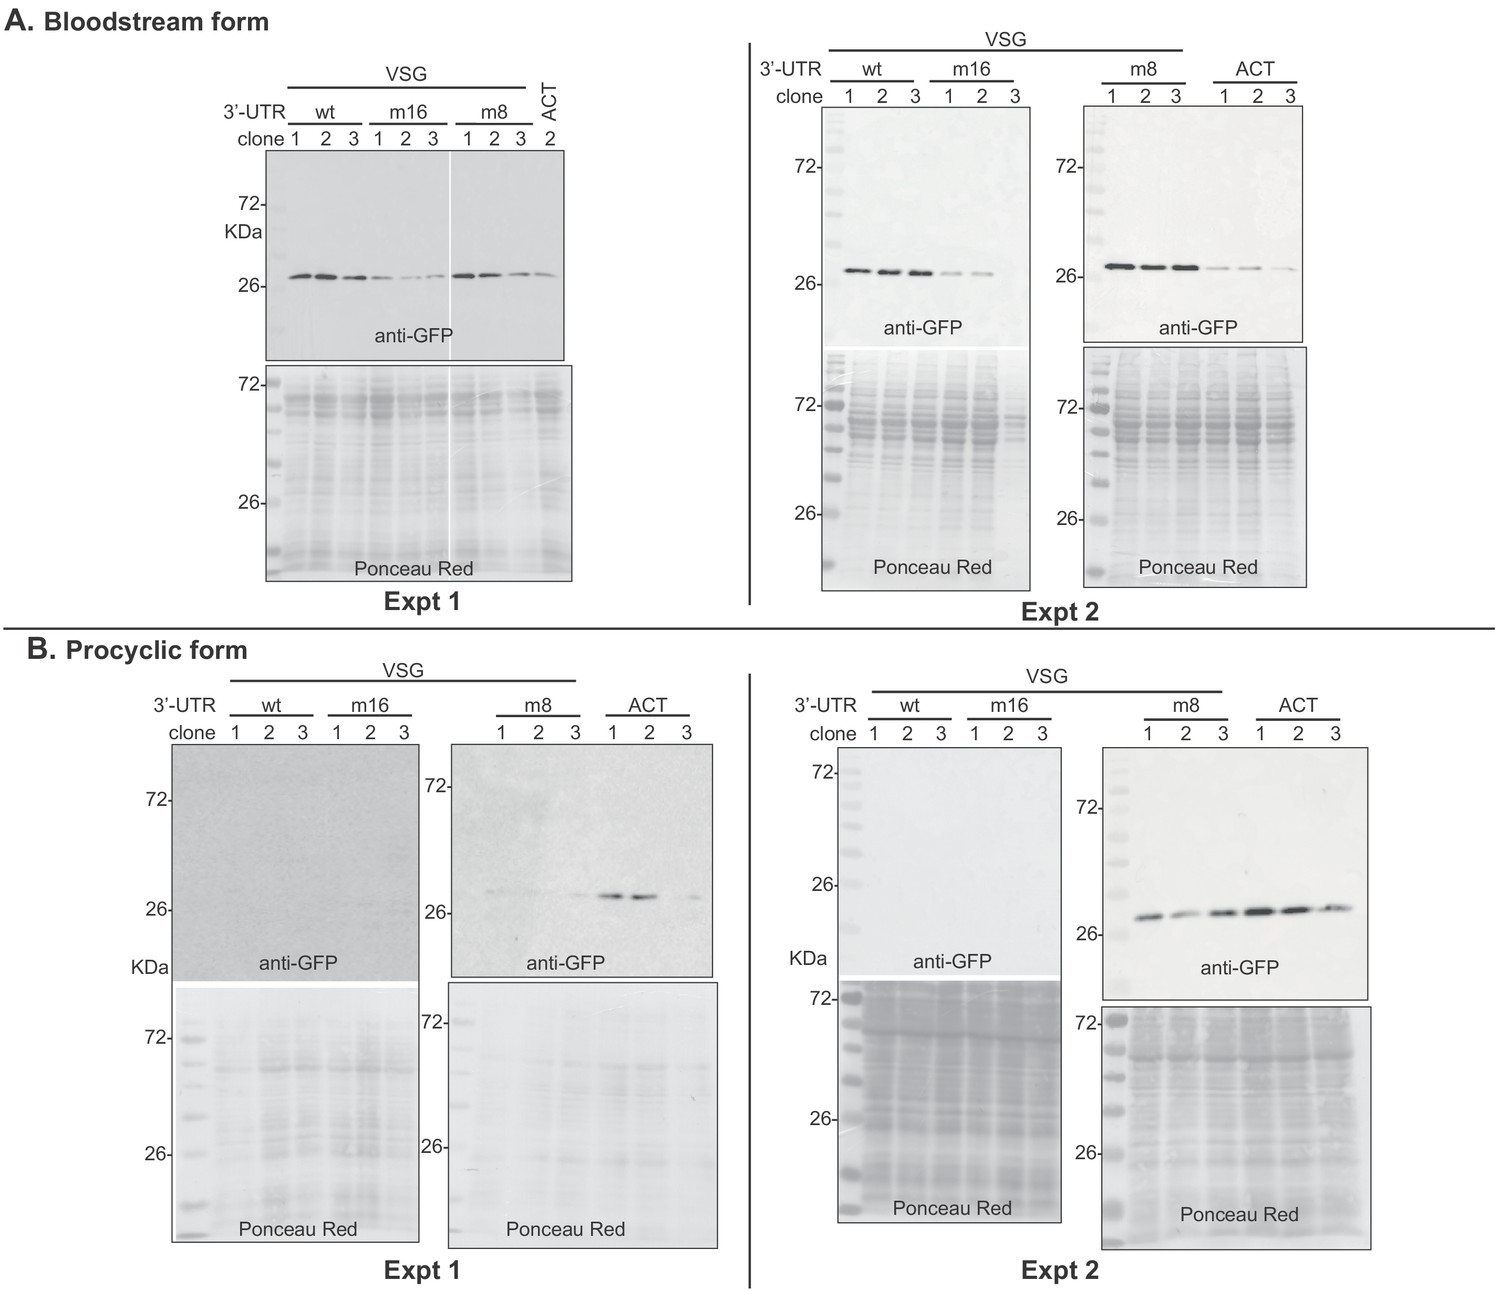
Western blots used for Figure 8.
Groups of two blots that were hybridized and exposed simultaneously are shown as different experiments. For bloodstream forms, quantification was done for experiment 2, except for VSG m16 clone 3, which was lost in that experiment. Instead, VSG m16 clone 3 GFP was quantified relative using the blot of experiment 1. For procyclic forms, data from experiment 2 were used. Signals were normalized to the Ponceau red stain.
Figure 8—figure supplement 3
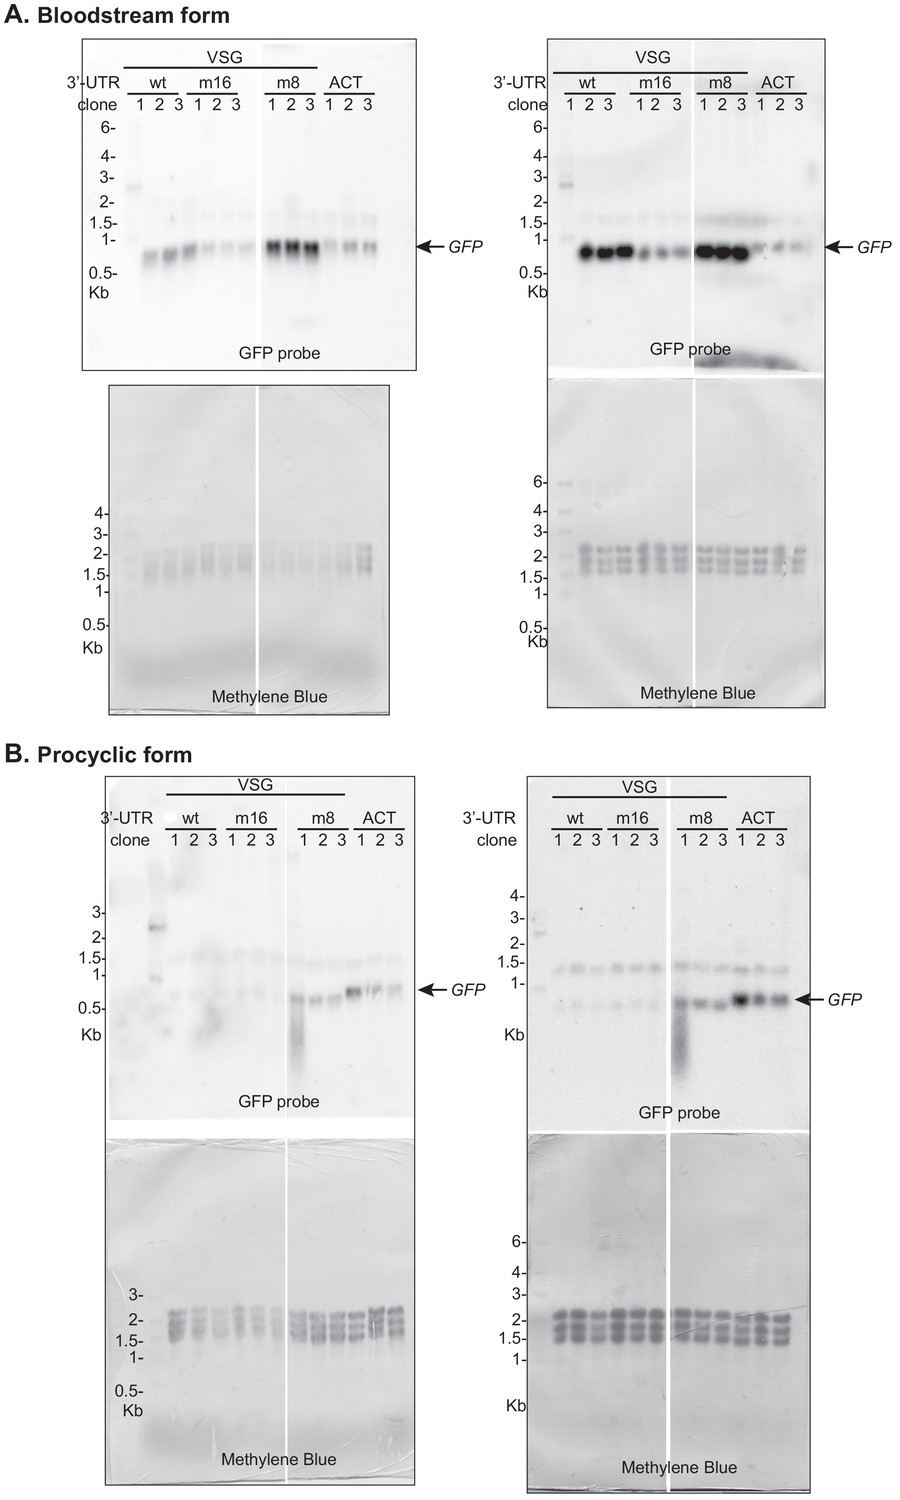
Northern blots used for Figure 8.
Two blots were made using the same RNA samples; quantification was done using the blots on the right. The faint band at 1.5 kb is a cross-reacting RNA. Signals were normalized to the methylene blue stain.
Figure 8—figure supplement 4
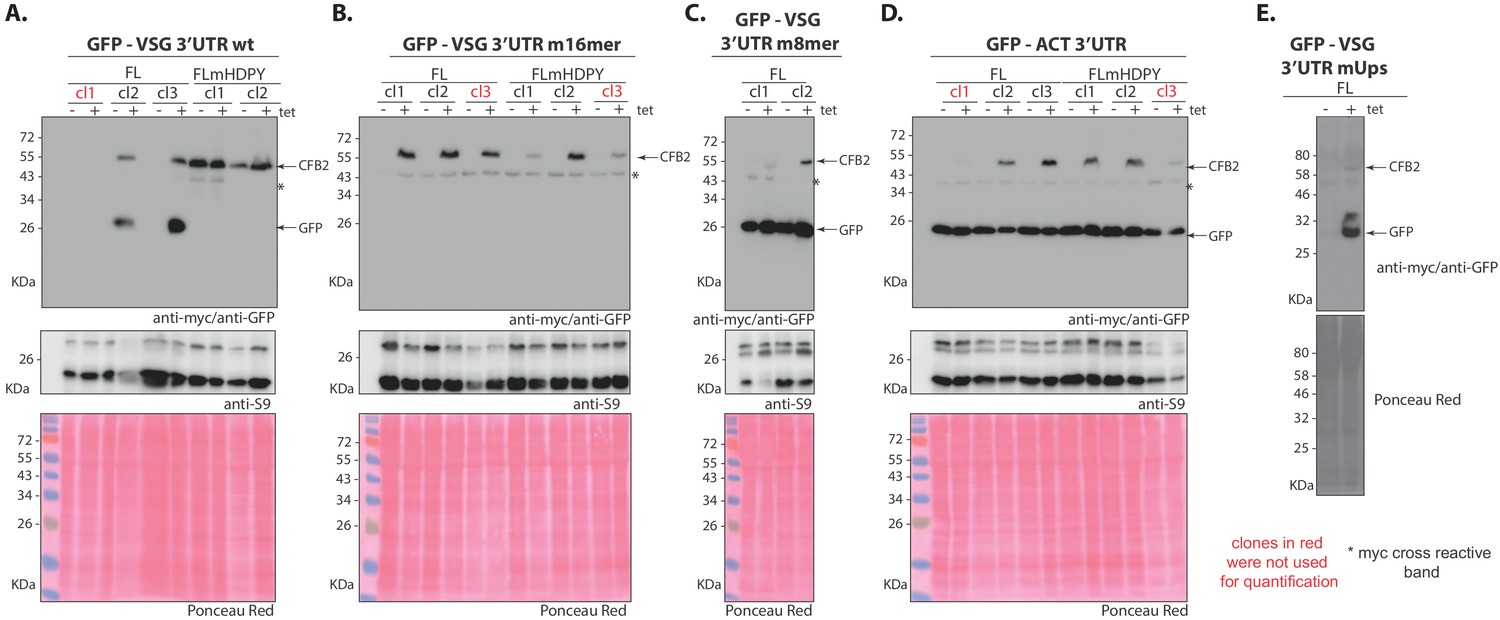
Expression of different versions of CFB2 (cyclin F-box protein 2)-myc in cells with GFP reporters.
Western blots with detection of myc and GFP are above and corresponding loading control (anti-S9) and Ponceau-stained membrane images are below. The migration positions of CFB2-2xmyc, GFP, and S9 are indicated. The sequences of the variant surface glycoprotein (VSG) 3'-untranslated regions (3'-UTRs) are shown in Figure 8. (A) GFP reporter mRNA with a wild-type VSG 3'-UTR. (B) GFP reporter mRNA with 16-mer mutant VSG 3'-UTR. (C) GFP reporter mRNA with 8-mer mutant VSG 3'-UTR. (D) GFP reporter mRNA with ACT 3'-UTR. (E) The upstream region (UUUUCCCCCUCUUUUUCUUAAAAA) was scrambled to CUAUCGCAUCUGUAUCUGACACA. As expected, this plasmid still gave developmentally regulated expression similar to the unmutated 3'-UTR, but only a single procyclic-form clone with inducible expression of CFB2-myc was recovered.
Additional files
-
Supplementary file 1
Plasmids and oligonucleotides used in the experiments.
- https://cdn.elifesciences.org/articles/68136/elife-68136-supp1-v2.xlsx
-
Supplementary file 2
Mass spectrometry results.
The legend is on the first sheet.
- https://cdn.elifesciences.org/articles/68136/elife-68136-supp2-v2.xlsx
-
Supplementary file 3
Effects of RNAi on the transcriptome: alignment to the Lister427_2018 genome.
Reads were aligned to the Lister427_2018 genome. Each read was allowed to align once. The legend is on the first sheet of the table. Annotations are often approximate since it is sometimes not clear which TREU927 gene is a true homologue of the Lister427 versions, especially for gene families.
- https://cdn.elifesciences.org/articles/68136/elife-68136-supp3-v2.xlsx
-
Supplementary file 4
Effects of RNAi on the transcriptome: alignment to the TREU927 genome.
Reads were aligned to the TREU927 genome. Each read was allowed to align once. The legend is on the first sheet of the table. The sheet that includes the unique gene set, in which each set of repeated genes has only one representative, allows judgement of whether any particular functional class is enriched.
- https://cdn.elifesciences.org/articles/68136/elife-68136-supp4-v2.xlsx
-
Transparent reporting form
- https://cdn.elifesciences.org/articles/68136/elife-68136-transrepform-v2.docx
Download links
A two-part list of links to download the article, or parts of the article, in various formats.
Downloads (link to download the article as PDF)
Open citations (links to open the citations from this article in various online reference manager services)
Cite this article (links to download the citations from this article in formats compatible with various reference manager tools)
Functional insights from a surface antigen mRNA-bound proteome
eLife 10:e68136.
https://doi.org/10.7554/eLife.68136


