Quantitative transportomics identifies Kif5a as a major regulator of neurodegeneration
- Byers Eye Institute and Spencer Center for Vision Research, Stanford University, United States
- Scripps Research, Neuroscience Department and the Dorris Neuroscience Center, United States
- Neuroscience Graduate Program and Medical Scientist Training Program, University of California, San Diego, United States
- Scripps Research, Department of Molecular Medicine, United States
- Department of Neuroscience, Johns Hopkins University School of Medicine, United States
Figures
Figure 1 with 1 supplement

Pulsed N-hydroxysuccinimidobiotin (NHS-biotin) labels and quantifies protein transport after injury.
(a) NHS-biotin (biotin group in blue) reacts with primary amines adding a defined mass shift to tagged proteins. (b) NHS-biotin (blue) was injected before injury with a repeat injection 21 hr later. Biotinylated proteins in retinal ganglion cells (RGCs) transport down intact RGC axons in the optic nerve. The retinas and optic nerves were collected for tissue processing after 3 hr. (c) No biotinylated proteins were detected by immunofluorescence distal to the crush site. Scale bar, 100 µm. (d) Pearson’s R correlation of proteomic replicates of control or optic nerve crush (ONC) samples (R = 0.805 and 0.914, respectively). (e) Ponceau S stain of protein from biotinylated retinas and optic nerves, with and without ONC, showing equivalent total protein. Molecular ladder labeled on left of blot. (f) Western blot of the same samples run in parallel, probing for biotin. ONC decreased biotinylated proteins to a greater extent in ON compared to retina. Molecular ladder labeled on left of blot.
-
Figure 1—source data 1
Proteomic quantification of transportome changes after ONC from Figure 1b.
- https://cdn.elifesciences.org/articles/68148/elife-68148-fig1-data1-v2.xlsx
-
Figure 1—source data 2
Raw western blots from Figure 1.
- https://cdn.elifesciences.org/articles/68148/elife-68148-fig1-data2-v2.zip
Figure 1—figure supplement 1
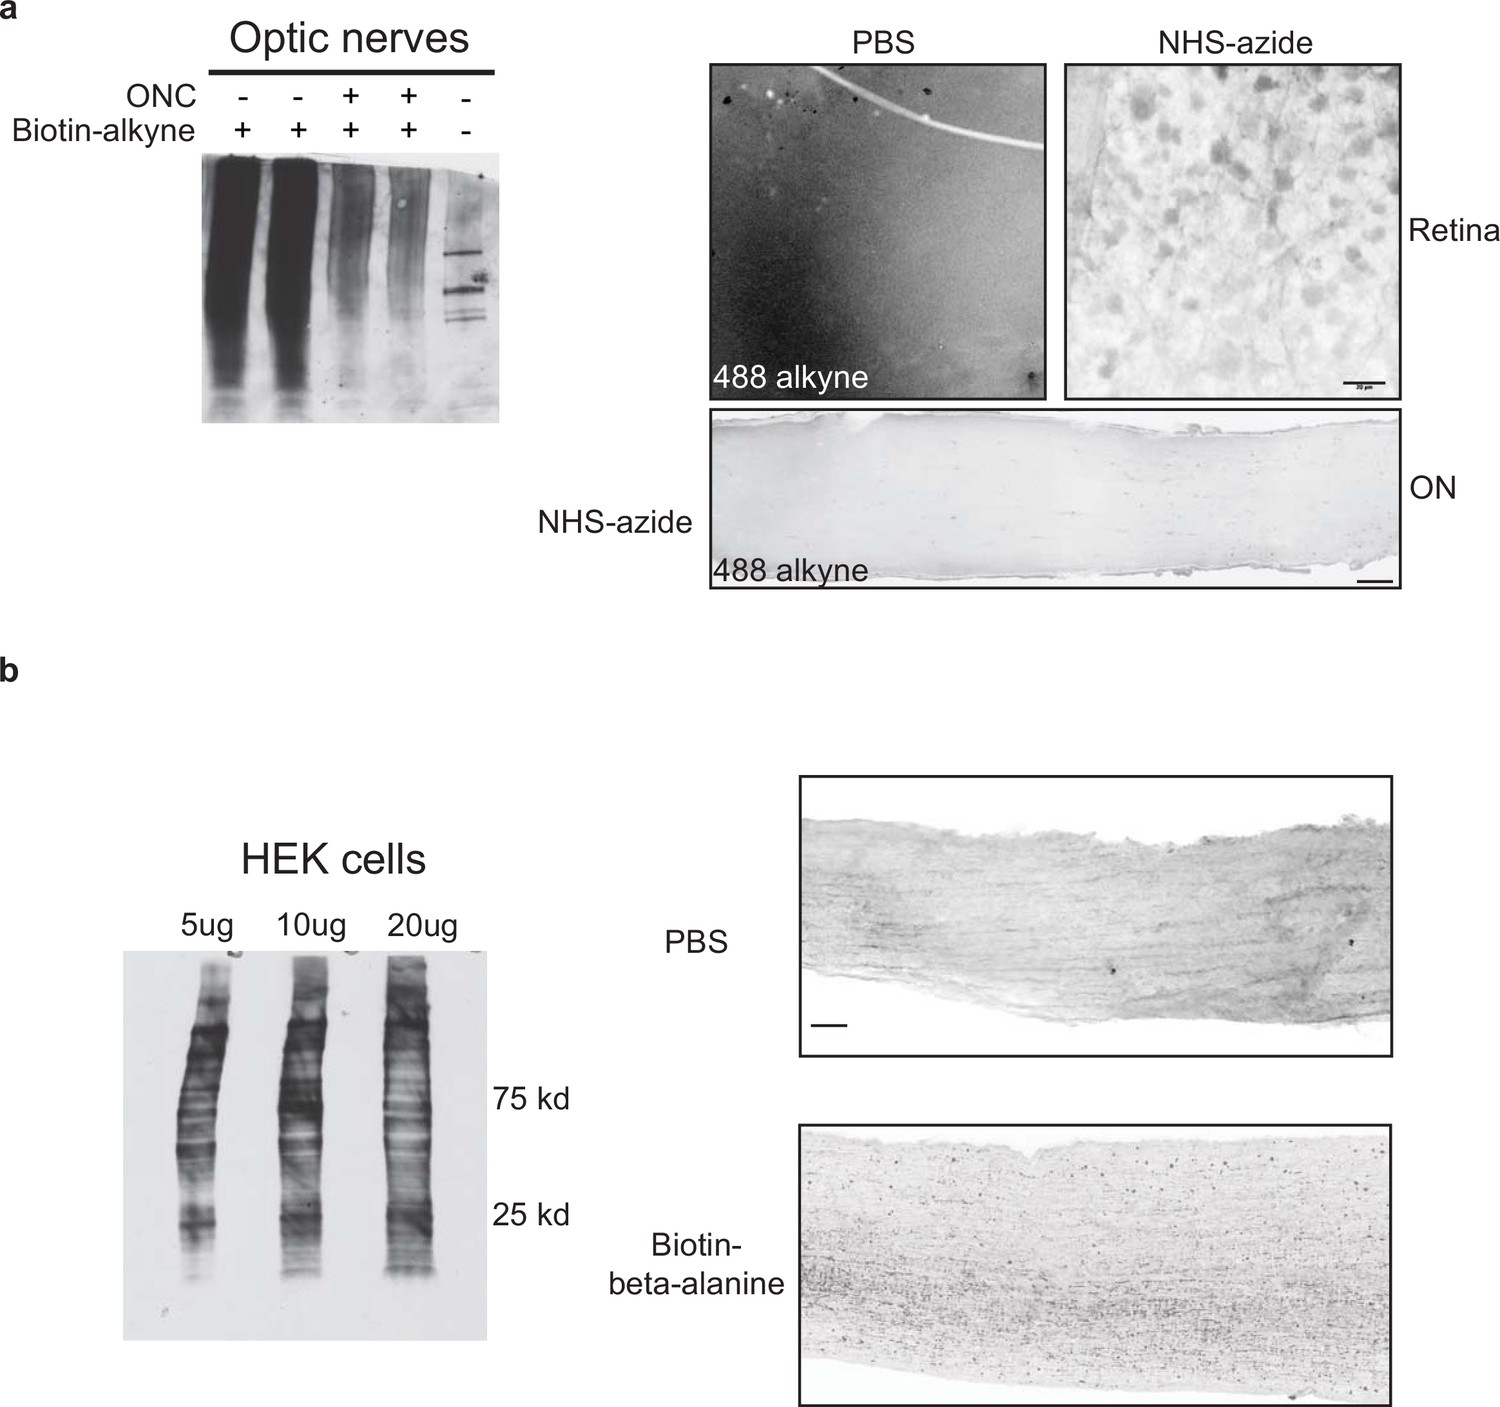
Alternative protein labeling strategies.
(a) NHS-azide was injected into the vitreous space. Twenty-four hours later, retinal and optic nerve tissue was collected for either biochemistry or immunofluorescence. Right panels: We found labeled cells across the surface of the retina after a click reaction with an Alexa-488 alkyne but did not detect label in the optic nerve. Retina scale bar, 20 µm, ON scale bar, 100 µm. Left panel: With a biotin alkyne click reaction, we were able to detect proteins in the optic nerve and show that they decreased after optic nerve crush, compared to a low background without a biotin alkyne click reaction. Bands in the control lane (right) are endogenous biotin-bound proteins. (b) Biotin-beta-alanine was injected intravitreously or provided to HEK cells in culture. Left panel: Biotinylated proteins of different masses were detectable by western blot from HEK cells. Right panels: After 24 hr, biotin-beta-alanine was detected in sections through the optic nerve, compared to optic nerve from animals with intravitreal PBS injection. Scale bar, 100 µm. Both techniques are valuable for biochemistry and histology, although protein labeling with N-hydroxysuccinimidobiotin (NHS-biotin) was superior for mass spectrometry.
-
Figure 1—figure supplement 1—source data 1
Raw western blots from Figure 1—figure supplement 1.
- https://cdn.elifesciences.org/articles/68148/elife-68148-fig1-figsupp1-data1-v2.zip
Figure 2 with 1 supplement

Quantitative analysis of proteomics after injury identifies downregulation of Kif5a synthesis and transport after injury.
(a) Immunoprecipitation (IP) of biotinylated protein from retinal and optic nerve samples, probed for Sncb, Gap43, or Arf3. Input of each sample on top row, subsequent IP of each sample on bottom row, for either optic nerve crush (ONC) samples or sham surgeries. (b) Volcano plot comparing biotinylated proteins from control versus ONC nerve samples. Normalized spectral abundance factor (NSAF) values for each sample type were averaged across three replicates. Proteins with an absolute fold change greater than 1.5, p-value less than 0.05, or both, are colored blue, gray, and red respectively. (c) Retinal cross-sections immunostained with Kif5a and DAPI showing localization of Kif5a in the retinal ganglion cell (RGC) layer (top) and RGC-specific marker RBPMS and Kif5a showing co-localization of Kif5a with RGCs (bottom). Scale bar, 100 µm. (d) Three replicates of biotin IPs probed with an antibody against Kif5a. Inputs are on the left. The IP was stripped and re-probed for biotin for a measurement of total biotinylated protein pulled down (not shown). (e) Quantification of the change in transported Kif5a compared to the change in total transported protein after ONC. One-sample, two-tailed t-test, p = 0.003, n = 3. The bar height and error bar represent the mean and 95% confidence interval respectively. ONC = optic nerve crush. (f) Average intraocular pressure after induction of glaucoma over time in two groups, one with sustained pressure elevation and one with only initial pressure elevation. (g) Quantitative changes in retinal protein synthesis 3 weeks after induction of glaucoma. 1143 and 1457 proteins were quantified in replicates 1 and 2, respectively. Log2 transformed normalized spectral ratios of glaucoma/control samples were plotted from lowest to highest. Newly synthesized Kif5a, detected by BONCAT and quantitative mass spectrometry, was decreased in both replicates, while Kif5b synthesis was unaffected.
-
Figure 2—source data 1
Raw western blots for Figure 2.
- https://cdn.elifesciences.org/articles/68148/elife-68148-fig2-data1-v2.zip
Figure 2—figure supplement 1
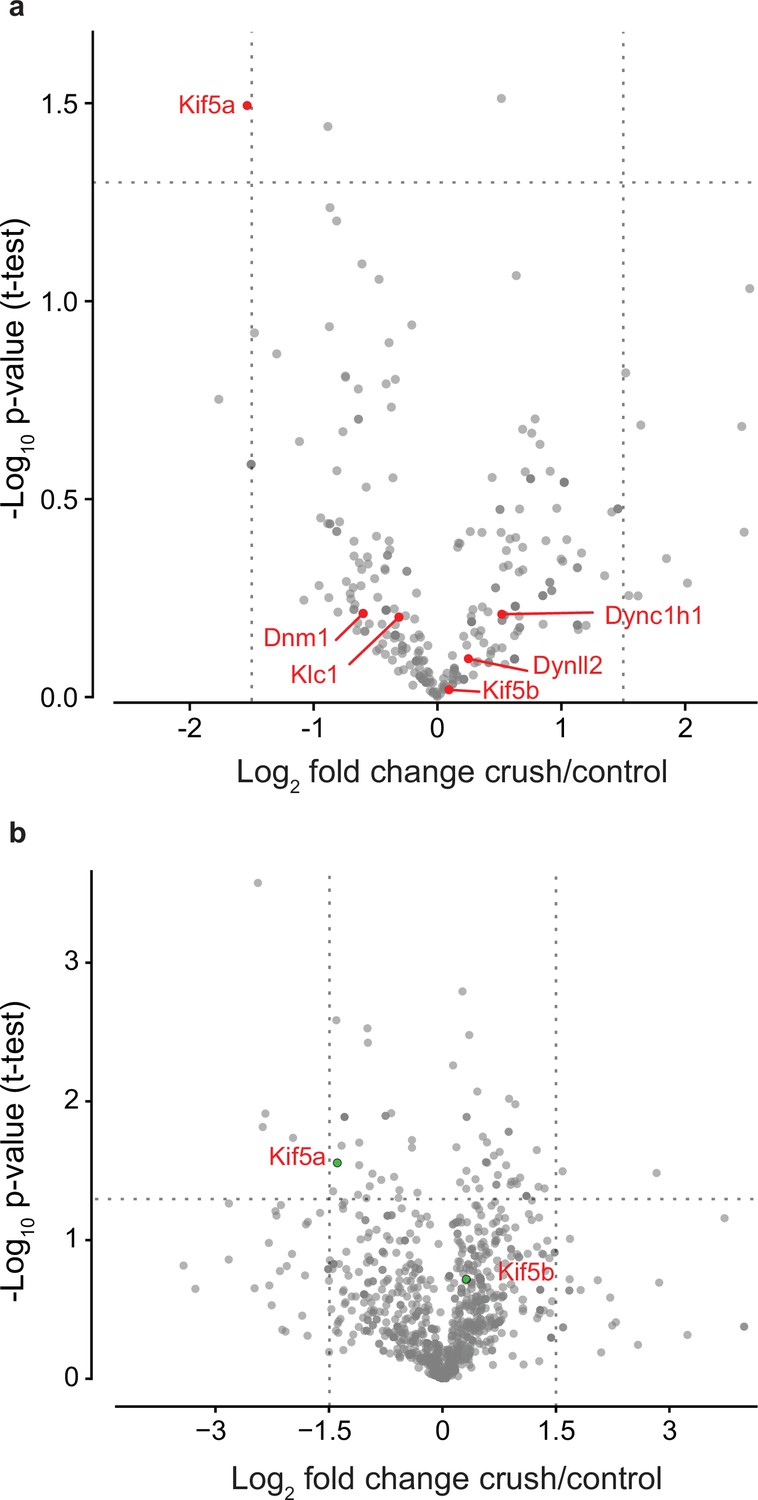
Motor protein transport changes after injury and synthesis changes after glaucoma.
(a) Motor proteins as identified by DAVID 6.8 are highlighted in red. Out of these, only the transport of Kif5a was significantly changed after optic nerve crush. (b) Synthesis of Kif5 family members in the retina 3 weeks after glaucoma induction. Out of 921 proteins quantified in both samples, 43 proteins had significantly increased synthesis (red dots), while 30 proteins had significantly decreased synthesis (blue dots). Kif5a was significantly decreased (green dot, labeled) while Kif5b was not affected (green dot, labeled). Glaucoma/control spectral ratios from each sample normalized before analysis. Complete data in .
-
Figure 2—figure supplement 1—source data 1
Proteomic quantification of changes in newly synthesized proteins 3 weeks after glaucoma from Figure 2—figure supplement 1b.
- https://cdn.elifesciences.org/articles/68148/elife-68148-fig2-figsupp1-data1-v2.xlsx
Figure 3
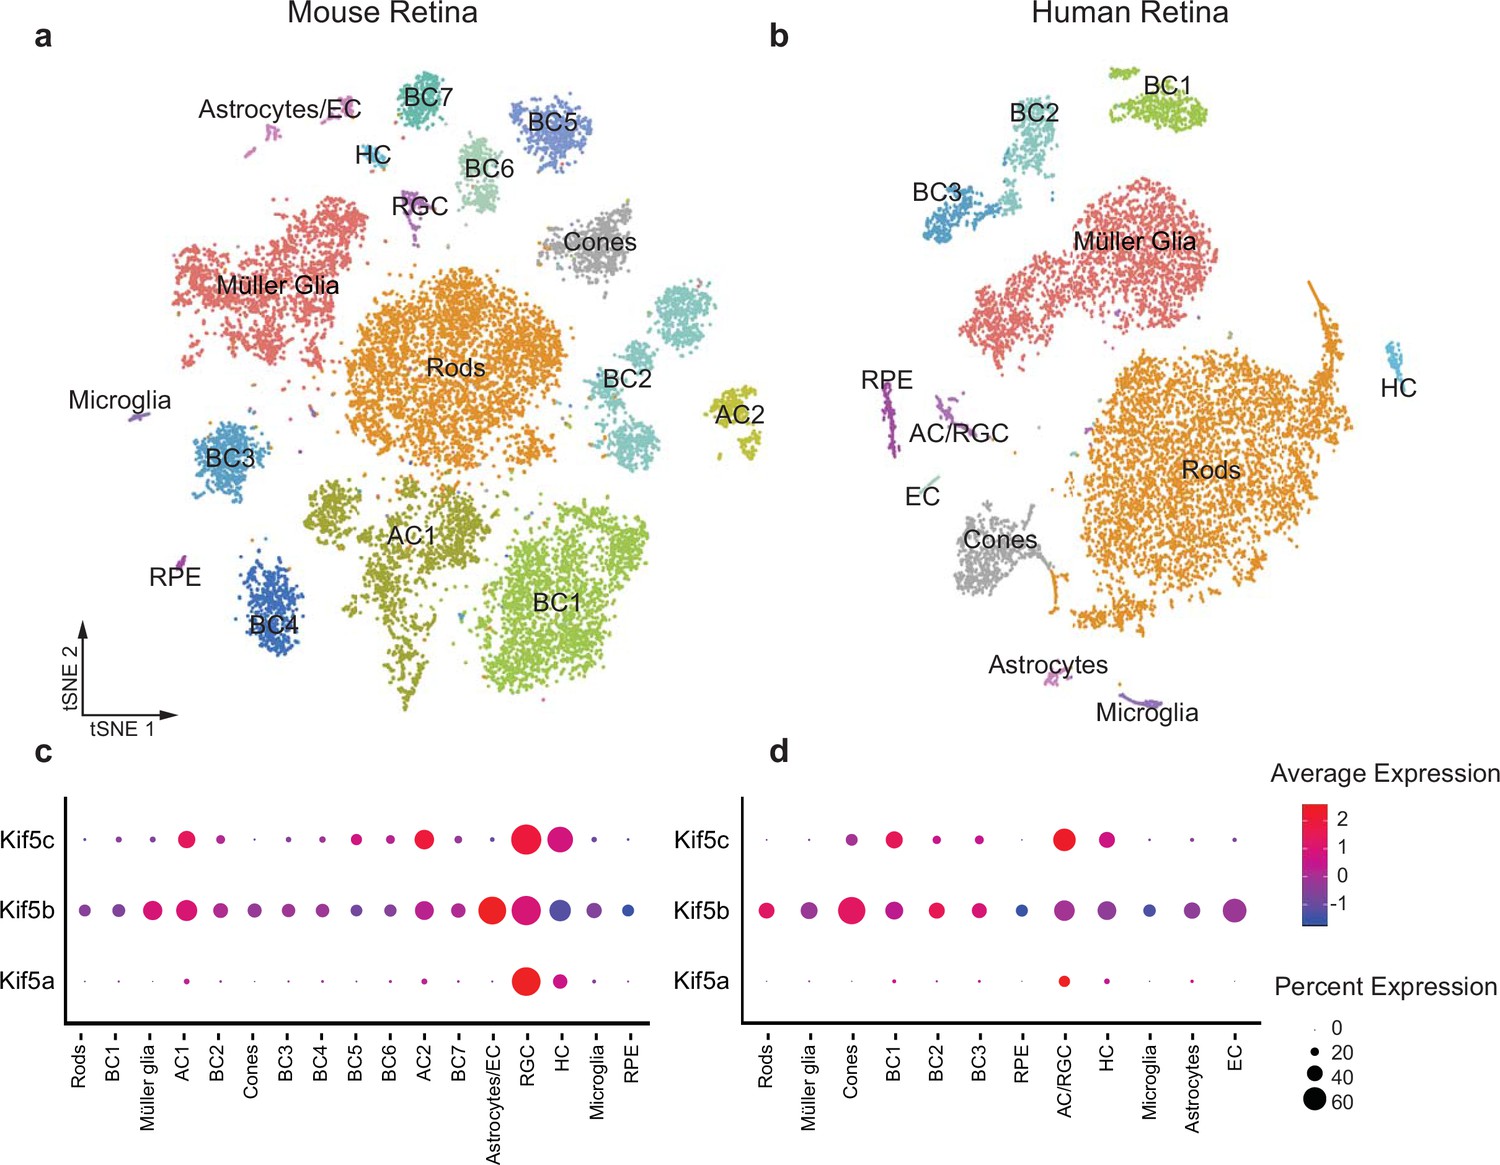
Kif5 expression pattern in the retina is conserved from rodents to humans.
(a,b) TSNE plot of cell clustering of single-cell RNA sequencing (scRNA-seq) from either an adult mouse retina or an adult human retina. Clusters defined by canonical cell-specific markers. (c,d) Expression of Kif5 genes across retinal cell types in either mouse or human retina. Kif5a shows highest levels of enrichment in the putative retinal ganglion cell (RGC) clusters in both species, followed by Kif5c enrichment. Kif5b, conversely, is more ubiquitous across the retina in both species, displaying both conservation of expression patterning across species and divergence of patterning among Kif5 family members. EC = endothelial cells, BC = bipolar cells, AC = amacrine cells, HC = horizonal cells, RPE = retinal pigment epithelium. Human scRNA-seq data available at GEO: GSE138002 and mouse scRNA-seq data available at GEO: GSE135406.
Figure 4 with 1 supplement
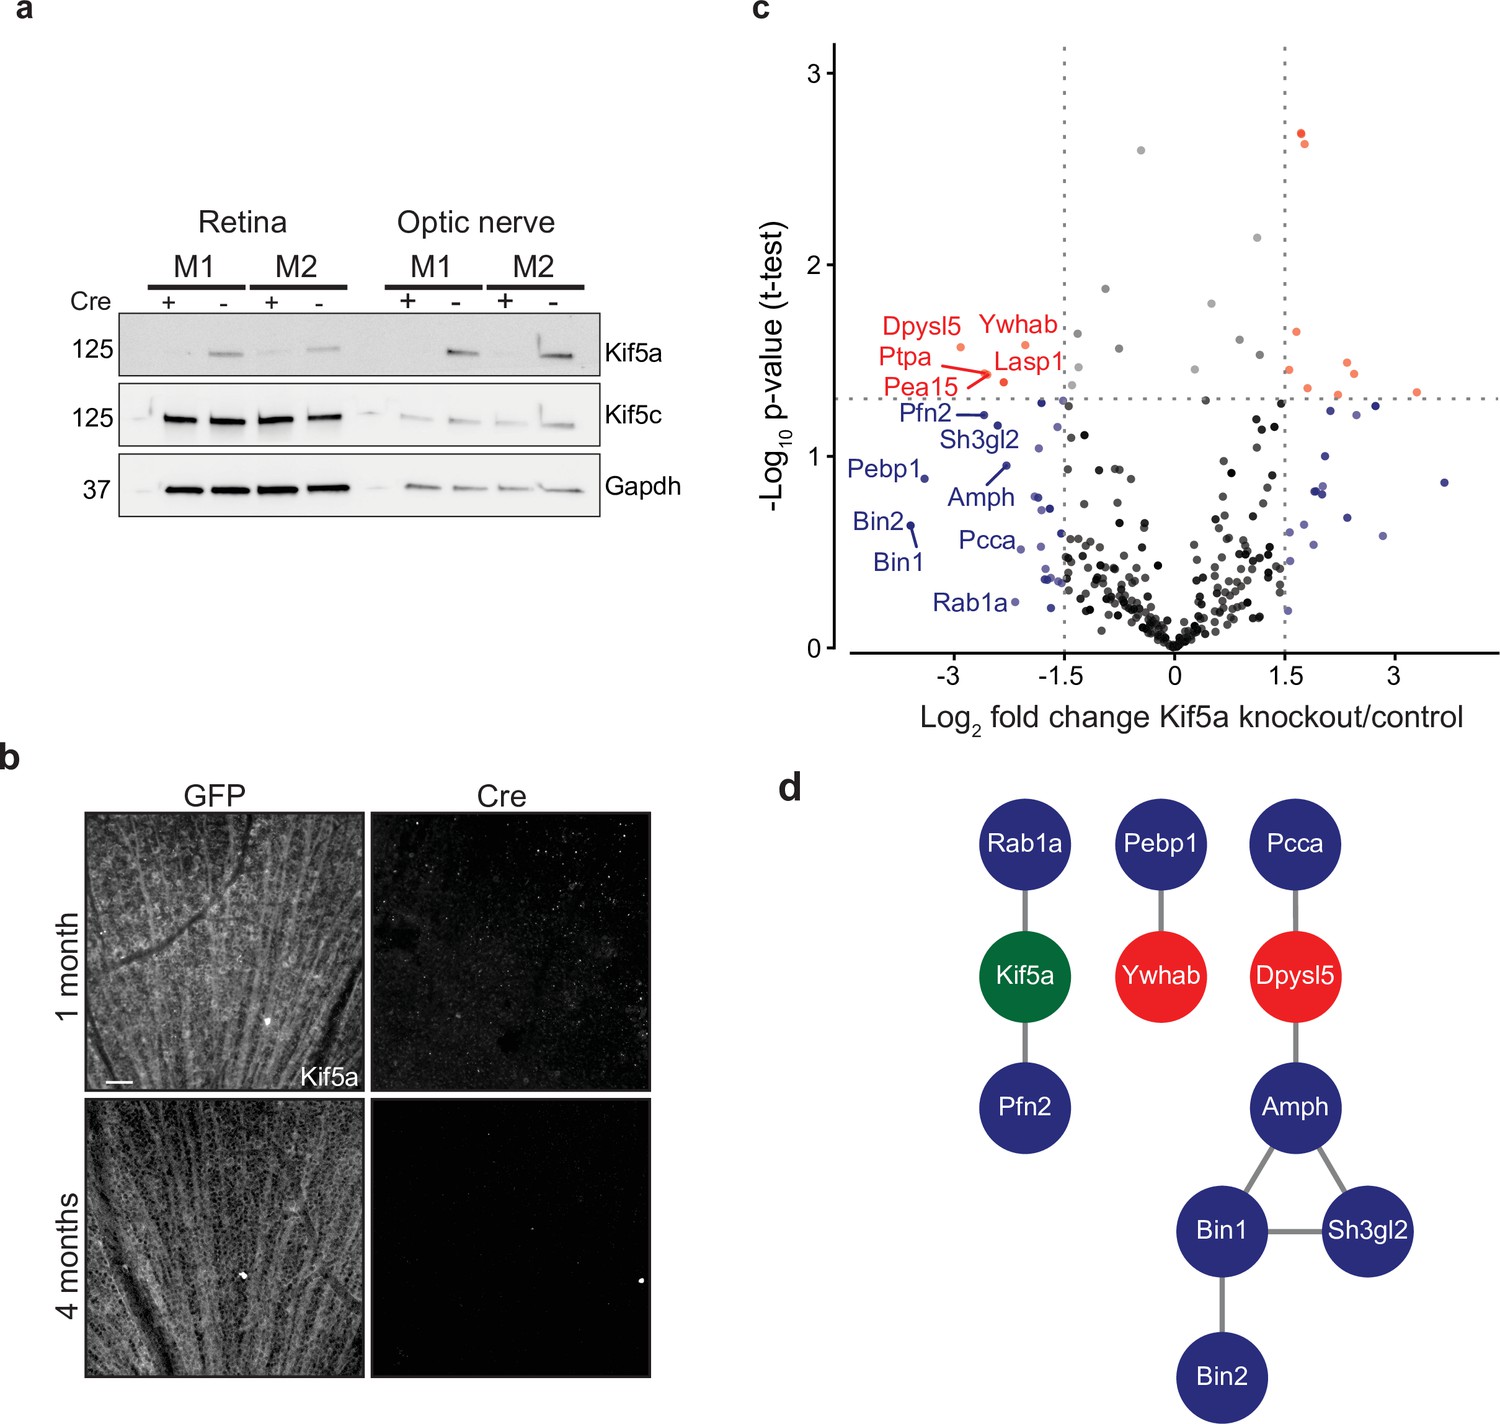
Transportomics of Kif5a knockout (KO).
(a) Western blot validation of Kif5a KO 1 month after intravitreal cre-recombinase injection was apparent in whole retina and optic nerve lysates. Kif5c, a related kinesin, was unaffected by the loss of Kif5a. Cre-positive lanes are designated with a ‘+’, cre-negative lanes are designated with a ‘-’. Molecular weight on left of blots. (b) Wholemount retinas immunostained with an antibody against Kif5a show immunopositive retinal ganglion cell (RGC) axons projecting toward the optic nerve head. Loss of kif5a immunopositive fibers is detected 1 month and is even more pronounced at 4 months after adeno-associated virus (AAV)-cre injection. Scale bar, 50 µm. (c) Volcano plot comparing biotinylated proteins in the optic nerve 3 weeks after intravitreal AAV-GFP compared to AAV-Cre-GFP. Proteins with a log2 fold change decrease of greater than 2 after KO are shown in blue, and those which additionally had a p-value less than 0.5 are shown in red. (d) STRINGdb interaction diagram for all labeled proteins plus Kif5a create three networks incorporating 11/14 proteins (blue = decrease transport only, red = significantly decreased transport).
-
Figure 4—source data 1
Proteomic quantification of transportome changes in Kif5a knockout from Figure 4c.
- https://cdn.elifesciences.org/articles/68148/elife-68148-fig4-data1-v2.xlsx
-
Figure 4—source data 2
Raw western blots for Figure 4.
- https://cdn.elifesciences.org/articles/68148/elife-68148-fig4-data2-v2.zip
Figure 4—figure supplement 1
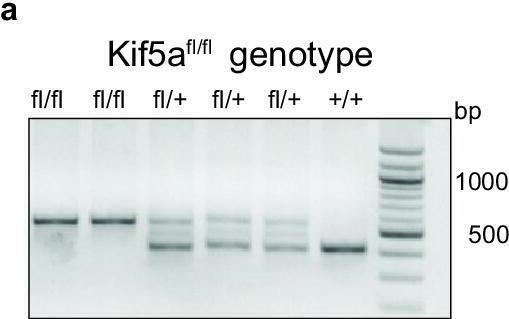
Genotype confirmation of conditional Kif5a knockout (KO) mice.
PCR amplification of the Kif5a locus in transgenic conditional KO mice confirms the presence of a loxP base pair shift in hetero- and homozygous floxed animals.
-
Figure 4—figure supplement 1—source data 1
Raw genotyping blots for Figure 4—figure supplement 1.
- https://cdn.elifesciences.org/articles/68148/elife-68148-fig4-figsupp1-data1-v2.zip
Figure 5
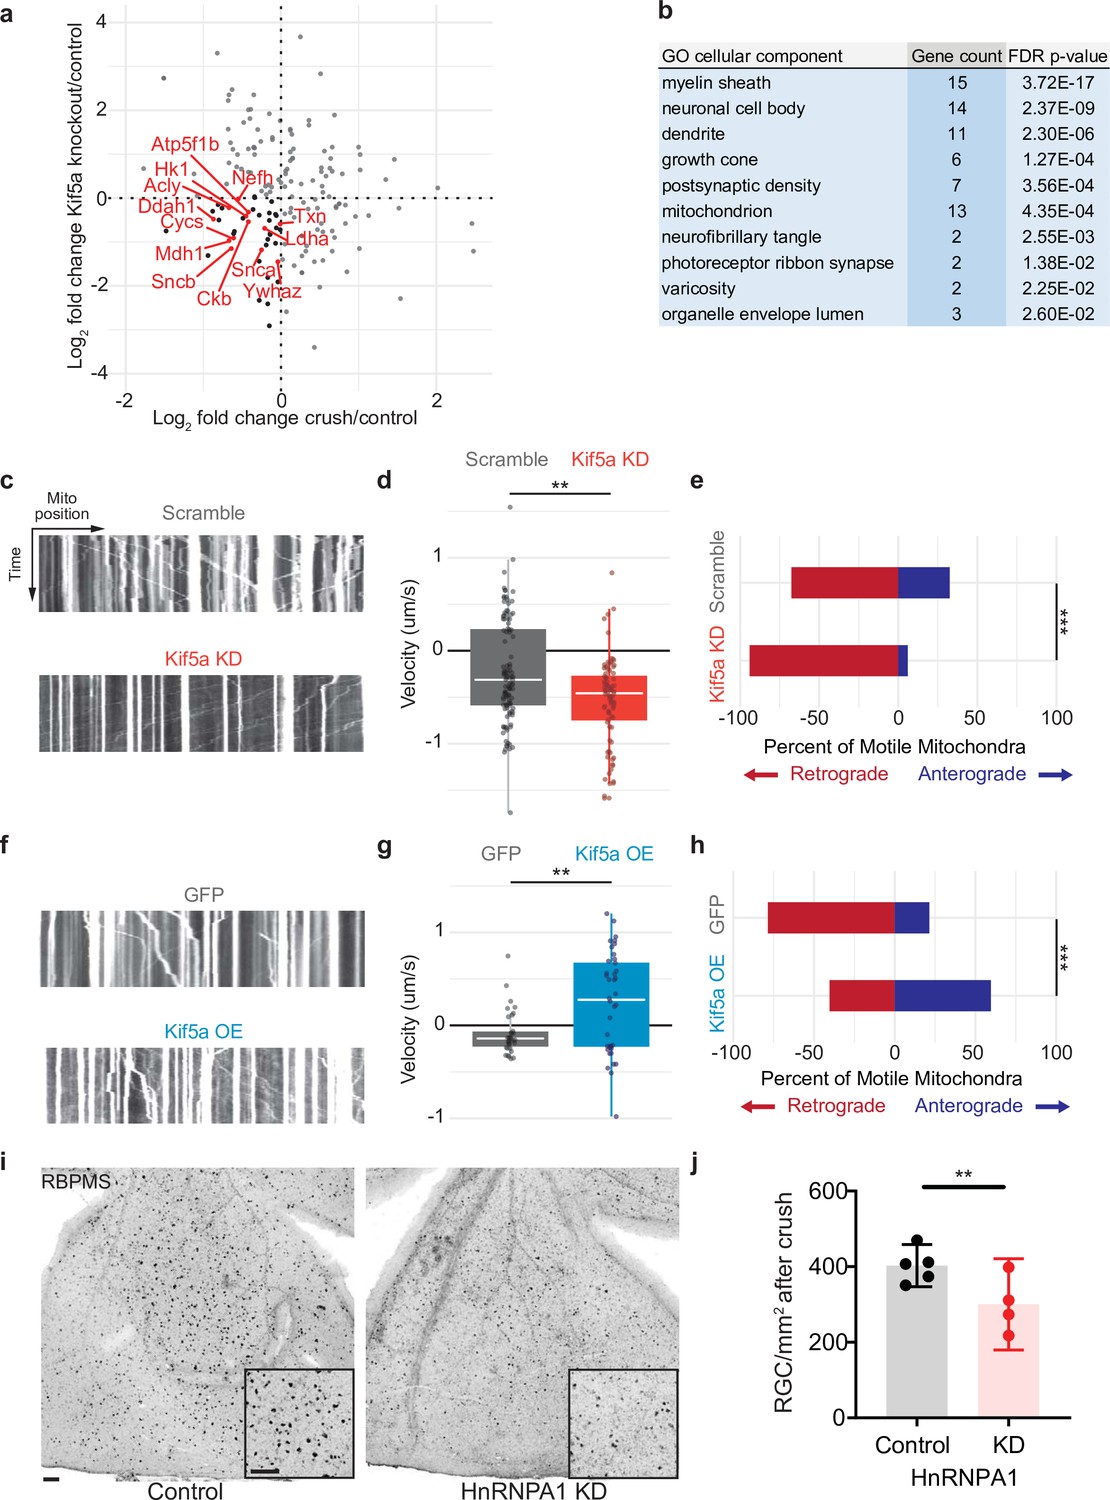
Mitochondrial transport is regulated by Kif5a in retinal ganglion cells (RGCs).
(a) Log2 comparison of protein transport changes in Kif5a knockout (KO) compared to optic nerve crush. Proteins in the lower left quadrant are decreased in both conditions. Proteins in red are identified as associated with Gene Ontology (GO) cellular component ‘mitochondrion’. Proteins in black are non-mitochondrial. (b) Top GO cellular component ontologies for over-representation with shared hierarchy terms removed. ‘Gene count’ refers to number of genes in bottom left quadrant (decreased in transport after Kif5a KO and optic nerve crush [ONC]) out of total genes in common between the two datasets. Full enrichment list found in Figure 5—source data 2. (c,f) Representative kymographs of mitochondrial movement in isolated E18 RGC neurites using MitoTracker deep red after viral delivery of either Kif5a shRNA or scramble shRNA (c) or Kif5a overexpression or GFP (f). Images captured by time-lapse confocal microscopy. (d,g) Quantification of average mitochondrial velocity. Each data point represents a single mitochondrion. Boxplot covers the interquartile range with median noted in white. Two-sample, two-tailed t-test, p < 0.0001 (cultures = 3; Kif5a KD mito = 100; neurons = 19, scramble mito = 117; neurons = 18), p = 0.002 (cultures = 3; Kif5a OE mito = 52; neurons = 13, GFP = 42; neurons = 22). (e,h) Proportion of retrogradely moving mitochondria versus anterogradely moving mitochondria. Fisher’s exact test, p < 0.0001 (top), p = 0.0003 (bottom). (i) Representative example of wholemount retinas 2 weeks after ONC stained with RGC-specific marker RBPMS, after either intravitreal adeno-associated virus (AAV)-scramble-shRNA or AAV-HnRNPA1-shRNA injection. For both wholemount and inset: scale bar, 100 µm. (j) Quantification of RBPMS + cell density after ONC across entire retinal surface. Each point represents one retina (control n = 5, KD n = 4). Two-sample, two-tailed t-tests, p = 0.039.
-
Figure 5—source data 1
Protein-by-protein comparison of fold change in ONC compared to Kif5a knockout from Figure 5a.
- https://cdn.elifesciences.org/articles/68148/elife-68148-fig5-data1-v2.xlsx
-
Figure 5—source data 2
Cellular component Gene Ontology using the PANTHER platform for Figure 5b.
- https://cdn.elifesciences.org/articles/68148/elife-68148-fig5-data2-v2.xlsx
Figure 6 with 1 supplement
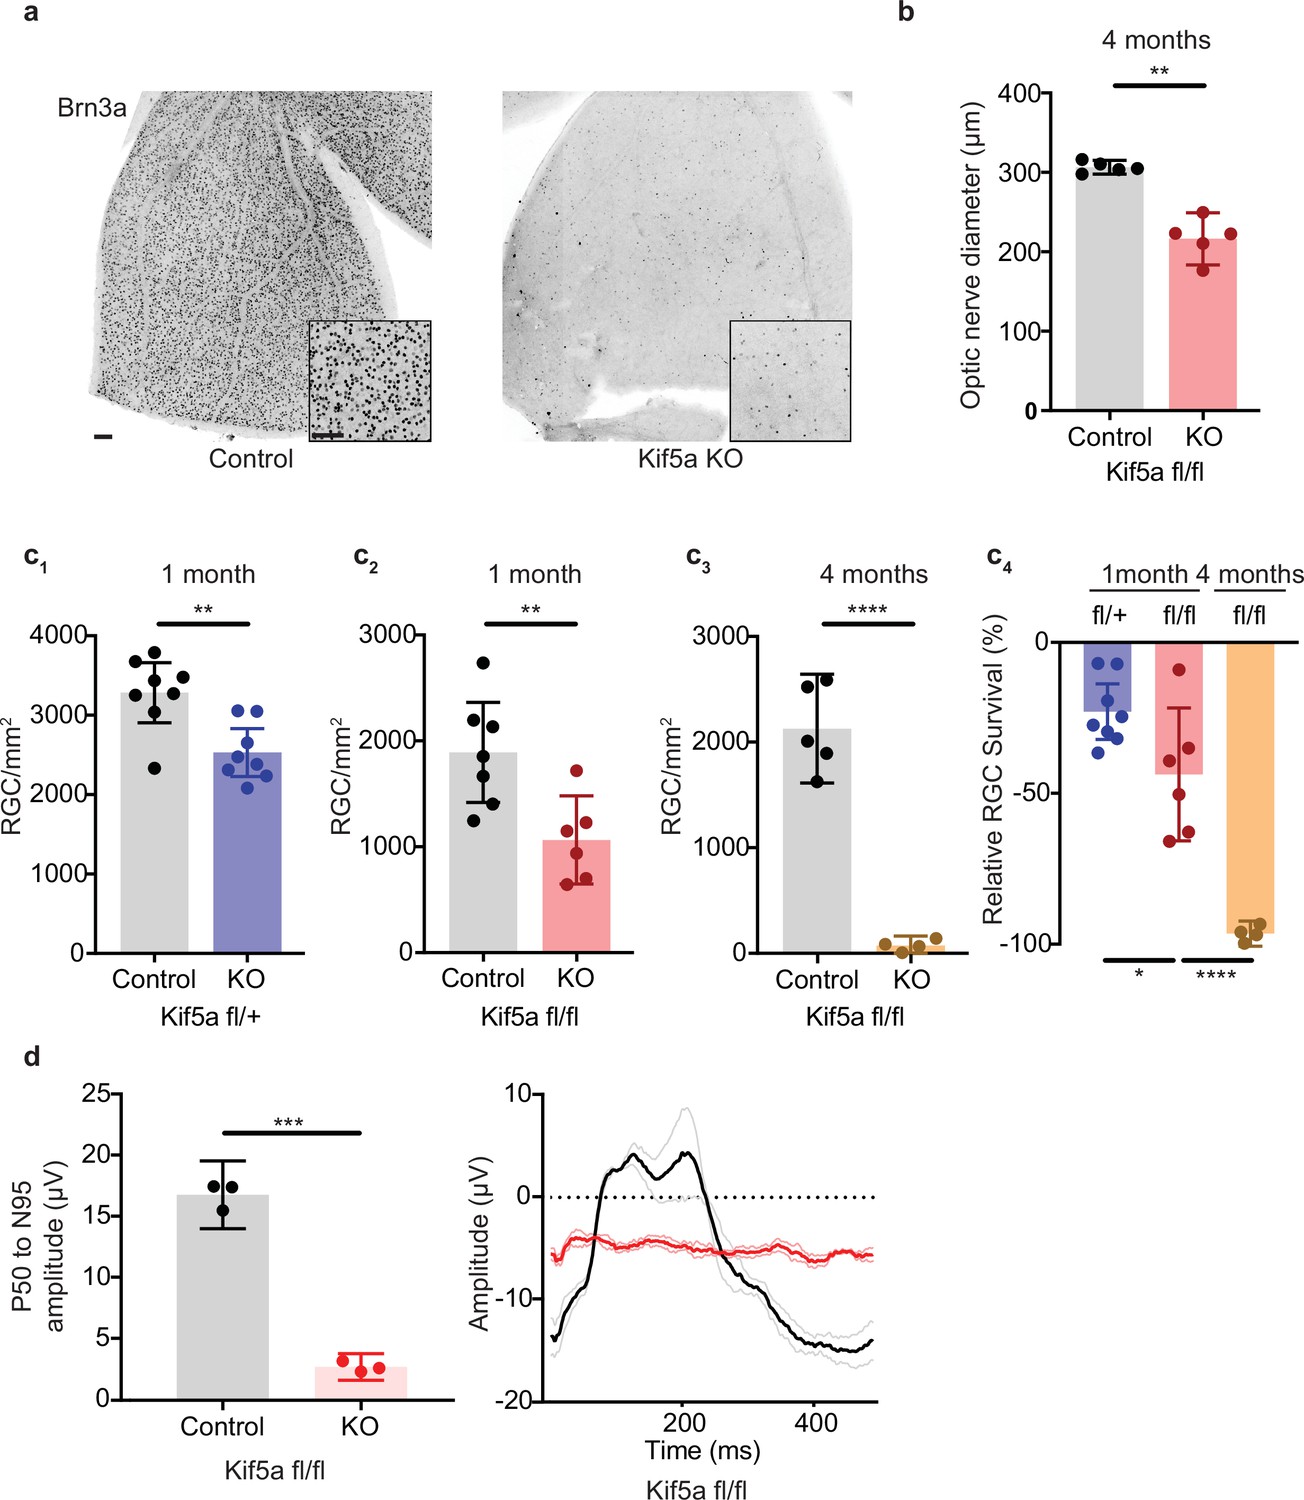
Kif5a knockout (KO) leads to progressive, dose-dependent retinal ganglion cell (RGC) degeneration.
(a) Representative example of wholemount Kif5afl/fl retinas stained with RGC-specific marker Brn3a, 4 months after either intravitreal adeno-associated virus (AAV)-GFP or AAV-Cre-GFP. Scale bar = 100 µm for both wholemount images and insets. (b) Quantification of the average diameter of optic nerve cross-section taken halfway between the optic nerve chiasm and optic nerve head in either control or Kif5a knockout (KO) animals (control n = 5, KO n = 5). Two-sample, two-tailed t-test, p = 0.001. (c) Quantification of Brn3a + cell density across entire wholemount retinal surface. Each point represents one retina. The graphs, from left to right, show pairwise comparisons between heterozygous Kif5a KO at 1 month after viral injection (control n = 8, KO n = 8), homozygous Kif5a KO at 1 month after viral injection (control n = 7, KO n = 6), homozygous Kif5a KO at 4 months after viral injection (control n = 5, KO n = 4), and a comparison of the three previous experiments normalized to their control population. C1-C3 are two-sample, two-tailed t-tests, p = 0.003, p = 0.008, and p < 0.0001, respectively. C4 is a one-way ANOVA with post hoc Sidak correction. Between the blue and red columns, p = 0.034. Between red and gold columns, p < 0.0001. The bar heights represent the mean, and the error bars represent the 95% confidence interval. (d) Pattern electroretinogram quantification from mice 6 months after Kif5a KO or control. On the left, the amplitude difference between the P50 peak and the N95 trough was quantified and compared with a two-sample, two-sided t-test (n = 3), p < 0.0001. The bar heights represent the mean, and the error bars represent the 95% confidence interval. On the right, the average traces of each condition are bold, with lighter shades ± SEM.
Figure 6—figure supplement 1
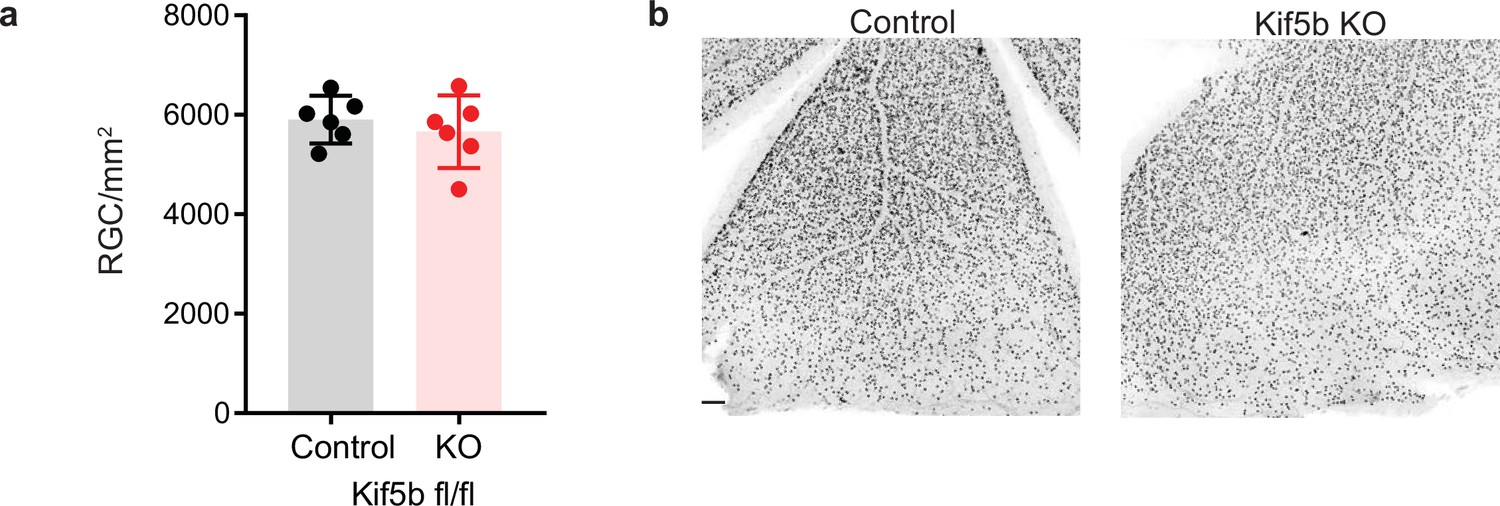
Loss of Kif5b does not lead to RGC cell death.
(a) Quantification of RGC-specific marker Brn3a+ cell density across entire wholemount retinal surface. Each point represents one retina. Pairwise comparisons between homozygous Kif5b KO using Kif5bfl/fl with either AAV-GFP or AAV-Cre-GFP at 1 month after viral injection (control n=6, KO n=6). Two-sample, two-tailed t-test. (b) Representative example of wholemount Kif5bfl/fl retinas stained with Brn3a, an RGC-specific marker, 1 month after either AAV-GFP or AAV-Cre-GFP. Scale bar, 100 µm.
Figure 7

Kif5a overexpression exacerbates retinal ganglion cell (RGC) death.
(a) Optic nerves were collected 2 weeks after intravitreal injection of adeno-associated virus (AAV)-Kif5a-FLAG. Immunoprecipitation showed the presence of FLAG-tagged protein at the molecular weight of Kif5a. Co-immunoprecipitation of β-III tubulin confirmed that overexpressed Kif5a transported to the optic nerve and bound to the cytoskeleton. (b) RGC survival was not affected 4 weeks after viral injection of Kif5a compared to a control GFP virus (control n = 6, OE n = 7). Two-tailed, two-sample, t-test. (c) Representative example of wholemount retinas stained with RBPMS, an RGC-specific marker, 2 weeks after optic nerve crush, injected with either AAV-GFP or AAV-Kif5a-FLAG 2 weeks before crush. Scale bar, 100 µm. (d) Quantification of RBPMS + cell density after optic nerve crush (ONC) across entire retinal surface. Each point represents one retina (control n = 7, OE n = 8). Two-sample, two-tailed t-tests, p < 0.0001.
-
Figure 7—source data 1
Raw western blots for Figure 7.
- https://cdn.elifesciences.org/articles/68148/elife-68148-fig7-data1-v2.zip
Tables
Key resources table
| Reagent type (species) or resource | Designation | Source or reference | Identifiers | Additional information |
|---|---|---|---|---|
| Strain, strain background (Mus musculus) | Wild-type | The Jackson Laboratory | C57BL/6 | Pooled sexes |
| Strain, strain background (Mus musculus) | Kif5afl/fl | David Williams Laboratory | MMRRC:MMRRC_000224-UCD | Pooled sexes |
| Strain, strain background (Mus musculus) | Kif5bfl/fl | David Williams Laboratory | JAX stock:008637 | Pooled sexes |
| Strain, strain background (Rattus norvegicus) | Wild-type | The Jackson Laboratory | Sprague-Dawley | Pooled sexes |
| Cell line (Human) | HEK 293T | ATCC | 293T | |
| Other | Viral Vector AAV2-GFP | UPenn Vector Core | AV-2-PV0101 | |
| Other | Viral Vector AAV2-cre-GFP | UPenn Vector Core | AV-2-PV2004 | |
| Other | Viral Vector AAV2-Kif5a | This paper | VectorBuilder ID: https://en.vectorbuilder.com/vector/VB170708-1017enf.html | Sui Wang Laboratory; Vector Map from VectorBuilder |
| Other | Viral Vector AAV2-Kif5a shRNA | This paper | VectorBuilder ID: https://en.vectorbuilder.com/vector/VB180108-1217eru.html | Sui Wang Laboratory; Vector Map from VectorBuilder |
| Antibody | Rabbit anti-Kif5a | Abcam | Ab5628 | (1:1000) |
| Antibody | Rabbit anti-Kif5c | Abcam | Ab192883 | (1:1000) |
| Antibody | Goat anti-biotin | Thermo | 31852 | (1:1000) |
| Antibody | Rabbit anti-FLAG | CST | 14793S | (1:2000) |
| Antibody | Rabbit anti-B3Tubulin | CST | 5568S | (1:2000) |
| Antibody | Rabbit anti-GAPDH | CST | 2118 | (1:2000) |
| Antibody | Rabbit anti-SNCB | Sigma | SAB1100305 | (1:2000) |
| Antibody | Rabbit anti-GAP43 | Novus | NB300 | (1:5000) |
| Antibody | Rabbit anti-ARF3 | Abcam | Ab154383 | (1:5000) |
| Antibody | Goat anti-mouse | Abcam | Ab6789 | (1:2000) |
| Antibody | Goat anti-rabbit | Abcam | Ab6721 | (1:2000) |
| Antibody | Donkey anti-goat | Abcam | Ab97110 | (1:2000) |
| Antibody | Mouse anti-Brn3a | Millipore | MAB1585 | (1:100) |
| Antibody | Rabbit anti-RBPMS | PhosphoSolutions | 1830-RBPMS | (1:300) |
Additional files
Download links
A two-part list of links to download the article, or parts of the article, in various formats.
Downloads (link to download the article as PDF)
Open citations (links to open the citations from this article in various online reference manager services)
Cite this article (links to download the citations from this article in formats compatible with various reference manager tools)
Quantitative transportomics identifies Kif5a as a major regulator of neurodegeneration
eLife 11:e68148.
https://doi.org/10.7554/eLife.68148


