AKAP79 enables calcineurin to directly suppress protein kinase A activity
- Department of Neuroscience, Physiology & Pharmacology, University College London, United Kingdom
- Science for Life Laboratory, School of Electrical Engineering and Computer Science, KTH Royal Institute of Technology, Sweden
- Department of Neuroscience, Karolinska Institute, Sweden
Figures
Figure 1 with 3 supplements
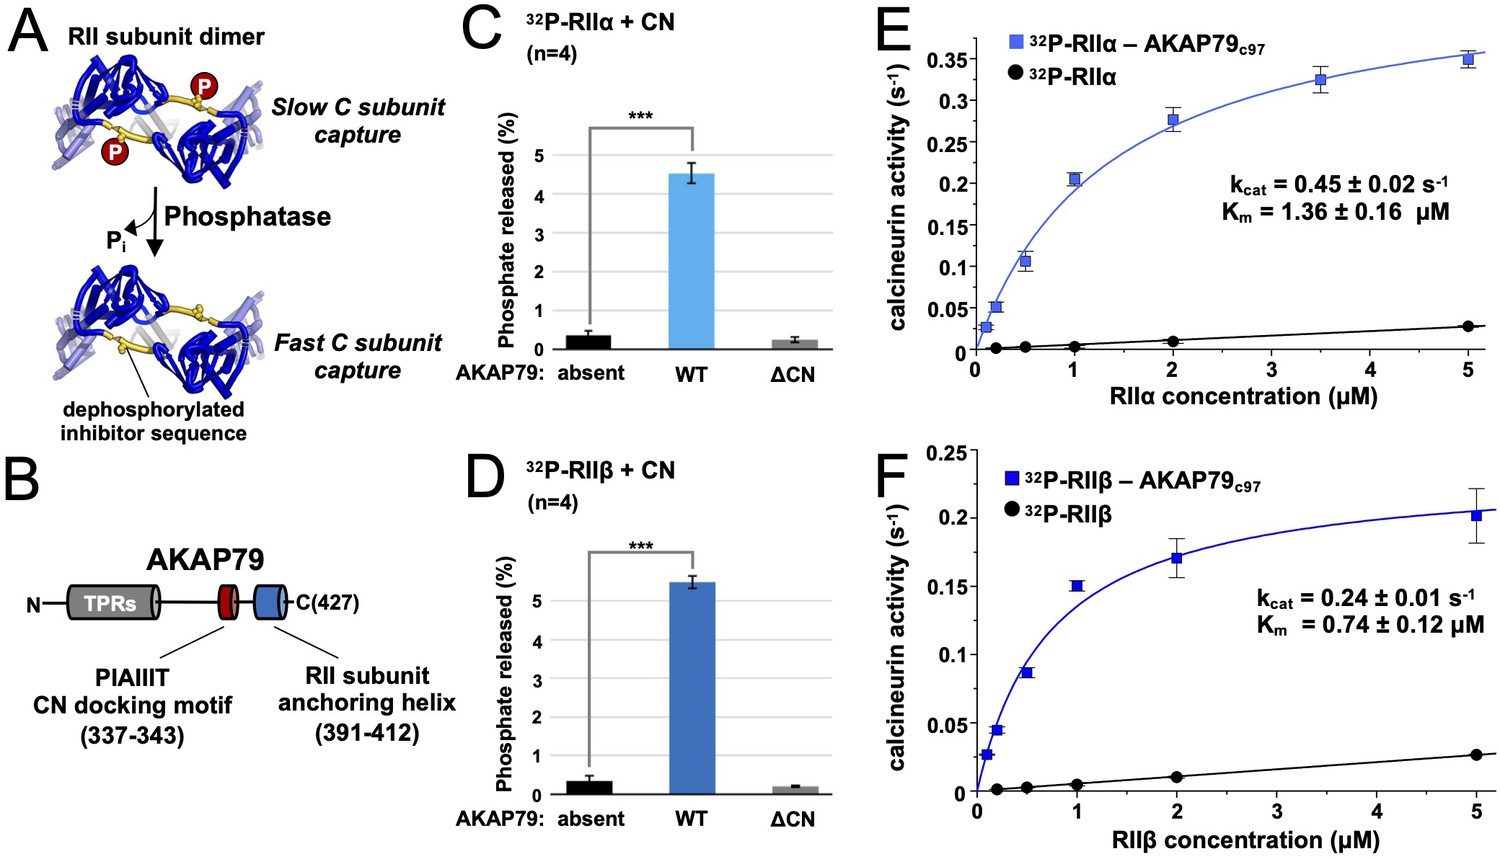
Effect of AKAP79 on pRII dephosphorylation by CN.
(A) Dephosphorylation of the inhibitor sequence (IS, yellow) of RII subunits enables faster PKA C subunit capture. (B) AKAP79 contains anchoring sites for CN (red) and PKA RII subunits (blue) in its C-terminal region. Other macromolecular interactions are mediated through elements within its tandem polybasic regions (TPRs, gray). (C) CN-catalyzed phosphate release from pRIIα subunits with either no AKAP79, WT AKAP79 (light blue), or AKAP79 lacking the PIAIIIT anchoring motif (‘ΔCN’). (D) CN-catalyzed phosphate release from pRIIβ subunits with either no AKAP79, WT AKAP79 (dark blue), or AKAP79 ΔCN. (E) The relationship between CN activity toward pRIIα subunits and pRIIα concentration with pRIIα subunits included either alone (black circles) or in complex with AKAP79c97 (light blue squares). (F) The relationship between CN activity towards pRIIβ subunits and pRIIβ concentration with pRIIβ subunits included either alone (black circles) or in complex with AKAP79c97 (dark blue squares). For panels E and F, activities at each concentration were measured in triplicate. Statistical comparisons were performed using two-tailed unpaired Student t‐tests. ***p < 0.001.
-
Figure 1—source data 1
Radioactive phosphatase assays.
- https://cdn.elifesciences.org/articles/68164/elife-68164-fig1-data1-v2.xlsx
Figure 1—figure supplement 1

Purified proteins.
Images showing the purity of purified proteins applied in this study are shown following SDS-PAGE with 4–12% Bis-Tris NuPAGE gels. (A) Full-length WT PKA RIIα and RIIβ subunits. (B) Full-length AKAP79. (C) The complex of RIIα and AKAP79c97. (D) The complex of RIIβ and AKAP79c97. (E) The CN heterodimer. (F) CaM. (G) AKAR4 – the left-hand image shows Coomassie staining whereas the right-hand image shows anti-GFP immunoblotting of an equivalent lane after transfer to nitrocellulose. (H) Variants of RIIα (WT, S98A, S98E) applied in AKAR4 assays. (I) Variants of AKAP79c97 (WT, ΔCN, ΔPKA) applied in AKAR4 assays. All images were scanned following Coomassie staining unless otherwise stated.
Figure 1—figure supplement 2

pRII phosphorylation by CN at supra-physiological concentrations.
The relationship between CN activity toward pRII and pRII concentration in the absence of AKAP79 is linear for both pRIIα (A) and pRIIβ (B) up to at least 20 μM pRII.
-
Figure 1—figure supplement 2—source data 1
Phosphatase assays without AKAP79.
- https://cdn.elifesciences.org/articles/68164/elife-68164-fig1-figsupp2-data1-v2.xlsx
Figure 1—figure supplement 3
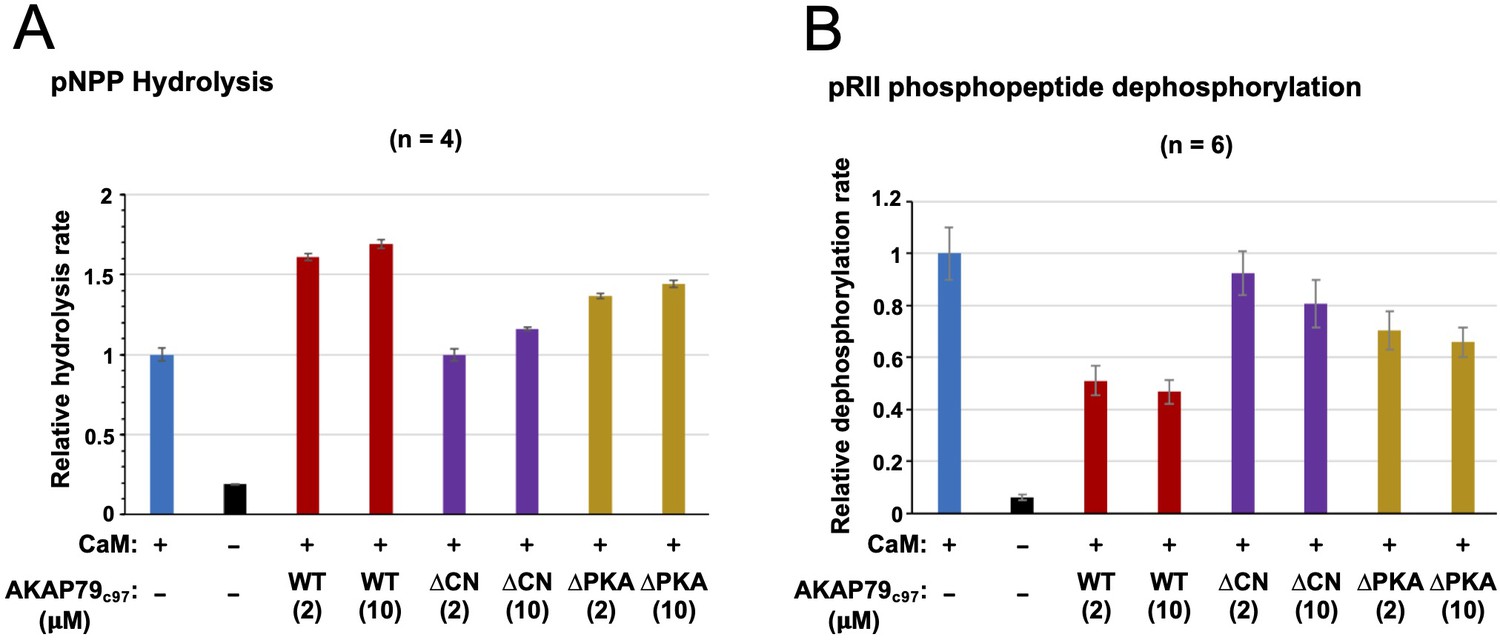
Effect of AKAP79c97 variants on pNPP and pRII phosphopeptide dephosphorylation.
(A) Bar chart showing relative rates of pNPP hydrolysis by CN with (blue) and without (black) CaM activation, and for CN + CaM in the presence of WT (red), ∆CN (purple), and ∆PKA (gold) variants of AKAP79c97. The relative rate of pNPP hydrolysis was reduced from 1 ± 0.04–0.19 ± 0.002 when CaM was excluded. Inclusion of WT AKAP79c97 resulted in relative pNPP hydrolysis of 1.61 ± 0.02 (2 µM) and 1.69 ± 0.03 (10 µM); for the ∆CN variant, the rates were 1.00 ± 0.04 (2 µM) and 1.16 ± 0.01 (10 µM); and for the ∆PKA variant, the rates were 1.37 ± 0.02 (2 µM) and 1.44 ± 0.02 (10 µM). Taken together, the data indicate that the PIAIIIT motif of AKAP79 is able to weakly enhance CN hydrolysis of pNPP. (B) Bar chart showing relative rates of 40 µM pRII 19-mer peptide dephosphorylation by CN. Conditions are colored in the same way as the preceding panel. For pRII peptide, the relative rate of dephosphoylation was reduced from 1 ± 0.10 to0.062 ± 0.01 when CaM was excluded. Inclusion of WT AKAP79c97 resulted in relative dephosphorylation rates of 0.51 ± 0.06 (2 µM) and 0.47 ± 0.05 (10 µM); for the ∆CN variant, the rates were 0.92 ± 0.09 (2 µM) and 0.81 ± 0.09 (10 µM); and for the ∆PKA variant, the rates were 0.70 ± 0.07 (2 µM) and 0.66 ± 0.06 (10 µM). The data is consistent with previous reports that AKAP79 weakly inhibits CN activity toward pRII phosphopeptide (Coghlan et al., 1995; Kashishian et al., 1998).
-
Figure 1—figure supplement 3—source data 1
Colorimetric phosphatase assays.
- https://cdn.elifesciences.org/articles/68164/elife-68164-fig1-figsupp3-data1-v2.xlsx
Figure 2 with 1 supplement
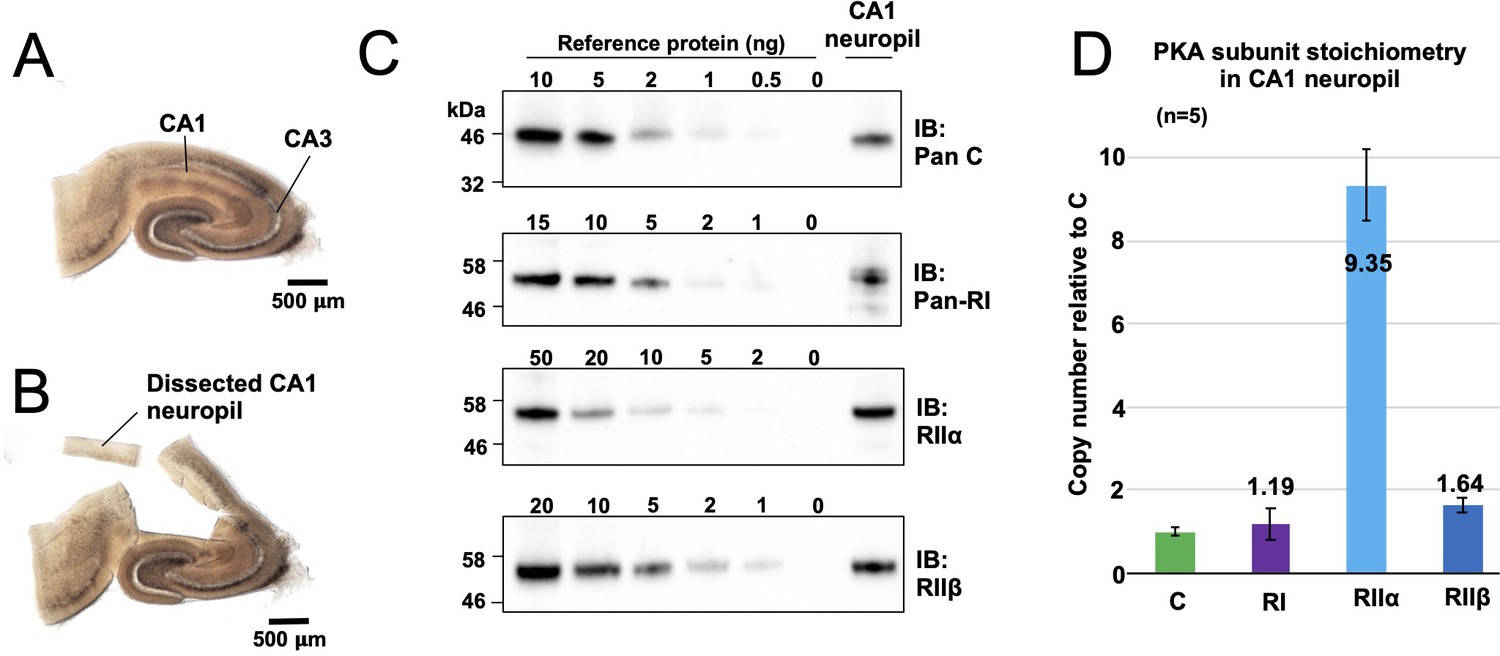
Quantitation of PKA subunits in CA1 neuropil.
Images of a P17 rat hippocampal slice before (A) and after (B) micro-dissection of the CA1 neuropil layer. (C) Immunoblots of CA1 neuropil extract for PKA subunits. Extracts were run alongside reference amounts of the relevant purified PKA subunit in each immunoblot (Figure 2—figure supplement 1). In each case, 15 μg total protein extract was run alongside the reference series, with the exception of the anti-C immunoblot (10 μg extract). (D) Copy numbers of PKA subunits in rat CA1 neuropil normalized to C subunits.
-
Figure 2—source data 1
Quantitative immunoblotting.
- https://cdn.elifesciences.org/articles/68164/elife-68164-fig2-data1-v2.xlsx
Figure 2—figure supplement 1
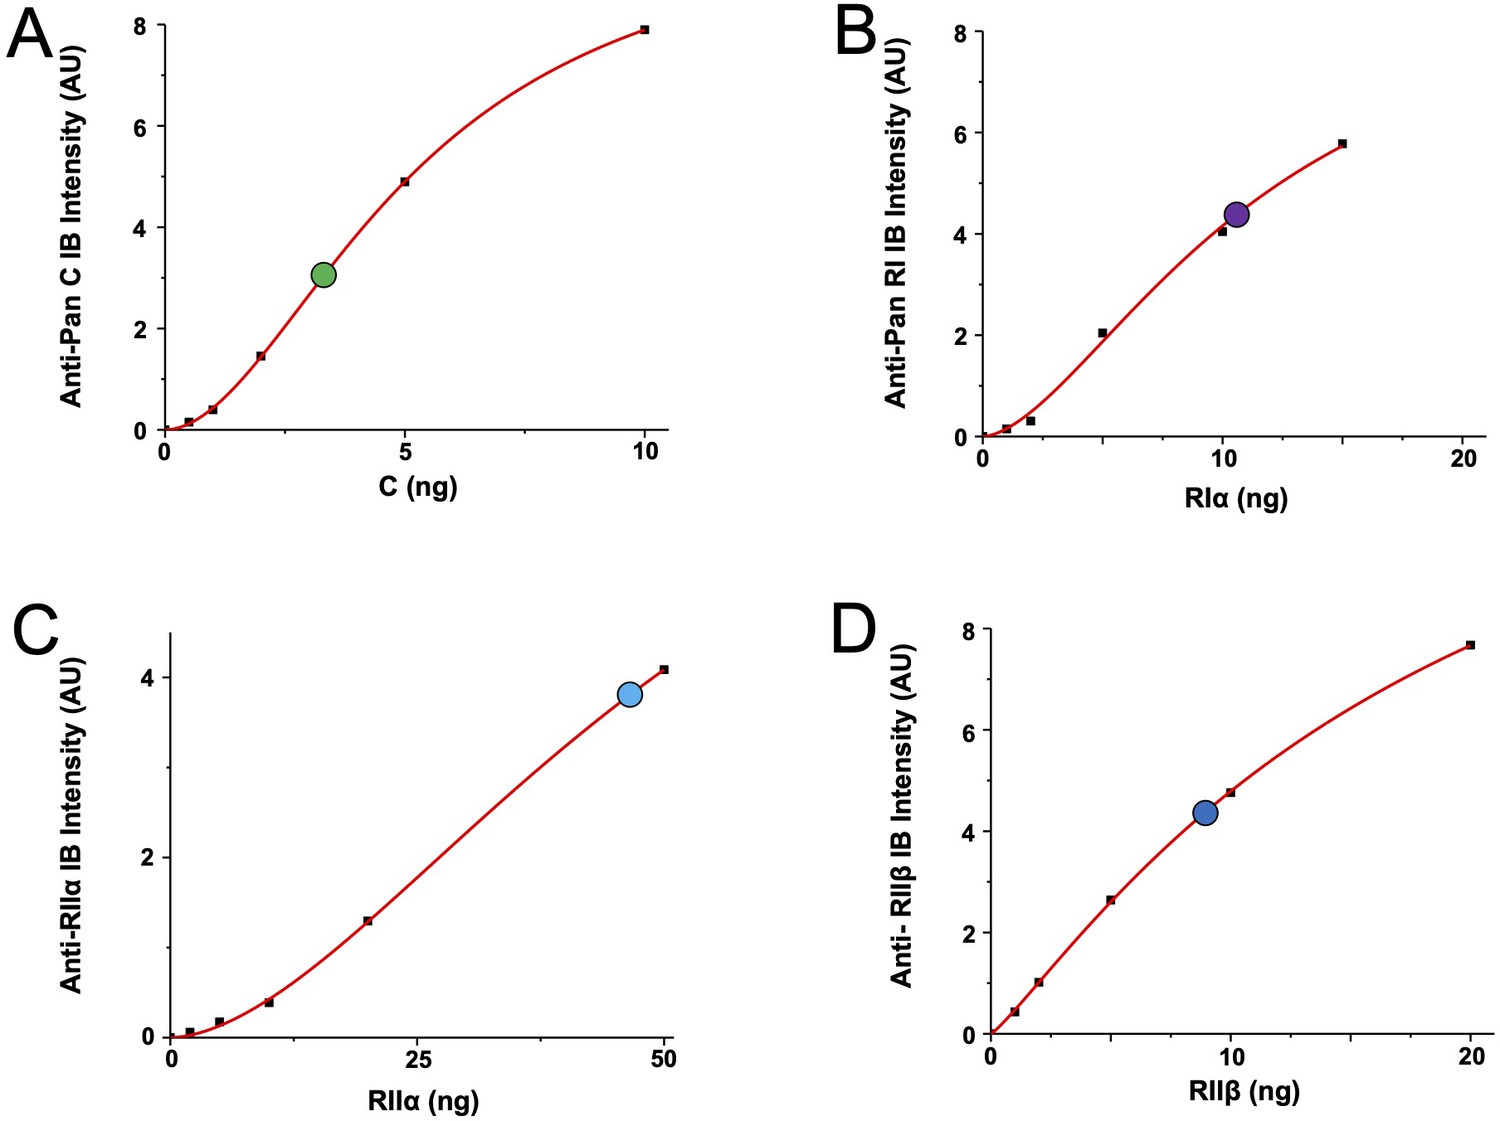
Reference curves for quantitation of PKA subunits in CA1 neuropil.
The four panels show reference curves (red lines) that relate immunoblot band intensity to ng of PKA subunit per lane, and correspond to the data shown in Figure 2C. (A) Anti-pan C immunoblot reference curve. The point at which the neuropil extract lane falls on the curve is denoted by a green circle. (B) Anti-pan RI reference curve with neuropil extract lane denoted by a purple circle. (C) Anti-RIIα reference curve with neuropil extract lane denoted by a light blue circle. (D) Anti-RIIβ reference curve with the neuropil extract lane denoted by a dark blue circle.
Figure 3 with 2 supplements
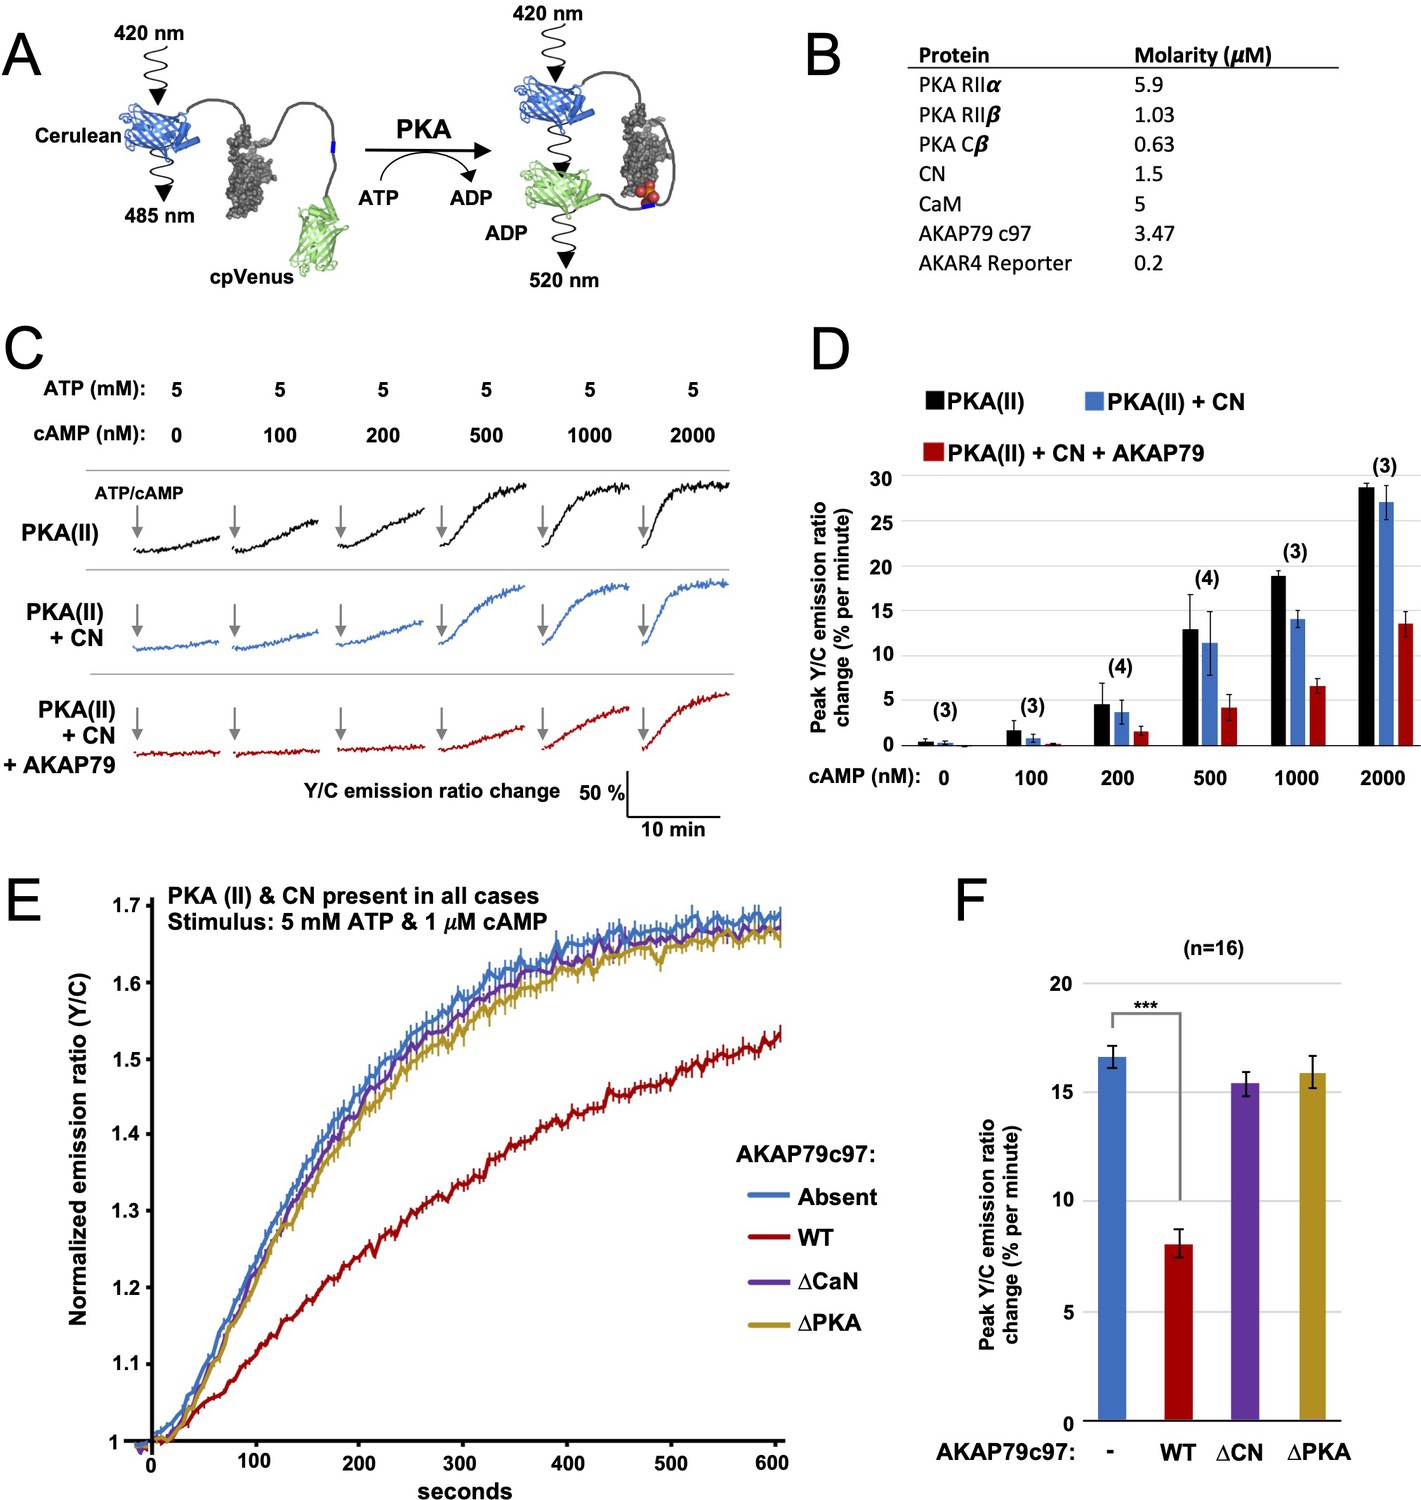
FRET-based PKA activity measurements.
(A) AKAR4 mechanism: phosphorylation of the sensor by PKA is detected as an increase in FRET between the terminal fluorescent proteins. (B) Concentrations of proteins used for in vitro AKAR4 assays. Different experiments utilized different mixtures of these proteins but always at these concentrations. (C) Representative AKAR4 traces showing change in 520 nm / 485 nm (Y/C) emission ratio over time after injection of different concentrations of cAMP in tandem with 5 mM ATP. All protein mixtures included AKAR4, type II PKA (RIIα, RIIβ, C), and CaM. Experiments were performed with either no further additives (top row, black), with CN added (middle row, blue), or with both CN and AKAP79c97 added (bottom row, red). ATP/cAMP injections are indicated by arrows. (D) The chart shows peak rates of emission ratio change for the recordings shown in the preceding panel. n values are stated above the columns. (E) For these recordings, type II PKA, CN, and CaM were included in all cases. Phosphorylation was initiated by injection of 5 mM ATP and 1 μM cAMP at t = 0. Averaged responses ± standard error (SE) are shown with no further additives (blue), or when either WT (red), ΔCN (purple), or ΔPKA (gold) variants of AKAP79c97 were included. (F) Peak rates (calculated between 30 and 90 s) for the responses shown in the preceding panel. Statistical comparisons were performed using two-tailed unpaired Student t‐tests. ***p < 0.001.
-
Figure 3—source data 1
Rates of AKAR4 phosphorylation in purified protein mixtures.
- https://cdn.elifesciences.org/articles/68164/elife-68164-fig3-data1-v2.xlsx
Figure 3—figure supplement 1

AKAR4 reference measurements with PKA catalytic subunit.
(A) Averaged AKAR4 traces showing change in 520 nm / 485 nm (Y/C) emission ratio over time after injection of 5 mM ATP into reactions containing only PKA C subunits at a range of concentrations. (B) Relationship between free C subunit concentration (in the absence of CN) and emission ratio change per minute. The data was fitted to a Hill function (y = 380*x1.71/(34811.71+x1.71)) with an adjusted R-square value of 0.99983. (C) Averaged AKAR4 traces showing data for the same experiment as the preceding panel but with 1.5 μM CN included in all reactions. (D) Peak 520 nm / 485 nm (Y/C) emission ratio changes at different concentrations of C subunit, either without (black bars) or with (striped bars) 1.5 μM CN. Average rates were calculated between 15 and 75 s, with the exception of 0 and 25 nM C subunit concentrations (30–330 s). (E) Averaged peak AKAR4 responses from all recordings for type II PKA either alone (top row), with CN (middle row), or with both CN and AKAP collected after injections of 5 mM ATP with different concentrations of cAMP. These rates were cross-referenced against the reference curve shown in panel b to estimate free C subunit concentrations (plotted in Figure 4A–C). Peak rates were calculated between 30 and 90 s, with the exception of 0 and 100 nM cAMP responses where a wider time window (30–330 s) was applied.
-
Figure 3—figure supplement 1—source data 1
Rates of AKAR4 phosphorylation with C subunit alone.
- https://cdn.elifesciences.org/articles/68164/elife-68164-fig3-figsupp1-data1-v2.xlsx
Figure 3—figure supplement 2
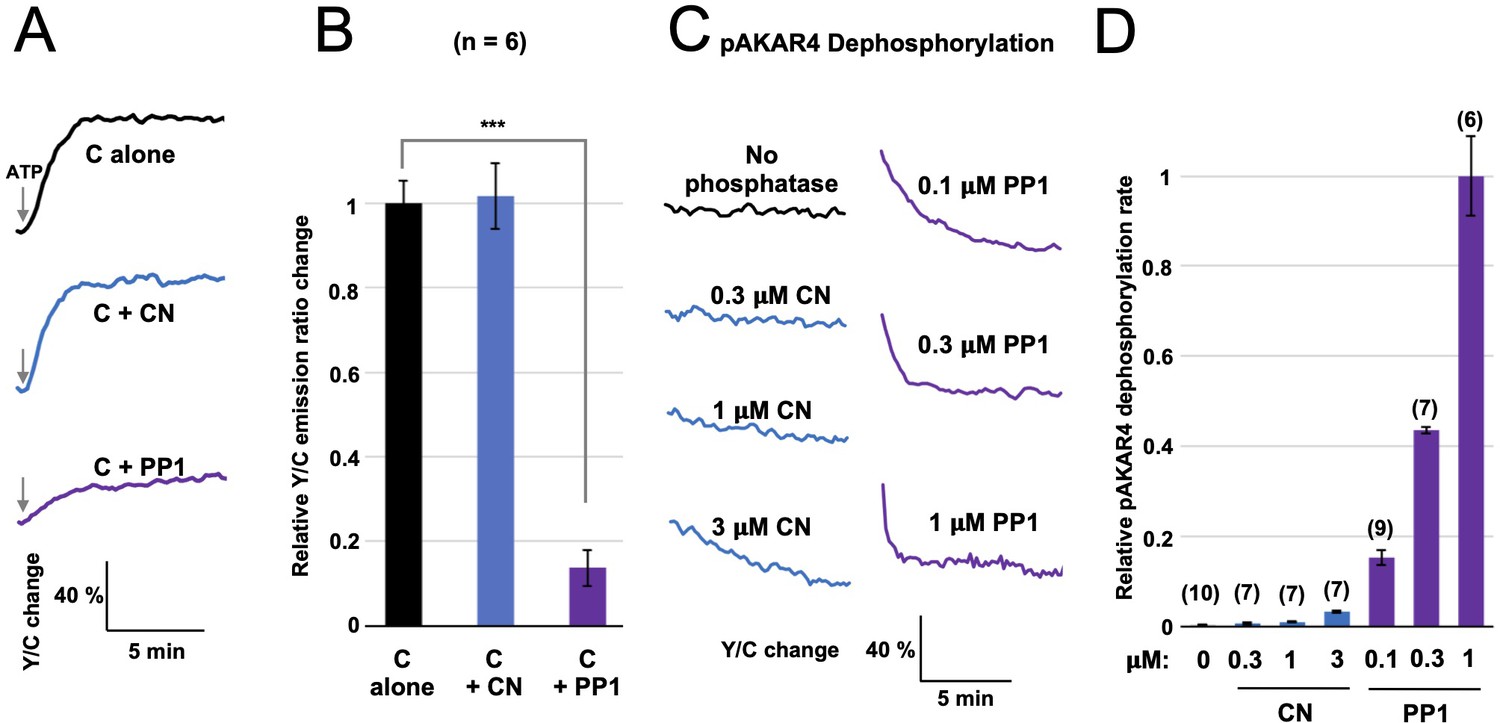
Comparison of CN and PP1 activity towards AKAR4.
(A) AKAR4 responses are shown for reactions containing 400 nM C subunits alone (black), with 1.5 μM CN (blue), or with 1.5 μM PP1 (purple). Phosphorylation was initiated by injection of ATP to a final concentration of 5 mM. (B) Peak rates (calculated between 20–50 s after ATP injection) for the responses shown in the preceding panel. Inclusion of CN did not alter the rate (relative rates of 1 ± 0.05 for C alone compared to 1.02 ± 0.08 for C + CN), whereas addition of PP1 (purple) reduced the rate to 0.14 ± 0.04 (p = 9 x 10e-6). (C) We also compared rates of dephosphorylation of AKAR4 pre-phosphorylated by PKA. Reponses are shown for pAKAR4 dephosphorylation in the presence of no phosphatase (black) or with different concentrations of CN (blue) or PP1 (purple). (D) Peak rates for the data shown in the preceding panel. Replicate numbers for each condition are shown in parentheses. Rates are normalized to the dephosphorylation rate with 1 µM PP1. The relative rates were as follows: 0.003 ± 0.001 with no phosphatase; with CN, 0.007 ± 0.001 (0.3 μM); 0.011 ± 0.001 (1 CN), and 0.033 ± 0.001 (3 μM); and with PP1, 0.15 ± 0.02 (0.1 μM), 0.44 ± 0.01 (0.3 μM), and 1 ± 0.09 (1 μM). The data indicate that PP1 is much more active towards pAKAR4 than CN, with fivefold faster pAKAR4 dephosphorylation at the lowest PP1 concentration tested (0.1 μM) than the highest CN concentration (3 μM). The statistical comparison was performed using a one-tailed paired Student t-test. ***p < 0.001.
-
Figure 3—figure supplement 2—source data 1
Comparison of CN and PP1 activity toward pAKAR4.
- https://cdn.elifesciences.org/articles/68164/elife-68164-fig3-figsupp2-data1-v2.xlsx
Figure 4 with 2 supplements
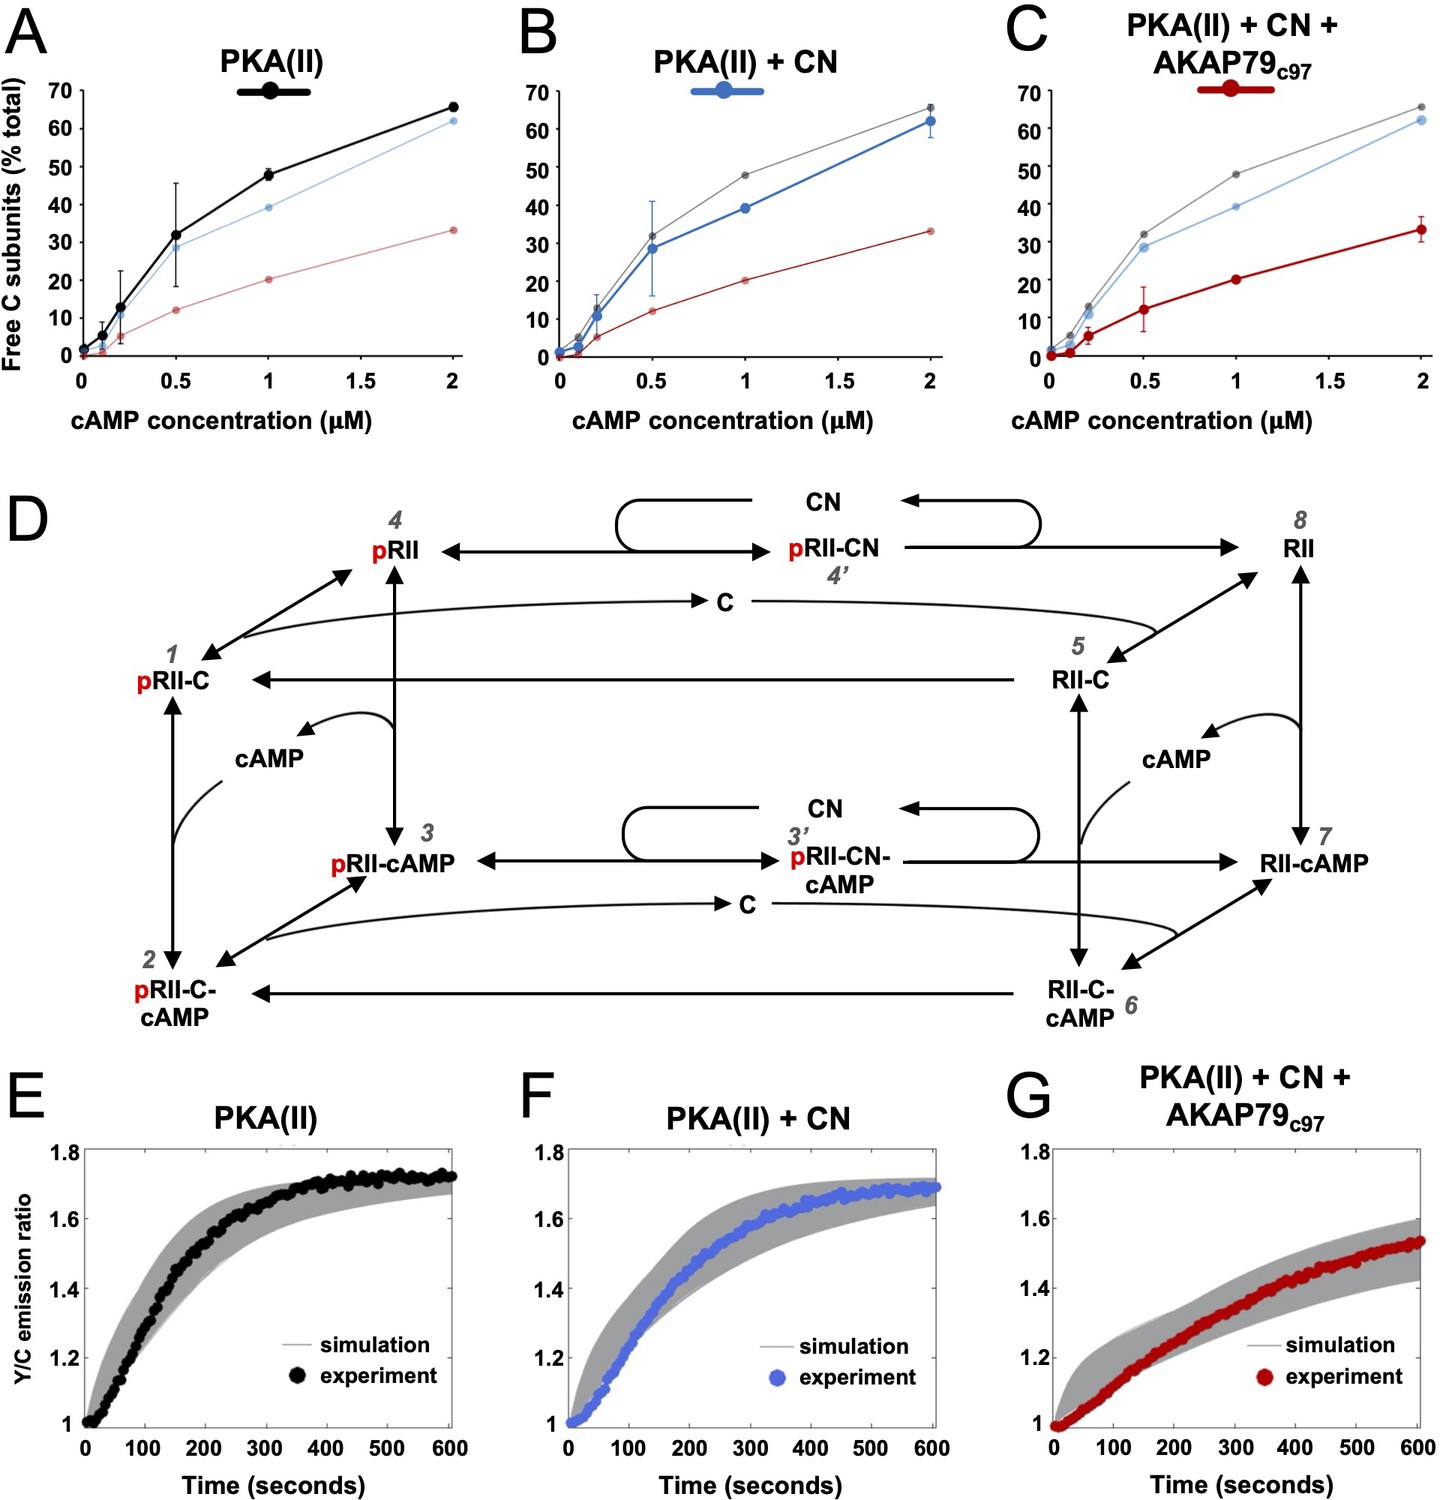
Kinetic analysis of PKA-CN-AKAP79 signaling.
(A–C) Estimates of the average proportion of free C subunits between 30 and 90 s for type II PKA alone (black), with CN (blue), and with both CN and AKAP79c97 (red) following activation of the protein mixtures with a range of cAMP concentrations. (D) Reaction scheme used for modeling type II PKA regulation by CN. Each species within the scheme is numbered consistent with supporting data in figure in Supplementary file 1. (E–G) Model simulations for protein mixtures activated with 1 μM cAMP are shown with the experimental data overlaid. Averaged values are shown for experimental data after pooling the data shown in Figure 3. Responses are shown for type II PKA alone (E), with CN (F), and with both CN and AKAP79c97 (G). A sample of the corresponding simulated responses are shown in grey. An ‘error’ threshold of 0.01 was used to accept curves as a good fit.
-
Figure 4—source data 1
Free C subunit calculations.
- https://cdn.elifesciences.org/articles/68164/elife-68164-fig4-data1-v2.xlsx
Figure 4—figure supplement 1
Simulations of kinetic scheme species changes in concentration over time.
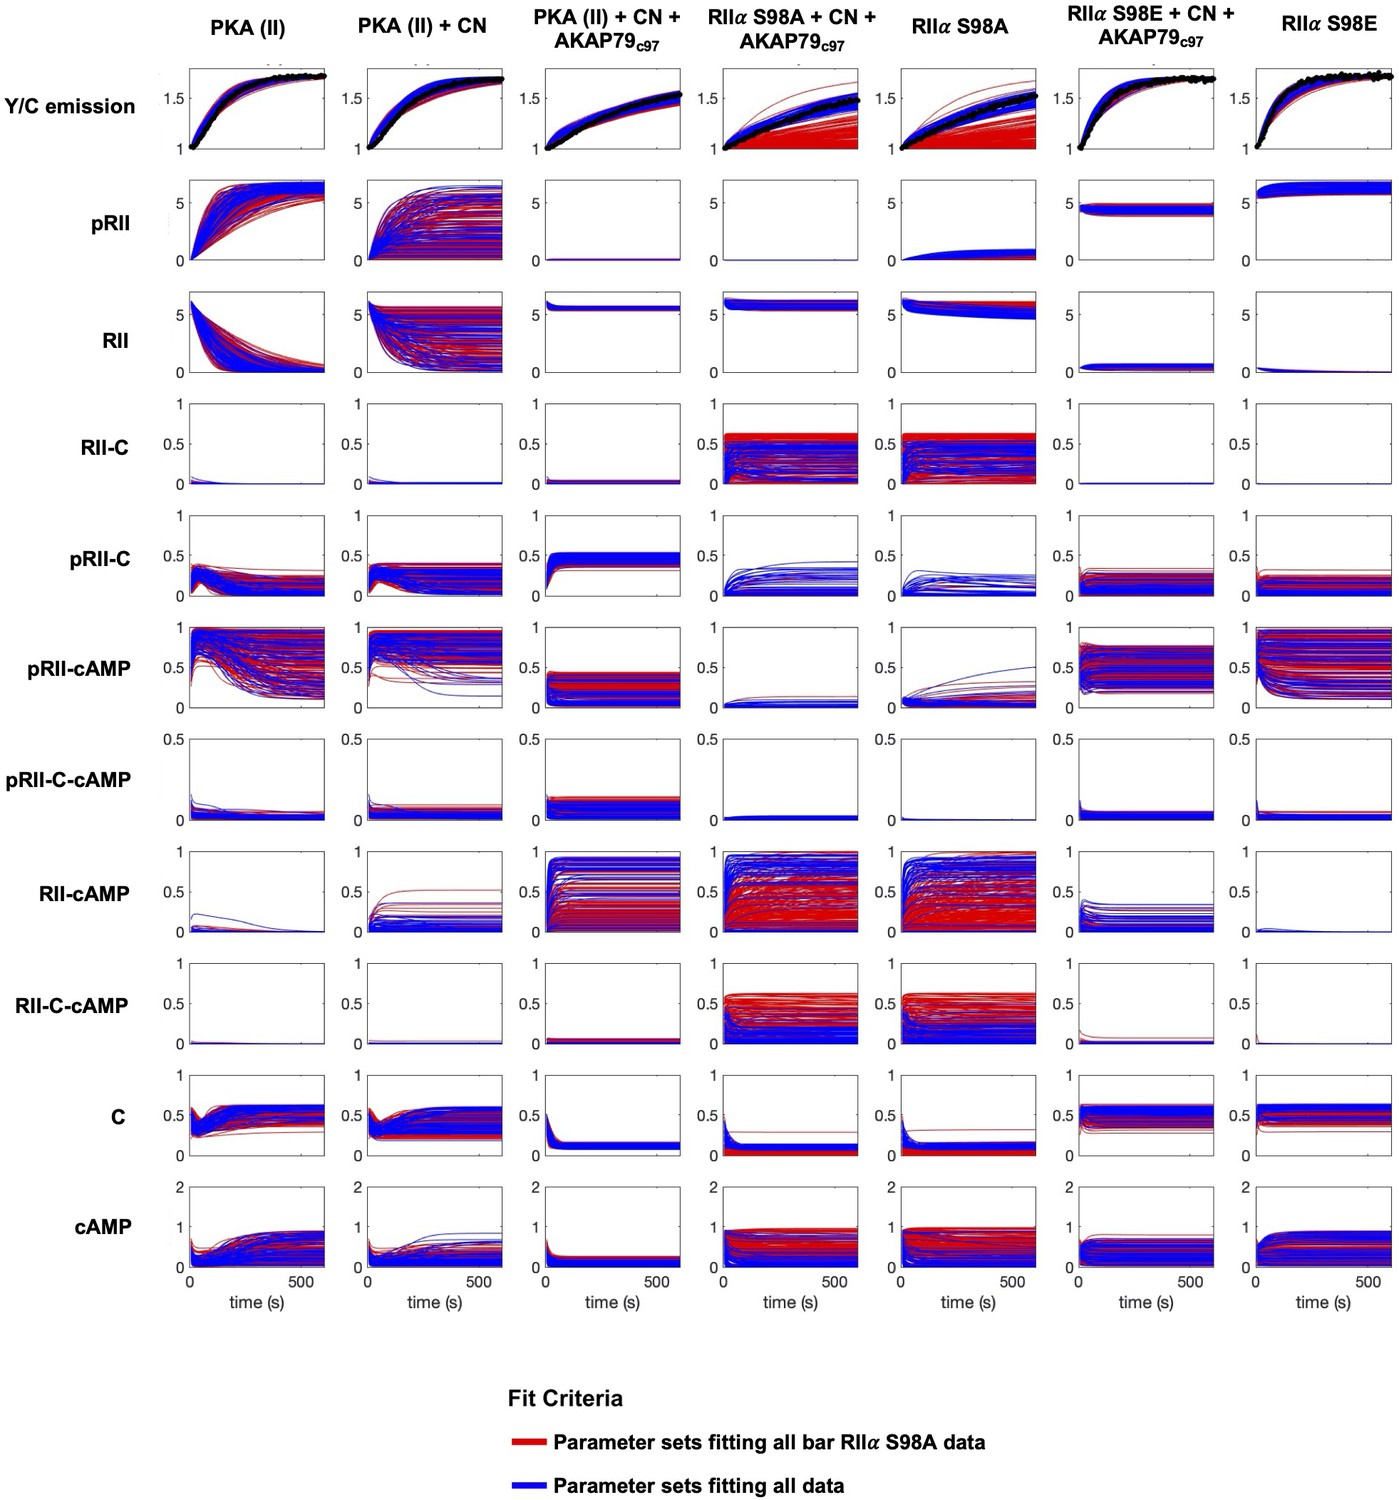
Each row corresponds to the concentration (µM) of an individual species simulated in seven different reaction mixtures. The first three columns correspond to experiments with WT RIIα subunits; columns four and five to experiments with RIIα S98A subunits, and the last two columns with RIIα S98E subunits. Red lines correspond to simulations whose parameter sets were classified as far from experimental data collected with mutated RIIα, but which fit well to data collected with WT RIIα subunits in reactions stimulated with 0, 0.2, 1, and 2 μM cAMP. Blue traces correspond to simulations with parameter sets that generated results close to experimental data collected with both WT and mutant RIIα subunits.
Figure 4—figure supplement 2

Simulations of responses with different concentrations of cAMP.
For each condition, simulations (grey lines) are shown alongside experimental data. The first four rows show responses with different concentrations of cAMP: 0 μM (top row), 0.2 μM (second row), 1 μM (third row), 2 μM (fourth row). The bottom row corresponds to responses at 1 μM with mixtures containing RIIα mutants.
Figure 5 with 1 supplement
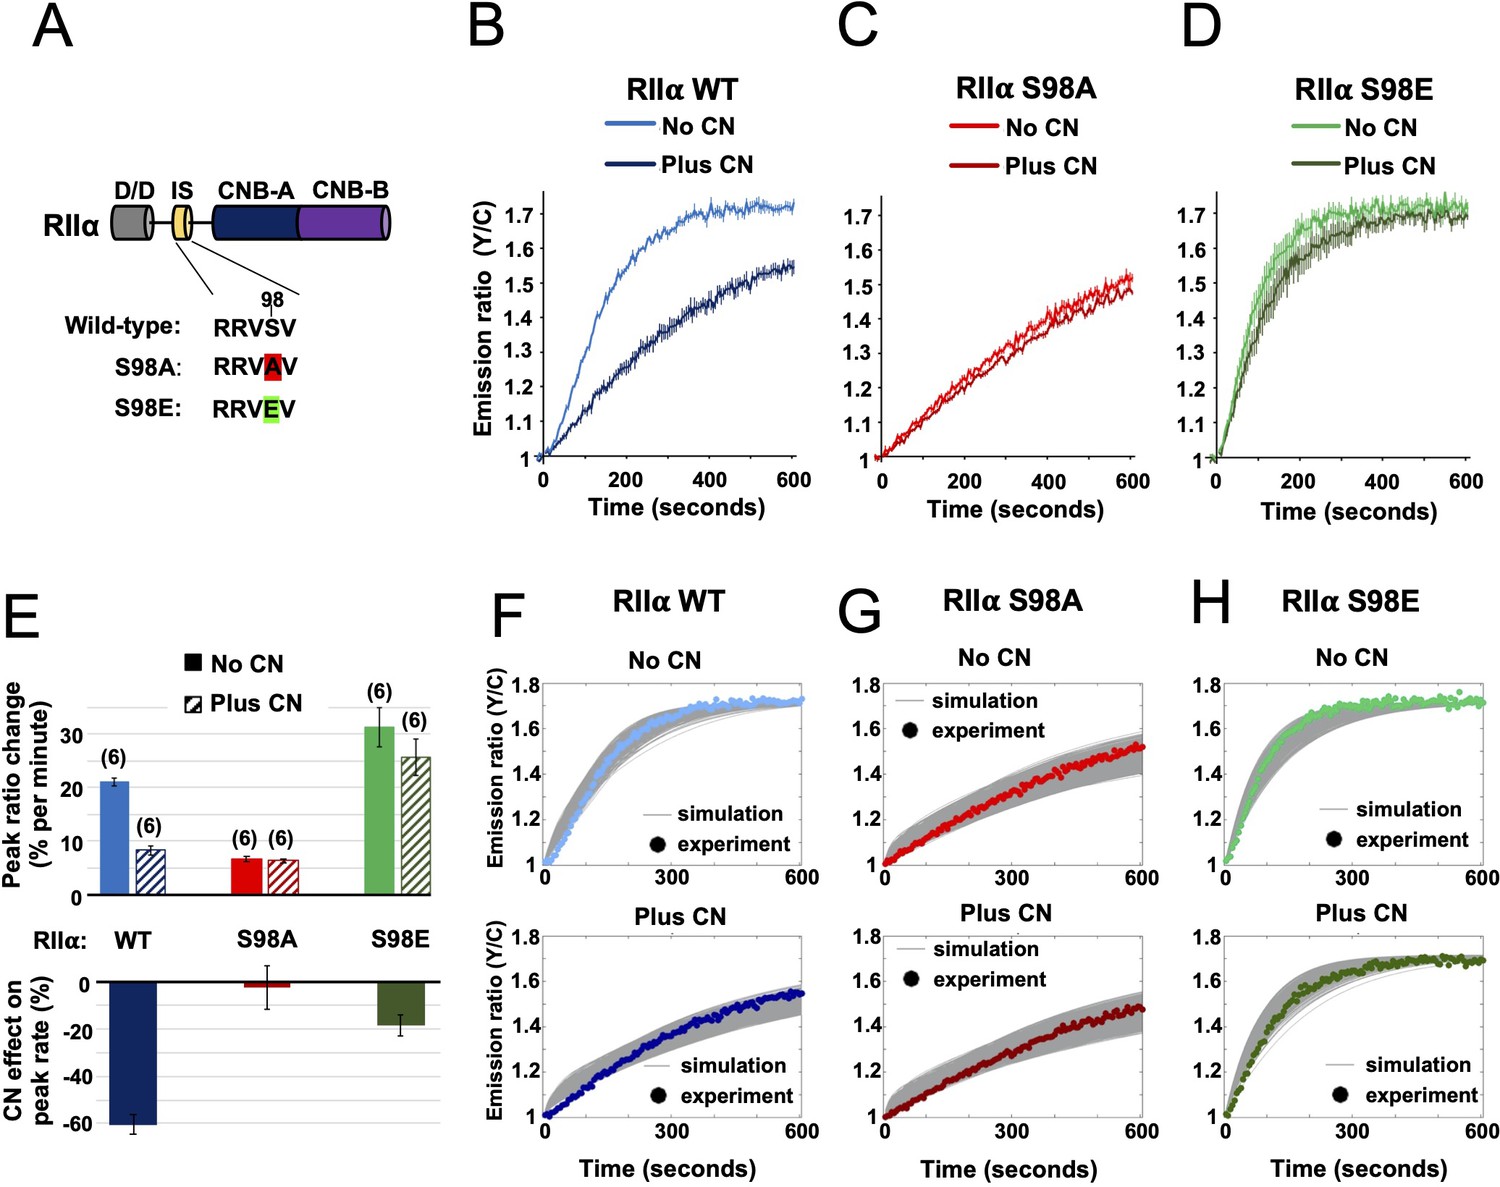
Characterization of RIIα IS phosphorylation site mutations.
(A) RII subunit topology showing locations of the docking and dimerization domain (D/D, gray), inhibitor sequence (IS, yellow), and tandem cyclic nucleotide binding domains (dark and light blue). S98A (red) and S98E (green) mutations in the IS are highlighted. (B–D) Comparison of AKAR4 emission ratio changes following 5 mM ATP/1 μM cAMP activation of protein mixtures containing either WT (B), S98A (C), or S98E (D) RII. 1.03 μM RIIβ was included in all cases. Measurements were collected either with or without CN in the reaction mixture. Averaged responses (± SE) are shown for WT RII with (dark blue) and without CN (light blue), S98A RII with (dark red) and without (light red) CN, and RII S98E with (dark green) and without (light green) CN. (E) The upper bar chart shows peak rates (calculated between 30 and 90 s) for the responses shown in panels b-d. The effect of including CN in the reaction mixture for each RII variant is shown in the lower bar chart. (F–H) Model predictions in the six conditions of panels b-d are shown in grey when simulating using the ‘extended’ model (see Materials and methods) and using the different parameter sets generated from the parameter estimation approach. The same parameters as retrieved using data shown in Figure 4 were used as a starting point for the simulations, but parameter sets were filtered based on data collected with RII S98A. Model predictions are shown alongside the corresponding experimental data collected with either WT (F), S98A (G), or S98E (H) RII in the reaction mix.
-
Figure 5—source data 1
Rates of AKAR4 phosphorylation with mutant RIIα subunits.
- https://cdn.elifesciences.org/articles/68164/elife-68164-fig5-data1-v2.xlsx
Figure 5—figure supplement 1
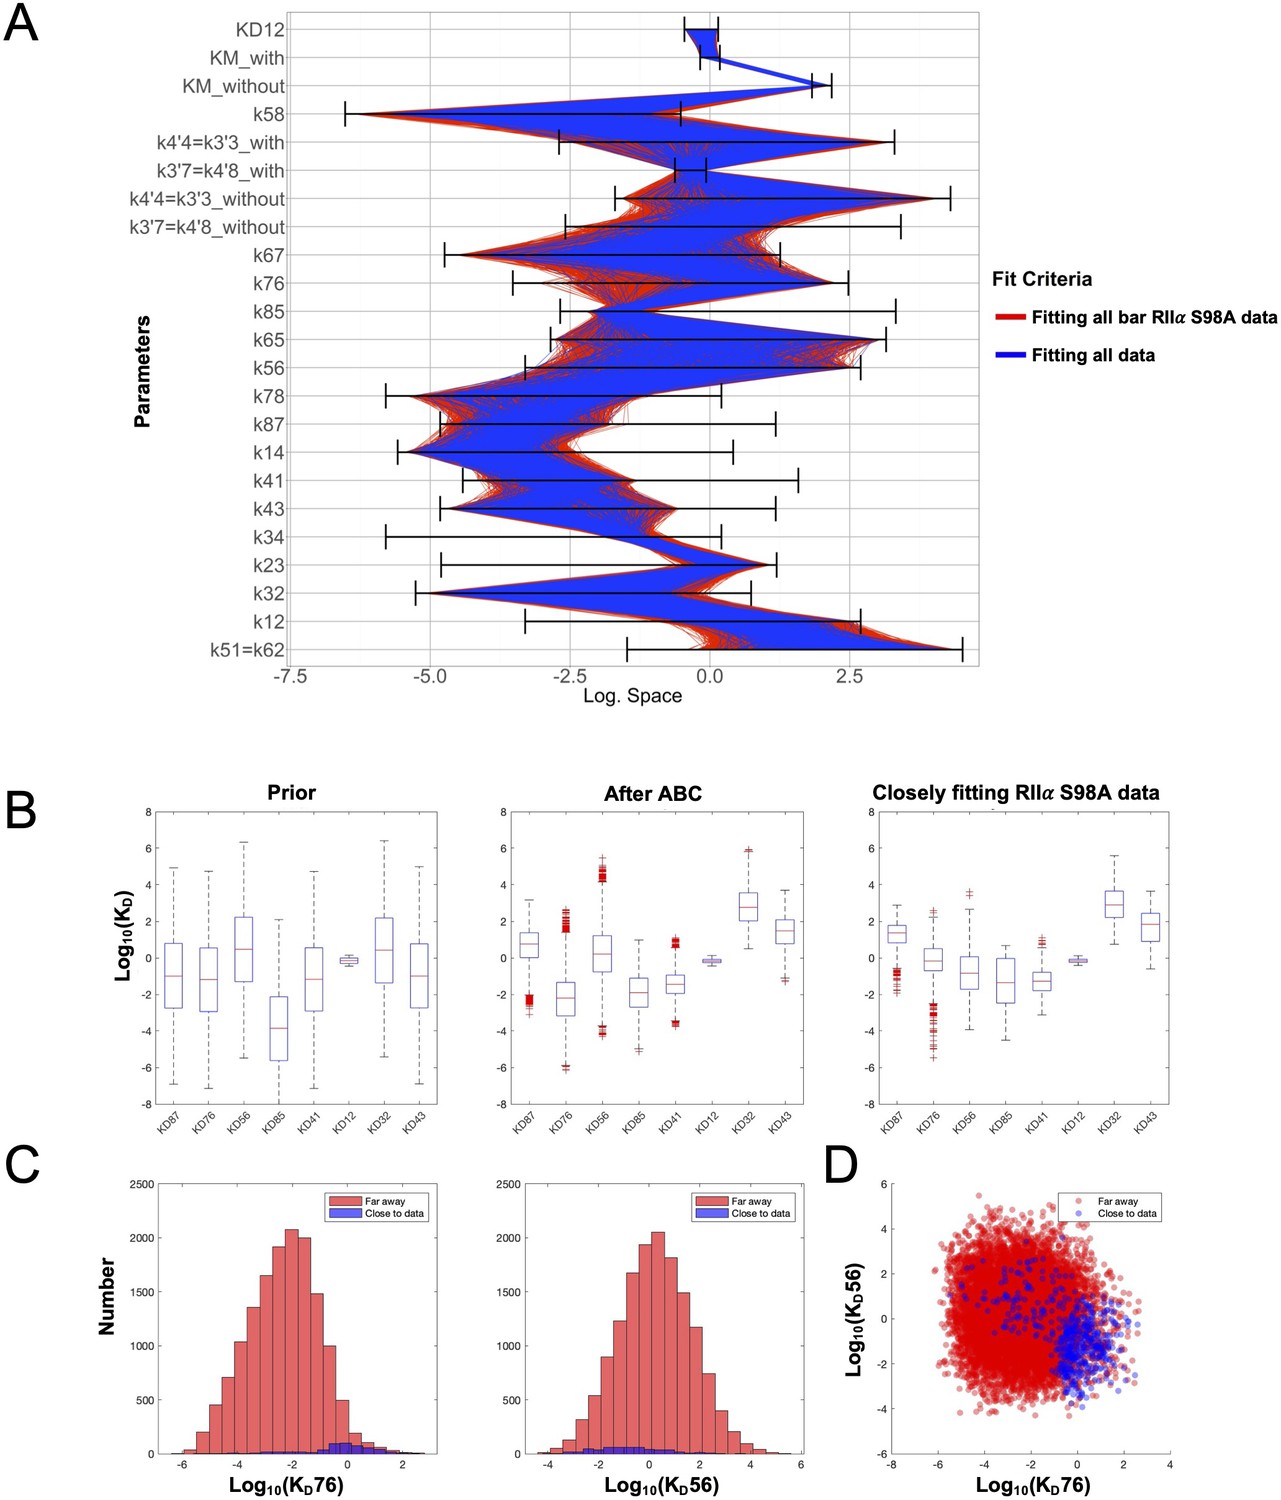
Space of parameters used in model fitting.
(A) The illustration shows the marginal posterior distribution of each model parameter on a logarithmic scale for a subset of parameter samples that generated simulations that fit experimental data collected with WT RIIα subunits. Each sample in the distribution is connected across the parameters by a line, whose color indicates whether the corresponding parameter set also generated simulations fitting closely (blue) to data collected with mutant RIIα subunits or not (red). The parameter priors are indicated by the respective black horizontal bars. (B) Distribution of dissociation constants (KD’s). The boxplots display median values (red lines), the 50 % datapoint distribution around the median (designated by boxes) and the remaining 25 % datapoint distributions (lower and upper whiskers). Boxplots are shown for all eight KD’s obtained with the model priors (left), data fitted using experiments with WT RIIα subunits (middle), and parameters selected for fitting to data collected with RIIα S98A subunits. (C) Marginal histograms for KD76 (left) and KD56 (right) with parameter sets classified according to whether they fit well to the RIIα S98A data (blue) or not (red). (D) Scatterplot showing how the KD76 and KD56 parameters are related according to the same two classes.
Figure 6
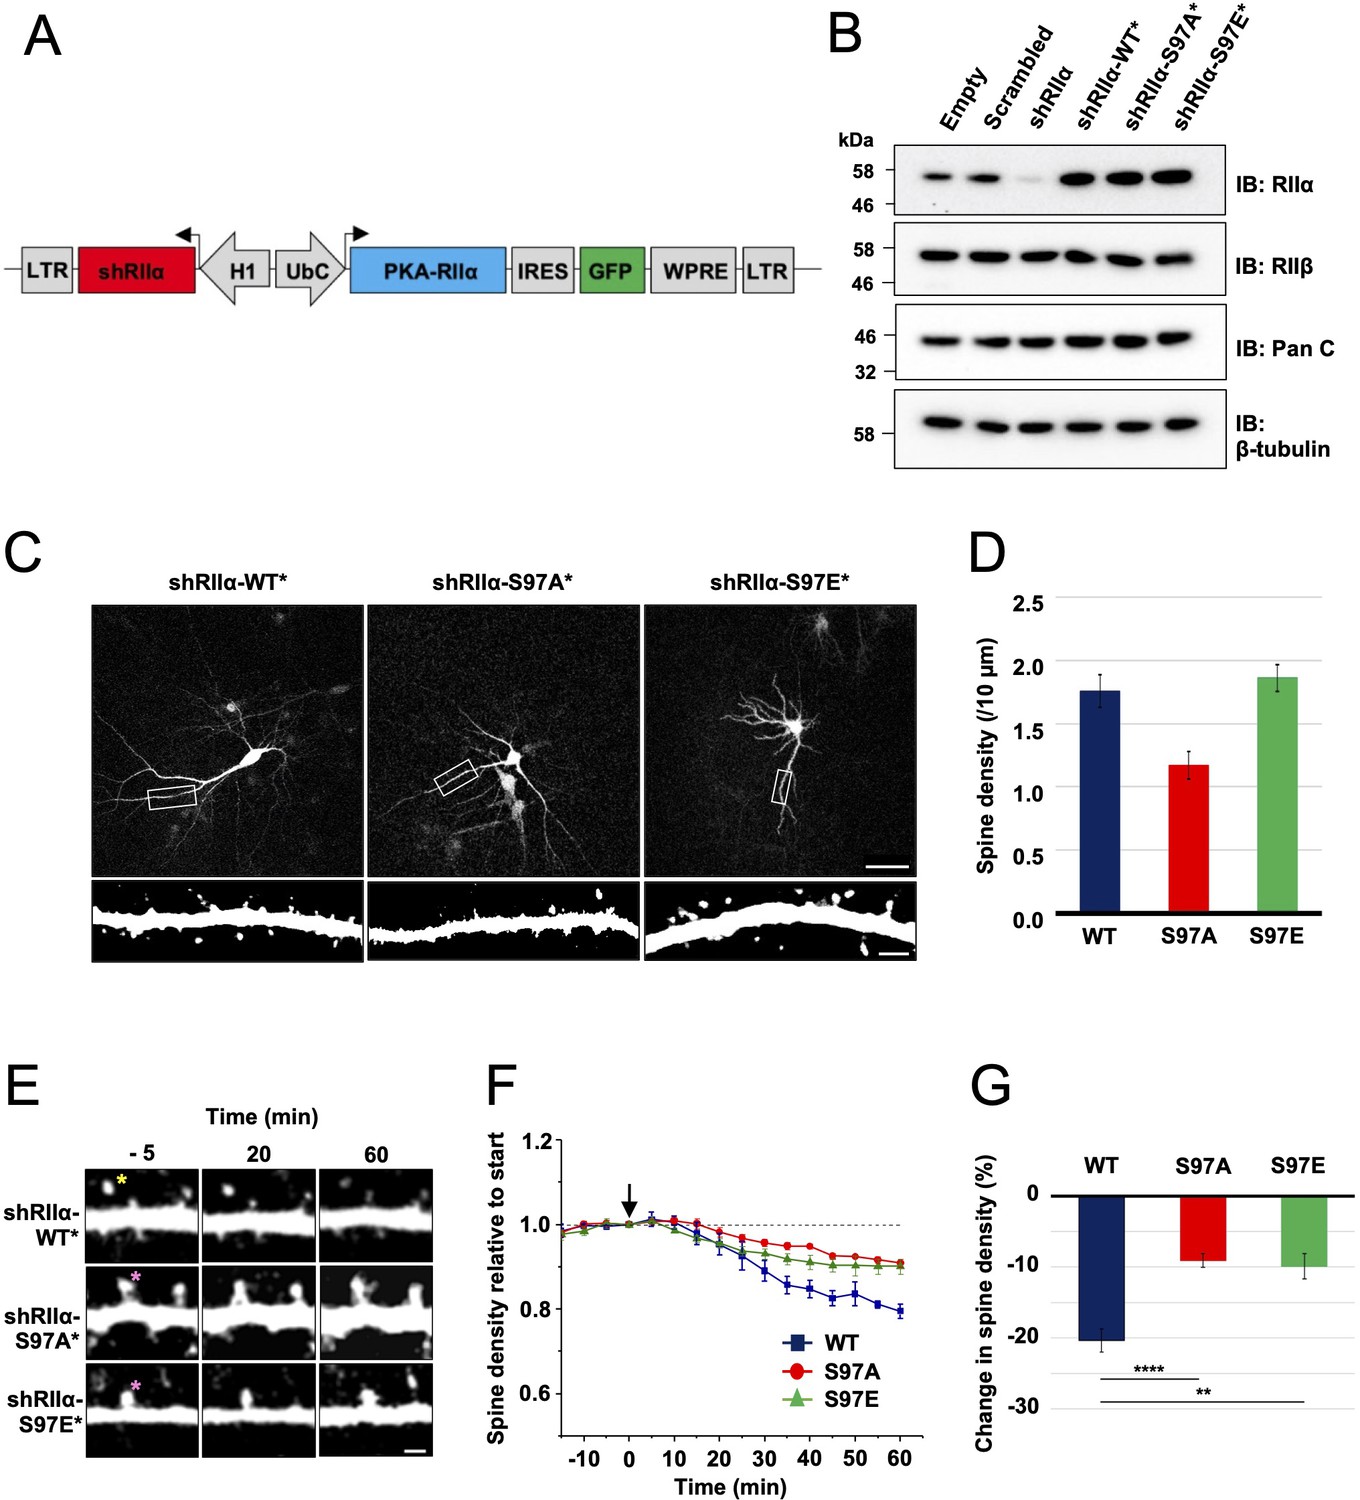
Lentivirus development and spine density imaging.
(A) Schematic of the FUGW-H1-based lentiviral vector used to knock down and replace endogenous RIIα subunits in dissociated hippocampal cultures. (B) To validate lentiviruses, dissociated hippocampal neurons were infected on the seventh day in vitro (DIV7). Immunoblots are shown comparing neuronal extracts collected on DIV14 after infection with no virus, virus expressing scrambled shRNA only, shRIIα only, and the three complete lentiviruses for knockdown/replacement with either WT, S97A, or S97E RIIα. (C) Representative live-cell images of lentivirus-infected primary hippocampal neurons at DIV14 expressing either WT, S97A, or S97E RIIα. Scale bars correspond to 50 μm (upper panels) and 5 μm (lower panels). (D) Average spine density on hippocampal dendrites following lentiviral replacement of endogenous RIIα. Data were averaged from 106 (WT), 97 (S97A), and 113 (S97E) neurons derived from seven rats for each condition, and are represented as mean ± SE. Conditions were compared using one-way ANOVA with Turkey post-hoc tests. (E) Representative live-cell images showing dendritic spines in primary hippocampal neurons expressing either WT, S97A, or S97E replacement RIIα at three points before and after chem-LTD (scale bar = 2.5 µm). Chem-LTD was induced at t = 0 with 20 μM NMDA for 3 min. The yellow asterisk indicates a spine that disappeared over the course of the protocol whereas the pink asterisks indicate spines that did not. (F) Plot showing average changes in spine density (± SE) in primary hippocampal neurons expressing either WT (dark blue), S97A (red), or S97E (green) RIIα. (G) Average changes in spine density± SE 1 hr after induction of chem-LTD are shown for neurons expressing WT (dark blue, n = 5), S97A (red, n = 5), and S97E (green, n = 4) RIIα variants as shown in the preceding two panels. Statistical comparisons were performed by two-way ANOVA followed by Bonferroni’s post-hoc test. **p < 0.01, ***p < 0.001.
-
Figure 6—source data 1
Spine density quantitation.
- https://cdn.elifesciences.org/articles/68164/elife-68164-fig6-data1-v2.xlsx
Figure 7
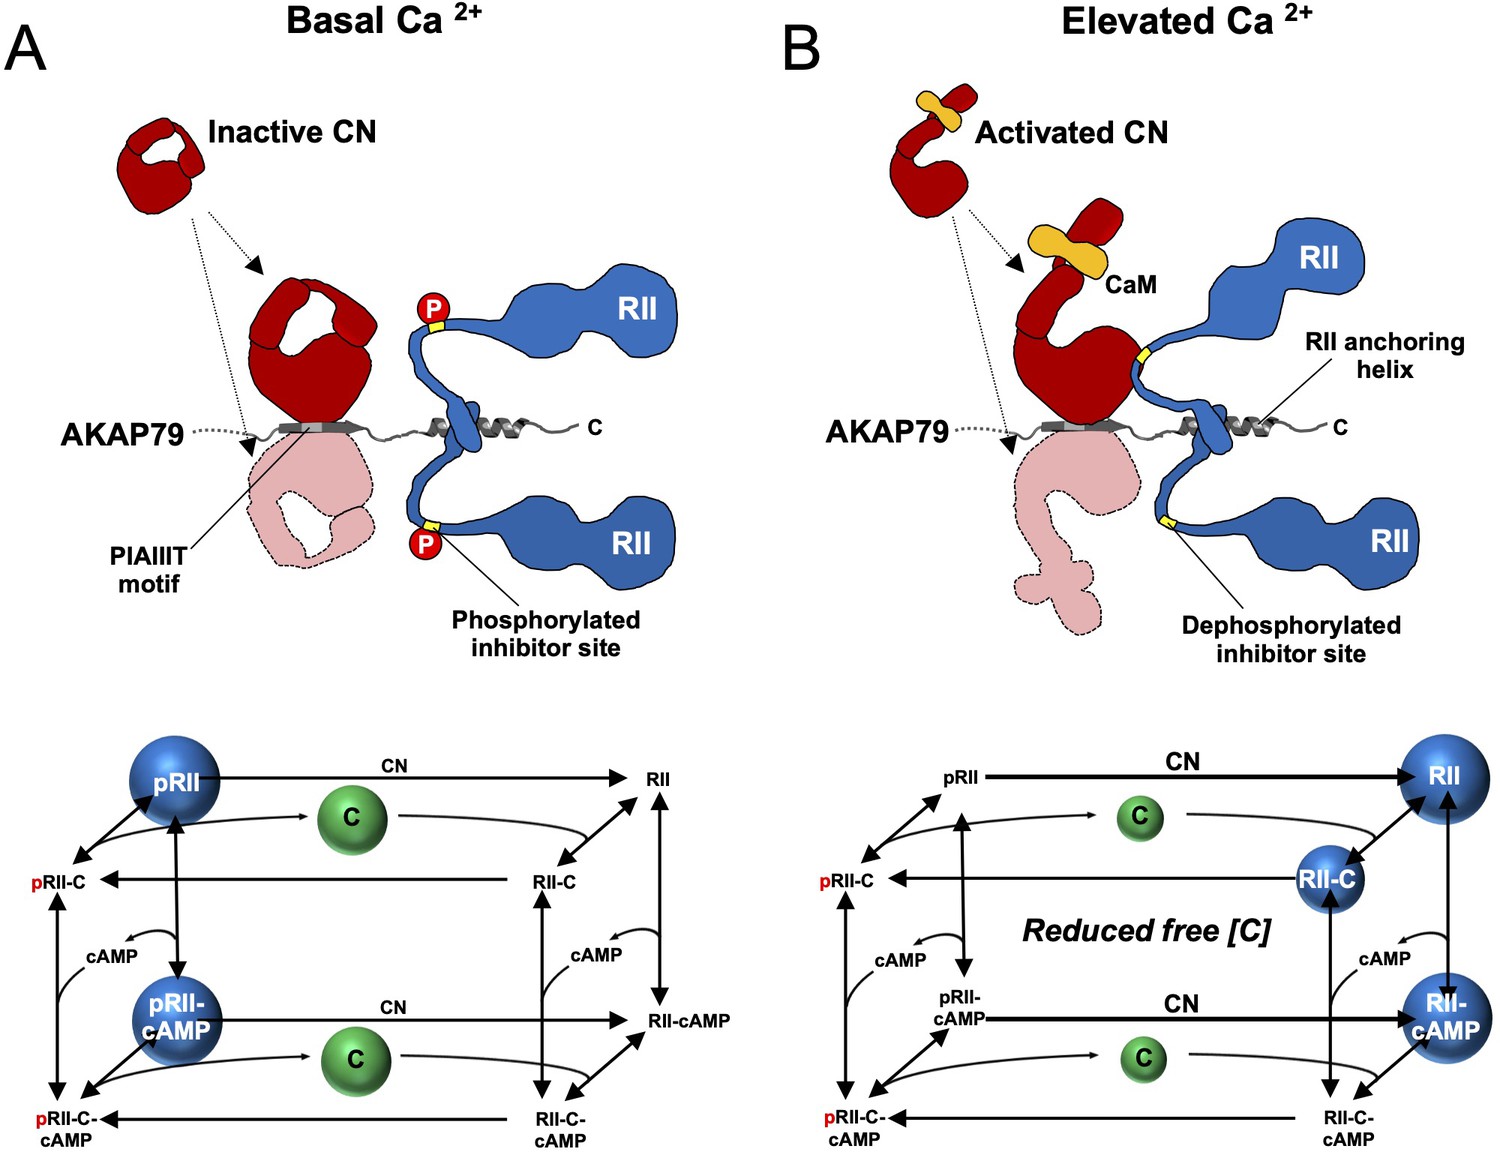
Summary model of PKA suppression by CN within the AKAP79 complex.
Structural and kinetic models (upper and lower panels, respectively) of signaling within the AKAP79 complex are shown under conditions of either low (A) or elevated Ca2+ (B). Elevated Ca2+ triggers CN (red) dephosphorylation of pRII (blue) which shifts C subunit capture from the left-hand square of the kinetic scheme to the right-hand square which features dephosphorylated forms of RII. The overall effect is a reduction in the concentration of free C subunits. The most abundant forms of RII under the two conditions are highlighted by blue spheres.
Tables
Key resources table
| Reagent type (species) or resource | Designation | Source or reference | Identifiers | Additional information |
|---|---|---|---|---|
| Strain, strain background (Escherichia coli) | TOP10 chemically competent | Life Technologies | Cat# C404003 | |
| Strain, strain background (Escherichia coli) | BL21 (DE3) | Thermo Fisher Scientific | Cat# EC0114 | |
| Strain, strain background (Escherichia coli) | BL21 Tuner (DE3) pLysS | Merck | Cat# 70,624 | |
| Strain, strain background (Escherichia coli) | BL21 Star (DE3) | Thermo Fisher Scientific | Cat# C601003 | |
| Strain, strain background (Escherichia coli) | Stbl3 | Thermo Fisher Scientific | Cat# C737303 | |
| Cell line (Homo-sapiens) | HEK293 | Horizon Discovery LTD | Cat# HCL3417 | Myocplasma tested. |
| Cell line (Homo-sapiens) | HEK293T | ATCC | Cat# CRL-3216 | Myocplasma tested. |
| Biological sample (Rattus norvegicus) | Sprague Dawley | UCL breeding colony | Not applicable | |
| Antibody | (Mouse monoclonal) anti-PKA RIIα | BD Biosciences | Cat# 612243; RRID:AB_399566 | (0.8 μg/mL) |
| Antibody | (Mouse monoclonal) anti-PKA RIIβ | BD Biosciences | Cat# 610626; RRID:AB_397958 | (0.8 μg/mL) |
| Antibody | (Mouse monoclonal) anti-PKA C (pan) | BD Biosciences | Cat# 610981; RRID:AB_398294 | (0.5 μg/mL) |
| Antibody | (Mouse monoclonal) anti-PKA RI (pan) | BD Biosciences | Cat# 610166; RRID:AB_397567 | (0.8 μg/mL) |
| Antibody | (Rabbit monoclonal) anti-PKA phospho-RIIα | Abcam | Cat# ab32390; RRID:AB_779040 | (0.8 μg/mL) |
| Antibody | (Rabbit polyclonal) anti-GFP | Sigma Aldrich | Cat# SAB4301138; RRID:AB_2750576 | (0.5 μg/mL) |
| Antibody | (Mouse monoclonal) anti-β-tubulin | Biolegend | Cat# 903401; RRID: AB_2565030 | (0.5 μg/mL) |
| Antibody | Goat anti-rabbit HRP-linked secondary antibody | Cell Signalling Technology | Cat # 7,074 S; RRID:AB_2099233 | (1 μg/mL) |
| Antibody | Goat anti-mouse IgG (H + L) poly-HRP secondary antibody | Thermo Fisher Scientific | Cat# 32230; RRID:AB_1965958 | (1 μg/mL) |
| Recombinant DNA reagent | pIRES2-EGFP | Clontech | Cat# 6029–1 | |
| Recombinant DNA reagent | pFUGW-H1 | Sally Temple lab/Addgene | Cat# 25870; RRID:Addgene_25870 | Lentiviral entry vector. |
| Recombinant DNA reagent | pFUGW-shRIIα-RIIα*-WT-IRES-EGFP | This study | Not applicable | Lentivral entry vector.Dr. Matthew G. Gold (University College London) |
| Recombinant DNA reagent | pFUGW-shRIIα-RIIα*-S97A-IRES-EGFP | This study | Not applicable | Lentivral entry vector.Dr. Matthew G. Gold (University College London) |
| Recombinant DNA reagent | pFUGW-shRIIα-RIIα*-S97E-IRES-EGFP | This study | Not applicable | Lentivral entry vector.Dr. Matthew G. Gold (University College London) |
| Recombinant DNA reagent | pCMVdR8.74 & pMD2.G plasmids | Didier Trono lab/Addgene | Cat# 12259; RRID:Addgene_12259 | Lentiviral packaging vectors |
| Recombinant DNA reagent | pcDNA3.1-AKAR4-NES | Jin Zhang lab/Addgene | Cat# 64727; RRID:Addgene_64727 | |
| Chemical compound, drug | Lipofectamine 2000 | Thermo Fisher Scientific | Cat# 11668019 | |
| Chemical compound, drug | DMEM, high glucose, pyruvate | Thermo Fisher Scientific | Cat # 41966029 | |
| Chemical compound, drug | Trypsin | Thermo Fisher Scientific | Cat# 25300054 | |
| Chemical compound, drug | Penicillin/ Streptomycin | Thermo Fisher Scientific | Cat# 15140122 | |
| Chemical compound, drug | GlutaMAX | Thermo Fisher Scientific | Cat# 35050061 | |
| Chemical compound, drug | DPBS, no calcium, no magnesium | Thermo Fisher Scientific | Cat# 14190144 | |
| Chemical compound, drug | HBSS | Thermo Fisher Scientific | Cat# 14185045 | |
| Chemical compound, drug | Heat-inactivated horse serum | Gibco | Cat# 26050088 | |
| Chemical compound, drug | Neurobasal-A medium | Thermo Fisher Scientific | Cat# 10888022 | |
| chemical compound, drug | B27 supplement | Gibco | Cat# 17504044 | |
| chemical compound, drug | Poly-L-Lysine | Sigma Aldrich | Cat# P2636 | |
| chemical compound, drug | Boric acid | Sigma Aldrich | Cat# B6768-500g | |
| chemical compound, drug | Sodium tetraborate | Sigma Aldrich | Cat# 221,732 | |
| chemical compound, drug | cOmplete, Mini, EDTA-free Protease Inhibitor Cocktail | Roche | Cat# 11836170001 | |
| chemical compound, drug | PhosSTOP phosphatase inhibitor tablets | Roche | Cat# 4906845001 | |
| chemical compound, drug | Para-nitrophenylphosphate | Sigma Aldrich | Cat# N3254 | |
| software, algorithm | Origin | OriginLab | http://www.originlab.com/; RRID:SCR_014212 | |
| software, algorithm | Reader Control Software for FLUOStar Omega | BMG Labtech | https://www.bmglabtech.com/reader-control-software/ | |
| software, algorithm | MARS Data Analysis Software | BMG Labtech | https://www.bmglabtech.com/mars-data-analysis-software/ | |
| software, algorithm | Unicorn Start 1.1 Software for controlling AKTA start system | GE Healthcare | Cat# 29225049 | |
| software, algorithm | ImageJ (version 1.52) | NIH | RRID:SCR_003070 | |
| software, algorithm | NeuronStudio | Rodriguez et al., 2008 | https://icahn.mssm.edu; RRID:SCR_013798 |
Additional files
-
Supplementary file 1
Kinetic modeling parameters.The table lists parameters used in the computational modeling.
Parameter terminology is according to the numbers above stated in Figure 4D, for example k12 refers to the on rate of cAMP binding to state 1 (pRII-C) to produce state 2 (pRII-C-cAMP). The prior range used to constrain parameter estimation is provided for each parameter along with links to the references used to set the default values.
- https://cdn.elifesciences.org/articles/68164/elife-68164-supp1-v2.docx
-
Supplementary file 2
Oligonucleotide primer sequences.
- https://cdn.elifesciences.org/articles/68164/elife-68164-supp2-v2.docx
-
Transparent reporting form
- https://cdn.elifesciences.org/articles/68164/elife-68164-transrepform1-v2.docx
-
Source data 1
Original images of Coomassie-stained gels and immunoblots included in the manuscript.
- https://cdn.elifesciences.org/articles/68164/elife-68164-supp3-v2.zip
Download links
A two-part list of links to download the article, or parts of the article, in various formats.
Downloads (link to download the article as PDF)
Open citations (links to open the citations from this article in various online reference manager services)
Cite this article (links to download the citations from this article in formats compatible with various reference manager tools)
AKAP79 enables calcineurin to directly suppress protein kinase A activity
eLife 10:e68164.
https://doi.org/10.7554/eLife.68164


