Daily electrical activity in the master circadian clock of a diurnal mammal
- Centre for Biological Timing, Faculty of Biology Medicine and Health, University of Manchester, United Kingdom
- Division of Neuroscience and Experimental Psychology, Faculty of Biology Medicine and Health, University of Manchester, United Kingdom
- Department of Mathematical Sciences, New Jersey Institute of Technology, United States
- Department of Quantitative Pharmacology and Pharmacometrics (QP2), United States
- Division of Diabetes, Endocrinology and Gastroenterology, Faculty of Biology Medicine and Health, University of Manchester, United Kingdom
- EPSRC Centre for Predictive Modelling in Healthcare, Living Systems Institute, University of Exeter, United Kingdom
- Institute of Biomedical and Clinical Sciences, University of Exeter Medical School, University of Exeter, United Kingdom
Figures
Figure 1
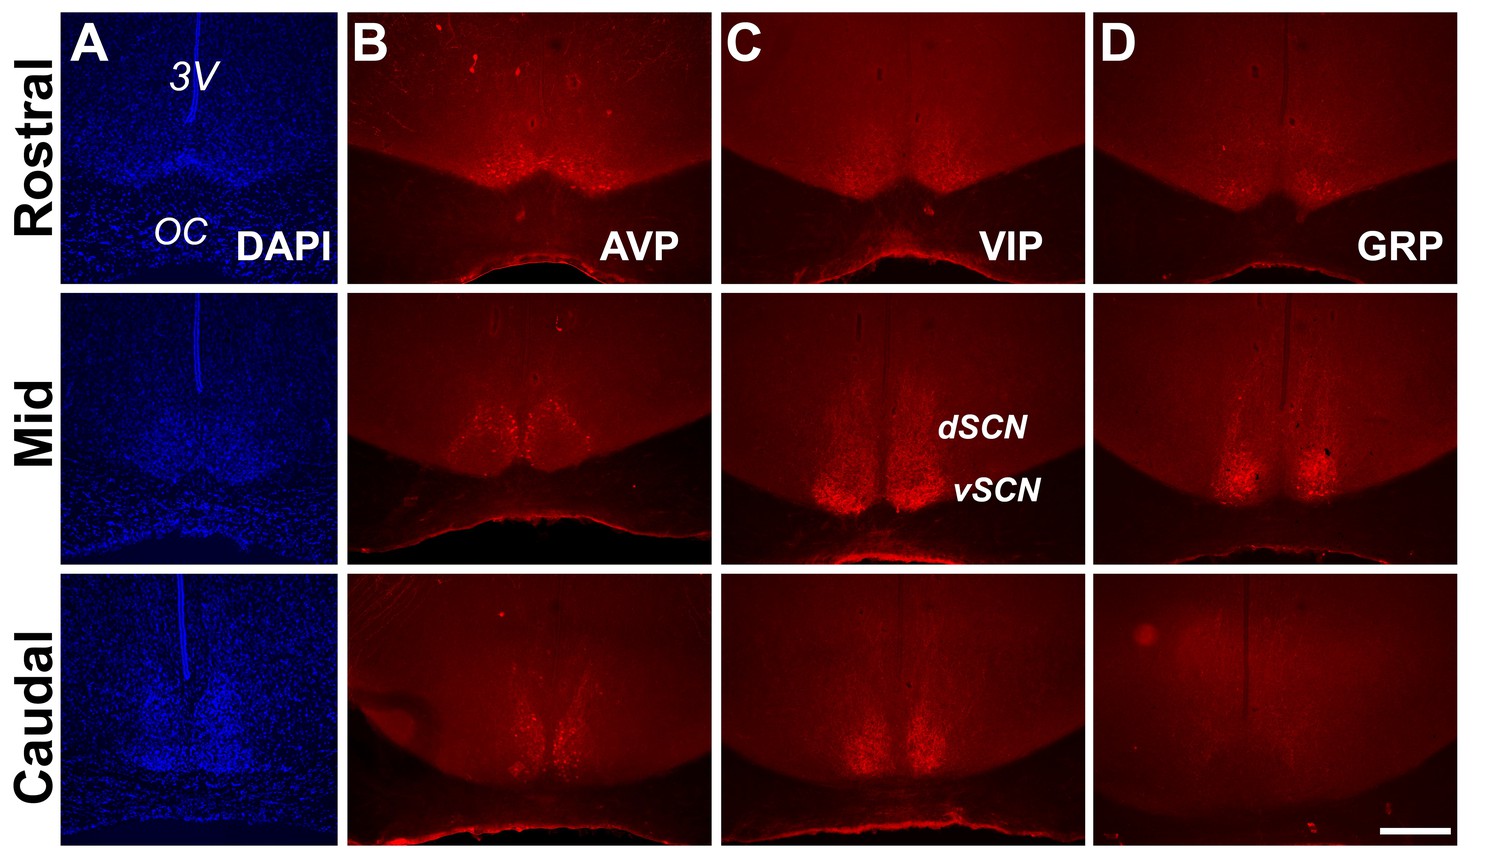
Anatomy and neuropeptidergic organization of the Rhabdomys pumilio SCN.
(A) Coronal sections of the R. pumilio SCN taken across the rostro-caudal axis labeled with DAPI, and immunofluorescence for the main SCN neuropeptides: (B) Arginine-vasopressin (AVP), (C) Vasoactive intestinal peptide (VIP) and (D) Gastrin releasing peptide (GRP). 3V: third ventricle; OC: optic chiasm. dSCN: dorsal SCN, vSCN: ventral SCN. Labeling at the rostral level applies to mid and caudal aspects. Scale bar: 250 µm.
Figure 2
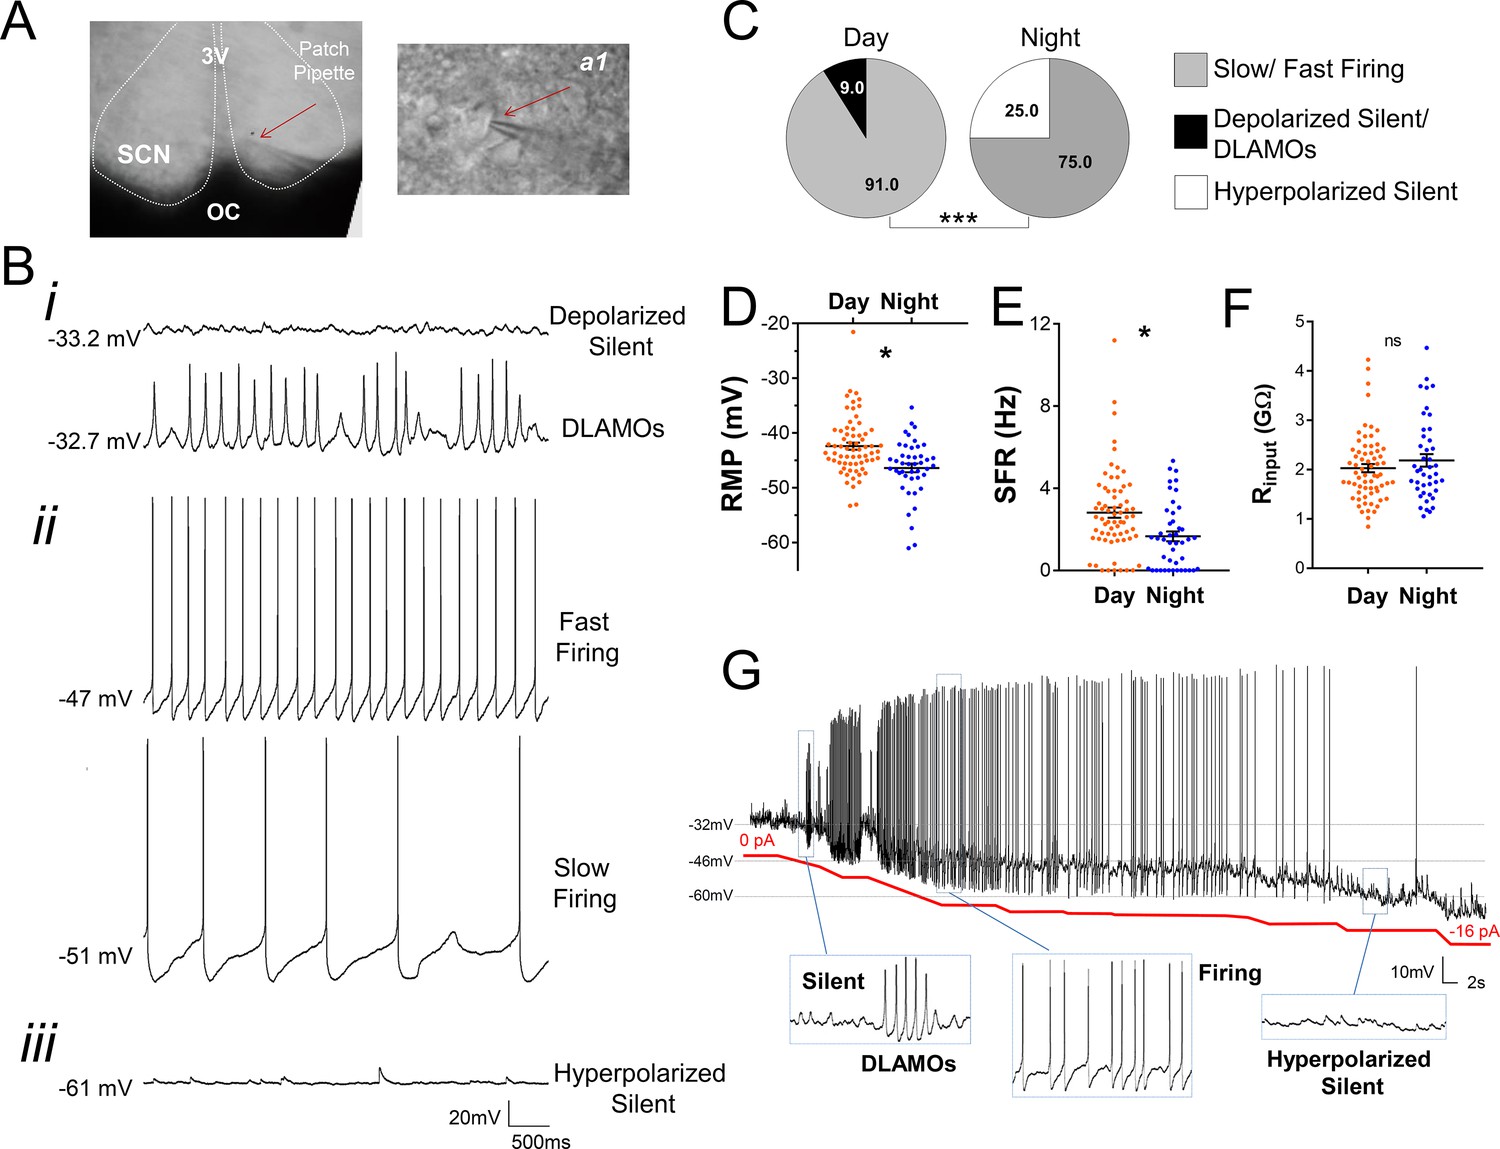
Diurnal changes in the spontaneous electrical activity of Rhabdomys pumilio SCN neurons.
(A) Whole-cell patch clamp recording setup showing bright-field image of a SCN coronal brain slice. The SCN (delineated by white dotted lines) can be observed above the optic chiasm (OC), on either side of the third ventricle (3V). Patch pipette targeting a SCN neuron is indicated by the red arrow and magnified in inset (a1). (B) Representative current-clamp traces of the different spontaneous excitability states recorded in R. pumilio SCN neurons: (i) highly depolarized cells, becoming silent (top trace) or displaying depolarized low-amplitude membrane oscillations (DLAMOs) (bottom trace); (ii) moderate resting membrane potential (RMP) with cells firing action potentials (APs) at high or low rate; and (iii) hyperpolarized-silent neurons. (C) Pie charts showing the percentages of SCN neurons in the different electrical states during the day and at night (χ2=21.498, ***p<0.001, Chi-square test). Mean RMP (D), spontaneous firing rate (SFR) (E) and input resistance (Rinput) (F) of neurons recorded during the day (orange, n=67 for RMP and SFR, n=66 for Rinput) and at night (blue, n=44 for RMP and SFR, n=43 for Rinput). Data are expressed as mean ± SEM with each dot representing an individual neuron. ∗p < 0.05, ns: non-significant. RMP: F(1, 5.036)=10.249, p=0.024; SFR: F(1, 7.027)=5.998, p=0.044; Rinput: F(1, 5.984)=0.878, p=0.385, mixed-effects linear model. (G) Manual hyperpolarization of hyperexcited SCN neuron elicits a range of electrical states. Silent cell resting at highly depolarized state could be driven to display DLAMOs, fire APs, and become hyperpolarized-silent by injection of progressive steps of steady-state hyperpolarizing currents (from 0 to ~ −16 pA (red line); driving RMP from −32 mV to −60 mV).
-
Figure 2—source data 1
Numerical data to support graphs in Figure 2C–F.
- https://cdn.elifesciences.org/articles/68179/elife-68179-fig2-data1-v1.xlsx
Figure 3
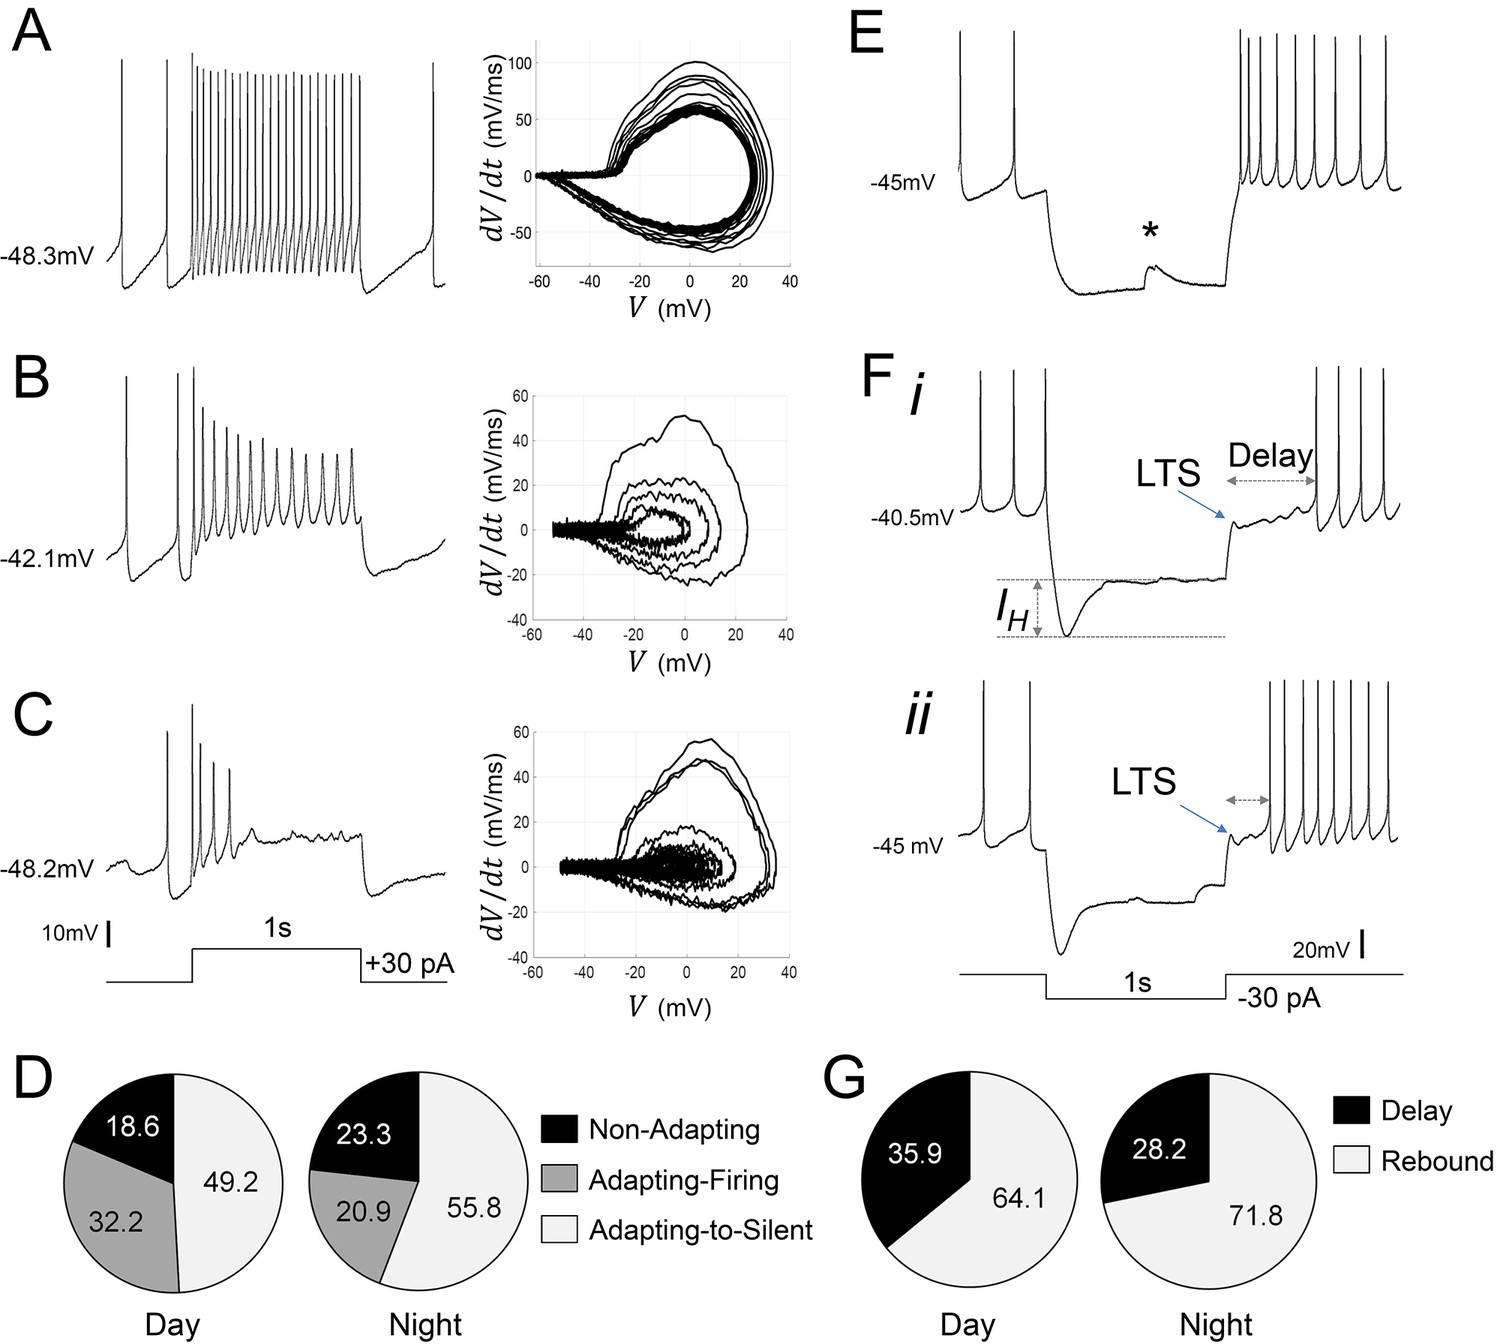
Diverse responses to depolarizing and hyperpolarizing current pulses in Rhabdomys pumilio SCN neurons.
Representative current-clamp traces showing the different type of responses to a depolarizing pulse (1 s, +30 pA): (A) non-adapting; (B) adapting-firing; or (C) adapting-to-silent response. Phase–plot diagrams on the right of each panel (A, B, or C) show action potential (AP) velocity, trajectory and rate of frequency adaptation during the pulse for these neurons. (D) Pie charts showing the percentage of recorded neurons displaying each of these responses to depolarizing pulses during the day and at night (χ2=1.621, p=0.4447). (E–F) Representative current-clamp traces showing the different type of responses to a 1 s, −30 pA hyperpolarizing pulse: (E) Type-A cells responded with a rebound spike upon termination of the pulse; (F) Type-B cells exhibited a rebound hyperpolarization which produced a delay-to-fire, following a LTS ((i–ii) long and short delay, respectively). (G) Pie charts showing the percentage of cells displaying a rebound spike or a delay-to-fire response during the day and at night (χ2=0.6552, p=0.4183). * indicates a spontaneous synaptic input. LTS: low threshold spike. IH: inward membrane rectification or depolarizing ‘sag’.
-
Figure 3—source data 1
Numerical data to support graphs in Figure 3D and G.
- https://cdn.elifesciences.org/articles/68179/elife-68179-fig3-data1-v1.xlsx
Figure 4 with 4 supplements
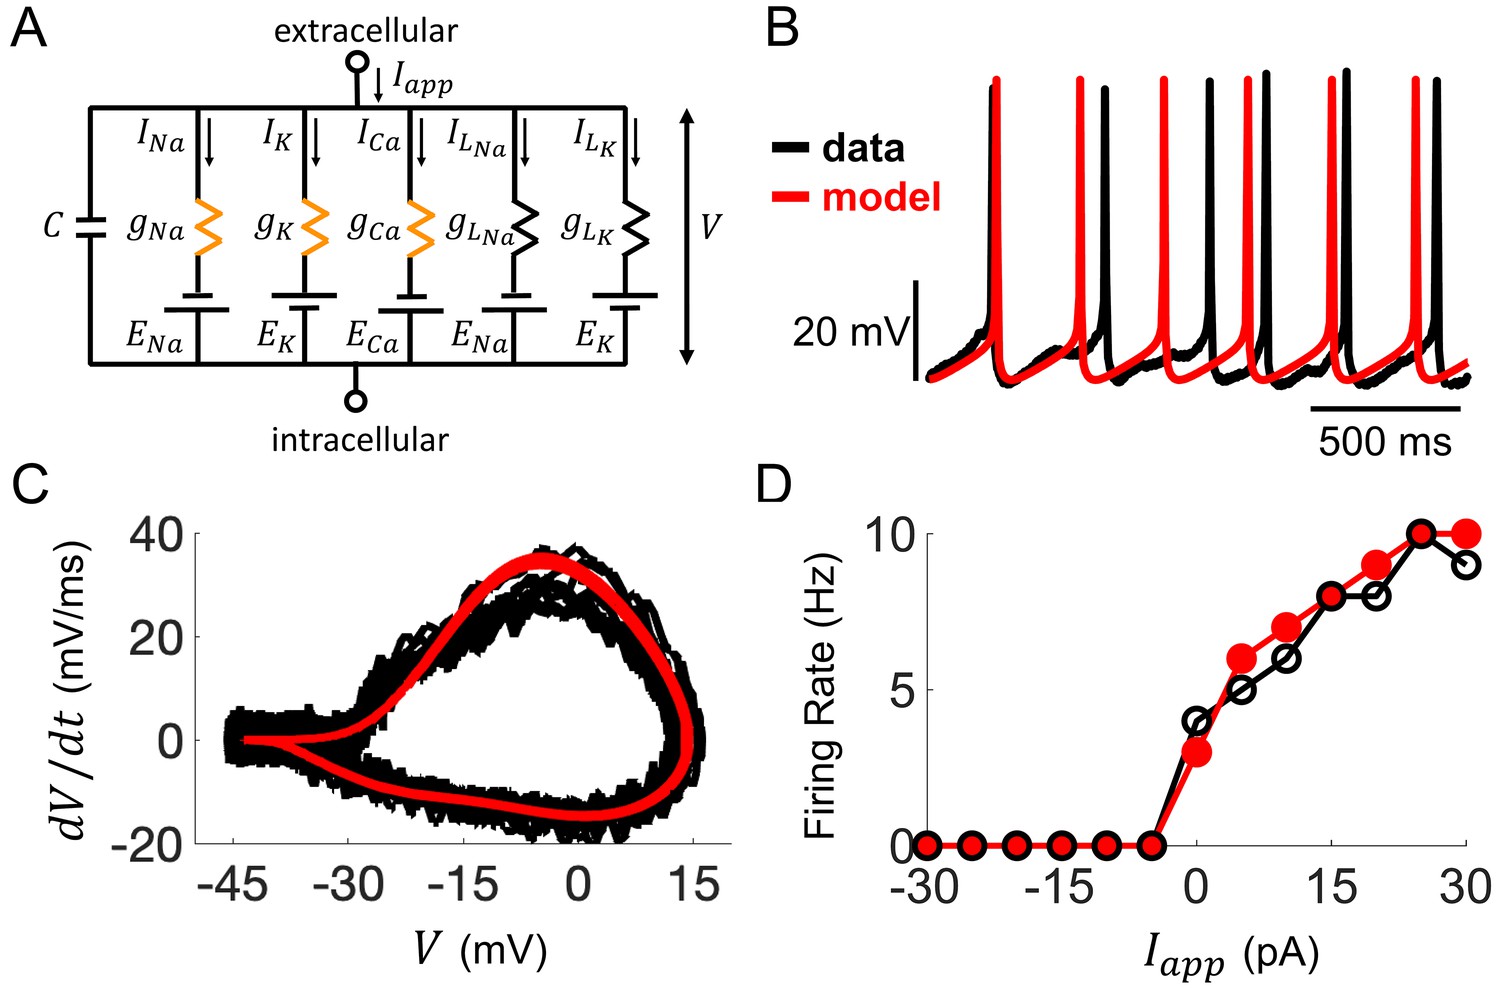
Computational modeling of Rhabdomys pumilio SCN neurons.
(A) Schematic of conductance-based model for R. pumilio SCN neurons containing sodium (INa), calcium (ICa), potassium (IK), and leak (ILNa, ILK) currents. Orange resistors (gNa, gCa, gK) indicate voltage-gated conductances, black resistors (gLK, gLNa) indicate passive leak conductances. (B) Voltage traces showing similarity in spontaneous firing of action potentials (APs) in the model (red) compared to a current-clamp recording from a R. pumilio SCN neuron (black). (C) Phase-plot of the derivative of voltage with respect to time (dV/dt) as a function of voltage (V) depicting the shape of APs in the model (red) and the current-clamp recording (black) during spontaneous firing. (D) Similarity in firing rate of the model (red) and current-clamp recordings (black) as a function of applied current (Iapp).
Figure 4—figure supplement 1
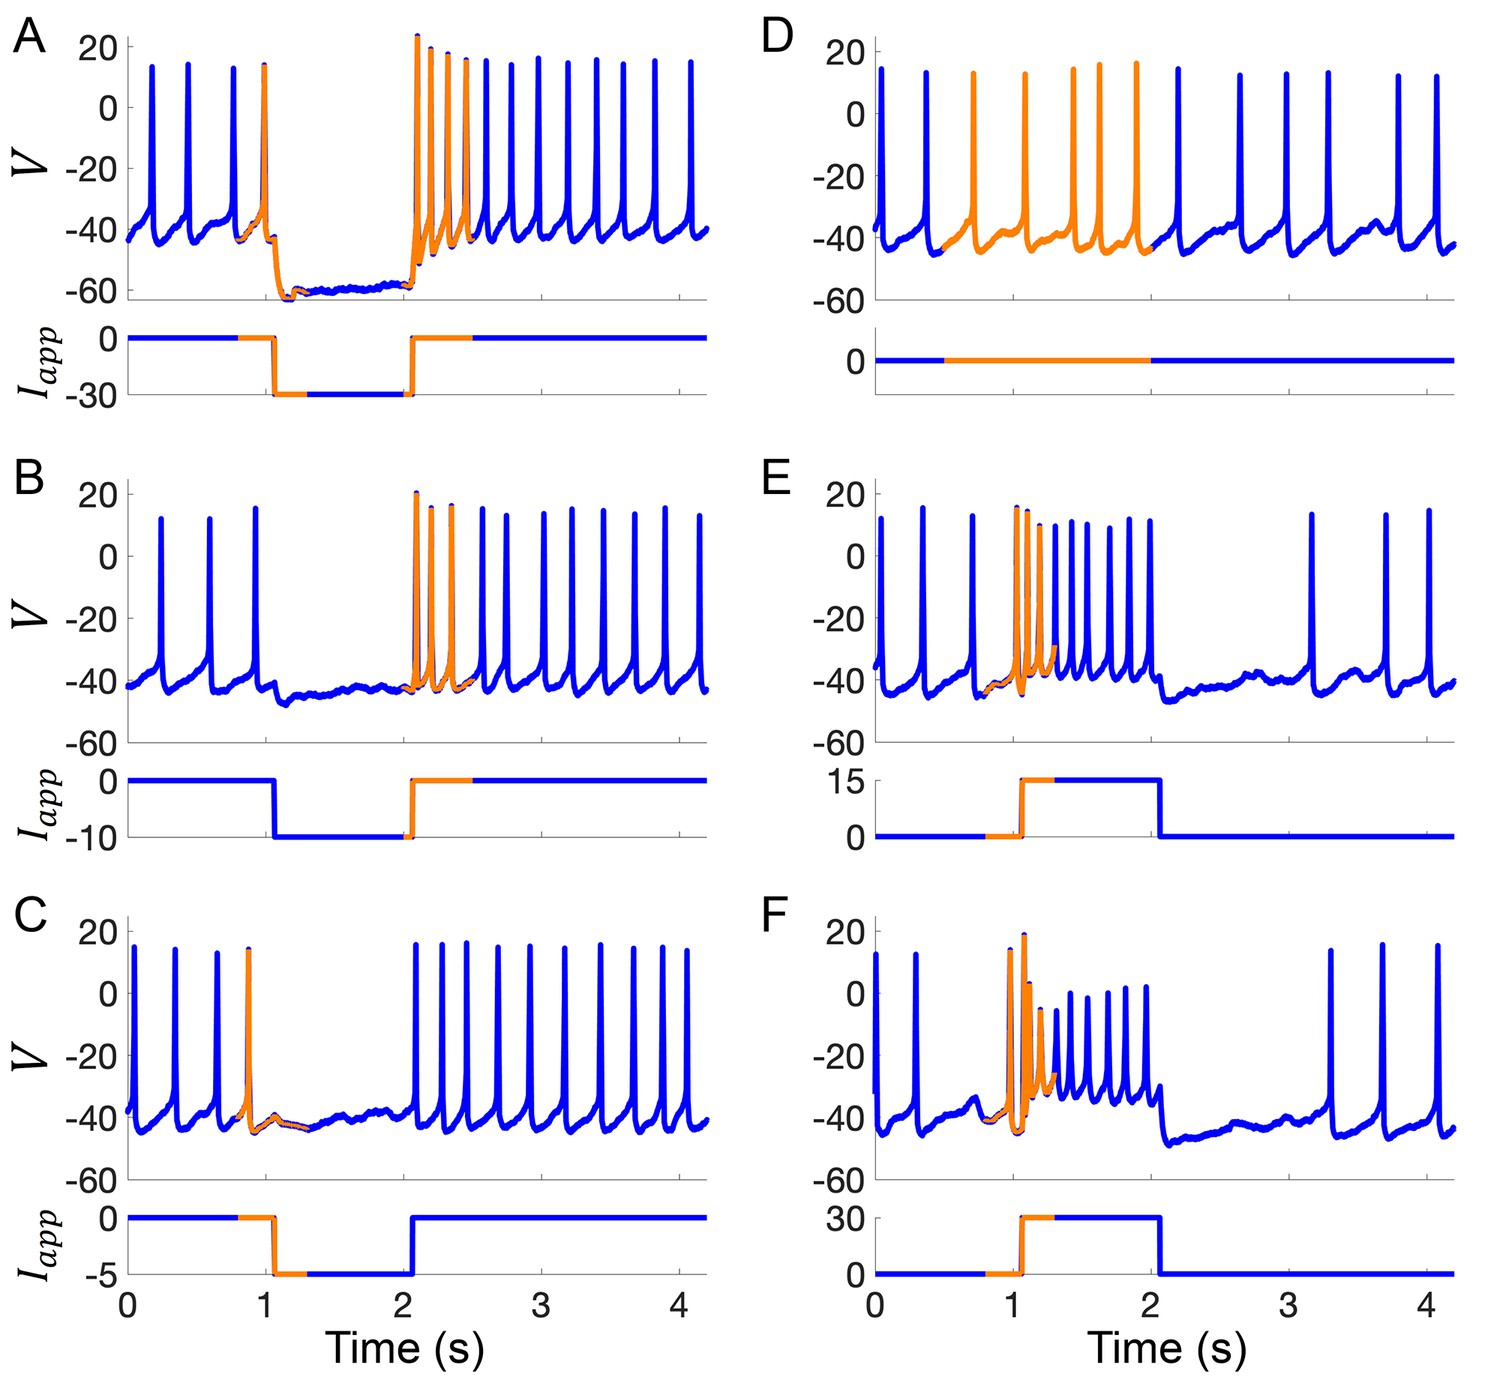
Example current-clamp traces used in data assimilation algorithm for building computational models of Rhabdomys pumilio SCN neurons.
(A–F) Current-clamp recordings (blue) with the portion of the voltage trace used by the data assimilation algorithm (orange) to fit the model shown in Figure 4 and Figure 4—figure supplement 2. (A–C) Hyperpolarizing current pulses. (D) Spontaneous activity. (E–F) Depolarizing current pulses.
Figure 4—figure supplement 2
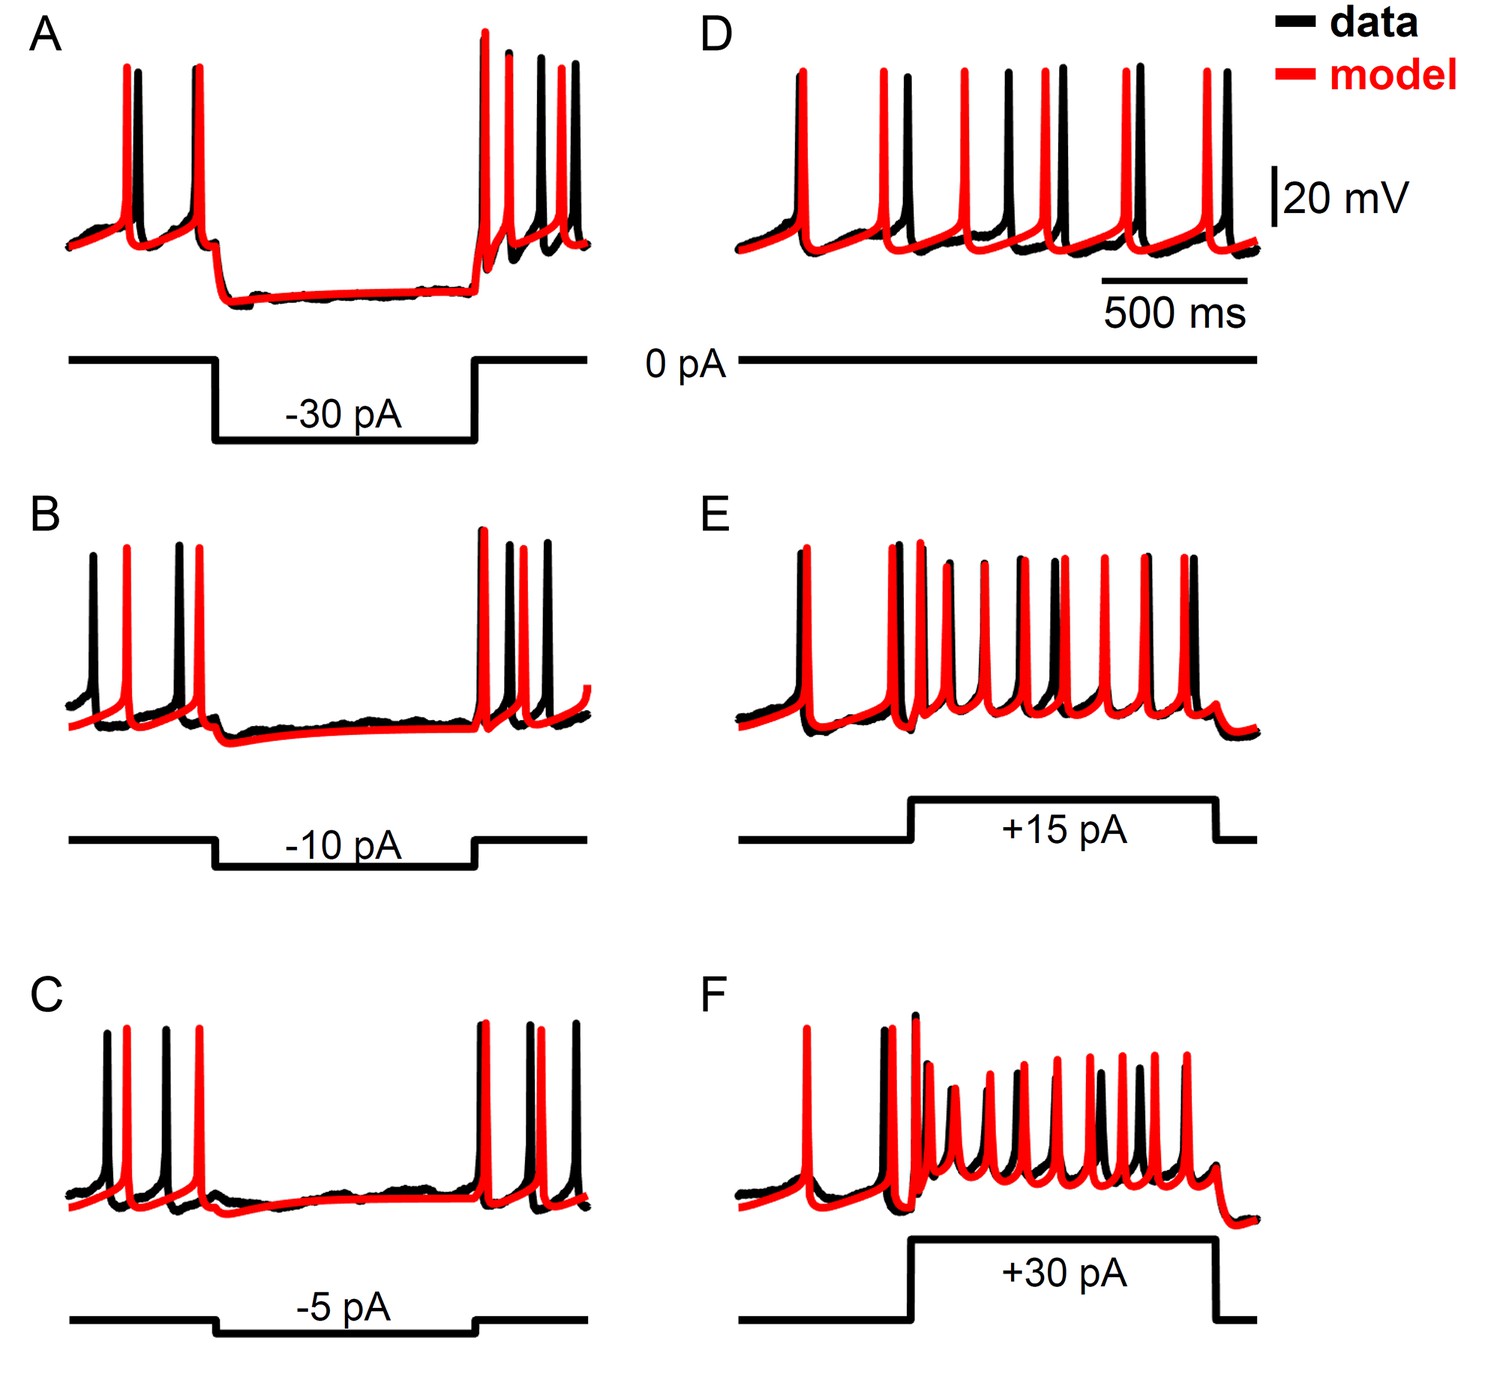
Example voltage traces for a computational model of Rhabdomys pumilio SCN neurons fit using a data assimilation algorithm.
(A–F) Current-clamp recordings (black) and simulated voltage traces (red) from the model shown in Figure 4 that was fit using the portions of the data shown in Figure 4—figure supplement 1. (A–C) Hyperpolarizing current pulses. (D) Spontaneous activity. (E–F) Depolarizing current pulses.
Figure 4—figure supplement 3
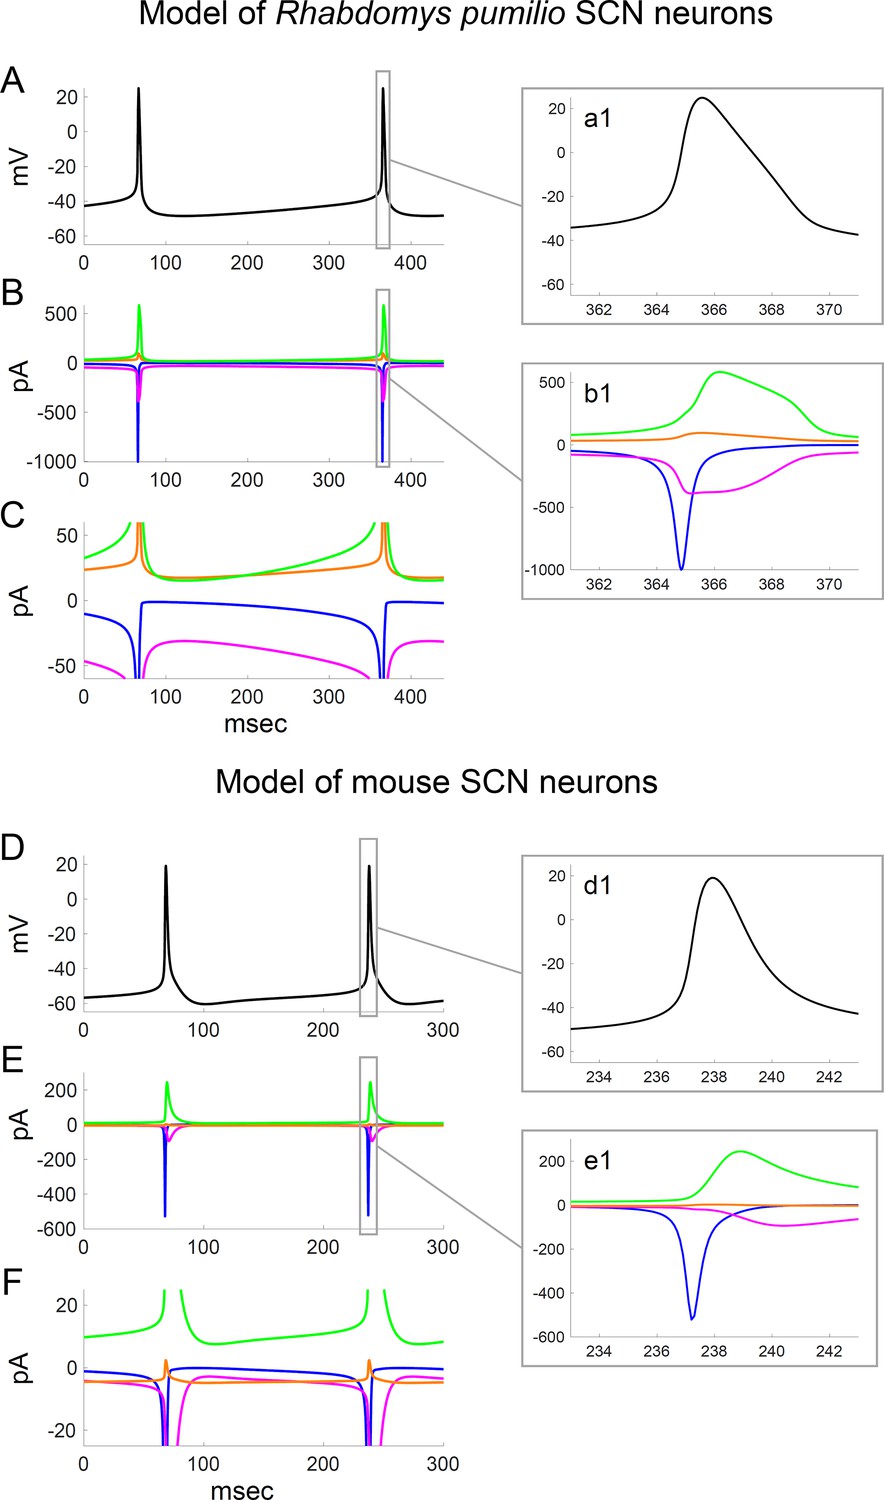
Ionic currents underlying action potential generation in computational models of Rhabdomys pumilio and mouse SCN neurons.
(A) Voltage trace showing spontaneous firing in model of R. pumilio SCN neurons. (a1) Magnified view of second AP shown in (A). (B) Sodium (INa, blue), calcium (ICa, magenta), potassium (IK, green), and leak (ILK + ILNa, orange) currents during the voltage trace shown in (A). (b1) Magnified view of currents during second AP shown in (A). (C) Same as (B), with y-axis scaled to emphasize the currents flowing during the interspike interval. (D) Voltage trace showing spontaneous firing in model of mouse SCN neurons. (d1) Magnified view of second AP shown in (D). (E) Sodium (INa, blue), calcium (ICa, magenta), potassium (IK, green), and leak (ILK + ILNa, orange) currents during the voltage trace shown in (D). (e1) Magnified view of currents during second AP shown in (D). (F) Same as (E), with y-axis scaled to emphasize the currents flowing during the interspike interval.
Figure 4—figure supplement 4
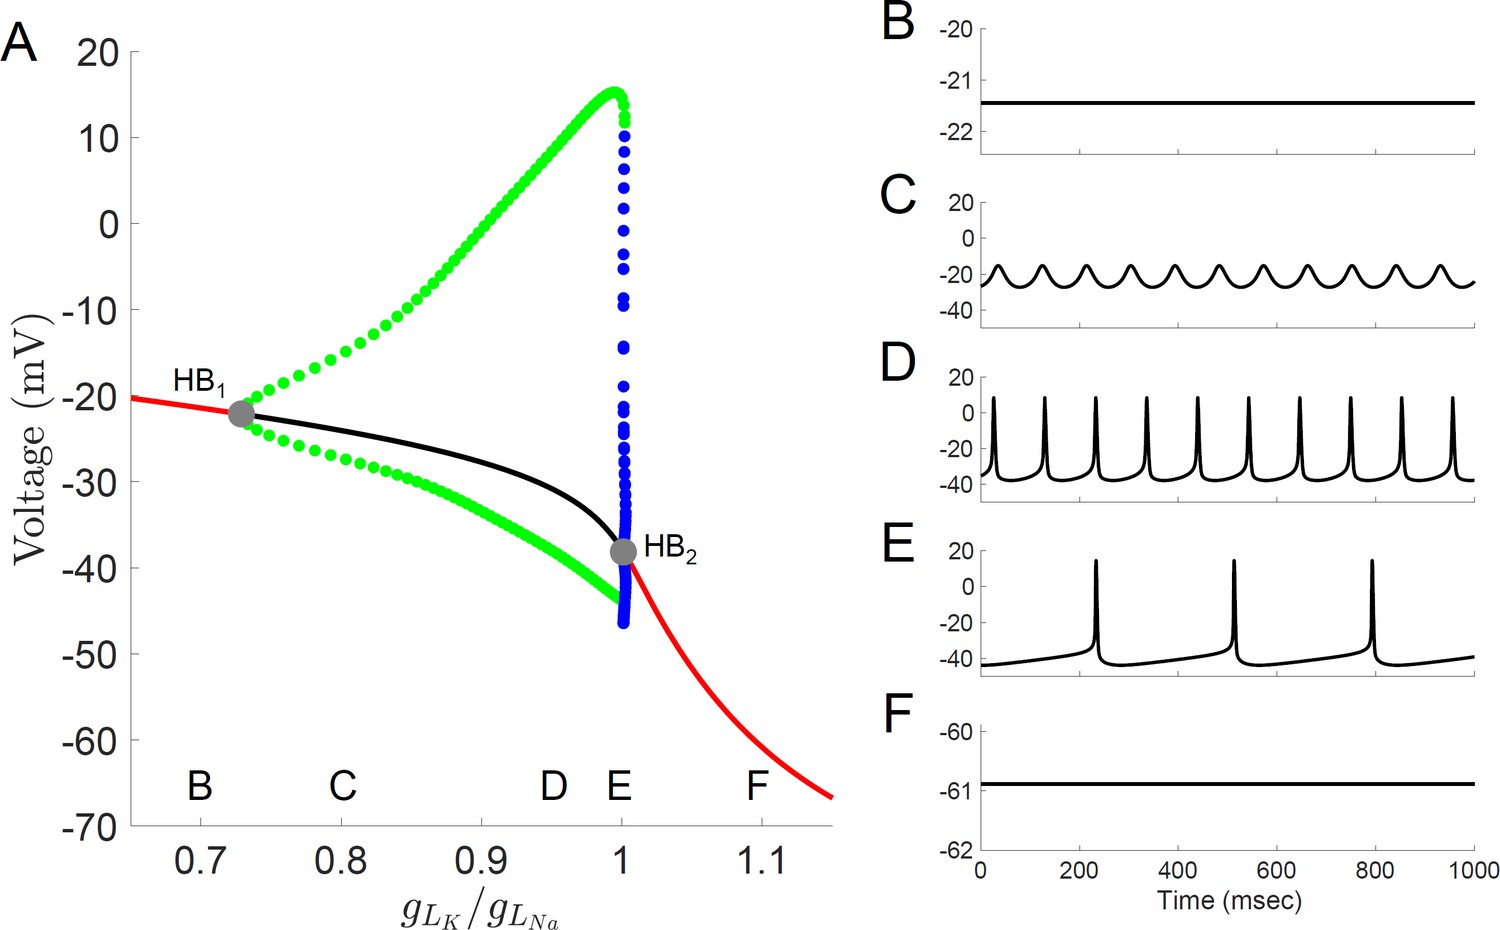
Bifurcation diagram for a computational model of Rhabdomys pumilio SCN neurons.
(A) Voltage at steady-states and maximum/minimum voltage of oscillations for the model of rebound spiking in the Type-A neuron shown in Figures 4 and 6A, and Figure 4—figure supplements 1–3 with ratio of potassium leak current (gLK) to sodium leak current (gLNa) as the bifurcation parameter showing stable steady-states (black), unstable steady-states (red), stable periodic orbits (blue), and unstable periodic orbits (green). Stable periodic orbits correspond to spiking or DLAMOs. Transition from depolarized rest state to DLAMOs occurs through a supercritical Hopf bifurcation (gray dot HB1) and transition from spiking to hyperpolarized rest state occurs through a subcritical Hopf bifurcation (gray dot HB2). Model voltage traces showing each of the spontaneous excitability states: (B) highly depolarized-silent; (C) depolarized low-amplitude membrane oscillations (DLAMOs); moderate resting membrane potential (RMP) firing action potentials (APs) at high (D) or low rate (E); and hyperpolarized-silent neurons (F). According to the ‘bicycle model’ proposed for the circadian regulation of electrical activity in mice and flies, a gLK/gLNa ratio scaling factor less than one corresponds to a daytime ‘up-state’, and a scaling factor greater than one to a night-time ‘down-state’ (Flourakis et al., 2015). Simulating this variation in leak currents indeed transited the spontaneous RMP and firing rate of the R.pumilio model cells from the daytime depolarized state to night-time suppressed state.
Figure 5
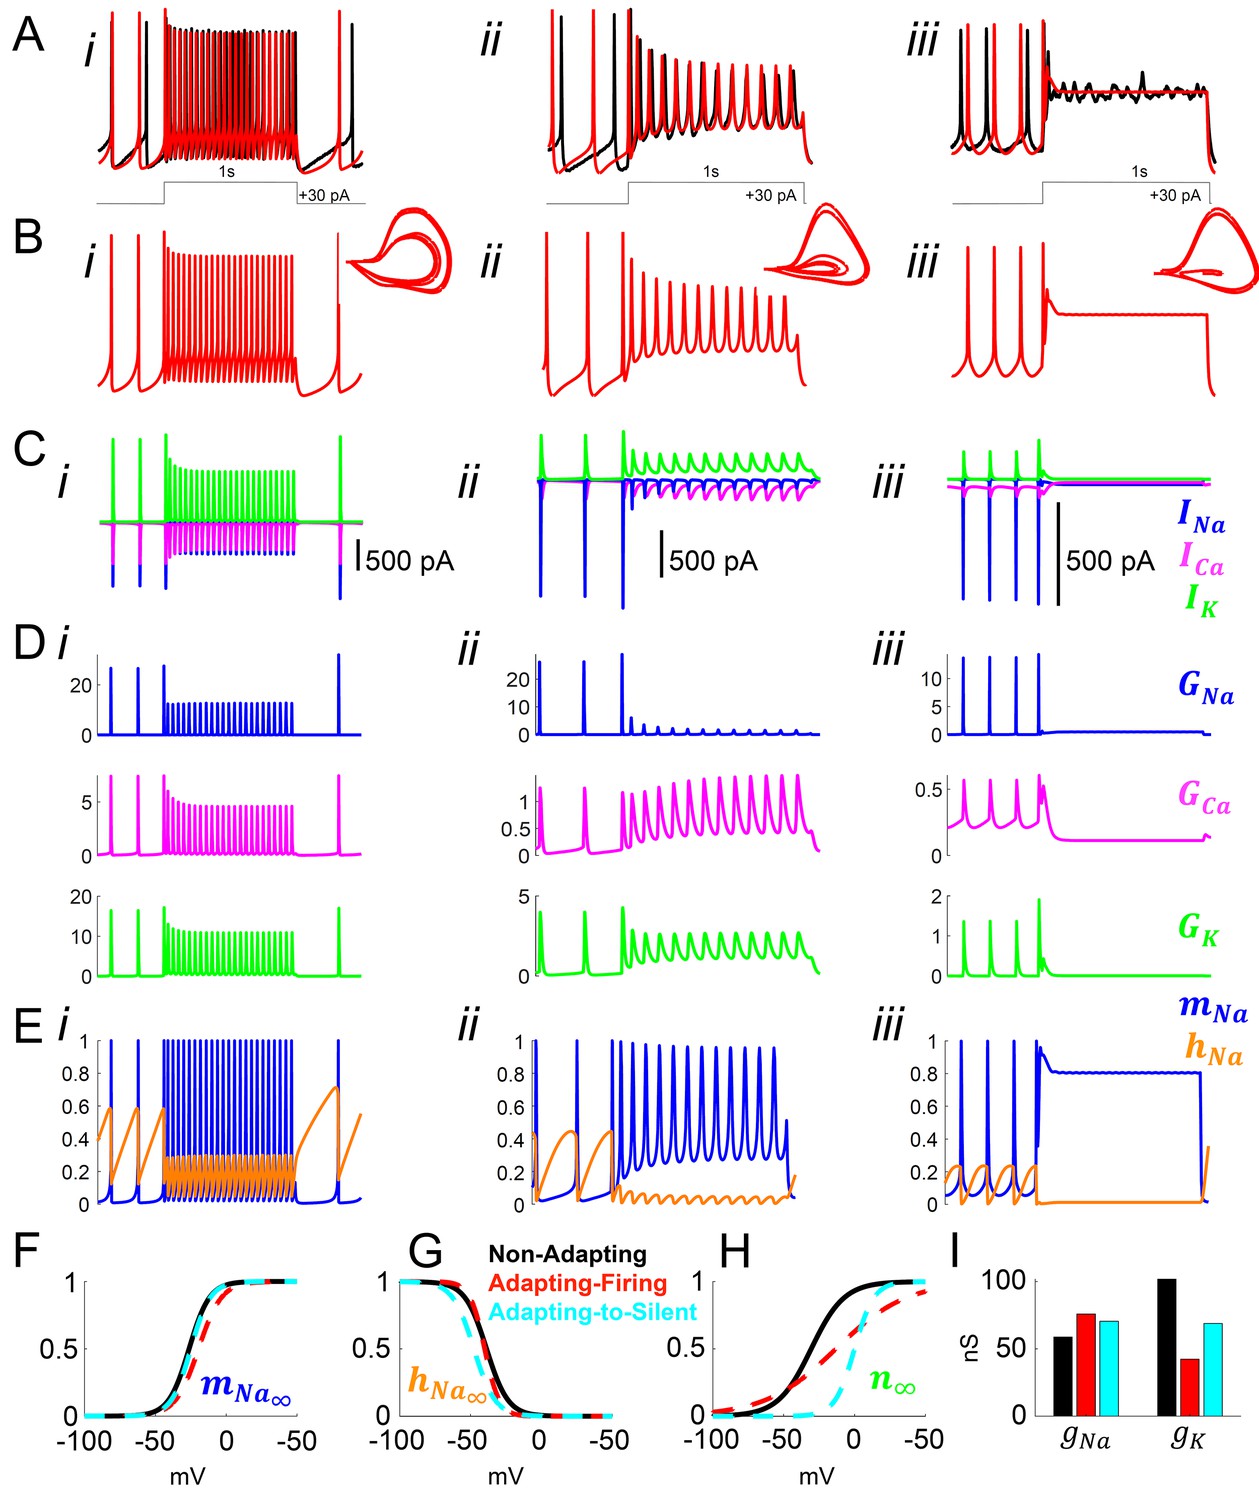
Model simulation of the responses to depolarizing pulses in Rhabdomys pumilio SCN neurons and the underlying ionic mechanisms.
(A–B) Voltage traces of models (red) and current-clamp recordings (black) during depolarizing pulses (1 s, +30 pA) showing non-adapting (i), adapting-firing (ii), and adapting-to-silent (iii) responses. (C) Ionic currents sodium (INa, blue), calcium (ICa, magenta), and potassium (IK, green) in the models during the non-adapting (i), adapting-firing (ii), and adapting-silent (iii) responses. (D) Ionic conductances for sodium (GNa, blue), calcium (GCa, magenta), and potassium (GK, green) in the models during the non-adapting (i), adapting-firing (ii), and adapting-silent (iii) responses. (E) Sodium activation (mNa, blue) and inactivation (hNa, orange) gating variables in the models during the non-adapting (i), adapting-firing (ii), and adapting-silent (iii) responses. Ions cannot pass through the channel if it is closed (mNa = 0) or inactivated (hNa = 0); maximal current flows when the channel is fully open (mNa = 1) and fully de-inactivated (hNa = 1). Steady-state gating variables as a function of voltage in the non-adapting (black), adapting-firing (red), and adapting-to-silent (cyan) models for (F) sodium activation (mNa∞), (G) sodium inactivation (hNa∞), and (H) potassium activation (n∞). The flattening of the n∞ curve in the adapting-firing model indicates that the channel is less activated at depolarized voltages than the non-adapting model (e.g. at −13 mV, the adapting-firing model is only half activated (n∞ = 0.5), whereas the non-adapting model is almost fully activated (n∞ = 0.93)). (I) Maximal conductance parameters gNa and gK in the non-adapting (black), adapting-firing (red), and adapting-to-silent (cyan) models. Notice that the maximal potassium conductance parameter is much smaller in the adapting-firing model (gK = 43 nS) than in the non-adapting model (gK = 102 nS).
Figure 6
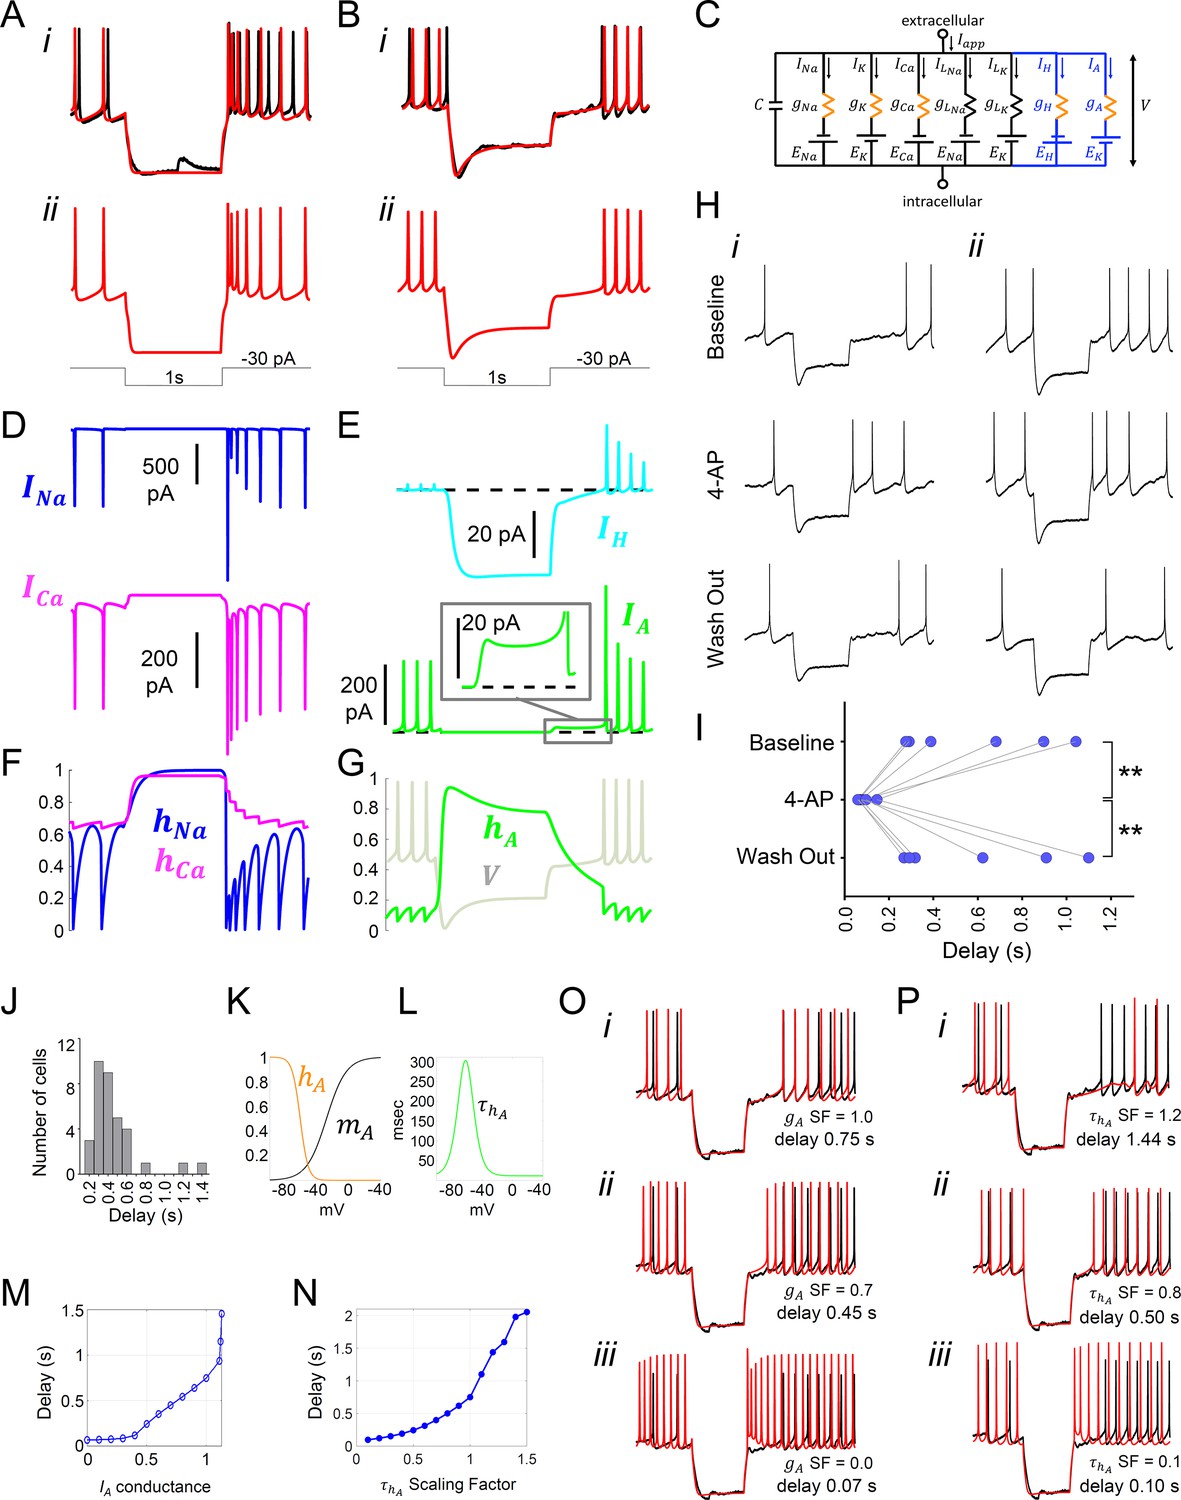
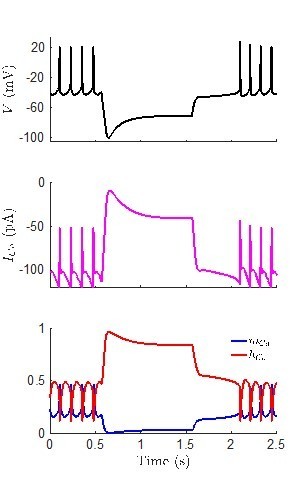
Model simulation of the responses to hyperpolarizing pulses in Rhabdomys pumilio SCN neurons and the underlying ionic mechanisms.
(A–B) Voltage traces of models (red) and current-clamp recordings (black) during hyperpolarizing pulses (1s, -30 pA) showing rebound spiking of Type-A neurons (A) and delay responses of Type-B cells (B). (C) Schematic of conductance-based model for Type-B R. pumilio SCN neurons showing the addition of transient potassium (IA) and hyperpolarization-activated (IH) currents (blue). (D) Ionic currents for sodium (INa, blue) and calcium (ICa, magenta) in the model during the Type-A neuronal rebound spiking response. (E) Ionic currents IH (cyan) and IA (green) in the model during the delay response of Type-B neurons. (F) Sodium (hNa, blue) and calcium (hCa, magenta) inactivation gating variables in the model during the Type-A neuronal rebound spiking response. (G) Transient potassium (IA) inactivation gating variable (hA, green) in the model during the delay response in Type-B neurons (voltage trace, V, is indicated in gray and is the same V-trace shown in B). (H) Representative current-clamp recordings of R.pumilio Type-B neurons during hyperpolarizing pulses (1s, -30 pA) showing a long (i) and short (ii) delay-to-fire latency under baseline conditions (top trace). Bath application of 5mM 4-Aminopyridine (4-AP, A-type channel blocker) eliminated the rebound hyperpolarization and prominent delay-to-fire, so neurons exhibited a rebound spike upon termination of the pulse (mid traces). Delay-to-fire behavior returned after blocker washout (bottom traces). (I) Summary plot of the latencies to fire upon termination of the pulse in Type-B cells (n=6, 2 animals) under baseline conditions, in the presence of 4-AP, and during washout. **p<0.01, One-way repeated measures ANOVA followed by Tukey’s post hoc test. (J) Histogram showing delay-to-fire latencies measured in Type-B cells. (K–L) Gating variable functions for model IA current: (K) steady-state activation (mA, black), steady-state inactivation (hA, orange), and (L) inactivation time constant (, green). (M) Relationship between IA conductance (gA Scaling Factor) and delay-to-fire latencies in model of Type-B cells. (N) Relationship between the time constant of IA inactivation and delay-to-fire latencies in model of Type-B cells. (O) Data trace for a cell with a 0.75 s delay (black) overlaid with model voltage traces (red) with varied amounts of IA conductance: (i) model of Type-B cell with gA SF = 1 exhibiting a 0.75 s delay; (ii) Model from (i) with reduced IA conductance (gA SF = 0.7) exhibiting a reduced delay-to-fire latency; (iii) Model from (i) with no IA current (gA SF = 0), exhibiting rebound spiking, as in Type-A neurons. gA SF: gA Scaling Factor. (P) Model simulations for IA inactivation time constant scaling factors of 1.2 (i), 0.8 (ii) and 0.1 (iii). SF: Scaling Factor.
-
Figure 6—source data 1
Numerical data to support graphs in Figure 6I.
- https://cdn.elifesciences.org/articles/68179/elife-68179-fig6-data1-v1.xlsx
Figure 7 with 1 supplement
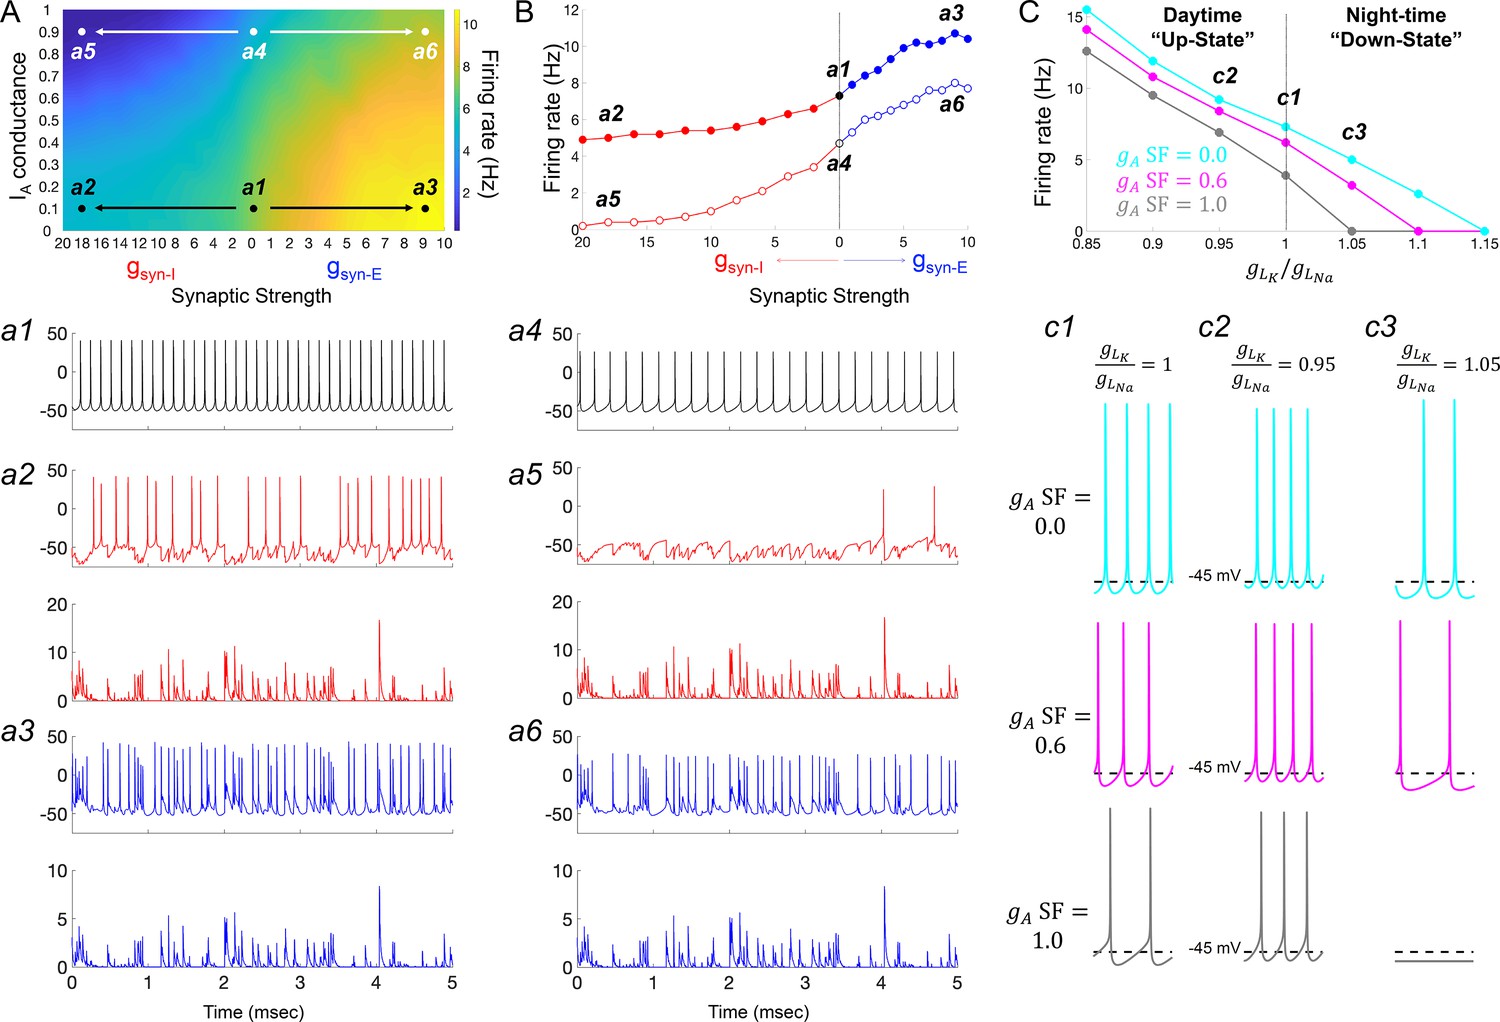
IA conductances act to amplify extrinsic and intrinsic suppressive signals in the Rhabdomys pumilio SCN.
(A) Heatmap showing the overall effects of inhibitory (gsyn-I, red) and excitatory (gsyn-E, blue) physiological GABAergic synaptic conductances on firing frequency with increasing IA conductances in the model R. pumilio SCN neurons. (a1–a3) Examples of firing activity in model cell with low IA conductance (gA SF = 0.1) and absence of GABAergic synaptic conductance (a1, gsyn-I = gsyn-E = 0 nS), high suppressive GABAergic synaptic conductance (a2, gsyn-I = 18 nS), or high excitatory GABAergic synaptic conductance (a3, gsyn-E = 9). (a4–a6) Examples of firing activity in model R. pumilio SCN neurons with high IA conductance (gA SF = 0.9) and absence of GABAergic synaptic conductance (a4, gsyn-I = 0 nS), high suppressive GABAergic synaptic conductance (a5, gsyn-I = 18 nS), or high excitatory GABAergic synaptic conductance (a6, gsyn-E = 9). (B) Firing rate as a function of inhibitory (gsyn-I, red) and excitatory (gsyn-E, blue) GABAergic synaptic conductances of different strength. Open and filled dots correspond to model cell with high (0.9) or low (0.1) IA conductance (gA SF), respectively. (C) Overall effect of intrinsic excitability states (scaling factor for the ratio of potassium leak current (gLK) to sodium leak current (gLNa) from 0.85 to 1.15) on firing frequency with increasing IA conductances in the model cell (gA SF = 0 [cyan], 0.6 [pink] and 1.0 [gray]). gLK/gLNa SF less than one corresponds to a daytime ‘up-state’, and a SF greater than one to a night-time ‘down-state’. (c1) Effect of IA (gA = 0, 0.6 and 1.0) on firing rate with nominal potassium/sodium leak current ratio (gLK/gLNa SF = 1). (c2) Effect of IA (gA SF = 0, 0.6 and 1.0) on firing rate with reduced potassium/sodium leak current ratio (gLK/gLNa SF = 0.95), representing daytime up-state. (c3) Effect of IA (gA SF = 0, 0.6 and 1.0) on firing rate with elevated potassium/sodium leak current ratio (gLK/gLNa SF = 1.05), representing night-time down-state. Notice that IA amplifies the suppressive action of the low intrinsic excitability state (during down-state). SF: scaling factor.
Figure 7—figure supplement 1
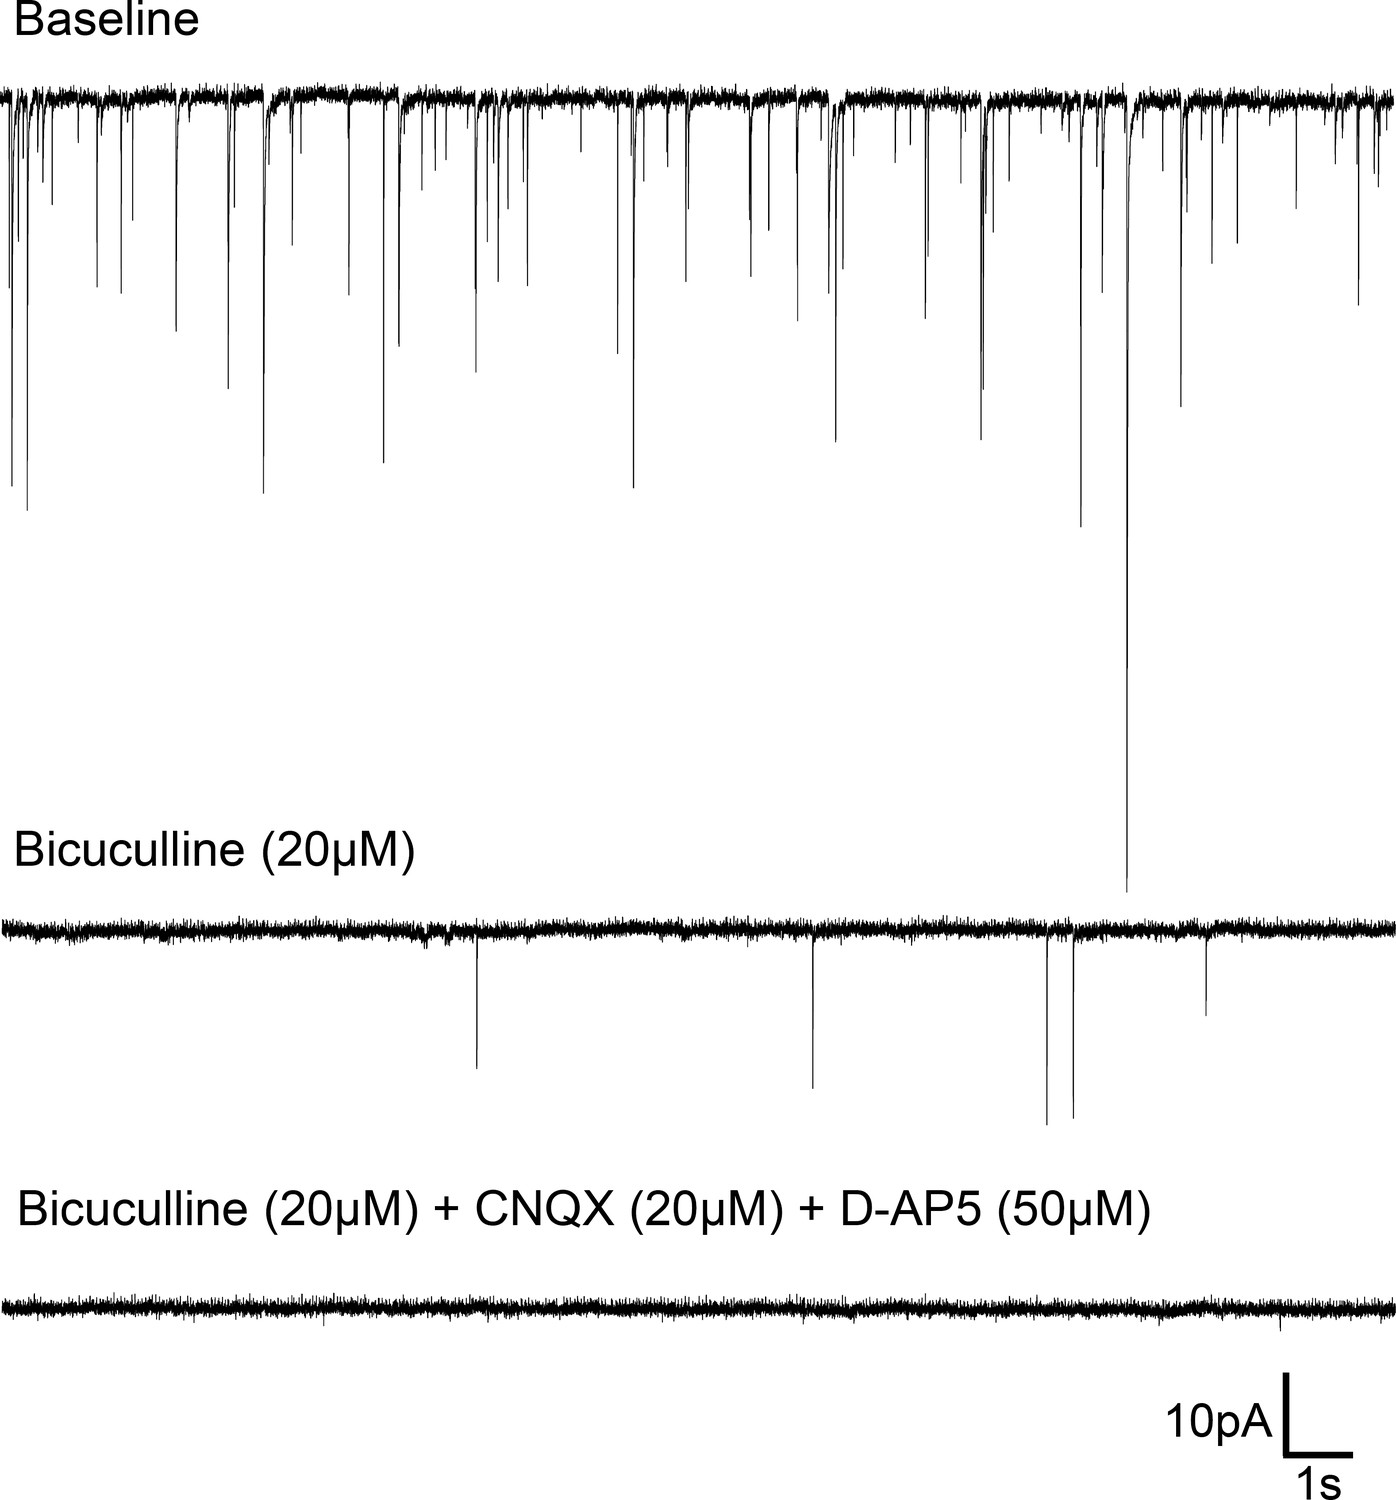
Spontaneous synaptic events in Rhabdomys pumilio SCN neurons.
Representative trace from a SCN neuron (voltage-clamped at −70 mV) showing post-synaptic currents (PSCs) under baseline conditions (top). Bath application of the GABAA receptor blocker, Bicuculline (20 μM), abolished most synaptic events (middle trace); all PSCs were blocked under the presence of Bicuculline (20 μM) and specific glutamatergic receptor antagonists, CNQX (20 μM) and D-AP5 (50 μM) (bottom trace).
Author response image 1
Additional files
-
Supplementary file 1
Parameter values for the computational models of Rhabdomys pumilio SCN neurons.
Models were fit to data from seven different neurons, including a non-adapting cell (Figure 5Ai), an adapting-firing cell (Figure 5Aii), an adapting-silent cell (Figure 5Aiii), two Type-A rebound spiking cells (Figures 4 and 6A), and two Type-B delay cells (Figure 6B and O). These cells were chosen for modeling because they are representative of the various responses observed across all the recordings. Each model was fit to data from six voltages traces as illustrated in Figure 4—figure supplement 1.
- https://cdn.elifesciences.org/articles/68179/elife-68179-supp1-v1.docx
-
Transparent reporting form
- https://cdn.elifesciences.org/articles/68179/elife-68179-transrepform-v1.pdf
Download links
A two-part list of links to download the article, or parts of the article, in various formats.
Downloads (link to download the article as PDF)
Open citations (links to open the citations from this article in various online reference manager services)
Cite this article (links to download the citations from this article in formats compatible with various reference manager tools)
Daily electrical activity in the master circadian clock of a diurnal mammal
eLife 10:e68179.
https://doi.org/10.7554/eLife.68179


