Heterogeneous levels of delta-like 4 within a multinucleated niche cell maintains muscle stem cell diversity
- The Eli and Edythe Broad Center for Regenerative Medicine and Stem Cell Research, Department of Orthopedic Surgery, University of California San Francisco, United States
- Department of Biomedical Sciences, University of North Dakota School of Medicine and Health Sciences, United States
- Departments of Surgery and Orofacial Sciences, Program in Craniofacial Biology, University of California San Francisco, United States
Figures
Figure 1 with 1 supplement

Adult quiescent muscle stem cells (QSCs) exist in diverse cell states.
(A) Representative images of a high and low Pax7+ stem cell (SC) on a freshly isolated muscle fiber that has corresponding high and low levels of Ddx6 protein. (B) A density map of Pax7 intensity in QSCs (n = 3). (C) A density map of Ddx6 intensity in QSCs (n = 3). (D) A bivariate plot between Pax7 and Ddx6 intensity in QSCs (n = 2). (E) A bivariate plot between Pax7 and Notch reporter intensity in QSCs (n = 3). (F) Image of SC with high Pax7 expression that expresses high Notch activity and an SC with low Pax7 intensity displaying low Notch activity. Scale bars, 5 μm in (A) and (F).
-
Figure 1—source data 1
Adult QSCs exist in diverse cell states.
- https://cdn.elifesciences.org/articles/68180/elife-68180-fig1-data1-v1.xlsx
-
Figure 1—source data 2
Adult QSCs exist in diverse cell states.
- https://cdn.elifesciences.org/articles/68180/elife-68180-fig1-data2-v1.xlsx
-
Figure 1—source data 3
Adult QSCs exist in diverse cell states.
- https://cdn.elifesciences.org/articles/68180/elife-68180-fig1-data3-v1.xlsx
-
Figure 1—source data 4
Adult QSCs exist in diverse cell states.
- https://cdn.elifesciences.org/articles/68180/elife-68180-fig1-data4-v1.xlsx
-
Figure 1—source data 5
Adult QSCs exist in diverse cell states.
- https://cdn.elifesciences.org/articles/68180/elife-68180-fig1-data5-v1.xlsx
-
Figure 1—source data 6
Adult QSCs exist in diverse cell states.
- https://cdn.elifesciences.org/articles/68180/elife-68180-fig1-data6-v1.xlsx
-
Figure 1—source data 7
Adult QSCs exist in diverse cell states.
- https://cdn.elifesciences.org/articles/68180/elife-68180-fig1-data7-v1.xlsx
Figure 1—figure supplement 1
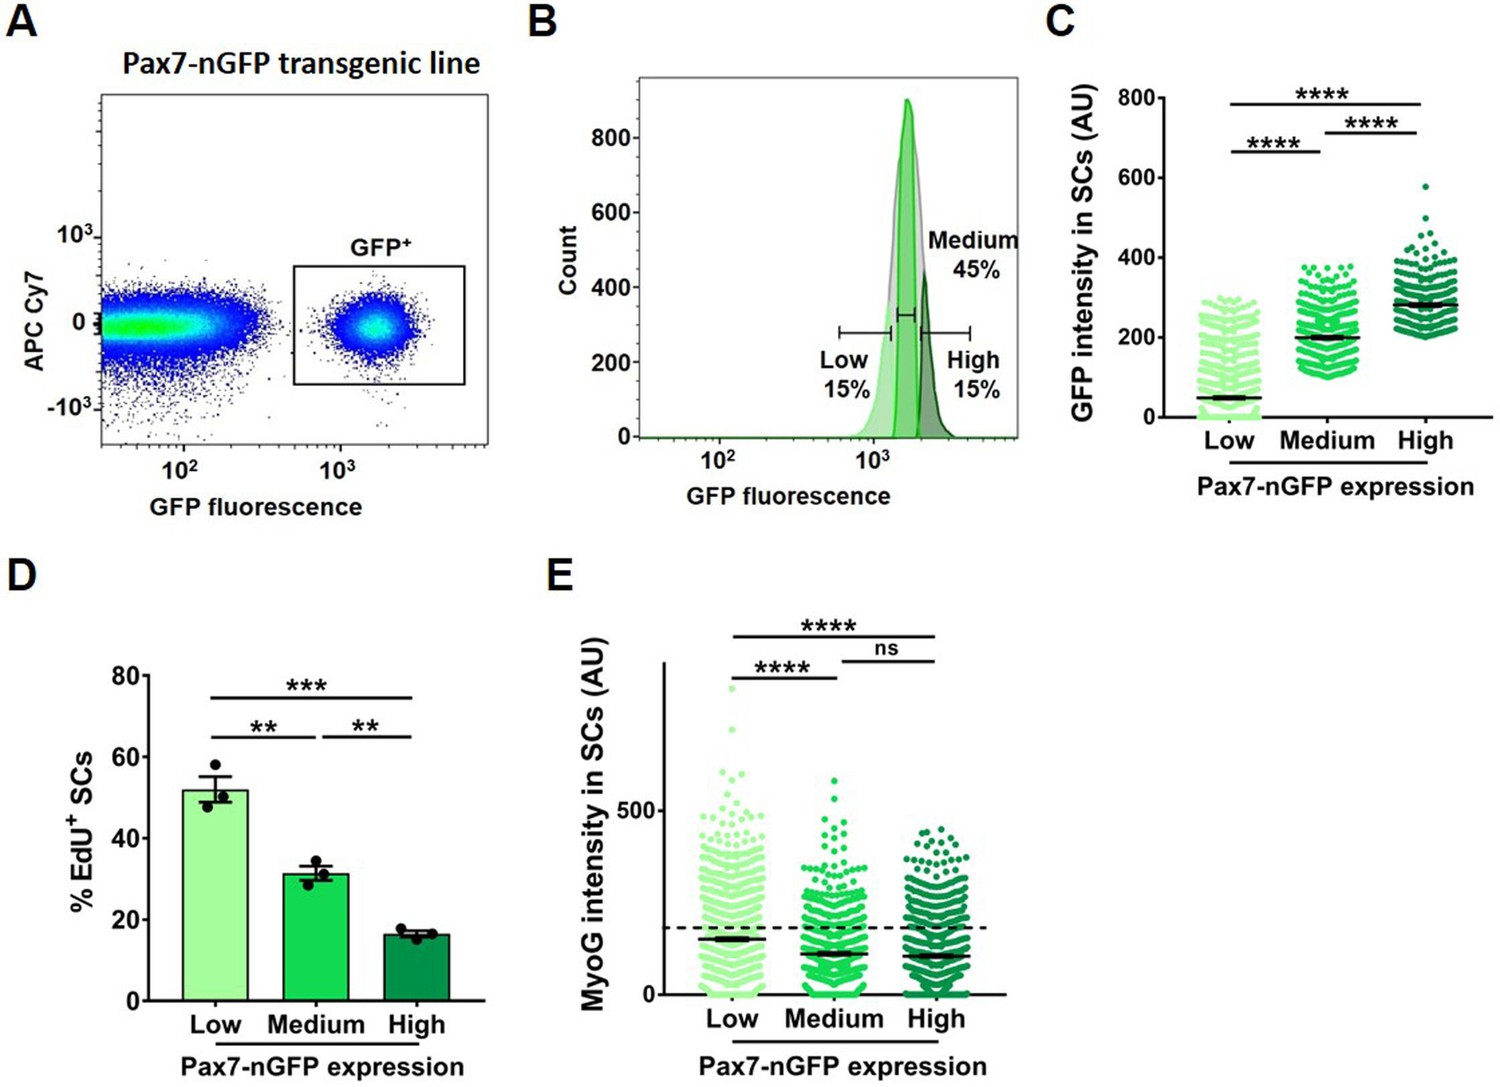
Adult quiescent muscle stem cells (QSCs) exist in a continuum of cell states that give rise to a continuum of fates when activated.
(A, B) Fluorescence-assisted cell sorting (FACS) strategy of obtaining GFP+ stem cells (SCs) from a Pax7-nGFP transgenic reporter line (in A) and isolation of green fluorescent protein (GFP) low, medium, and high expressing SCs (in B). (C–E) The three sorted populations were fixed immediately and stained for GFP (in C), cultured in vitro in growth media containing EdU for 60 hr and percentage of EdU-positive SCs were quantified (in D), cultured in vitro in low serum for 3 days and stained for Myogenin protein (in E) (n = 3). Error bars, mean ± standard error of the mean (SEM); ns, non significant, **p < 0.01, ***p < 0.001, ****p < 0.0001.
Figure 2 with 2 supplements
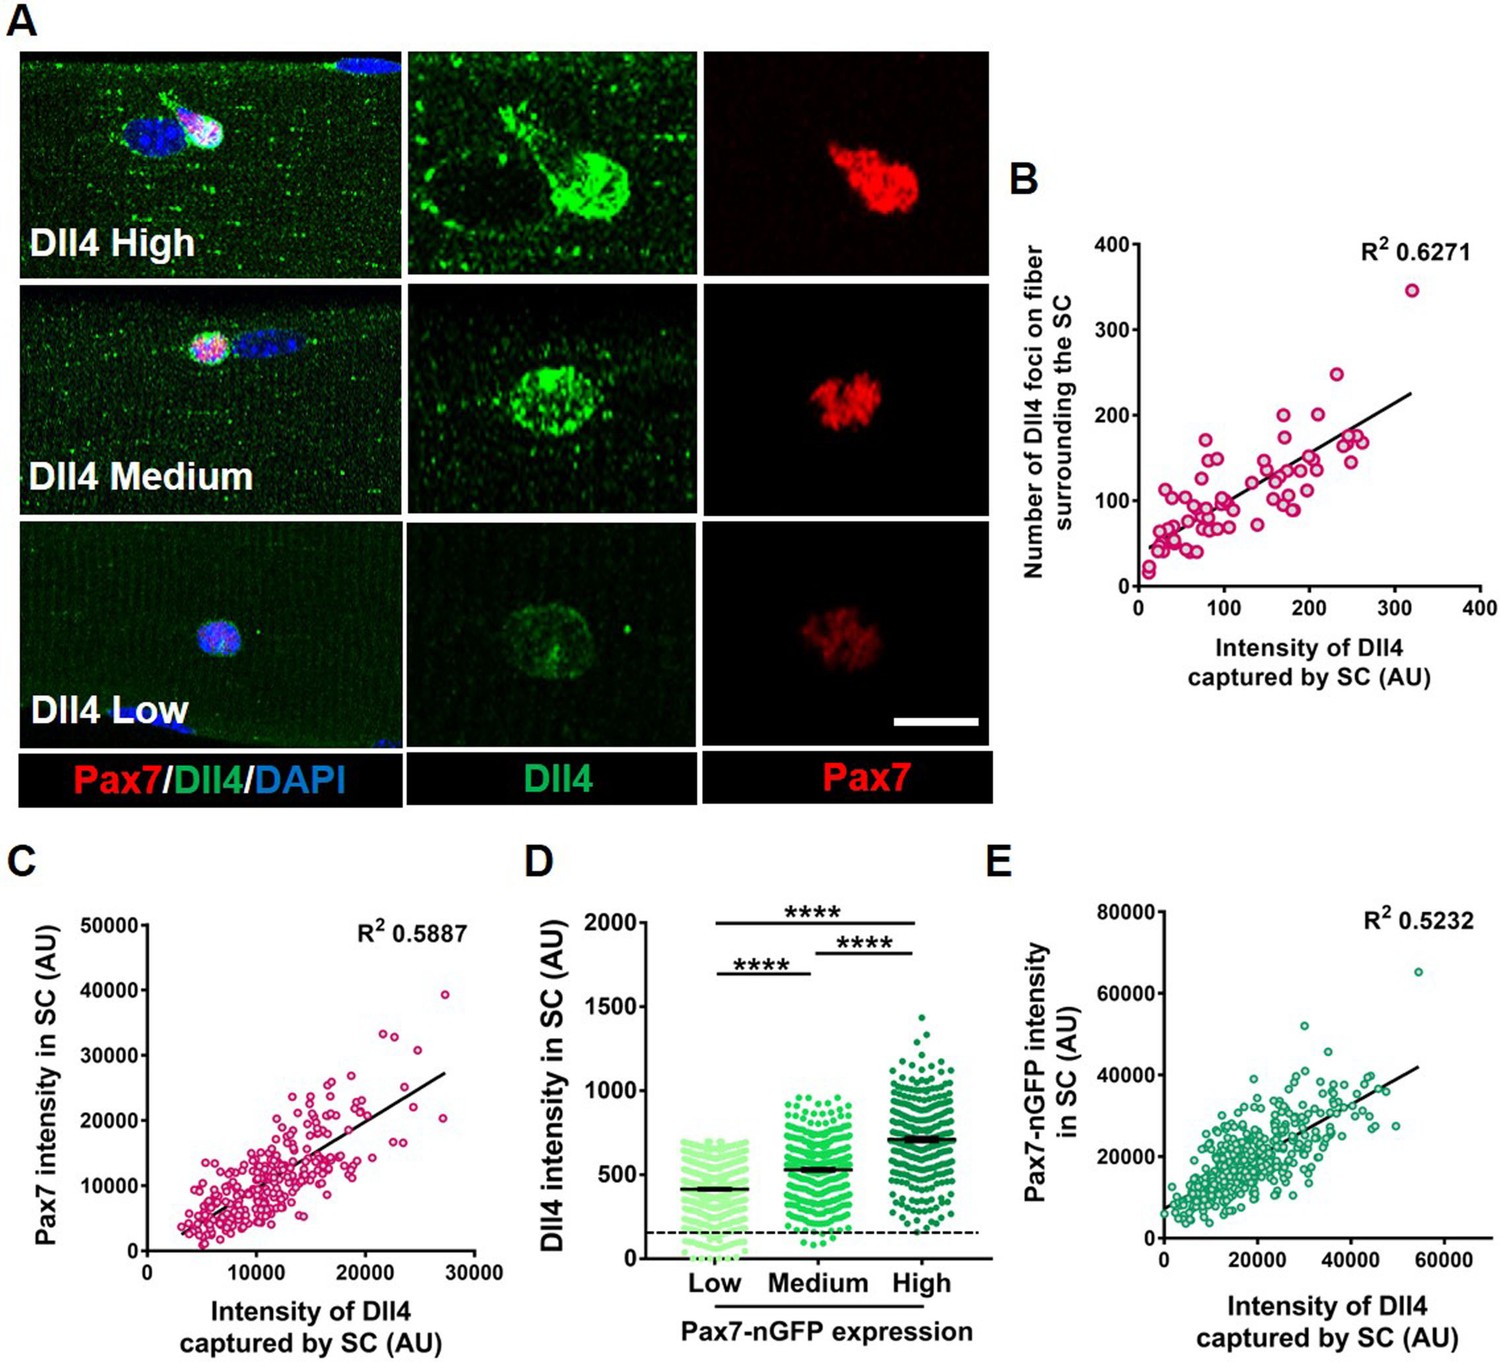
Heterogeneous expression of Dll4 on the muscle fiber correlates with stem cell (SC) diversity.
(A) Representative images of regions of muscle fiber expressing heterogeneous levels of Dll4 protein, which corresponds to the amount of Dll4 captured by the adjacent SC and the expression of Pax7. (B) A bivariate plot between the number of Dll4 foci on fiber adjacent to an SC and the intensity of Dll4 captured by the SC (n > 3 mice). (C) An XY plot on isolated wildtype quiescent muscle stem cells (QSCs) shows positive correlation between intensity of Dll4 captured by SC and its Pax7 intensity (n = 3 mice). (D) Freshly isolated green fluorescent protein (GFP) low, medium, and high expressing SCs from transgenic Pax7-nGFP reporter mice were stained for Dll4 (n = 3). (E) An XY plot shows positive correlation between intensity of Dll4 captured by SC and its GFP (Pax7) intensity (n = 3 mice). Error bars, mean ± standard error of the mean (SEM); ****p < 0.0001. Scale bars, 10 μm in (A).
-
Figure 2—source data 1
Heterogeneous expression of Dll4 on the muscle fiber correlates with SC diversity.
- https://cdn.elifesciences.org/articles/68180/elife-68180-fig2-data1-v1.xlsx
-
Figure 2—source data 2
Heterogeneous expression of Dll4 on the muscle fiber correlates with SC diversity.
- https://cdn.elifesciences.org/articles/68180/elife-68180-fig2-data2-v1.xlsx
-
Figure 2—source data 3
Heterogeneous expression of Dll4 on the muscle fiber correlates with SC diversity.
- https://cdn.elifesciences.org/articles/68180/elife-68180-fig2-data3-v1.xlsx
-
Figure 2—source data 4
Heterogeneous expression of Dll4 on the muscle fiber correlates with SC diversity.
- https://cdn.elifesciences.org/articles/68180/elife-68180-fig2-data4-v1.xlsx
-
Figure 2—source data 5
Heterogeneous expression of Dll4 on the muscle fiber correlates with SC diversity.
- https://cdn.elifesciences.org/articles/68180/elife-68180-fig2-data5-v1.xlsx
-
Figure 2—source data 6
Heterogeneous expression of Dll4 on the muscle fiber correlates with SC diversity.
- https://cdn.elifesciences.org/articles/68180/elife-68180-fig2-data6-v1.xlsx
-
Figure 2—source data 7
Heterogeneous expression of Dll4 on the muscle fiber correlates with SC diversity.
- https://cdn.elifesciences.org/articles/68180/elife-68180-fig2-data7-v1.xlsx
-
Figure 2—source data 8
Heterogeneous expression of Dll4 on the muscle fiber correlates with SC diversity.
- https://cdn.elifesciences.org/articles/68180/elife-68180-fig2-data8-v1.xlsx
Figure 2—figure supplement 1
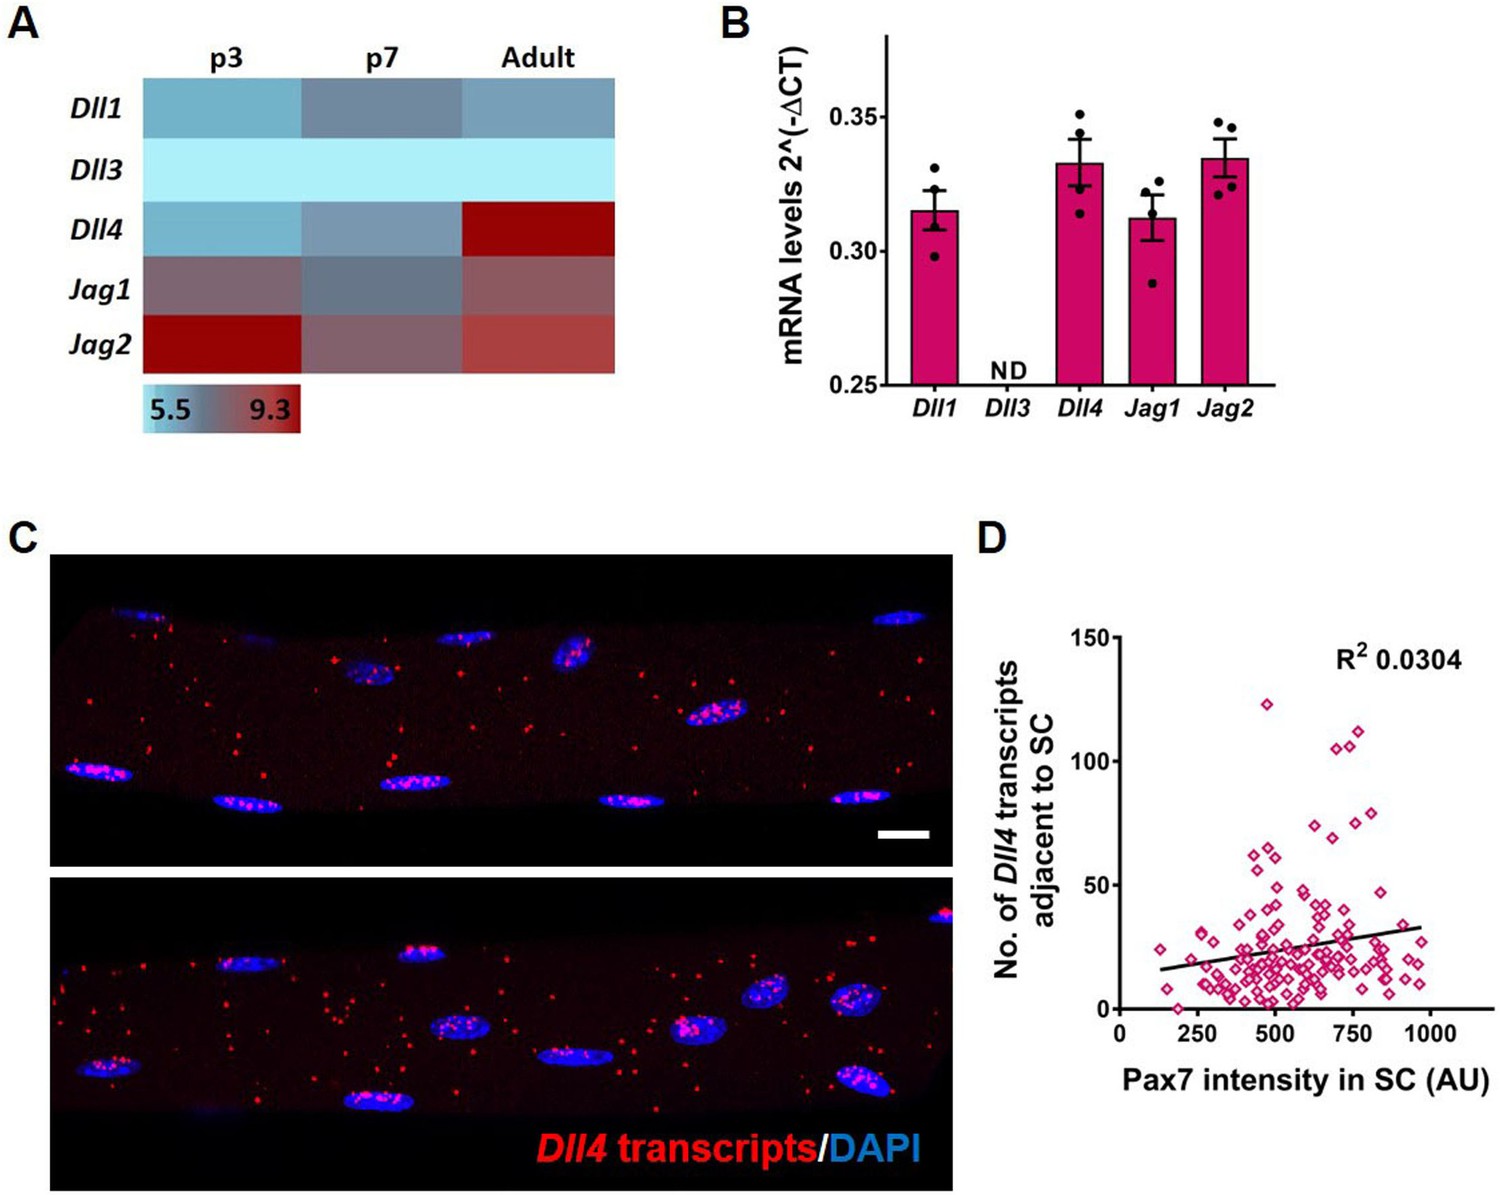
Dll4 transcripts are highly expressed in adult muscle fibers.
(A) Heatmap of Notch ligands from microarray of muscle fibers isolated from postnatal day 3 (p3), day 7 (p7), and adult Extensor Digitorum Longus (EDL) muscle (n = 2), The expression values are log2 transformed and range from 5.5 (low, blue) to 9.3 (high, red). (B) qRT-PCR of Notch ligands in isolated adult muscle fibers. The notch ligand transcripts are normalized to GAPDH (n = 4); ND, not detected. (C, D) Representative images of RNAscope of Dll4 transcripts on single adult muscle fibers (in C) and bivariate plot showing the relationship between the number of Dll4 transcripts on muscle fiber adjacent to the stem cell (SC) and the Pax7 intensity in SC (n = 3). Error bars, mean ± standard error of the mean (SEM); scale bars, 10 μm in (C).
Figure 2—figure supplement 2

Spatial distribution of Dll4 along muscle fibers does not map to known anatomical locations.
(A) Low magnification Spinning Disk images of WT fibers showing heterogeneous Dll4 expression and the adjacent stem cell (SC) expressing variable Pax7 expression. (B–U) Each graph represents the intensity of Dll4 expression along a single muscle fiber with reference to the location of neuromuscular junction (NMJ). Along the same fiber, the Dll4 intensity captured by the SC and Pax7 expression of the SC is also quantified. The distribution of Dll4 intensity along a muscle fiber is bell shaped (in B–E), a bimodal curve (in F–I), a multimodal curve (in J–O), an Inverted bell curve (in P–Q), and a straight line (in R–U). Scale bars, 20 μm in (A).
Figure 3 with 2 supplements
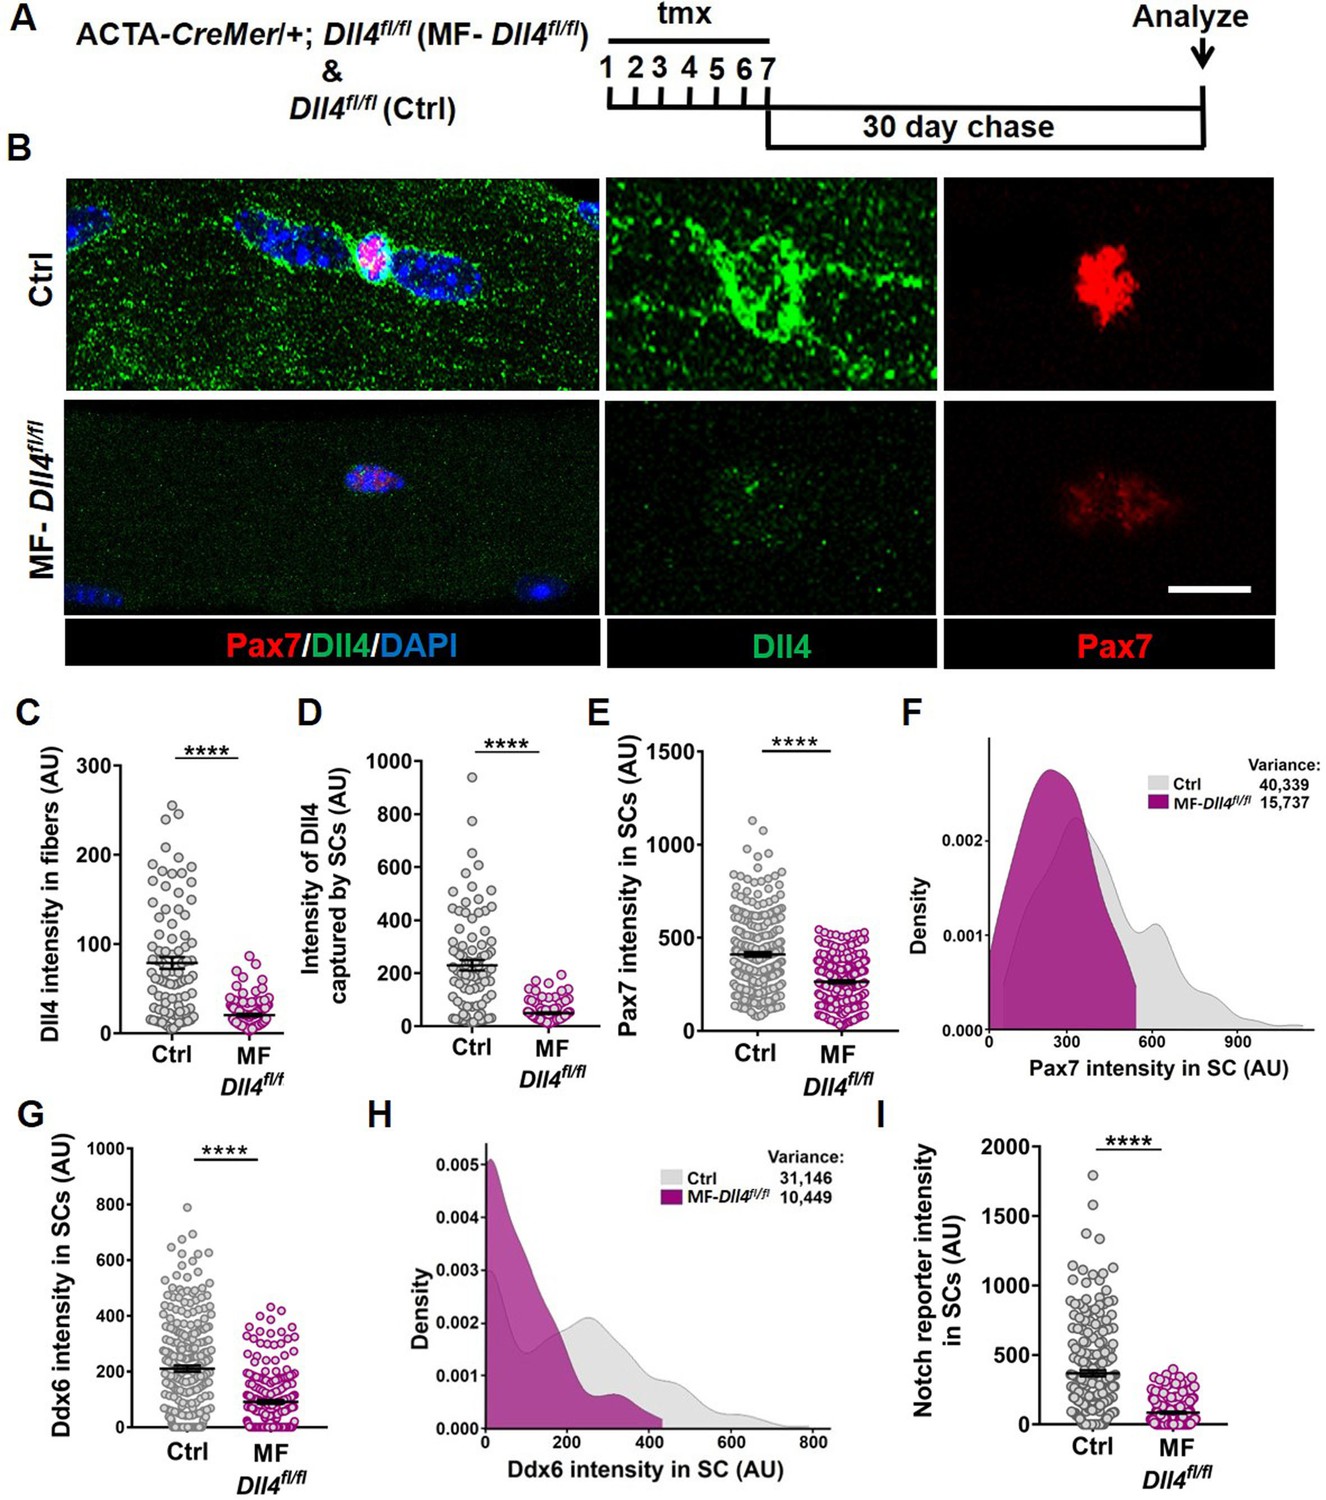
Muscle fiber-derived Dll4 maintains a continuum of diverse states in the quiescent muscle stem cell (QSC) pool.
(A) Schematic representation of the experimental design. (B–F) Representative images of Dll4 and Pax7 expression in Control and MF-Dll4fl/fl fibers and stem cells (SCs) (in B), quantification of Dll4 intensity in fibers (in C), intensity of Dll4 captured by SCs (in D), Pax7 intensity in SCs (in E), and a density map of Pax7 intensity in SCs (in F) (n = 3 mice). (G, H) Ddx6 intensity in SCs (in G) and density map of Ddx6 intensity in SCs (in H) on Control and MF-Dll4fl/fl fibers (n = 3 mice). (I) Notch reporter intensity levels in Control and MF-Dll4fl/fl SCs (n = 3). Error bars, mean ± standard error of the mean (SEM); ****p < 0.0001; scale bars, 10 μm in (B).
-
Figure 3—source data 1
Muscle fiber derived Dll4 maintains a continuum of diverse states in the QSC pool.
- https://cdn.elifesciences.org/articles/68180/elife-68180-fig3-data1-v1.xlsx
-
Figure 3—source data 2
Muscle fiber derived Dll4 maintains a continuum of diverse states in the QSC pool.
- https://cdn.elifesciences.org/articles/68180/elife-68180-fig3-data2-v1.xlsx
-
Figure 3—source data 3
Muscle fiber derived Dll4 maintains a continuum of diverse states in the QSC pool.
- https://cdn.elifesciences.org/articles/68180/elife-68180-fig3-data3-v1.xlsx
-
Figure 3—source data 4
Muscle fiber derived Dll4 maintains a continuum of diverse states in the QSC pool.
- https://cdn.elifesciences.org/articles/68180/elife-68180-fig3-data4-v1.xlsx
-
Figure 3—source data 5
Muscle fiber derived Dll4 maintains a continuum of diverse states in the QSC pool.
- https://cdn.elifesciences.org/articles/68180/elife-68180-fig3-data5-v1.xlsx
-
Figure 3—source data 6
Muscle fiber derived Dll4 maintains a continuum of diverse states in the QSC pool.
- https://cdn.elifesciences.org/articles/68180/elife-68180-fig3-data6-v1.xlsx
-
Figure 3—source data 7
Muscle fiber derived Dll4 maintains a continuum of diverse states in the QSC pool.
- https://cdn.elifesciences.org/articles/68180/elife-68180-fig3-data7-v1.xlsx
Figure 3—figure supplement 1

Deletion of Dll4 in the niche causes a reduction in the number of stem cell (SC).
(A) Representative images of Pax7+ SCs in tissue cross sections of Control and MF-Dll4fl/fl tibialis anterior (TA). (B) Quantification of the number of Pax7+ SCs in Control and MF-Dll4fl/fl fibers (n = 4 mice). Error bars, mean ± standard error of the mean (SEM); ***p < 0.001; scale bars, 100 μm in (A).
Figure 3—figure supplement 2

Dll4 does not have a cell autonomous role in quiescent muscle stem cells (QSCs).
(A) Schematic representation of the experimental design. (B) Quantification of the number of Pax7+ stem cells (SCs) in tibialis anterior (TA) muscle cross-sections of Control and SC-Dll4fl/fl fibers (n = 3 mice). Error bars, mean ± standard error of the mean (SEM); ns, nonsignificant.
Figure 4

Reduction of Dll4 in the niche causes a shift in the continuum toward lower Pax7 levels.
(A–C) Quantification of the number of Pax7+ stem cells (SCs) (in A), Dll4 intensity in muscle fibers (in B), Pax7 intensity in SCs (in C) of Control mice compared to MF-Dll4fl/fl mice that were given low dose (75 mg/kg/day) or regular dose (150 mg/kg/day) of tmx to reduce or completely ablate the expression of Dll4, respectively. (D) Density plot of the Pax7 intensity in SCs of Control mice compared to MF-Dll4fl/fl mice that were given the two different doses of tmx (n = 3 mice). Error bars, mean ± standard error of the mean (SEM); ns, nonsignificant, ***p < 0.001, ****p < 0.0001.
-
Figure 4—source data 1
Reduction of Dll4 in the niche causes a shift in the continuum towards lower Pax7 levels.
- https://cdn.elifesciences.org/articles/68180/elife-68180-fig4-data1-v1.xlsx
-
Figure 4—source data 2
Reduction of Dll4 in the niche causes a shift in the continuum towards lower Pax7 levels.
- https://cdn.elifesciences.org/articles/68180/elife-68180-fig4-data2-v1.xlsx
Figure 5 with 2 supplements
Niche-derived Dll4 constrains the proliferative and commitment potential of the quiescent muscle stem cell (QSC) pool.
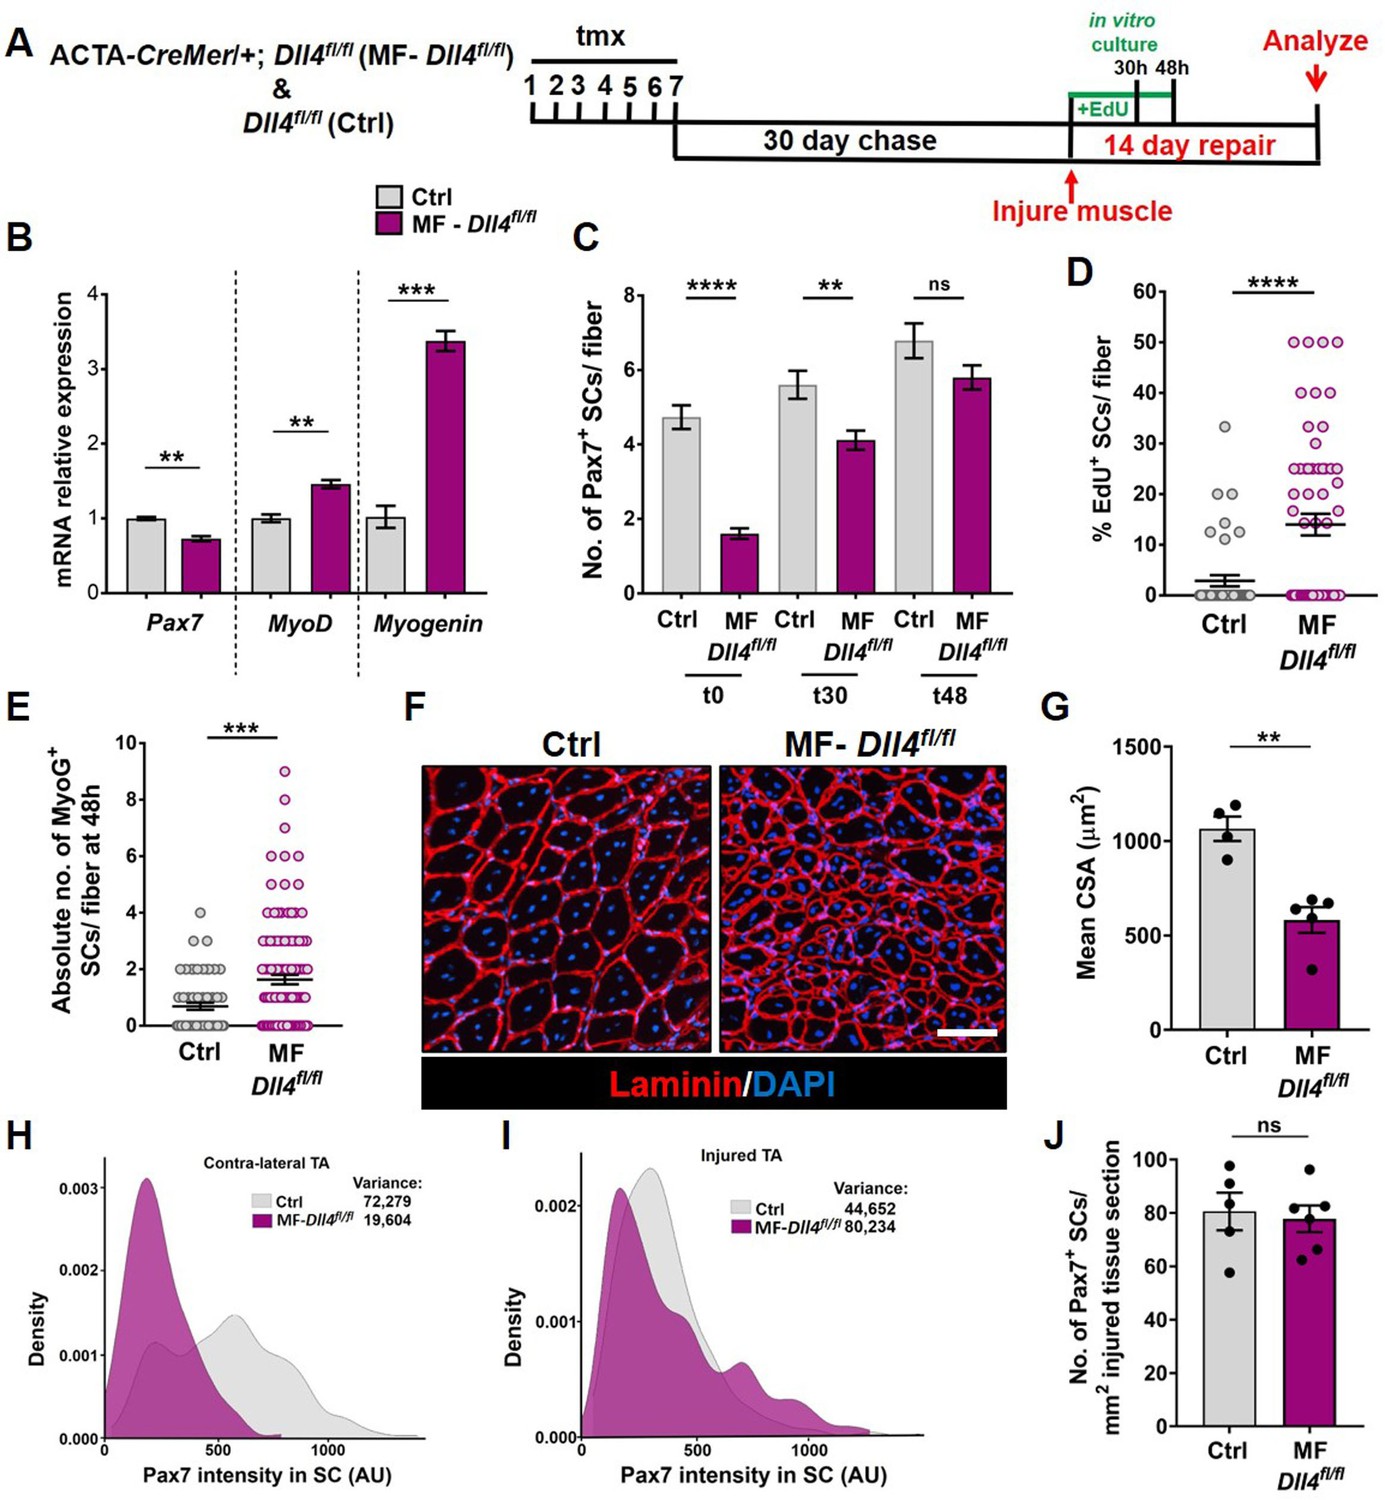
(A) Schematic representation of the experimental design. (B) qRT-PCR for Pax7, MyoD, and Myogenin transcripts in freshly isolated stem cells (SCs) from Control and MF-Dll4fl/fl fibers (n = 2). (C) Number of Pax7+ SCs at t0, t30, and t48 in cultured Control and MF-Dll4fl/fl fibers (n = 3). (D) Control and Dll4 deleted fibers were cultured in plating media containing EdU for 30 hr and the percent of EdU+ SCs per fiber were quantified (n = 3). (E) Control and MF-Dll4fl/fl fibers were cultured in vitro for 48 hr and the MyoG+ cells per fiber were quantified (n = 3). (F, G) Representative images (in F) and quantification (in G) of mean cross-sectional area of Control and MF-Dll4fl/fl tibialis anterior (TA) fibers, injured and regenerated for 14 days (n ≥ 4). (H, I) Density map of Pax7 intensity in SCs from Ctrl and MF-Dll4fl/fl contralateral TA (in H) and injured TA (in I), 14-day postinjury (n = 3). (J) Number of Pax7+ SCs in regenerated TA muscle, 14 days after injury (n ≥ 5). Error bars, mean ± standard error of the mean (SEM); ns, nonsignificant, **p < 0.01, ***p < 0.001, ****p < 0.0001; scale bars, 100 μm in (F).
-
Figure 5—source data 1
Niche derived Dll4 constrains the proliferative and commitment potential of the QSC pool.
- https://cdn.elifesciences.org/articles/68180/elife-68180-fig5-data1-v1.xlsx
-
Figure 5—source data 2
Niche derived Dll4 constrains the proliferative and commitment potential of the QSC pool.
- https://cdn.elifesciences.org/articles/68180/elife-68180-fig5-data2-v1.xlsx
-
Figure 5—source data 3
Niche derived Dll4 constrains the proliferative and commitment potential of the QSC pool.
- https://cdn.elifesciences.org/articles/68180/elife-68180-fig5-data3-v1.xlsx
-
Figure 5—source data 4
Niche derived Dll4 constrains the proliferative and commitment potential of the QSC pool.
- https://cdn.elifesciences.org/articles/68180/elife-68180-fig5-data4-v1.xlsx
-
Figure 5—source data 5
Niche derived Dll4 constrains the proliferative and commitment potential of the QSC pool.
- https://cdn.elifesciences.org/articles/68180/elife-68180-fig5-data5-v1.xlsx
-
Figure 5—source data 6
Niche derived Dll4 constrains the proliferative and commitment potential of the QSC pool.
- https://cdn.elifesciences.org/articles/68180/elife-68180-fig5-data6-v1.xlsx
-
Figure 5—source data 7
Niche derived Dll4 constrains the proliferative and commitment potential of the QSC pool.
- https://cdn.elifesciences.org/articles/68180/elife-68180-fig5-data7-v1.xlsx
-
Figure 5—source data 8
Niche derived Dll4 constrains the proliferative and commitment potential of the QSC pool.
- https://cdn.elifesciences.org/articles/68180/elife-68180-fig5-data8-v1.xlsx
-
Figure 5—source data 9
Niche derived Dll4 constrains the proliferative and commitment potential of the QSC pool.
- https://cdn.elifesciences.org/articles/68180/elife-68180-fig5-data9-v1.xlsx
Figure 5—figure supplement 1
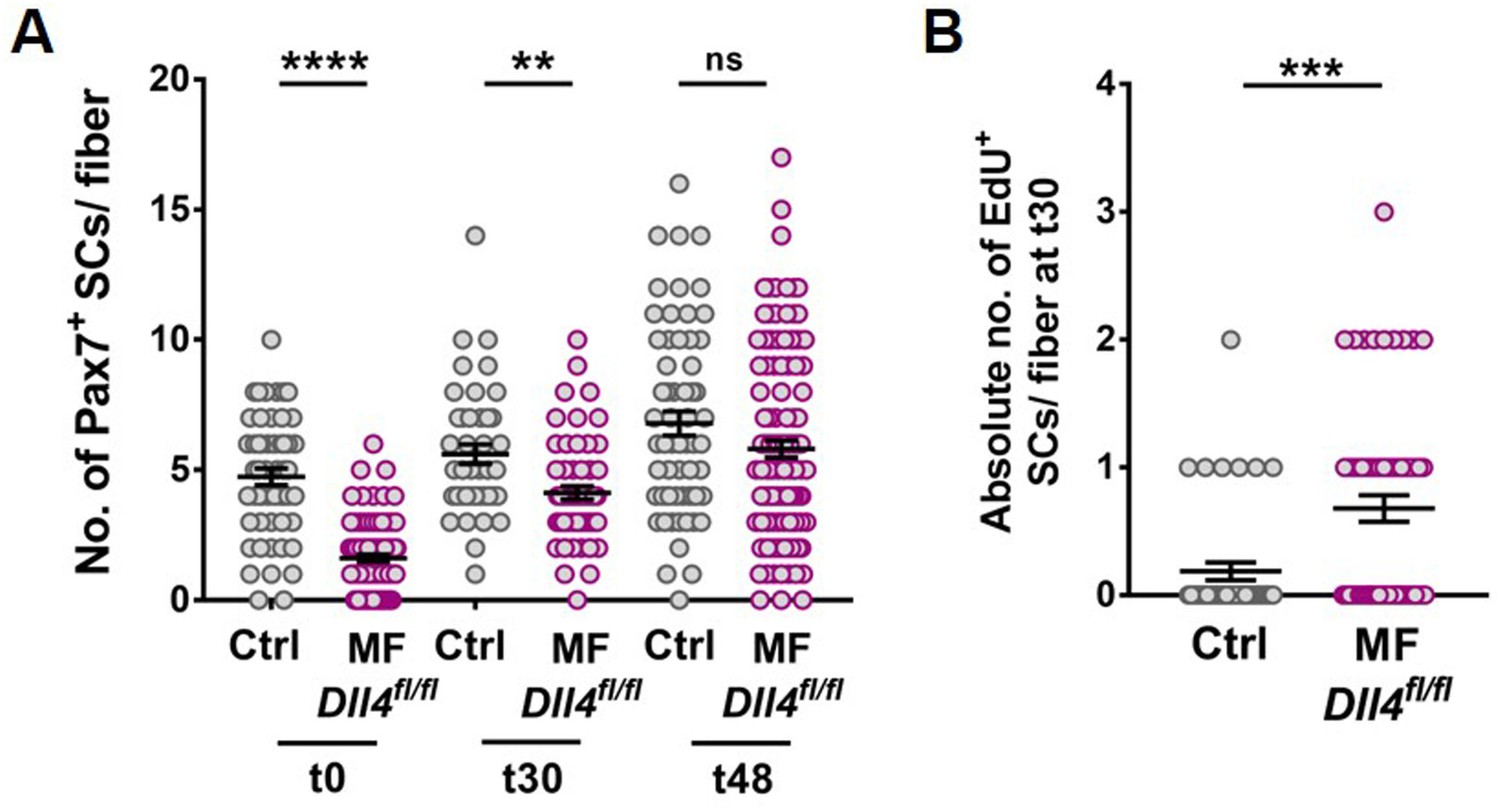
Niche depletion of Dll4 causes stem cells (SCs) to proliferate faster in the presence of mitogen.
(A) Number of Pax7+ SCs at t0, t30, and t48 in cultured Control and MF-Dll4fl/fl fibers, depicted as a dot plot (each dot represents a single fiber) (n = 3 mice). (B) Control and Dll4 deleted fibers were cultured in plating media containing EdU for 30 hr and the absolute number of EdU+ SCs per fiber was quantified (n = 3). Error bars, mean ± standard error of the mean (SEM); ns, nonsignificant, **p < 0.01, ***p < 0.001, ****p < 0.0001.
Figure 5—figure supplement 2
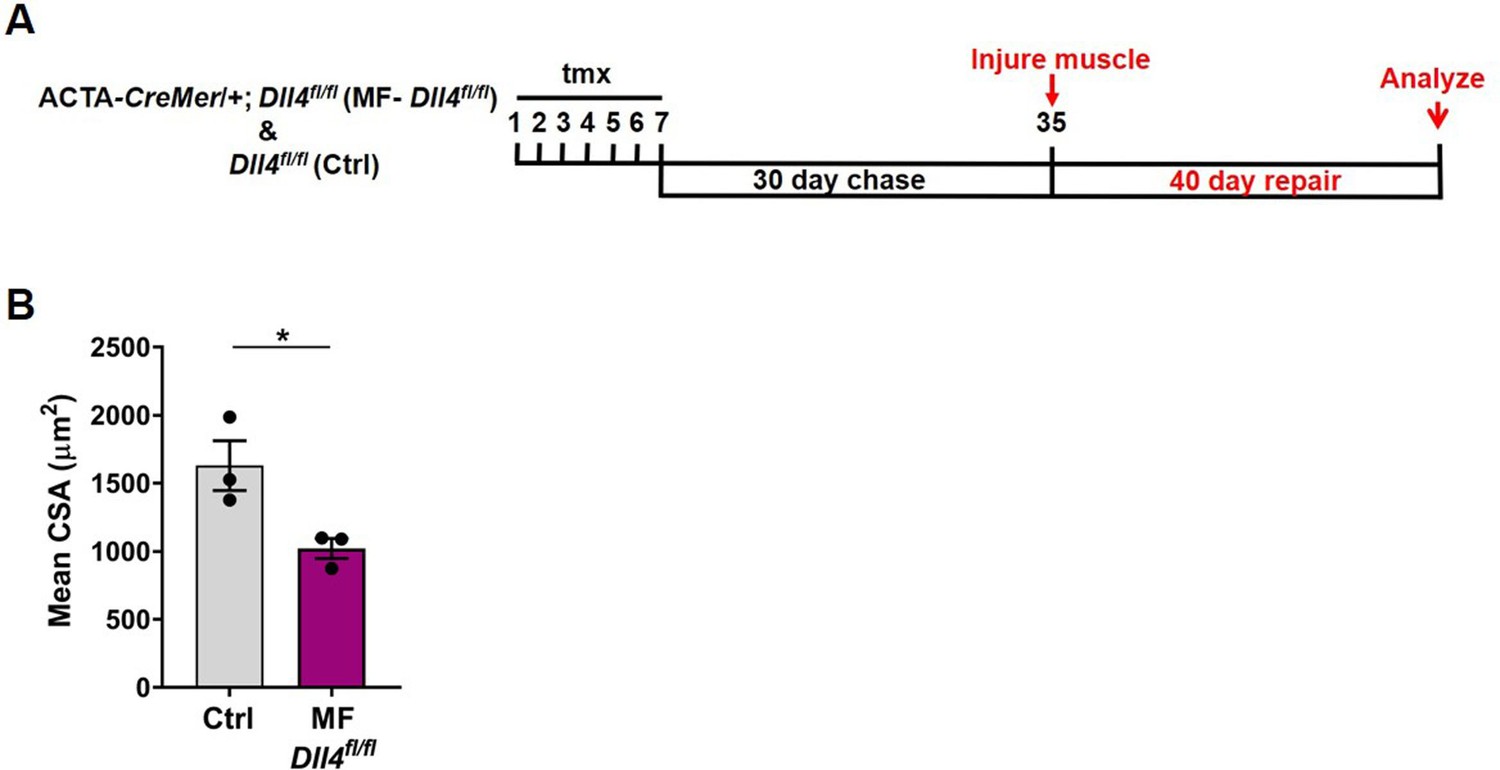
Impaired regenerative potential of stem cells (SCs) on Dll4-depleted niche.
(A) Schematic representation of the experimental design. (B) Mean cross-sectional area of Control and MF-Dll4fl/fl tibialis anterior (TA) fibers, injured and regenerated for 40 days (n = 3). Error bars, mean ± standard error of the mean (SEM); *p <0.05.
Figure 6
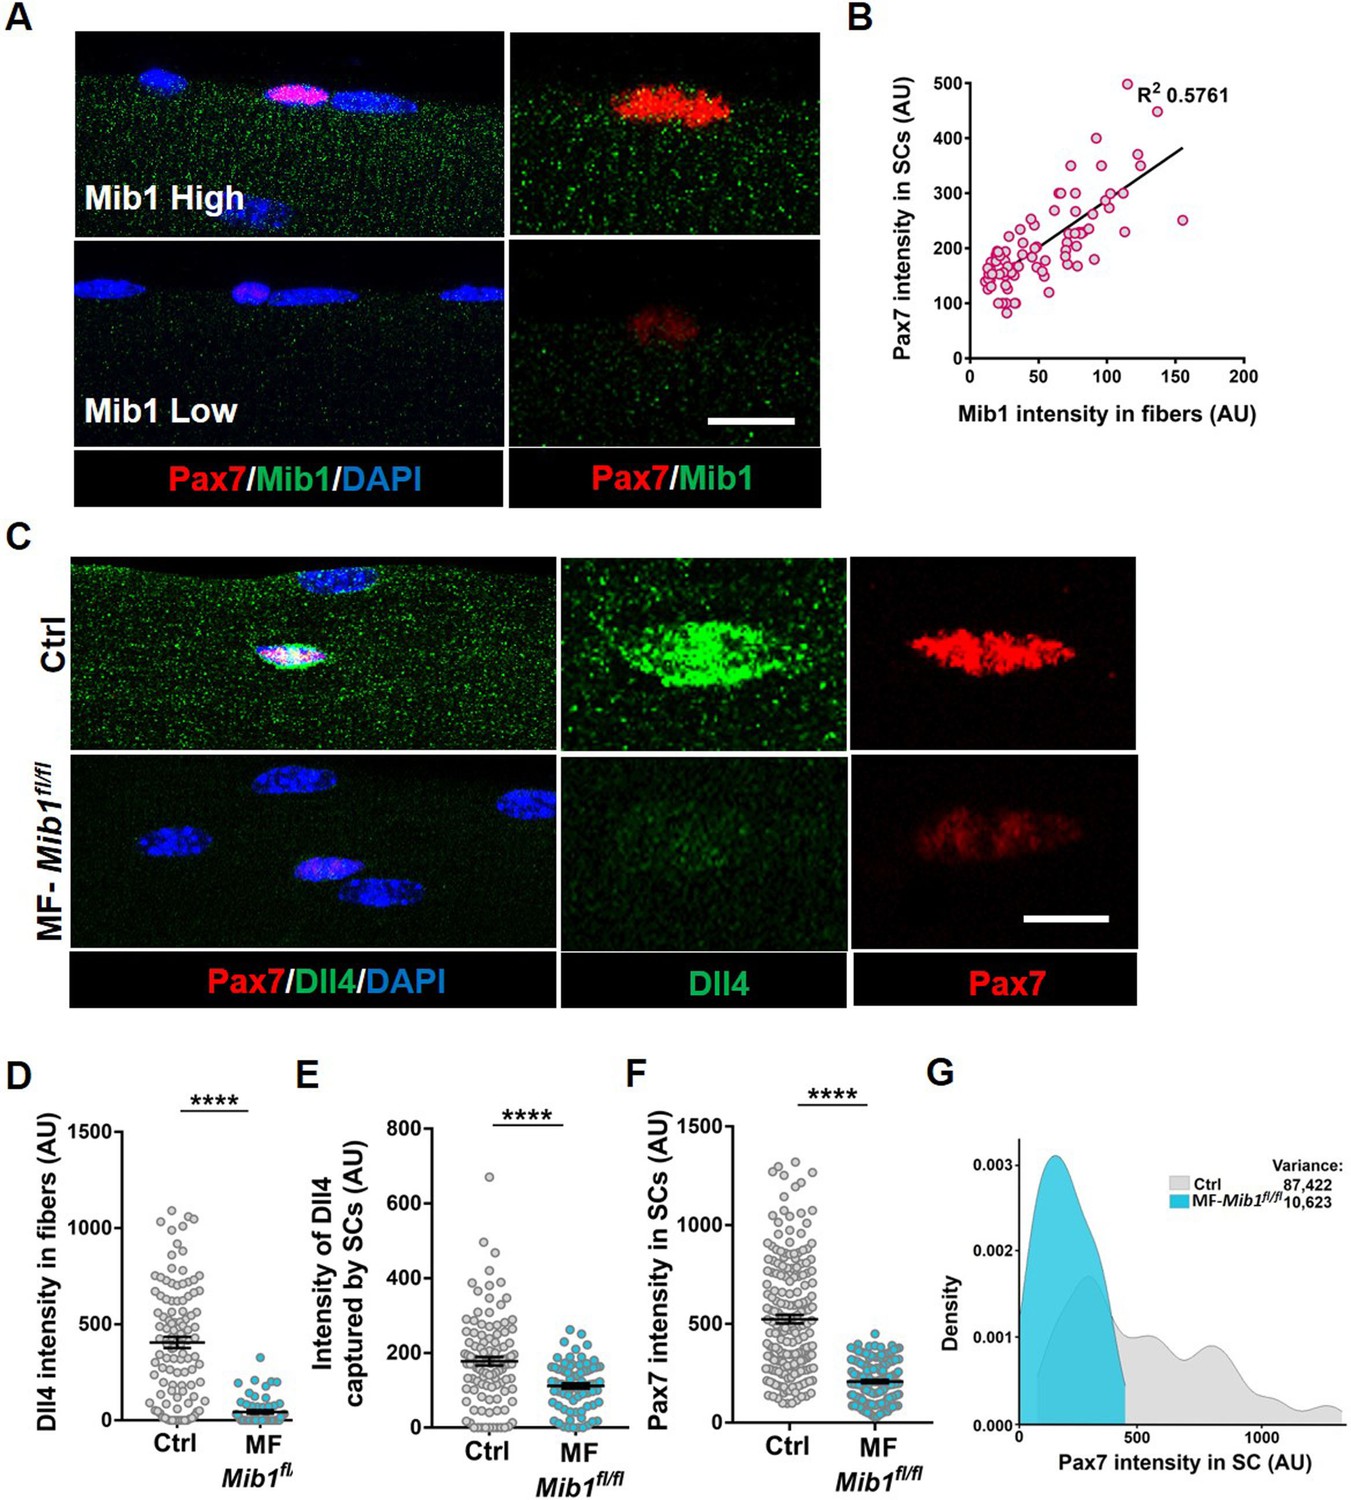
Niche-derived Mib1 directs spatial patterning and activation of Dll4.
(A) Representative images of WT fibers showing regions of high and low Mib1 protein expression and the adjacent Pax7+ stem cell (SC). (B) A bivariate plot showing Mib1 intensity in the fiber and Pax7 intensity in the adjacent SC. (C–G) Representative images of Dll4 expression in fibers and Pax7 expression in adjacent SCs present on Control and MF-Mib1fl/fl fibers (in C), quantification of Dll4 intensity in fibers (in D), intensity of Dll4 captured by SCs (in E), Pax7 intensity in SCs (in F), and a density map of Pax7 intensity in SCs (in G) on Control and MF-Mib1fl/fl fibers (n = 3 mice). Error bars, mean ± standard error of the mean (SEM); ****p < 0.0001; scale bars, 5 μm in (A) and (C).
-
Figure 6—source data 1
Niche-derived Mib1 directs spatial patterning and activation of Dll4.
- https://cdn.elifesciences.org/articles/68180/elife-68180-fig6-data1-v1.xlsx
-
Figure 6—source data 2
Niche-derived Mib1 directs spatial patterning and activation of Dll4.
- https://cdn.elifesciences.org/articles/68180/elife-68180-fig6-data2-v1.xlsx
-
Figure 6—source data 3
Niche-derived Mib1 directs spatial patterning and activation of Dll4.
- https://cdn.elifesciences.org/articles/68180/elife-68180-fig6-data3-v1.xlsx
Figure 7
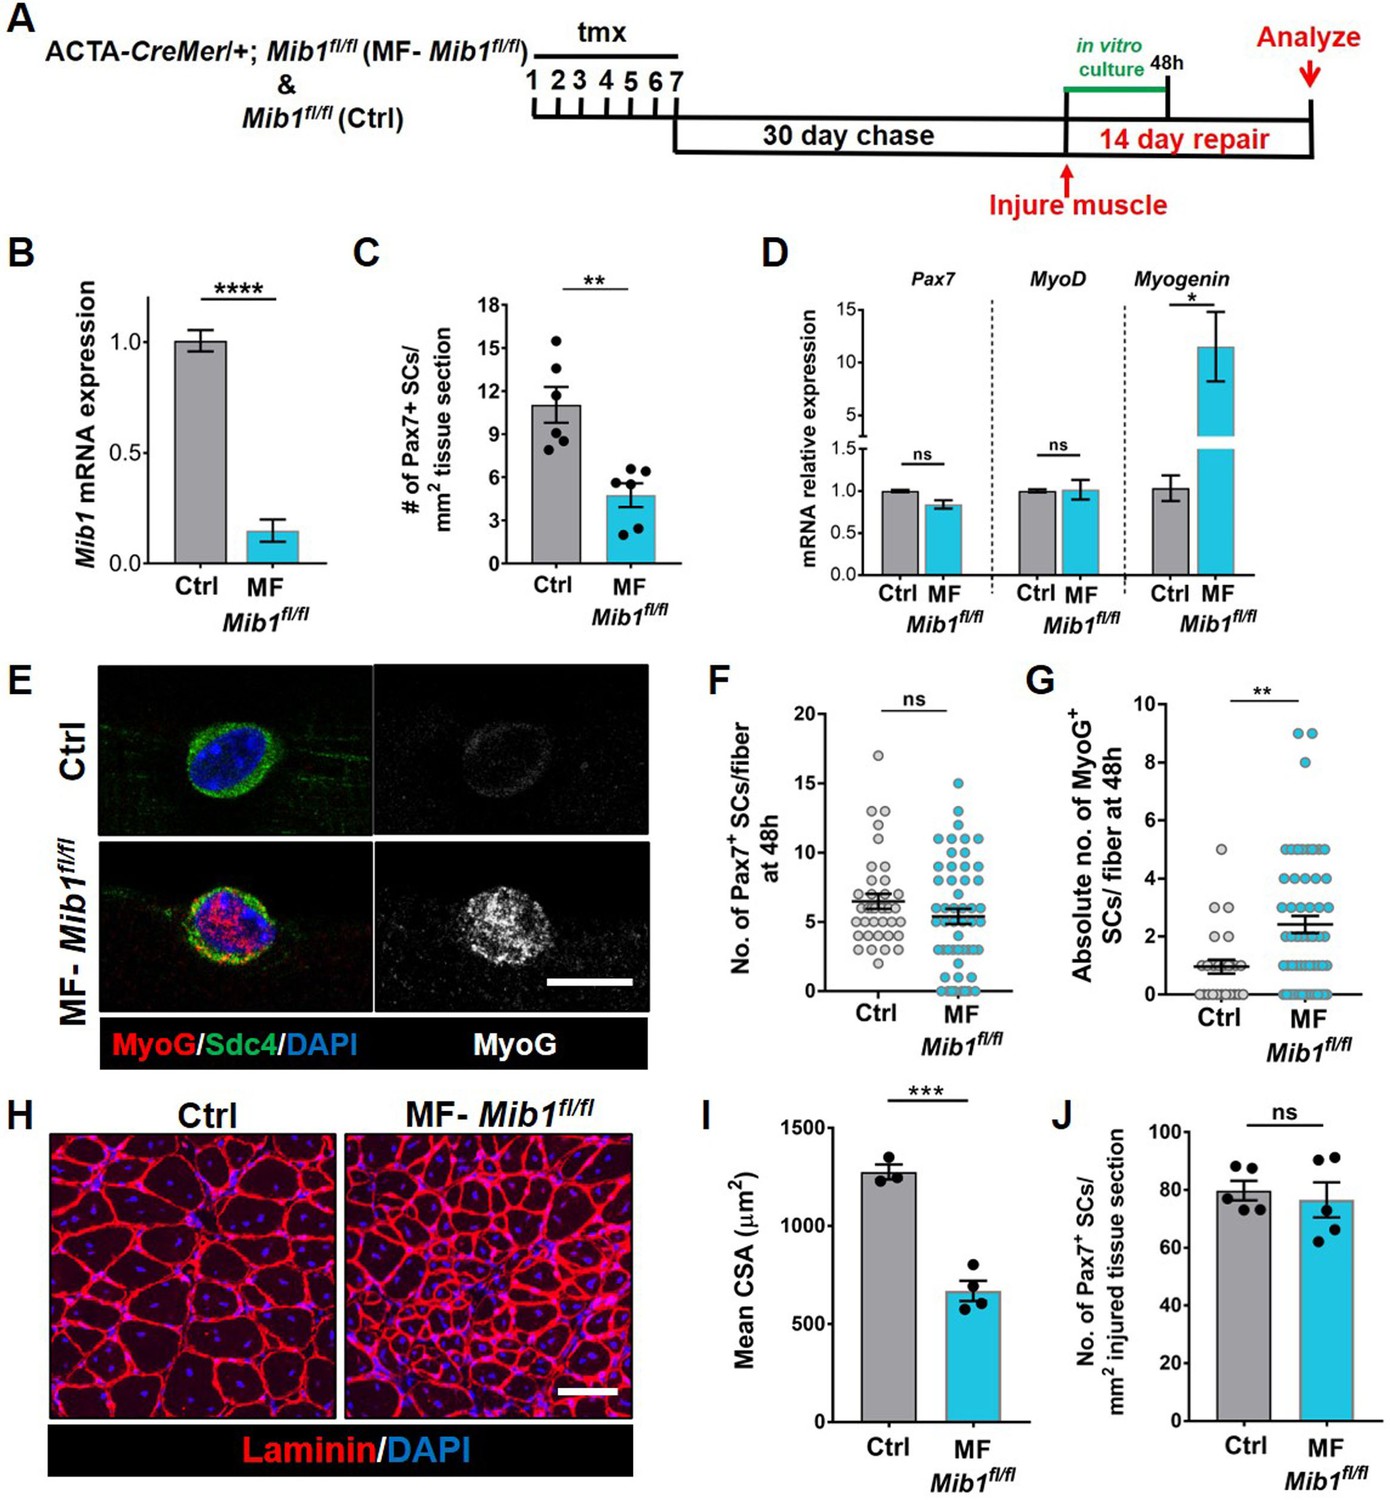
Mib1 in the muscle fiber maintains quiescent muscle stem cells (QSCs) by inhibiting differentiation.
(A) Schematic representation of the experimental design. (B) qRT-PCR for mib1 transcripts in fibers of Control and MF-Mib1fl/fl normalized to GAPDH (n = 3). (C) Number of Pax7+ stem cells (SCs) in tibialis anterior (TA) muscle sections of Control and MF-Mib1fl/fl (n = 6). (D) qRT-PCR for Pax7, MyoD, and Myogenin transcripts in freshly isolated SCs from Control and MF-Mib1fl/fl fibers, normalized to GAPDH (n = 3). (E–G) Representative images of Sdc4 and MyoG expression in SCs from Control and Mib1-deleted fibers, cultured in vitro in plating media for 48 hr (in E), the number of Pax7+ SCs (in F), and the absolute number of MyoG+ cells (in G) per fiber were quantified (n = 3). (H, I) Representative images (in H) and quantification (in I) of mean cross-sectional area of Control and MF-Mib1fl/fl TA muscle fibers, injured and regenerated for 14 days (n ≥ 3). (J) Number of Pax7+ SCs in regenerated TA muscle, 14 days after injury (n = 5). Error bars, mean ± standard error of the mean (SEM); ns, nonsignificant, *p < 0.05, **p < 0.01, ***p < 0.001, ****p < 0.0001; scale bars, 10 μm in (E) and 100 μm in (H).
-
Figure 7—source data 1
Niche-derived Mib1 directs spatial patterning and activation of Dll4.
- https://cdn.elifesciences.org/articles/68180/elife-68180-fig7-data1-v1.xlsx
-
Figure 7—source data 2
Niche-derived Mib1 directs spatial patterning and activation of Dll4.
- https://cdn.elifesciences.org/articles/68180/elife-68180-fig7-data2-v1.xlsx
-
Figure 7—source data 3
Niche-derived Mib1 directs spatial patterning and activation of Dll4.
- https://cdn.elifesciences.org/articles/68180/elife-68180-fig7-data3-v1.xlsx
-
Figure 7—source data 4
Niche-derived Mib1 directs spatial patterning and activation of Dll4.
- https://cdn.elifesciences.org/articles/68180/elife-68180-fig7-data4-v1.xlsx
-
Figure 7—source data 5
Niche-derived Mib1 directs spatial patterning and activation of Dll4.
- https://cdn.elifesciences.org/articles/68180/elife-68180-fig7-data5-v1.xlsx
-
Figure 7—source data 6
Niche-derived Mib1 directs spatial patterning and activation of Dll4.
- https://cdn.elifesciences.org/articles/68180/elife-68180-fig7-data6-v1.xlsx
Figure 8
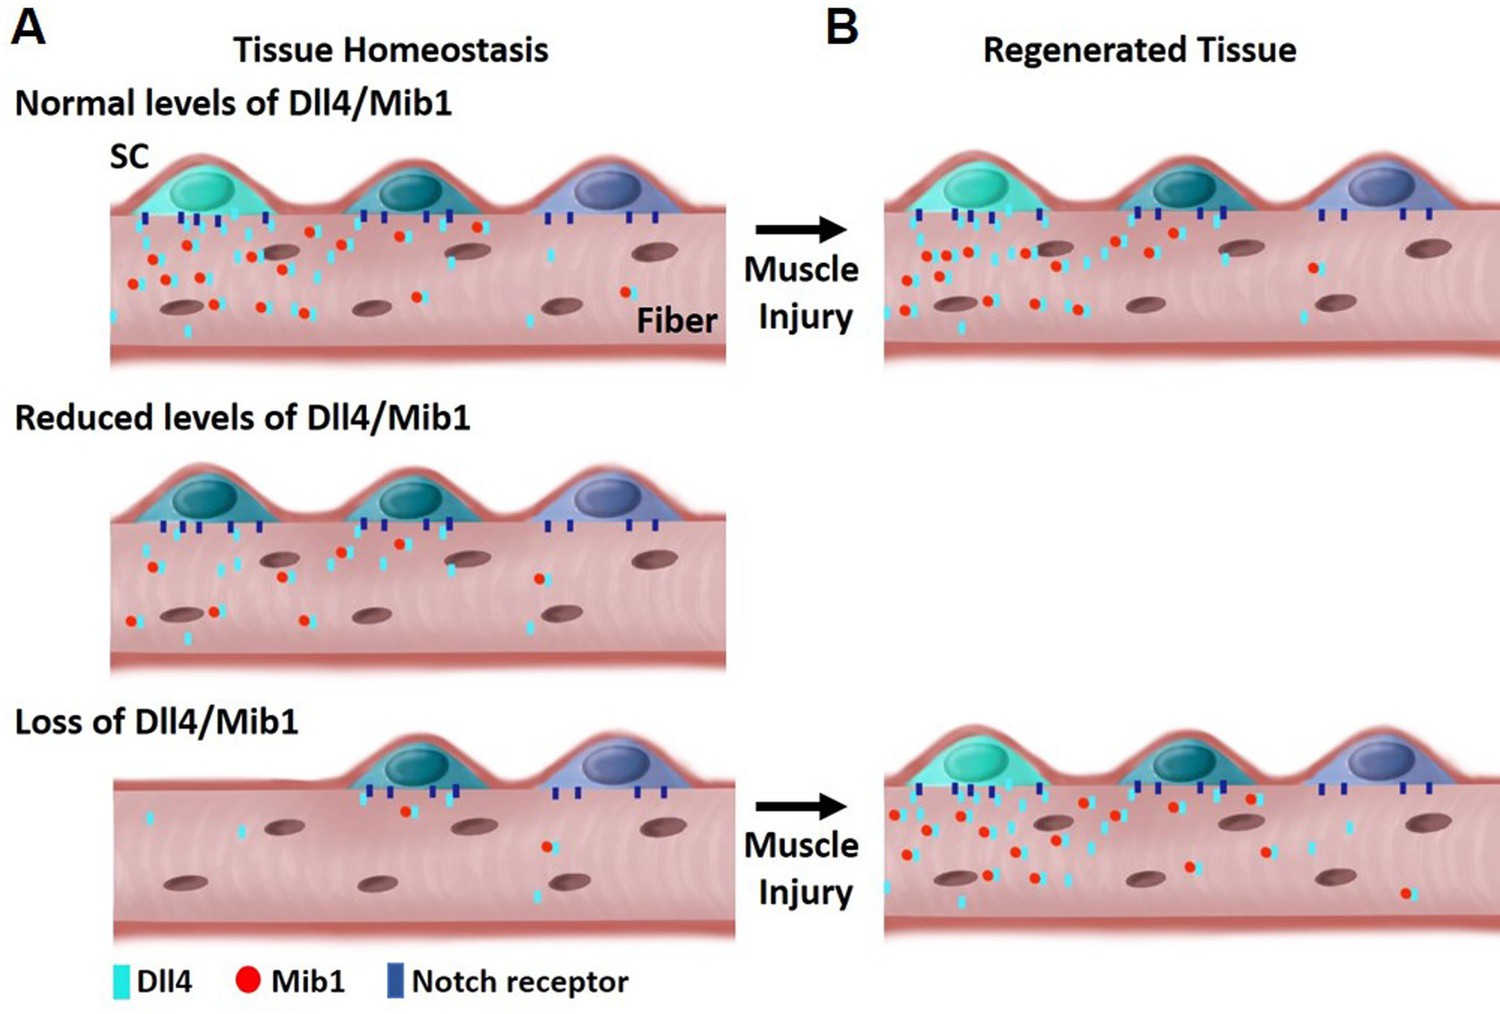
Model depicting heterogeneous levels of Dll4/Mib1 in the niche regulates a continuum of metastable stem cell (SC) states.
(A) Top: During tissue homeostasis, Notch ligand Dll4 is present in a heterogeneous manner along the length of the muscle fibers that maintains the size of the SC pool and a continuum of quiescent metastable cell states. Middle: A reduction in Dll4/Mib1 levels does not change the number of SCs, but causes a shift in metastable states toward activation and commitment. Bottom: Complete ablation of Dll4/Mib1 in the muscle fibers results in a more dramatic shift in the metastable states away from quiescent self-renewing fates toward more proliferative and committed fates, and SC loss likely by fusion into muscle fibers. (B) Top: In the event of an injury, the SC metastable states are reformed on newly regenerated muscle fibers. Bottom: After injury to a Dll4/Mib1-depleted niche, wildtype SCs reform the niche, restoring the normal distribution of metastable SC states.
Additional files
-
Supplementary file 1
Microarray expression of Notch ligands in p3, p7, and adult muscle fibers (log2 values).
This table includes the expression (as log2 values) of Notch ligands in postnatal day 3, postnatal day 7, and adult. Related to Figure 2—figure supplement 1.
- https://cdn.elifesciences.org/articles/68180/elife-68180-supp1-v1.docx
-
Supplementary file 2
Primers used for quantitative RT-PCR.
This table includes the forward and reverse primer sequences of genes amplified by qRT-PCR. Related to Figure 2—figure supplement 1, Figures 5 and 7.
- https://cdn.elifesciences.org/articles/68180/elife-68180-supp2-v1.docx
-
Transparent reporting form
- https://cdn.elifesciences.org/articles/68180/elife-68180-transrepform1-v1.pdf
Download links
A two-part list of links to download the article, or parts of the article, in various formats.
Downloads (link to download the article as PDF)
Open citations (links to open the citations from this article in various online reference manager services)
Cite this article (links to download the citations from this article in formats compatible with various reference manager tools)
Heterogeneous levels of delta-like 4 within a multinucleated niche cell maintains muscle stem cell diversity
eLife 11:e68180.
https://doi.org/10.7554/eLife.68180


