Spatially displaced excitation contributes to the encoding of interrupted motion by a retinal direction-selective circuit
- Committee on Neurobiology Graduate Program, The University of Chicago, United States
- Department of Neurobiology, The University of Chicago, United States
- Department of Organismal Biology, The University of Chicago, United States
- Graduate Program in Biophysical Sciences, The University of Chicago, United States
- Department of Neuroscience and Carney Institute for Brain Science, Brown University, United States
- Grossman Institute for Neuroscience, Quantitative Biology and Human Behavior, The University of Chicago, United States
Figures
Figure 1 with 1 supplement
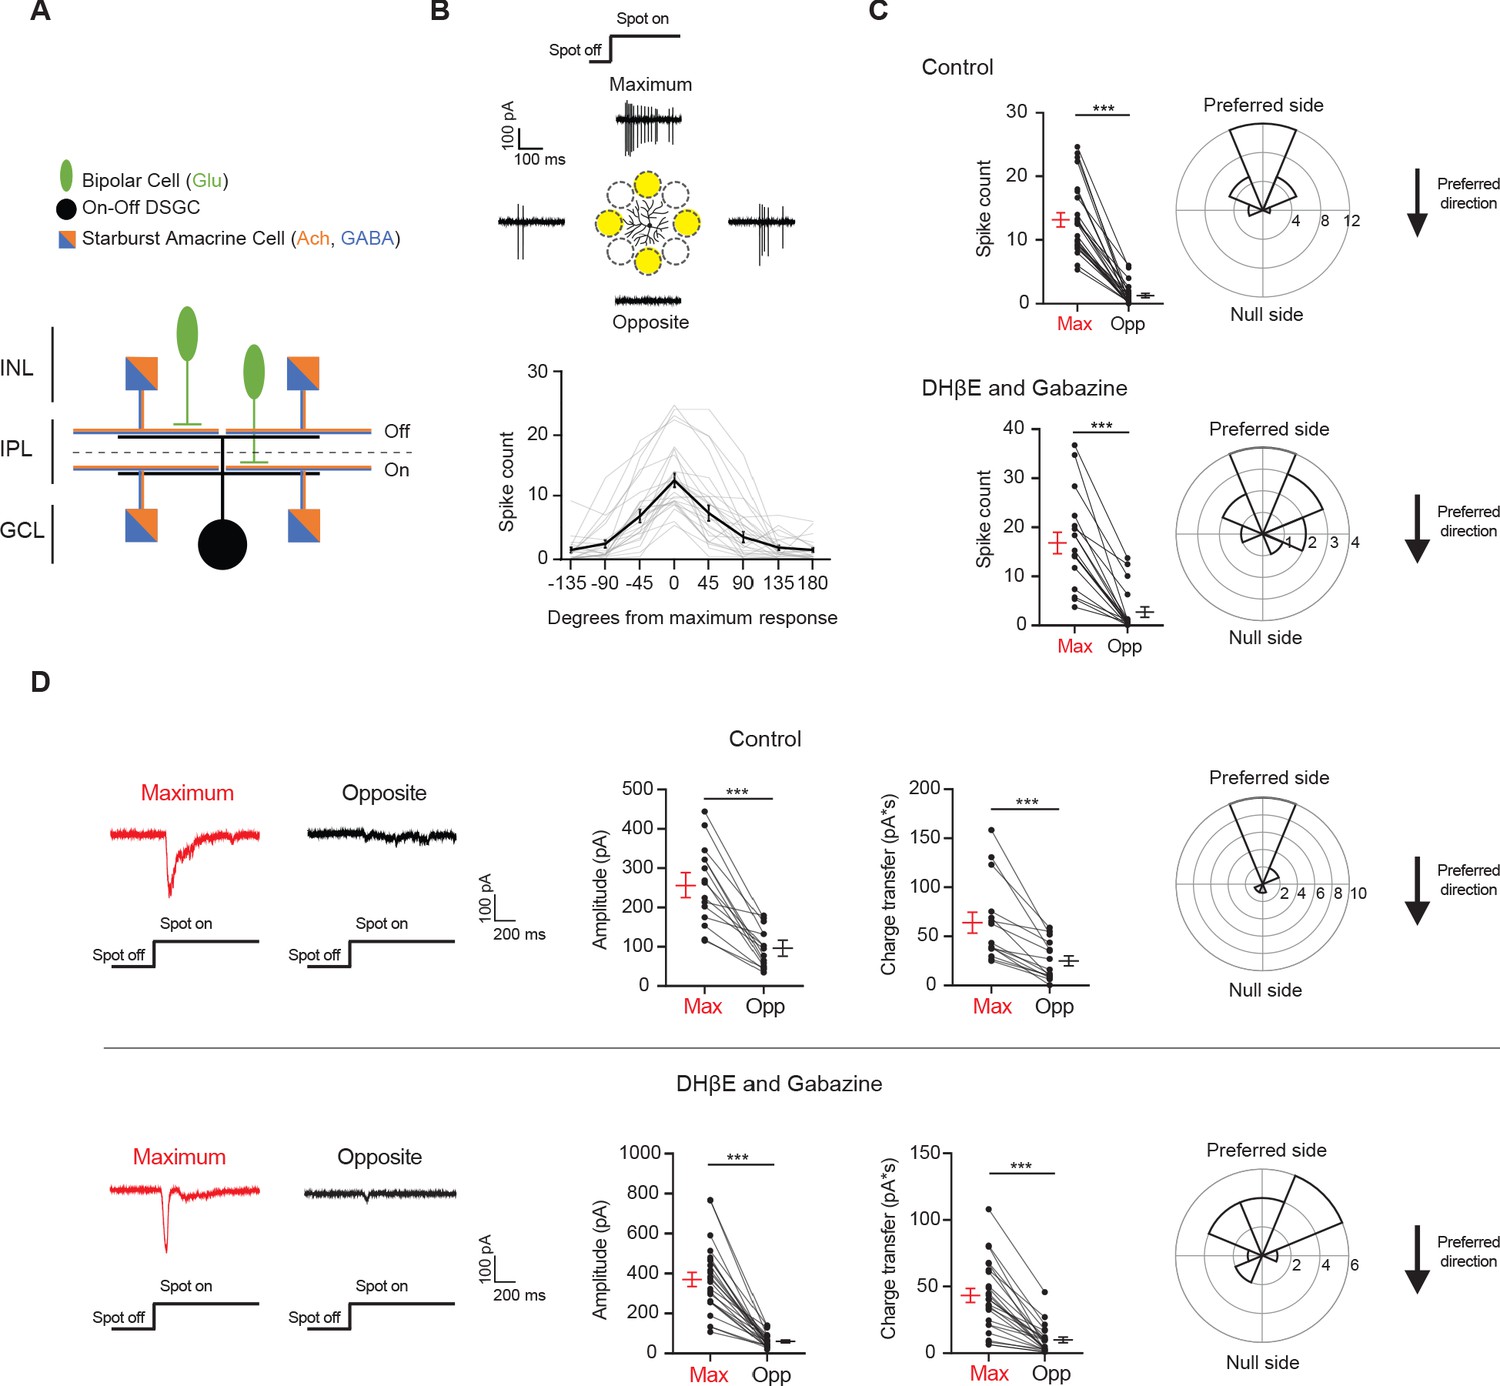
Drd4-GFP-labeled pDSGCs have spatially asymmetric glutamatergic receptive fields.
(A) Schematic showing types of presynaptic neurons to an On-Off DSGC and the neurotransmitters they use. (B) Top: Example On spiking responses of a pDSGC to four different peripheral spots presented around dendritic span. Bottom: Individual (gray) and mean (black) pDSGC On spike counts evoked by spots presented at different locations (25 cells). (C) Top left: Pairwise comparison of mean spike counts in regions evoking the maximum number of On spikes (Max) and the opposite region (Opp) in the control condition (25 cells). Top right: Polar histogram of Max region locations aligned to the preferred-null motion axis. Radius indicates number of cells. Bottom: Same as in top but experiments performed in DHβE + Gabazine (18 cells). (D) Left: Example On EPSC responses to spots shown in the regions evoking the strongest EPSCs (Max) and the opposite region (Opp) in control (top) and in DHβE + Gabazine (bottom). Middle: Pairwise comparisons of EPSC amplitude and charge transfer to spots presented in the Max region and Opp region (Control: 15 cells; DHβE + Gabazine: 24 cells). Right: Polar histograms of Max region locations determined by EPSC charge transfer aligned to the preferred-null motion axis. Radius indicates number of cells. Summary statistics are mean ± SEM, ***p<0.001.
-
Figure 1—source data 1
Drd4-GFP-labeled pDSGCs have spatially asymmetric glutamatergic receptive fields.
- https://cdn.elifesciences.org/articles/68181/elife-68181-fig1-data1-v2.xlsx
Figure 1—figure supplement 1
pDSGCs have spatially asymmetric RFs.
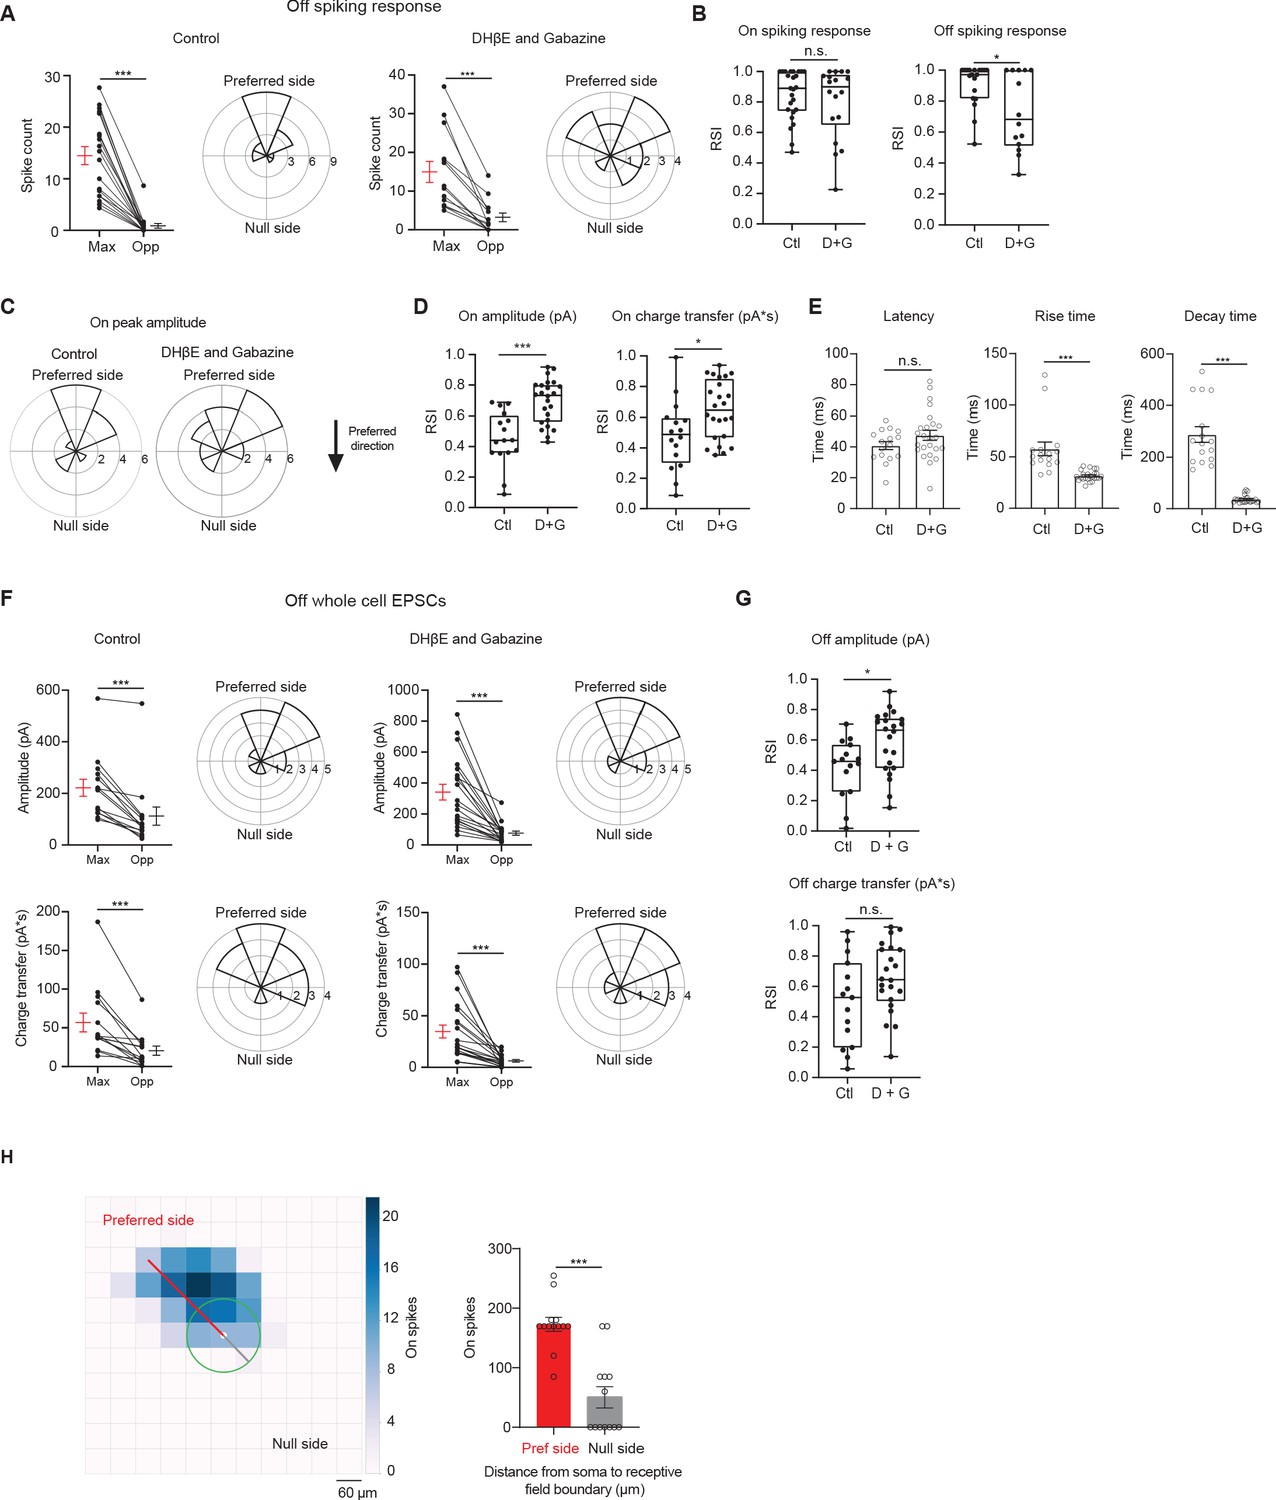
(A) Left: Pairwise comparison of Off mean spike counts in regions evoking the maximum number of spikes (Max) and the opposite region (Opp) in the control condition (19 cells) and polar histogram of Max region aligned to the preferred-null motion axis in the control condition. Radius indicates number of cells. Right: same as left, but in the DHβE + Gabazine condition (14 cells). (B) Left: Regional Selectivity Index (RSI, defined as (Max – Opp)/(Max + Opp)) of On spiking responses in the control (Ctl, 25 cells) and DHβE + Gabazine (D + G, 18 cells) conditions (p=0.29). Right: Same as left, but for the Off spiking response (*p=0.011). (C) Polar histograms of Max region locations determined by On EPSC peak amplitude aligned to the preferred-null motion axis in the control (left) and DHβE + Gabazine (right) conditions. Radius indicates number of cells. (D) RSI of On EPSC peak amplitude and charge transfer in control condition (16 cells) and DHβE + Gabazine (24 cells) conditions (charge transfer, *p=0.02). (E) Left: Latency of On EPSC response in control condition and DHβE + Gabazine conditions (p=0.15). Middle: Same as left, but for rise time (10%–90%). Right: Same as left but for decay time (90%–10%). (F) Top left: Pairwise comparison of Off amplitude responses in the Max and Opp regions and the polar histograms of Max regions aligned to the preferred-null motion axis in the control condition. Radius indicates number of cells. Bottom left: Pairwise comparison of Off charge transfer responses in the Max and Opp regions and the polar histograms of Max regions aligned to the preferred-null motion axis in the control condition. Top right: Same as top left, but in DHβE + Gabazine. Bottom right: Same as bottom left, but in DHβE + Gabazine. (G) Same as D but for Off EPSCs (amplitude *p=0.014, charge transfer p=0.069). (H) Left: Spiking receptive field color map to 60 µm flashing spots. White circle represents soma. Green circle represents average pDSGC dendritic span. Right: Pairwise comparison of the distance to the receptive field boundary on the preferred and null sides (13 cells). Summary statistics are mean ± SEM, ***p<0.001 except where specified otherwise.
-
Figure 1—figure supplement 1—source data 1
pDSGCs have spatially asymmetric RFs.
- https://cdn.elifesciences.org/articles/68181/elife-68181-fig1-figsupp1-data1-v2.xlsx
Figure 2 with 1 supplement
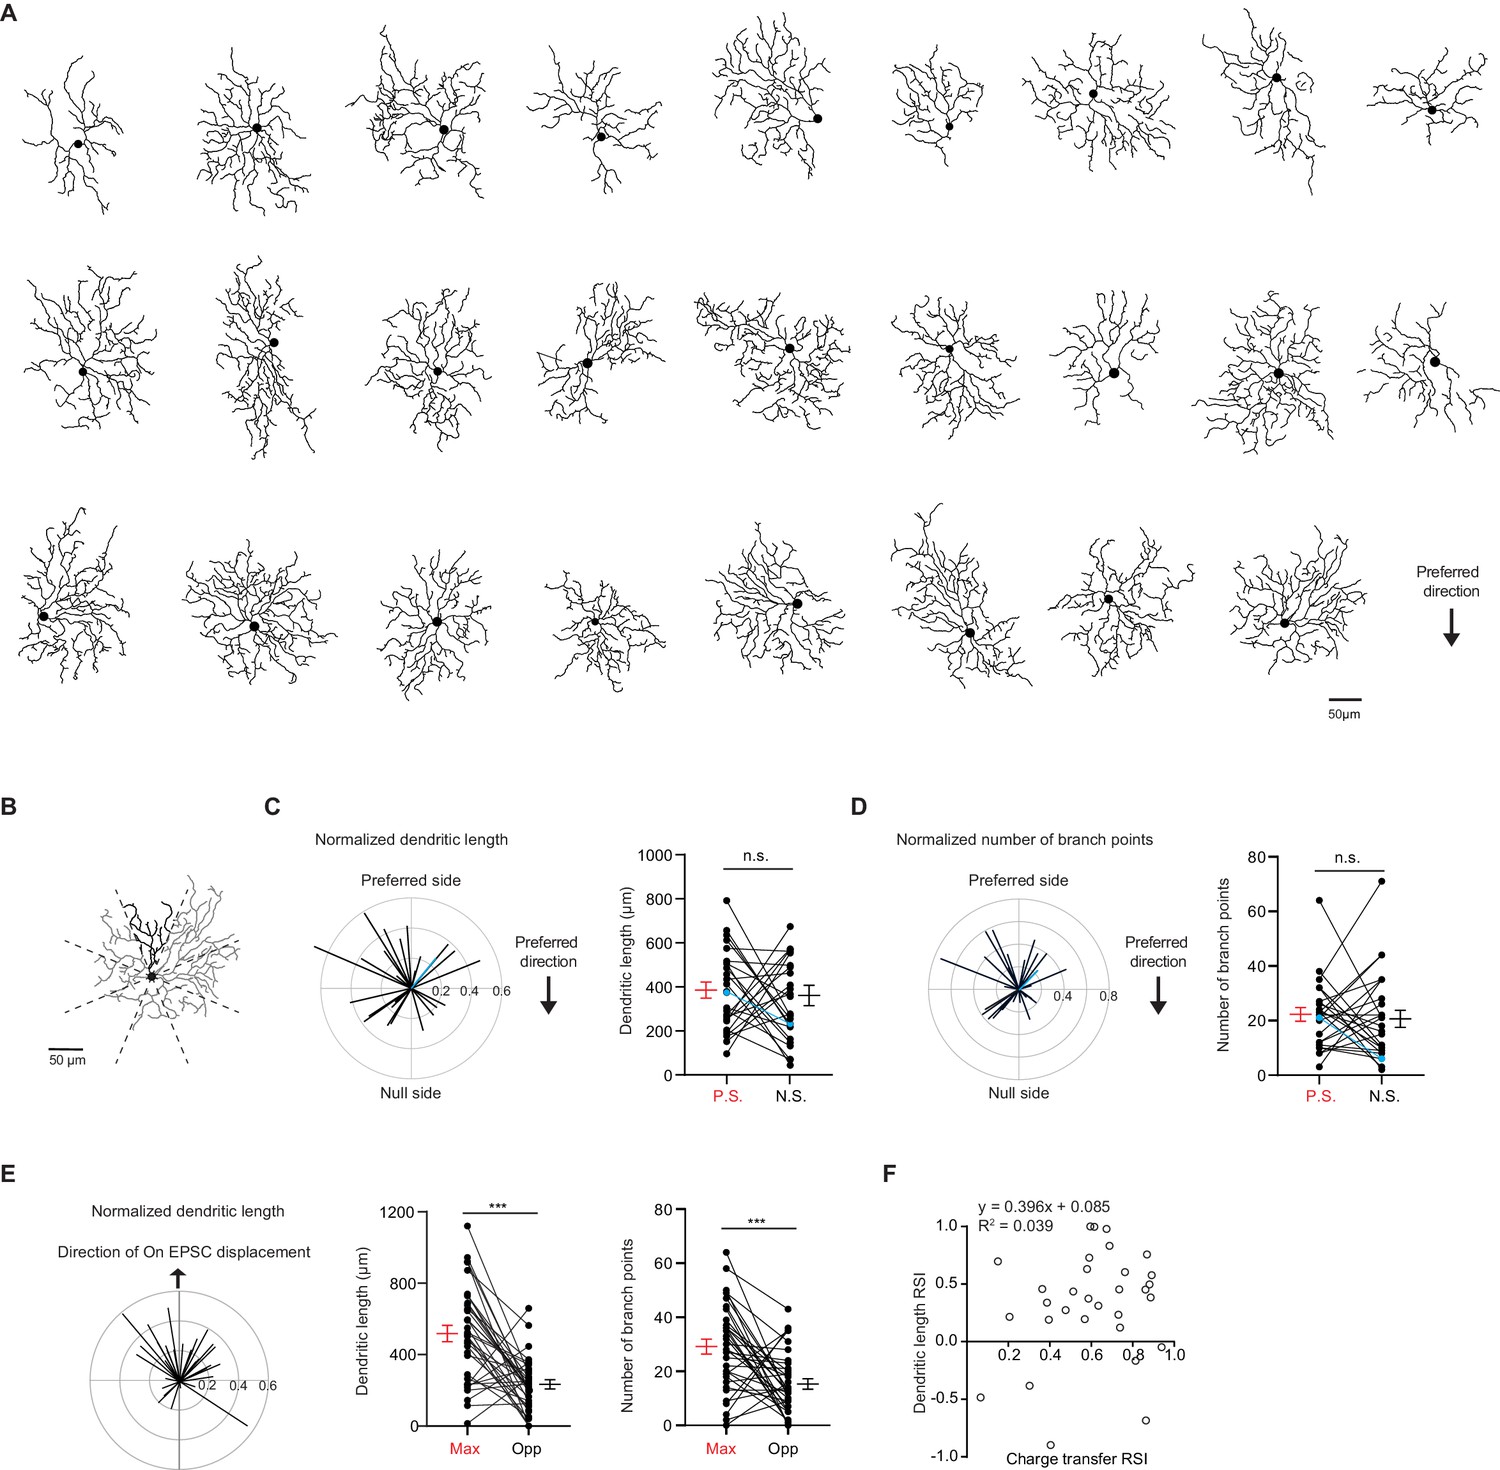
pDSGC dendritic morphology does not show a spatial bias toward the preferred side.
(A) Traced On layer dendritic morphologies of pDSGCs aligned to their preferred-direction motion. (B) Example On morphology of a pDSGC cell divided into eight sectors for calculating normalized dendritic length vector and pairwise comparisons. (C) Left: Normalized vector sum of On dendritic length aligned to pDSGCs’ preferred direction motion. Right: Pairwise comparison of dendritic length on the preferred vs null sides of each cell (26 cells, p=0.70). Blue represents example cell in B. (D) Left: Normalized vector sum of On branch points aligned to pDSGCs’ preferred direction motion. Right: Pairwise comparison of branch points on the preferred vs null side (26 cells, p=0.68). Blue represents example cell in B. (E) Left: Normalized vector sum plot of On dendritic length in eight sectors aligned to the region evoking maximal glutamatergic EPSC (upward arrow). Middle: Total dendritic length in the region evoking maximal glutamatergic EPSC as determined by peripheral spot stimulus (Max) and opposite region (Opp) (31 cells, ***p<0.001). Right: Total number of branch points in the Max and Opp regions (31 cells, ***p<0.001). (F) On dendritic length RSI versus On EPSC charge transfer RSI (31 cells). RSI is based on regions evoking maximal glutamatergic charge transfer responses and opposite regions. Summary statistics are mean ± SEM.
-
Figure 2—source data 1
pDSGC dendritic morphology does not show a spatial bias toward the preferred side.
- https://cdn.elifesciences.org/articles/68181/elife-68181-fig2-data1-v2.xlsx
Figure 2—figure supplement 1
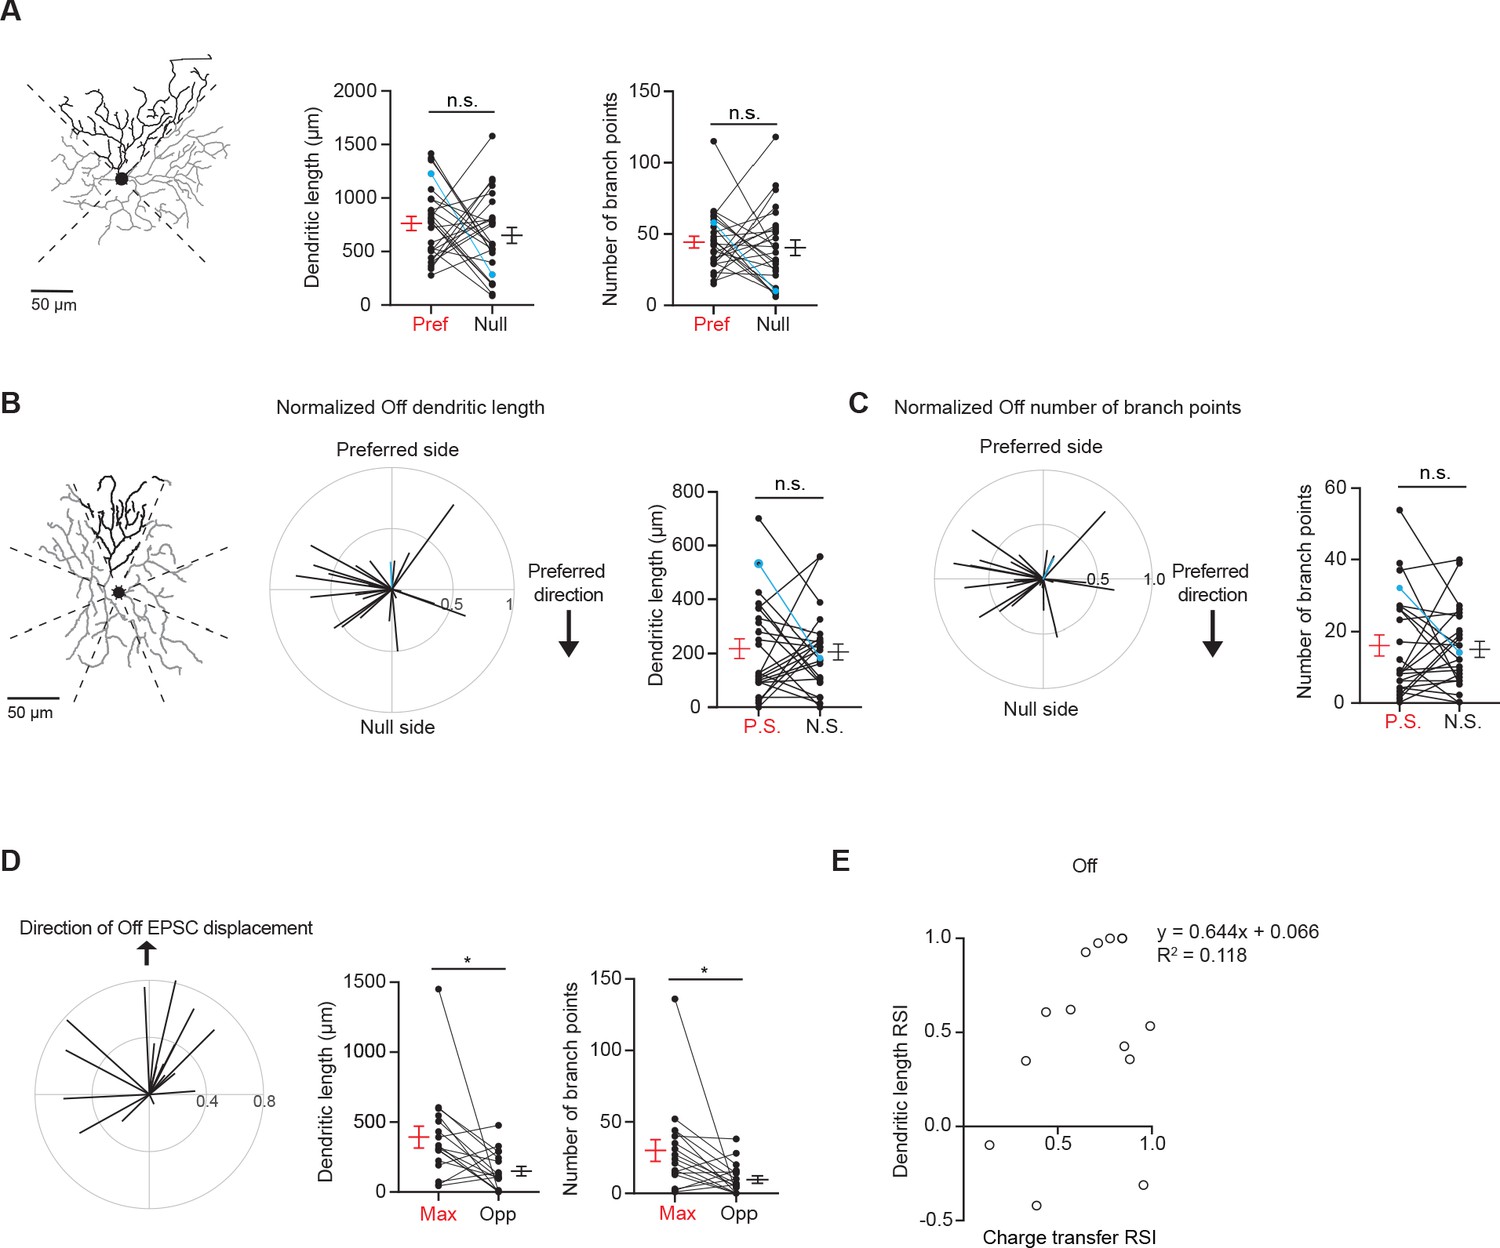
Off dendritic morphology shows spatial bias along glutamatergic receptive field but not global preferred-null motion axis.
(A) Left: Example morphology of a pDSGC On layer divided into quadrants. Middle: Pairwise comparison of dendritic length on the preferred vs null sides of each cell (26 cells, p=0.33). Right: Total number of branch points on the preferred vs null sides of each cell (26 cells, p=0.25). Example cell in blue. (B) Left: Example morphology of pDSGC Off layer divided into eighths. Middle: Normalized vector sum of Off dendritic length aligned to pDSGCs’ preferred direction motion. Right: Pairwise comparison of Off dendritic length on the preferred vs null sides of each cell (24 cells, p=0.78). (C) Same as B but for number of Off branch points (24 cells, p=0.73). (D) Left: Normalized vector sum plot of Off dendritic length in eight sectors aligned to the region evoking maximal glutamatergic EPSC (upward arrow). Middle: Total dendritic length in the region evoking maximal glutamatergic EPSC as determined by peripheral spot stimulus (Max) and opposite region (Opp). Right: Total number of branch points in the Max and Opp regions (17 cells, dendritic length *p=0.018, branch points *p=0.027). (E) Off dendritic length RSI versus Off EPSC charge transfer RSI (14 cells). RSI is based on regions evoking maximal glutamatergic charge transfer responses and opposite regions. Summary statistics are mean ± SEM.
-
Figure 2—figure supplement 1—source data 1
Off dendritic morphology shows spatial bias along glutamatergic receptive field but not global preferred-null motion axis.
- https://cdn.elifesciences.org/articles/68181/elife-68181-fig2-figsupp1-data1-v2.xlsx
Figure 3 with 1 supplement
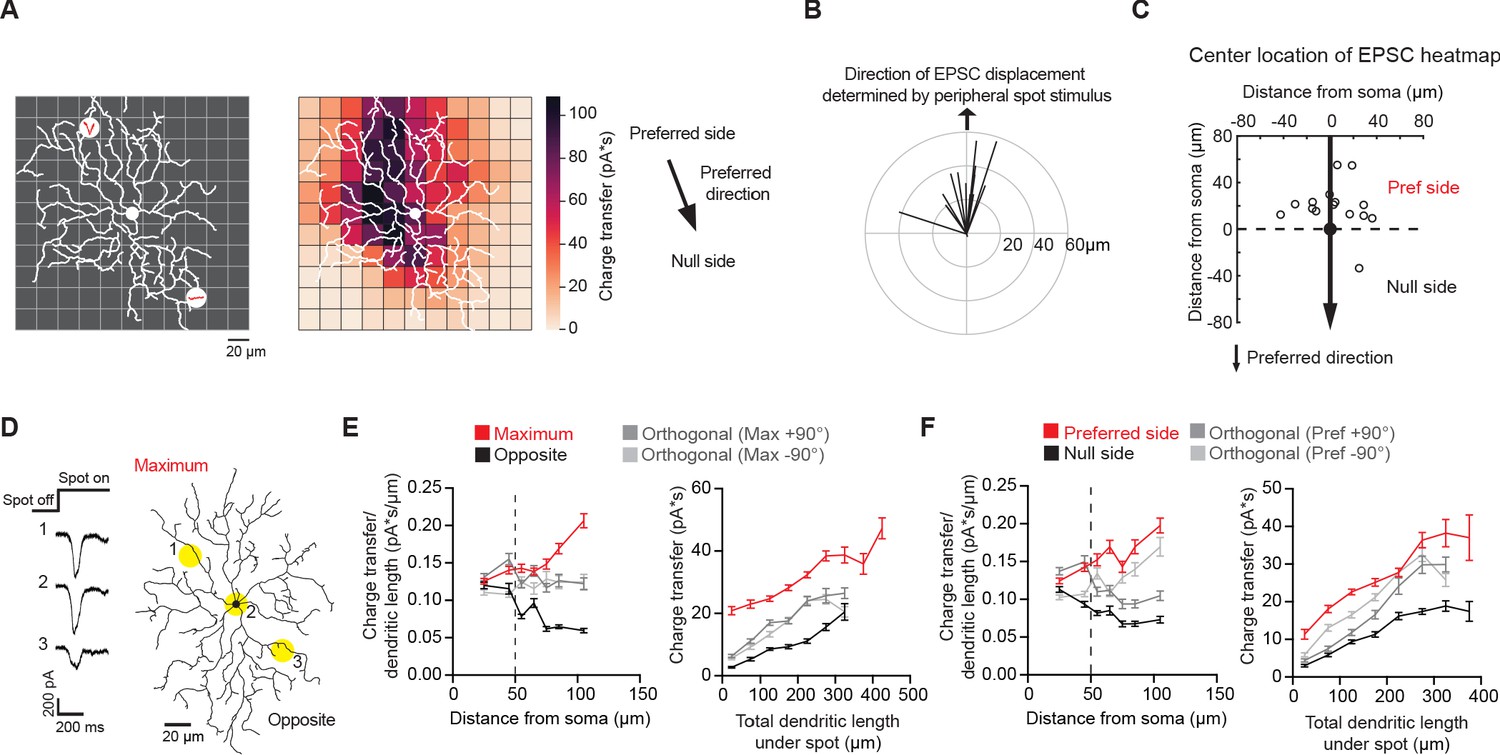
Non-uniform glutamatergic synaptic excitation across pDSGC dendritic span contributes to skewed excitatory receptive field.
(A) Left: Schematic for small spot RF mapping experiment in DHβE + Gabazine. Middle: Example heat map. Right: Preferred motion direction of the example cell in relation to the preferred side and the null side of the cell’s RF. (B) Vector sum plot of On EPSC charge transfer center of mass determined by small spot RF mapping aligned to the region where a peripheral spot evokes the maximum glutamatergic EPSC (upward arrow). (C) Spatial locations showing centers of mass of glutamatergic excitatory On charge transfer obtained from experiments illustrated in A aligned to each cell’s preferred motion direction (15 cells). (D) Example On EPSC responses to spots presented to a pDSGC along the maximum-opposite axis of glutamatergic RF displacement. (E) Left: On ‘EPSC current density’ (i.e. ratio of charge transfer per dendritic length) versus distance from soma along the maximum-opposite axis of glutamatergic RF displacement (16 cells, ***p<0.001) as well as along the orthogonal axis. Right: Summary plot of glutamatergic charge transfer as a function of total dendritic length centered around the flashing spot for spots shown more than 50 μm away from the soma (16 cells, ***p<0.001). (F) Same as E but along the preferred-null motion axis (15 cells, charge transfer/dendritic length vs distance from soma **p=0.0026, charge transfer vs dendritic length ***p<0.001). Summary statistics are mean ± SEM.
-
Figure 3—source data 1
Non-uniform glutamatergic synaptic excitation across pDSGC dendritic span contributes to skewed excitatory receptive field.
- https://cdn.elifesciences.org/articles/68181/elife-68181-fig3-data1-v2.xlsx
Figure 3—figure supplement 1
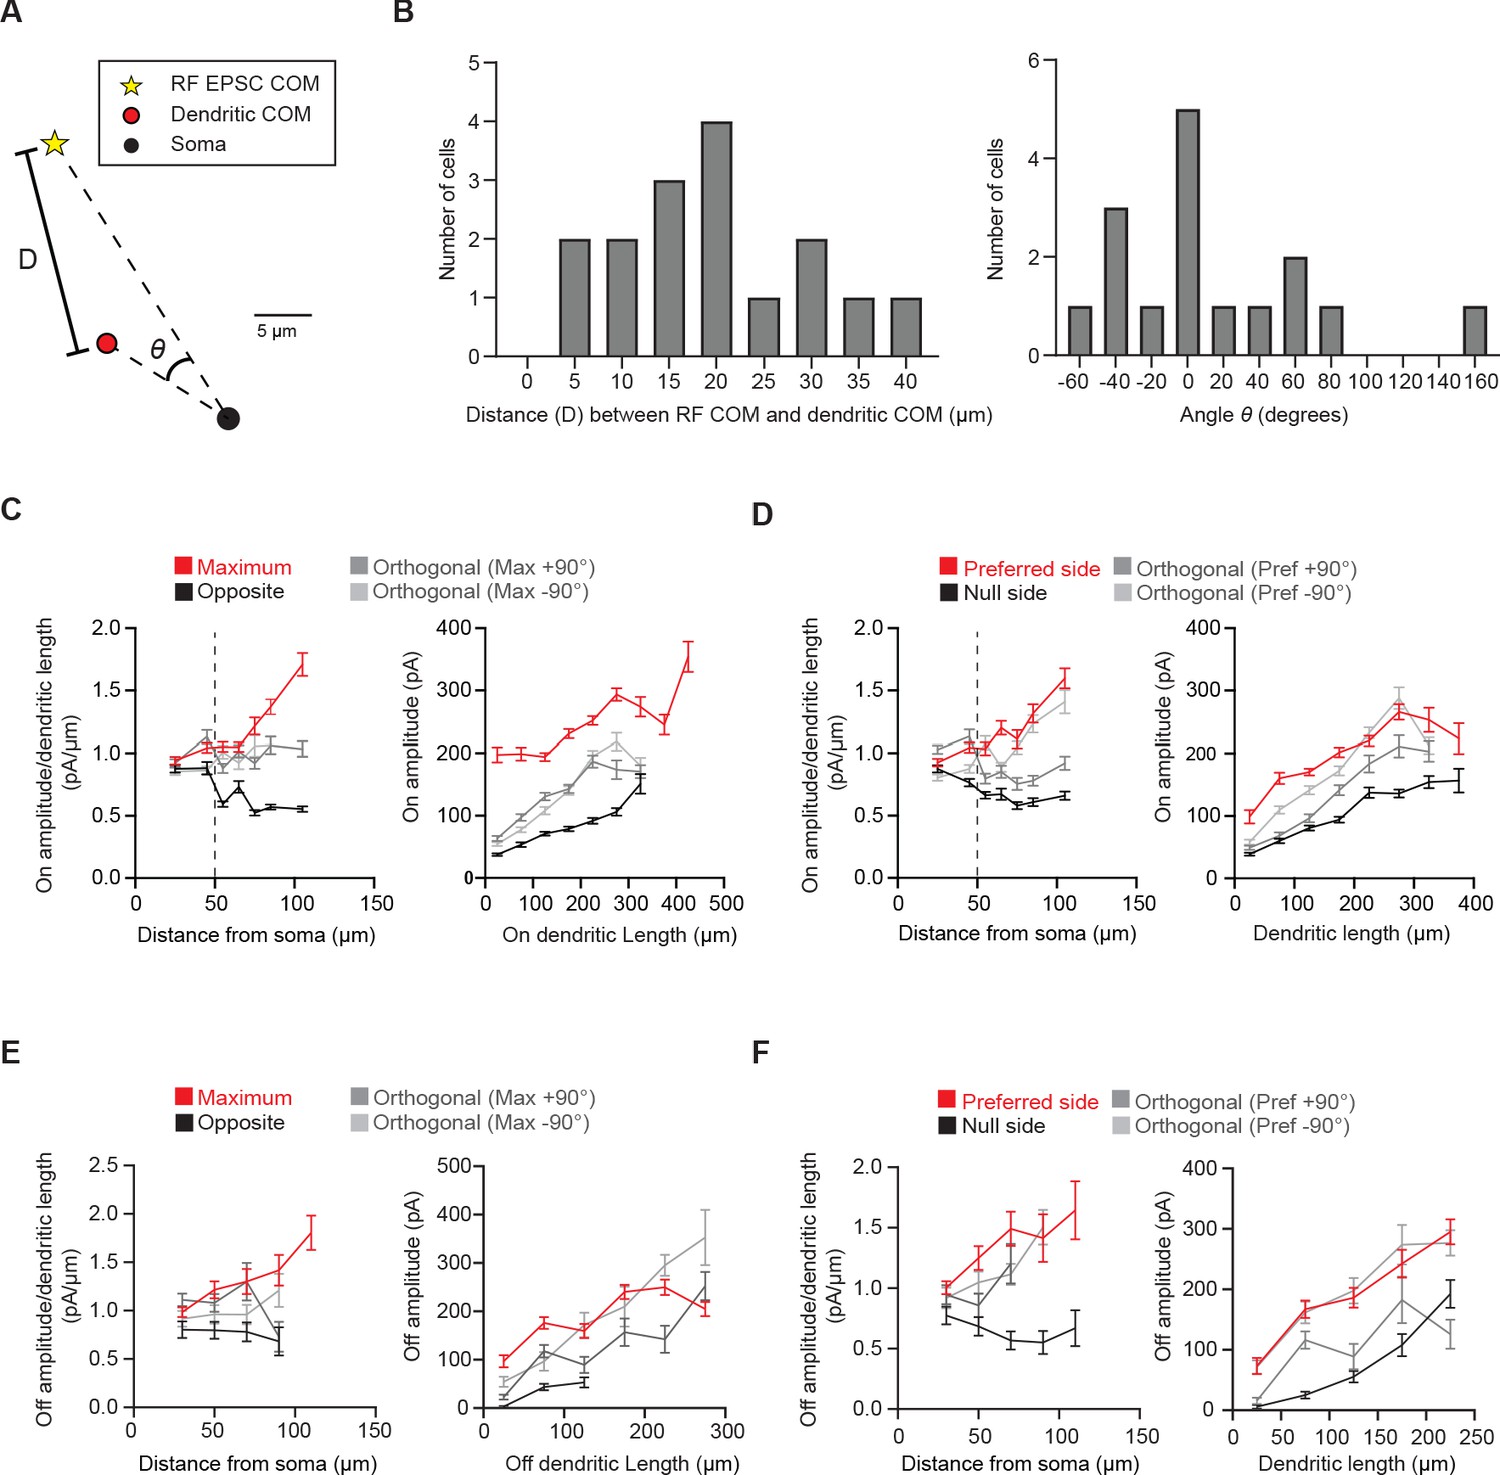
pDSGC glutamatergic synaptic excitation is displaced relative to the dendritic field.
(A) The dendritic center of mass (red circle) and the RF EPSC charge transfer center of mass (yellow star) of an example pDSGC. (B) Left: Histogram of the distance (D) between the dendritic center of mass and the EPSC charge transfer center of mass of each pDSGC. Right: Histogram of the angle difference (θ) between the EPSC charge transfer center of mass and the dendritic center of mass. D and θ values are illustrated in A. (C) Left: Ratio of On amplitude per On dendritic length versus distance from soma in the region evoking the maximum glutamatergic EPSC response (Maximum) and the opposite region (Opposite) (left, 16 cells, **p=0.010) as well as the orthogonal regions. Right: Quantification of amplitude per dendritic length in those regions for spots presented at least 50 μm away from the soma (right, 16 cells, ***p<0.001). (D) Same as C but for the preferred-null motion axis. (15 cells, amplitude/dendritic length vs distance **p=0.001, amplitude vs dendritic length ***p<0.001). (E) Same as C except for Off dendrites and EPSCs (9 cells, right ***p<0.001 and left *p=0.037). (F) Same as D but for Off dendrites and EPSCs (9 cells, right ***p<0.001 and left *p=0.047). Summary statistics are mean ± SEM.
-
Figure 3—figure supplement 1—source data 1
pDSGC glutamatergic synaptic excitation is displaced relative to the dendritic field.
- https://cdn.elifesciences.org/articles/68181/elife-68181-fig3-figsupp1-data1-v2.xlsx
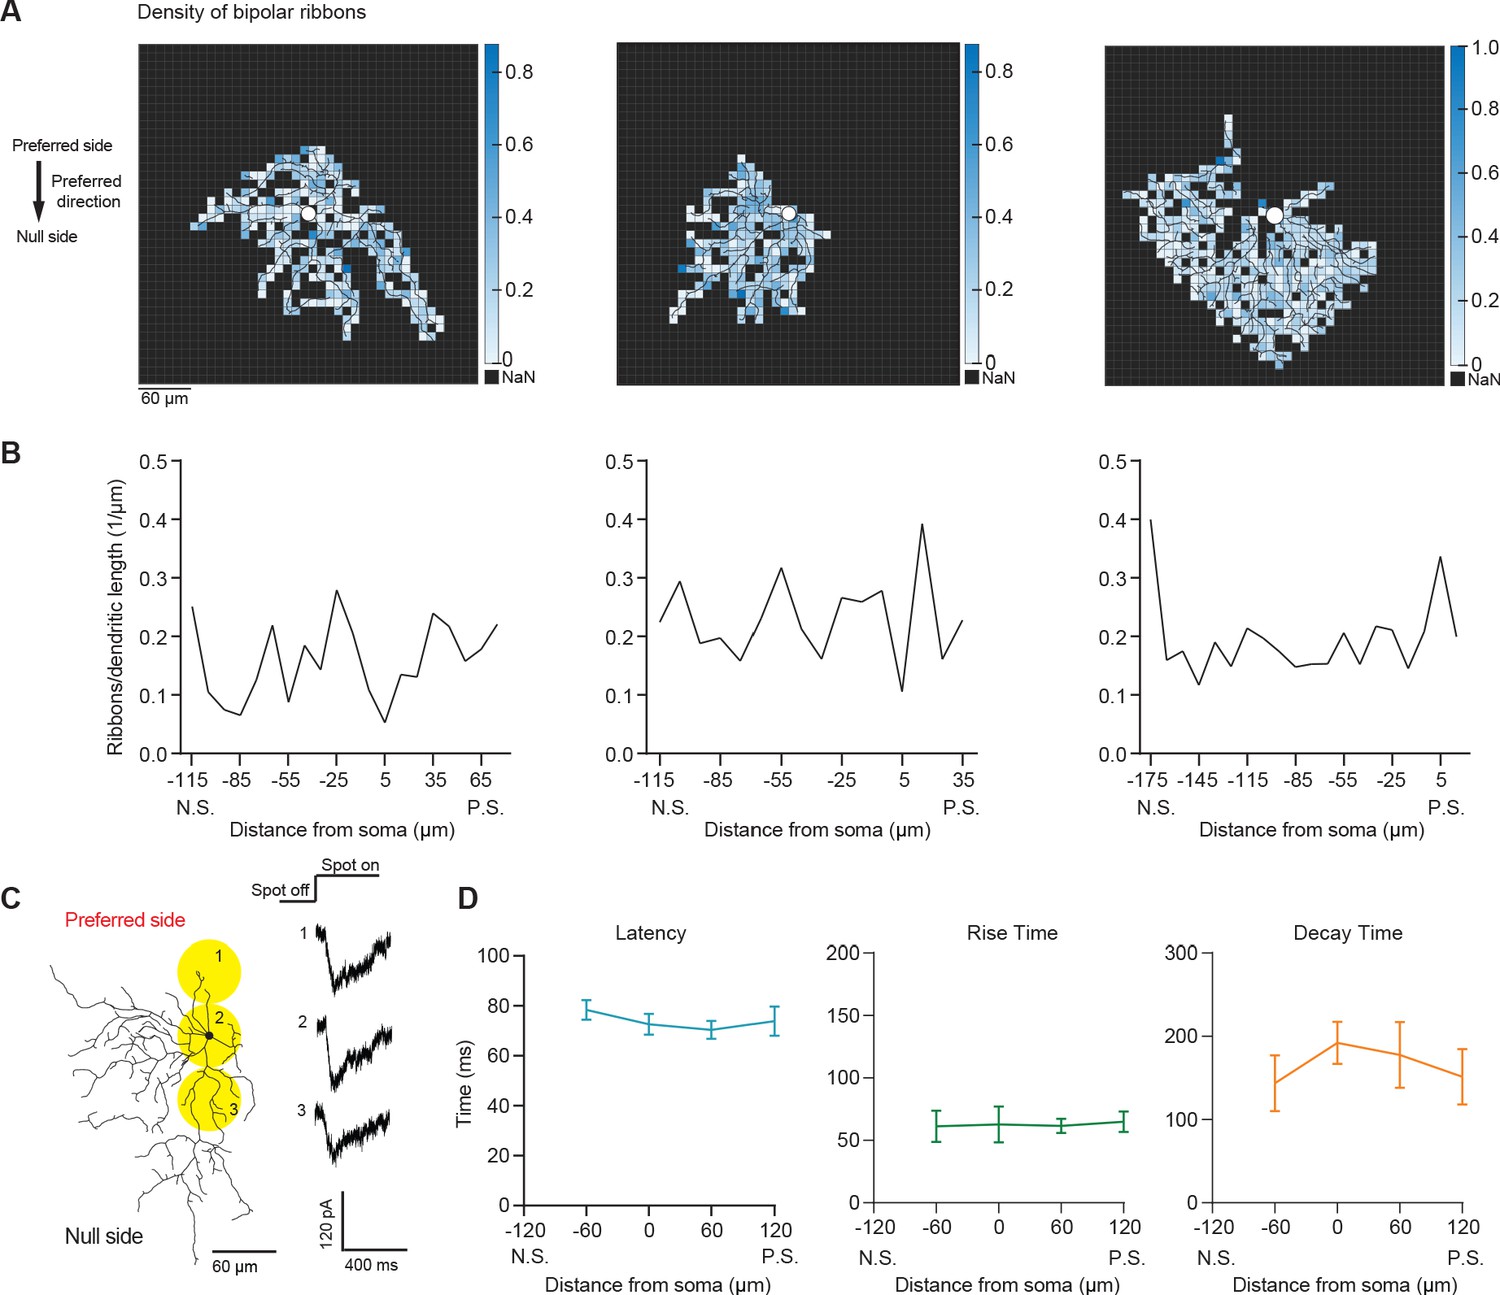
Figure 4 with 1 supplement

Neither the density of bipolar ribbon inputs nor the kinetics of glutamatergic EPSCs varies systematically along the axis of RF displacement.
(A) Top: Distribution of ribbon synaptic input to one of the three reconstructed On-Off DSGCs. (B) Ultrastructure of the synapse indicated by the red arrow in A, as visualized by serial block-face electron microscopy. The presynaptic bipolar cell (green) belongs to Type 5t. Red arrow marks the ribbon. The magenta profile belongs to the On-Off DSGC. The other postsynaptic partner at this dyad synapse was another ganglion cell (yellow). Although only a fragment was included in the volume, it was presumably a DSGC, since it costratified entirely with the inner dendrites of the On-Off DSGC (A; black dendrites). (C) SAC inputs onto example On-Off DSGC. Red arrows indicate the direction and location of the SAC inputs on the DSGC dendrites. (D) Density map of bipolar ribbon synapses for three example On-Off DSGCs with estimated preferred directions along the posterior-anterior axis (see Methods). The soma location is indicated by the white spot in the center. (E) Bipolar ribbon heat map for the three example cells, respectively. The number of ribbons in each square are indicated. (F) Quantification of ribbon density across the preferred-null axis, respectively. The soma location is at 0. (N.S. = null side, P.S. = preferred side). (G) Left: Summary of latency of glutamatergic EPSC responses along the maximum-opposite axis (Max = maximum glutamatergic EPSC region, Opp = opposite region) (16 cells, p=0.75). Right: Summary of latency along the preferred-null motion axis (N.S. = null side, P.S. = preferred side)(15 cells, p=0.88). (H) Same as in G, except for rise time (10%–90%). (Left: p=0.12, right: p=0.21). (I) Same as in G, except for decay time (90%–30%). (Left: p=0.25, right: p=0.26). Summary statistics are mean ± SEM.
-
Figure 4—source data 1
Neither the density of bipolar ribbon inputs nor the kinetics of glutamatergic EPSCs varies systematically along the axis of RF displacement.
- https://cdn.elifesciences.org/articles/68181/elife-68181-fig4-data1-v2.xlsx
Figure 4—figure supplement 1
Bipolar ribbon density does not consistently change across the preferred-null motion axis.
(A) Density map of bipolar ribbon synapses for three example cells based on the published connectomic dataset (Ding et al., 2016). Each square is 10 × 10 μm. (B) Quantification of ribbon density across the preferred-null motion axis. The soma location is at 0. (N.S. = null side, P.S. = preferred side). (C) Example glutamatergic EPSC responses to spots presented on the preferred and null sides of a pDSGC in DHβE. (D) Summary plots of latency (p=0.45), rise time (10%–90%; p=0.85), and decay time (90%–30%; p=0.93) of glutamatergic EPSC responses along the preferred-null motion axis (N.S. = null side, P.S. = preferred side)(9 cells). Summary statistics are mean ± SEM.
-
Figure 4—figure supplement 1—source data 1
Bipolar ribbon density does not consistently change across the preferred-null motion axis.
- https://cdn.elifesciences.org/articles/68181/elife-68181-fig4-figsupp1-data1-v2.xlsx
Figure 5 with 2 supplements
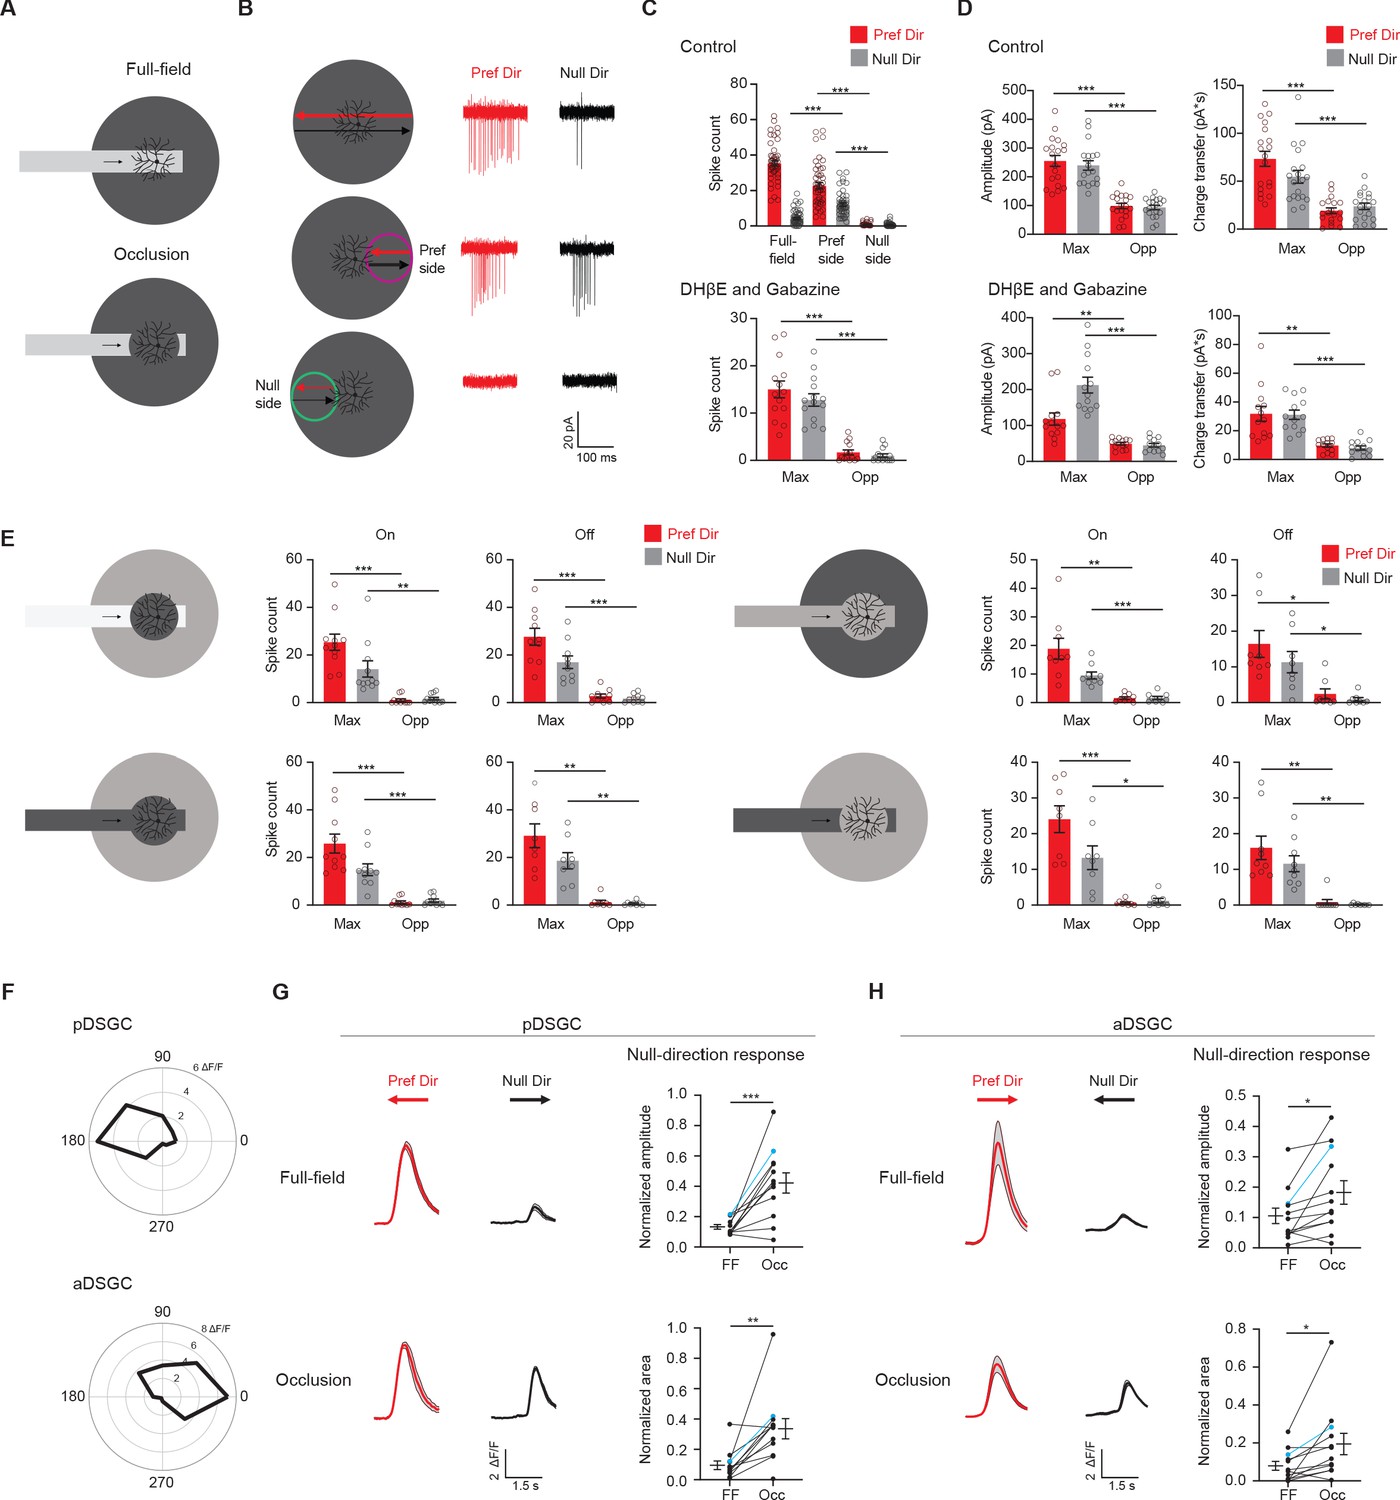
Displaced excitatory receptive field contributes to null-direction responses in the preferred region.
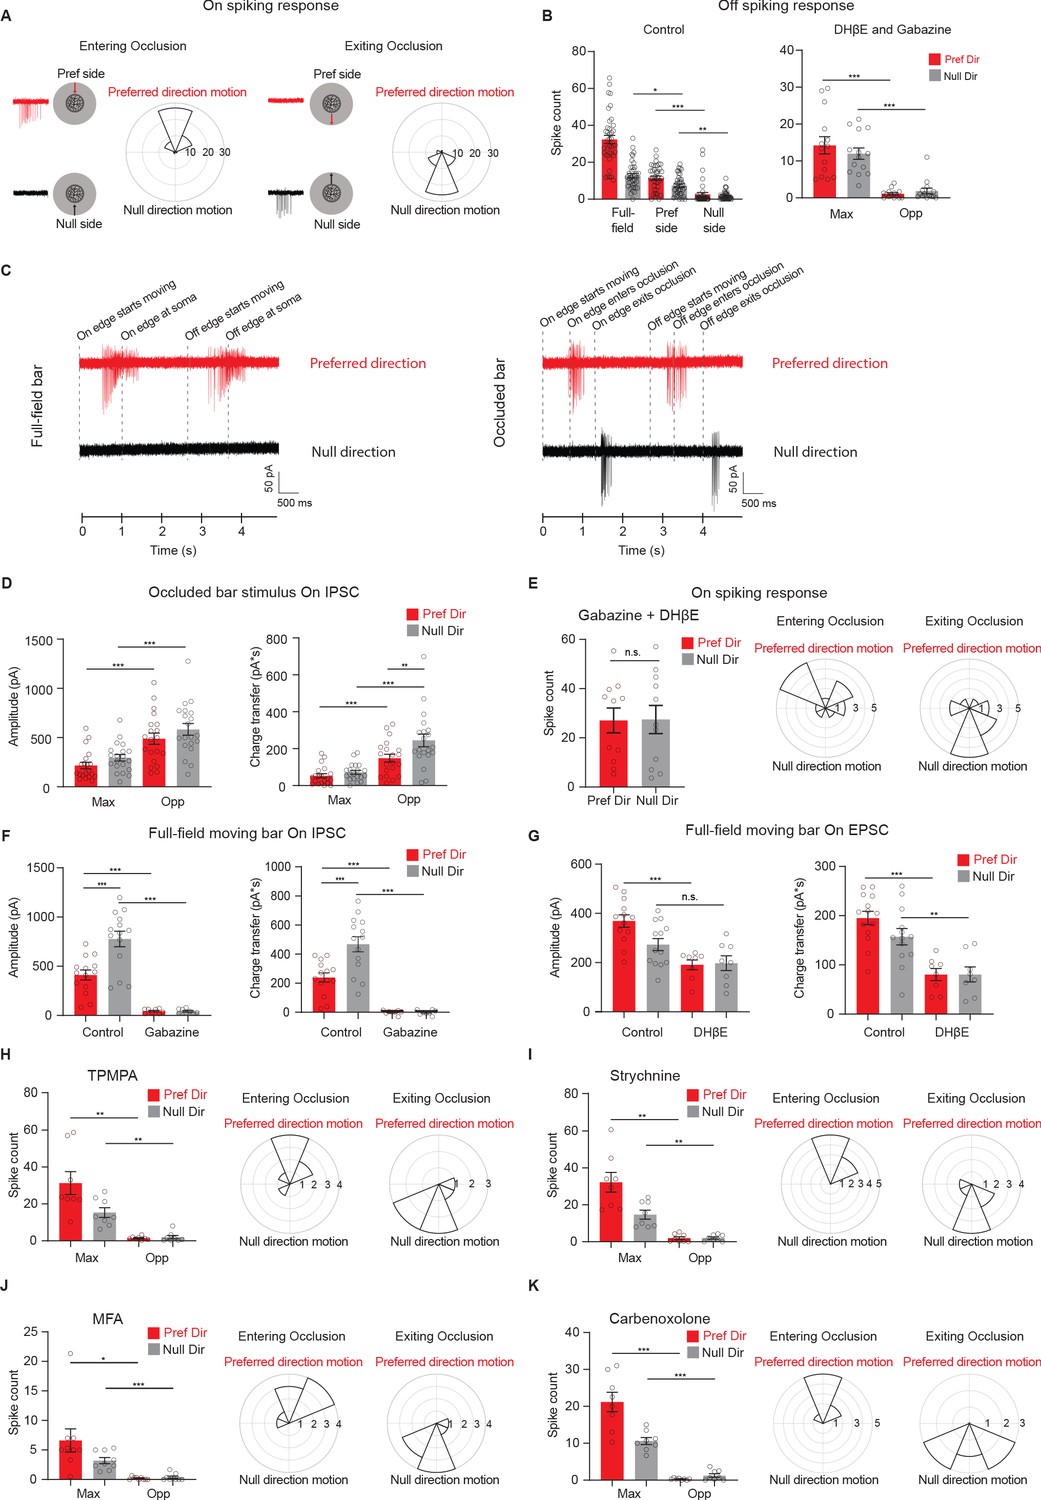
(A) Full-field moving bar and occluded bar stimuli. (B) Example On spiking responses of a pDSGC to full-field bar (top) and occluded bar stimulus (middle, bottom) moving in the preferred (red) and null (black) directions. (C) Top: Mean spike counts of pDSGCs to the full-field moving bar (full-field) and the occluded moving bar on the preferred side and null side (48 cells). Bottom: Mean spike counts in DHβE + Gabazine to the occluded bar stimulus in the region evoking the maximum spiking (Max) and the opposite region (Opp) (14 cells). (D) Mean pDSGC EPSC peak amplitude and charge transfer in the region evoking the maximum response (Max) and the opposite region (Opp) in the control (top, 19 cells) and DHβE + Gabazine (bottom, 13 cells) conditions. (In DHβE + Gabazine: Pref Dir – Max vs Pref Dir – Opp amplitude **p=0.0028, Pref Dir – Max vs Pref Dir – Opp charge transfer **p=0.0012). (E) Mean On and Off spiking responses to occluded bar stimuli at different contrast configurations. Top left: On: 11 cells, Max null dir. Vs Opp null dir. **p=0.008. Off: 10 cells. Bottom left: On: 10 cells. Off: 8 cells. Top right: On: 9 cells, Max pref. dir. Vs. Opp pref. dir. **p=0.003. Off: 8 cells, Max pref. dir. Vs Opp. Pref. dir. *p=0.034, Max null dir. Vs Opp null dir. *p=0.02. Bottom right: On: 8 cells, Max null dir vs Opp null dir. *p=0.014. Off: 9 cells, Max pref. dir. Vs Opp pref. dir. **p=0.004, Max null dir. Vs Opp null dir. **p=0.002. (F) Top: Example directional tuning curve of GCaMP6 signal of a pDSGC. Bottom: Example tuning curve of an aDSGC. (G) Top left: Example GCaMP6 fluorescence traces of a pDSGC for the full-field moving bar in the preferred (red) and null (black) directions. Bottom left: Example GCaMP6 traces of the cell for the occluded bar stimulus. Shaded areas represent SEM. Top right: Normalized amplitude of the posterior-preferring cell null-direction response during the full-field bar and the occluded bar (12 cells). Bottom right: Normalized area of the null-direction response during the full-field bar and the occluded bar (12 cells, **p=0.0035). (H) Same as in G, except for aDSGCs (12 cells, normalized amplitude *p=0.013, normalized area *p=0.019). Summary statistics are mean ± SEM, ***p<0.001 except where specified otherwise.
-
Figure 5—source data 1
Displaced excitatory receptive field contributes to null-direction responses in the preferred region.
- https://cdn.elifesciences.org/articles/68181/elife-68181-fig5-data1-v2.xlsx
Figure 5—figure supplement 1
Displaced glutamatergic excitation contributes to null-direction responses in the preferred region.
(A) Polar histograms of spiking vector sum locations when the bar enters the occlusion (left) versus when the bar exits the occlusion (right). Radius indicates number of cells. (48 cells). Responses are aligned to the preferred direction, which points to the top. (B) Left: Mean Off spike counts of pDSGCs to the full-field moving bar and the occluded moving bar stimulus on the preferred side and null side (39 cells, Full-field null dir. vs preferred side null dir. **p=0.01, preferred side null. dir. vs null side null. dir. **p=0.005). Right: Mean Off spike counts in DHβE + Gabazine to the occluded bar stimulus in the region evoking the maximum spiking (Max) and the opposite region (Opp) (14 cells). (C) Left: Example spiking traces to the full-field moving bar. Right: Example spiking traces to the occluded bar stimulus. (D) Mean On IPSC peak amplitude (left) and charge transfer (right) to the occluded bar in the region evoking the maximum EPSC response (Max) and the opposite region (Opp) (20 cells). (E) Left: Mean spike counts to the full-field moving bar in DHβE + Gabazine (11 cells, p=0.84). Middle and Right: Polar histograms of spiking vector sum locations when the bar enters the occluder and exits the occluder. Radius indicates number of cells (14 cells). (F) Mean On IPSC peak amplitude (left) and charge transfer (right) to a full-field bar in the control (14 cells) and Gabazine conditions (8 cells). (G) Mean On EPSC peak amplitude (left) and charge transfer (right) to a full-field bar in the control (13 cells) and DHβE conditions (8 cells). For amplitude: Control null dir. vs DHβE null dir. p=0.099. For charge transfer: Control null dir. vs DHβE null dir. **p=0.003. (H) Left: Mean spike counts to the bar entering and exiting the occluder in TPMPA (right, 8 cells, Pref Dir – Max vs Pref Dir – Opp **p=0.0037. Null Dir – Max vs Null Dir – Opp **p=0.0022). Middle and Right: Polar histograms of spiking vector sum locations when the bar enters the occluder and exits the occluder in TPMPA. Radius indicates number of cells (8 cells). (I) As in H, but in strychnine (8 cells, Pref Dir – Max vs Pref Dir – Opp **p=0.0012. Null Dir – Max vs Null Dir – Opp **p=0.0017). (J) As in H, but in MFA (9 cells, Pref Dir – Max vs Pref Dir – Opp *p=0.021). (K) As in H, but in Carbenoxolone (8 cells). Summary statistics are mean ± SEM, ***p<0.001 except where specified otherwise.
-
Figure 5—figure supplement 1—source data 1
Displaced glutamatergic excitation contributes to null-direction responses in the preferred region.
- https://cdn.elifesciences.org/articles/68181/elife-68181-fig5-figsupp1-data1-v2.xlsx
Figure 5—figure supplement 2
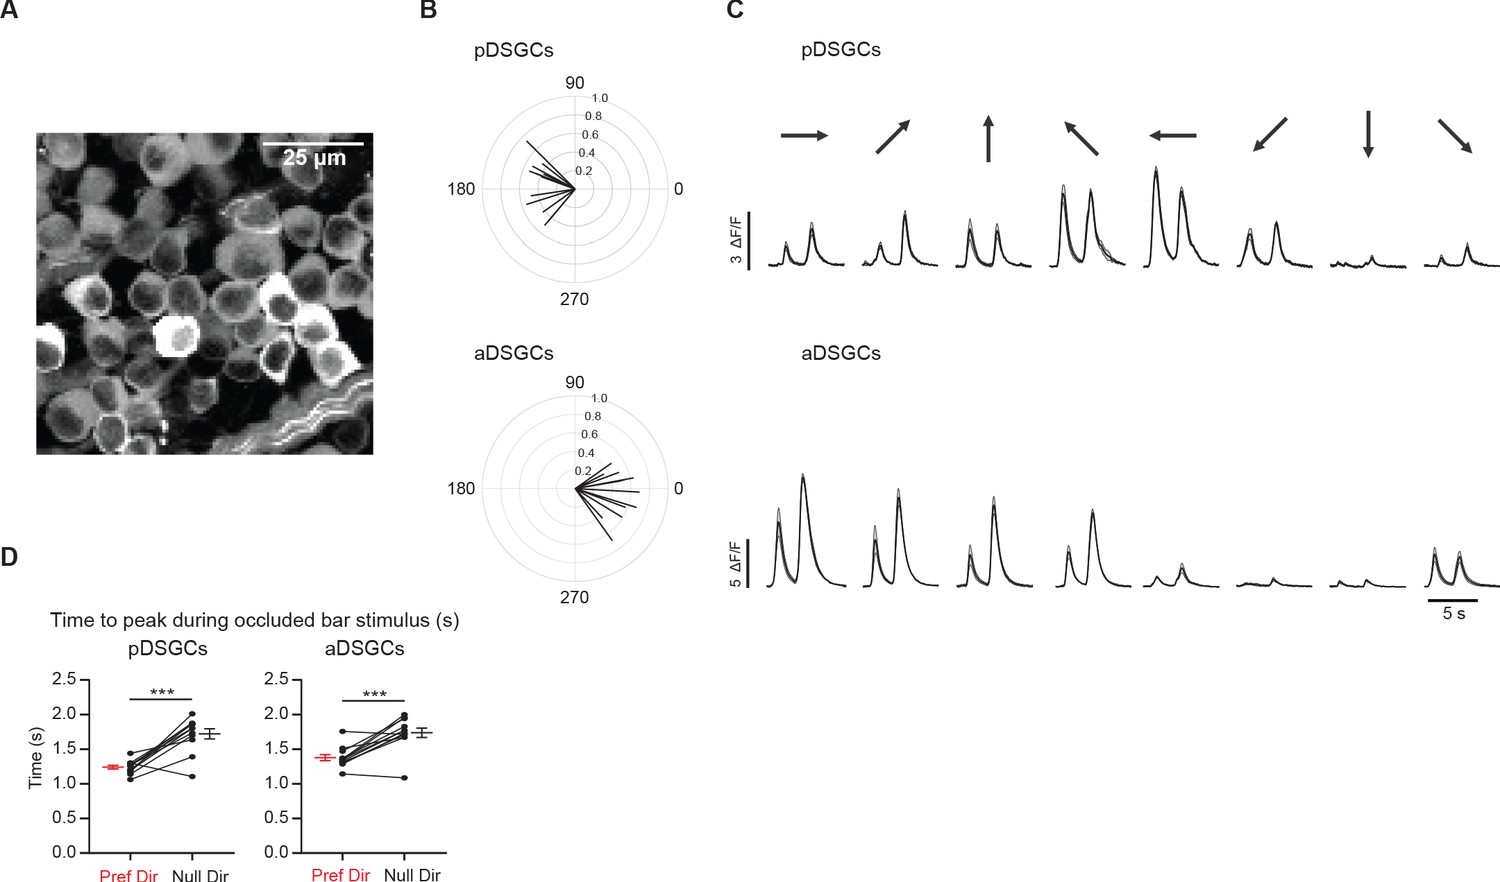
Calcium imaging of anterior and posterior-preferring On-Off DSGCs.
(A) Z-stack standard deviation projection of GCaMP6f-expressing cells in the ganglion cell layer. (B) Top: Vector sum plot of peak calcium signal amplitudes of pDSGCs. Bottom: Vector sum plot of peak amplitudes of aDSGCs. (C) Example calcium traces of a pDSGC (top) and an aDSGC (bottom) to full-field moving bar in eight directions. (D) Left: Preferred direction time to peak vs null direction time to peak during the occluded bar stimulus for pDSGCs (12 cells, ***p<0.001). Right: Same as top but for aDSGCs (12 cells, ***p<0.001). Summary statistics are mean ± SEM.
-
Figure 5—figure supplement 2—source data 1
Calcium imaging of anterior and posterior-preferring On-Off DSGCs.
- https://cdn.elifesciences.org/articles/68181/elife-68181-fig5-figsupp2-data1-v2.xlsx
Figure 6
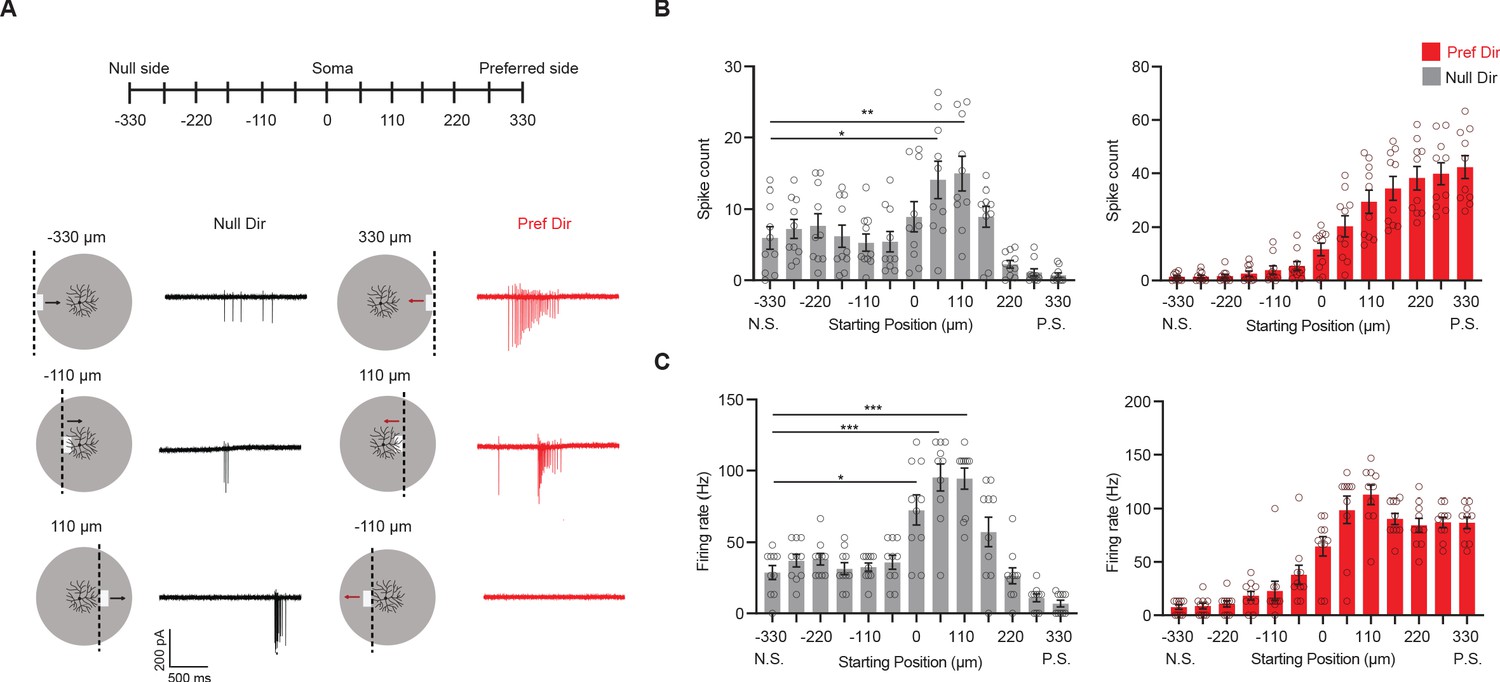
Null-direction response is dependent on start position of emerging bar.
(A) Schematic of moving bars emerging from different locations along the DSGC’s preferred-null motion axis and example spiking responses. The soma location is at 0. Vertical dashed lines on the schematic indicate the positions of the emerging leading edge of the moving bar. (B) Mean spike counts (null direction: −330 vs 55 *p=0.012, –330 vs 110 **p=0.0088) and (C) firing rates (null direction: −330 vs 0 *p=0.014) to bars emerging from different locations along the preferred-null motion axis (10 cells). Summary statistics are mean ± SEM, ***p<0.001 except where specified otherwise.
-
Figure 6—source data 1
Null-direction response is dependent on start position of emerging bar.
- https://cdn.elifesciences.org/articles/68181/elife-68181-fig6-data1-v2.xlsx
Figure 7 with 1 supplement
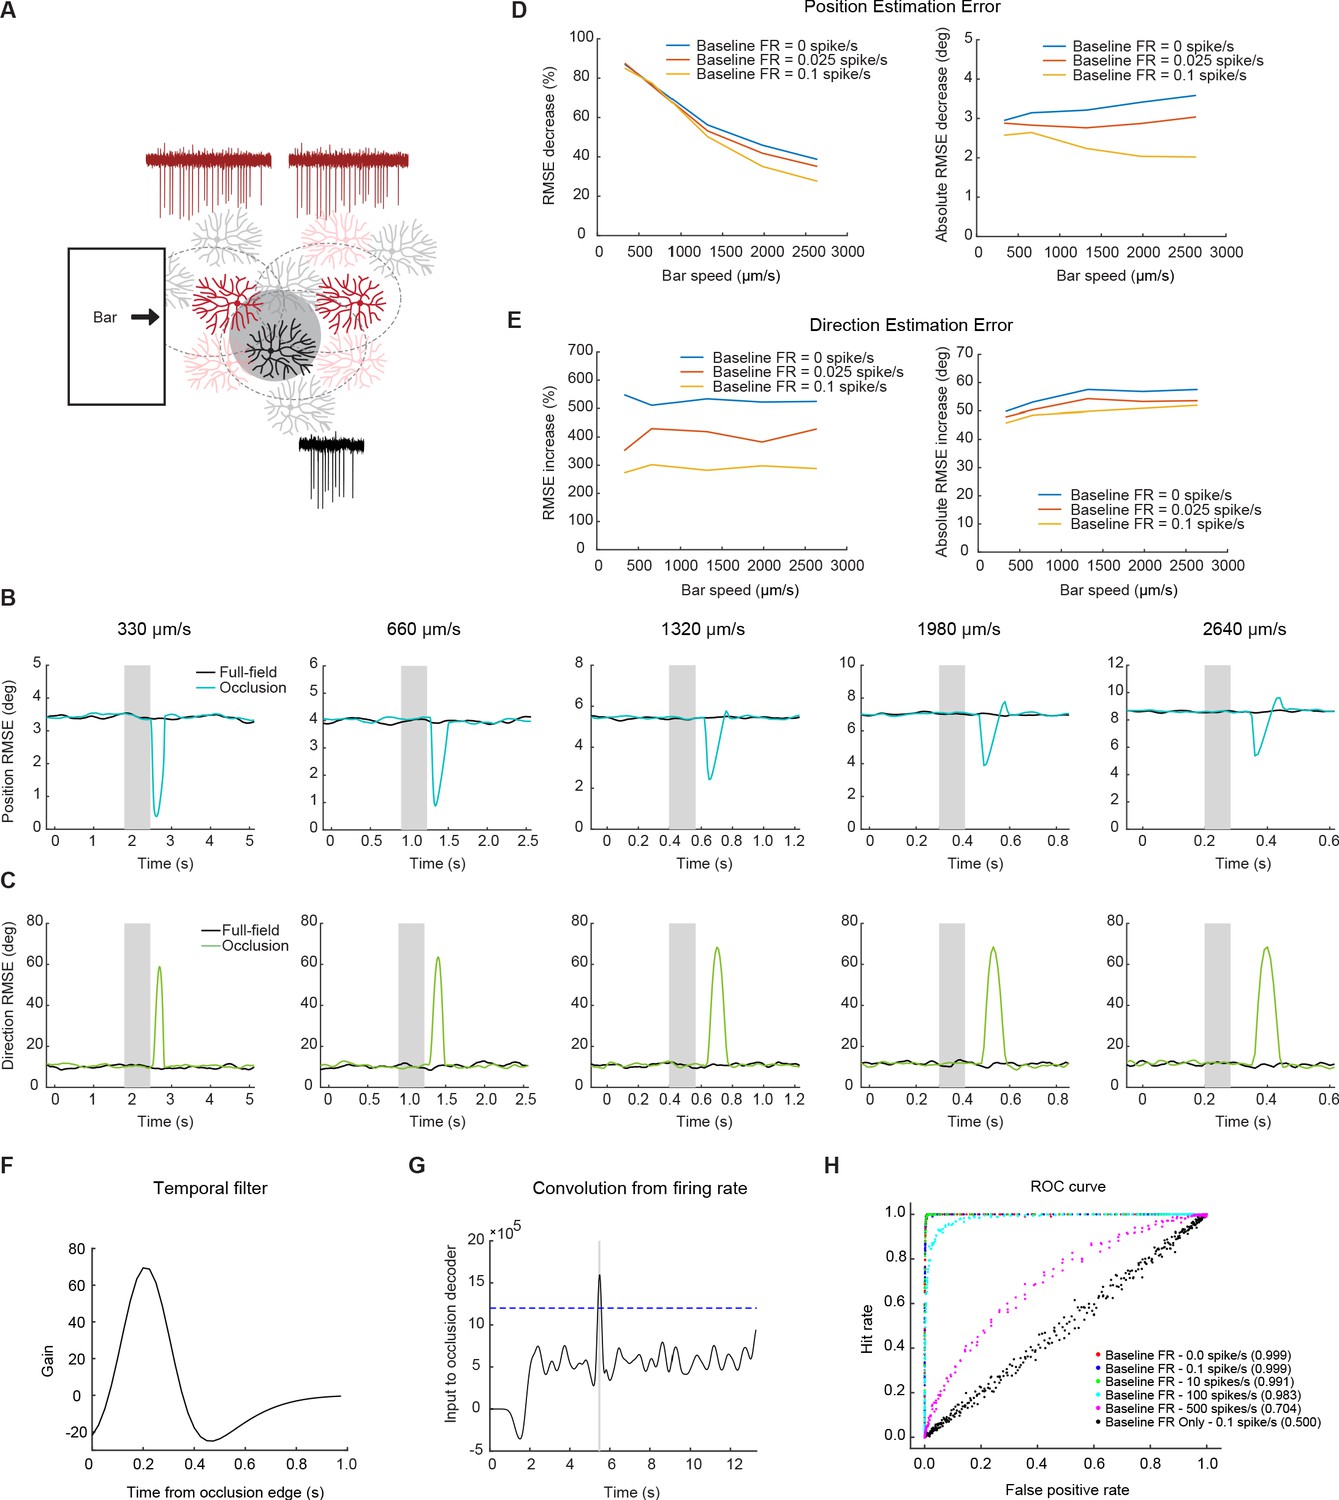
Null-direction spiking of On-Off DSGCs during the occluded motion stimulus improves position estimation.
(A) Schematic of the DSGC population model along with example spike trains for two pDSGCs (red trace showing their preferred-direction responses) and an aDSGC (black trace showing its null-direction response). An occluder 220 µm wide (shaded circle) was placed near the middle of the population. (B) Example root-mean-square error in estimating the position of the light bar’s leading edge for full-field (black) and occluded (blue) motion across different bar speeds. Shaded area indicates the time window during which the moving edge is behind the occluder. (C) Same as in B, but for direction estimation error. (D) Left: Position error percent decrease across speeds. Right: Absolute error in visual angle decrease across bar speeds. (E) Same as in D, but for direction estimation error. Right: Absolute error in motion direction angle. (F) Temporal filter for detecting occlusion response. (G) Convolution of firing rate from the temporal filter. Dashed line represents example threshold. (H) ROC curve with different levels of baseline firing for a bar of speed 330 μm/s. Legend shows performance level of decoder for each level of baseline firing.
Figure 7—figure supplement 1
Model fits to experimental recordings.
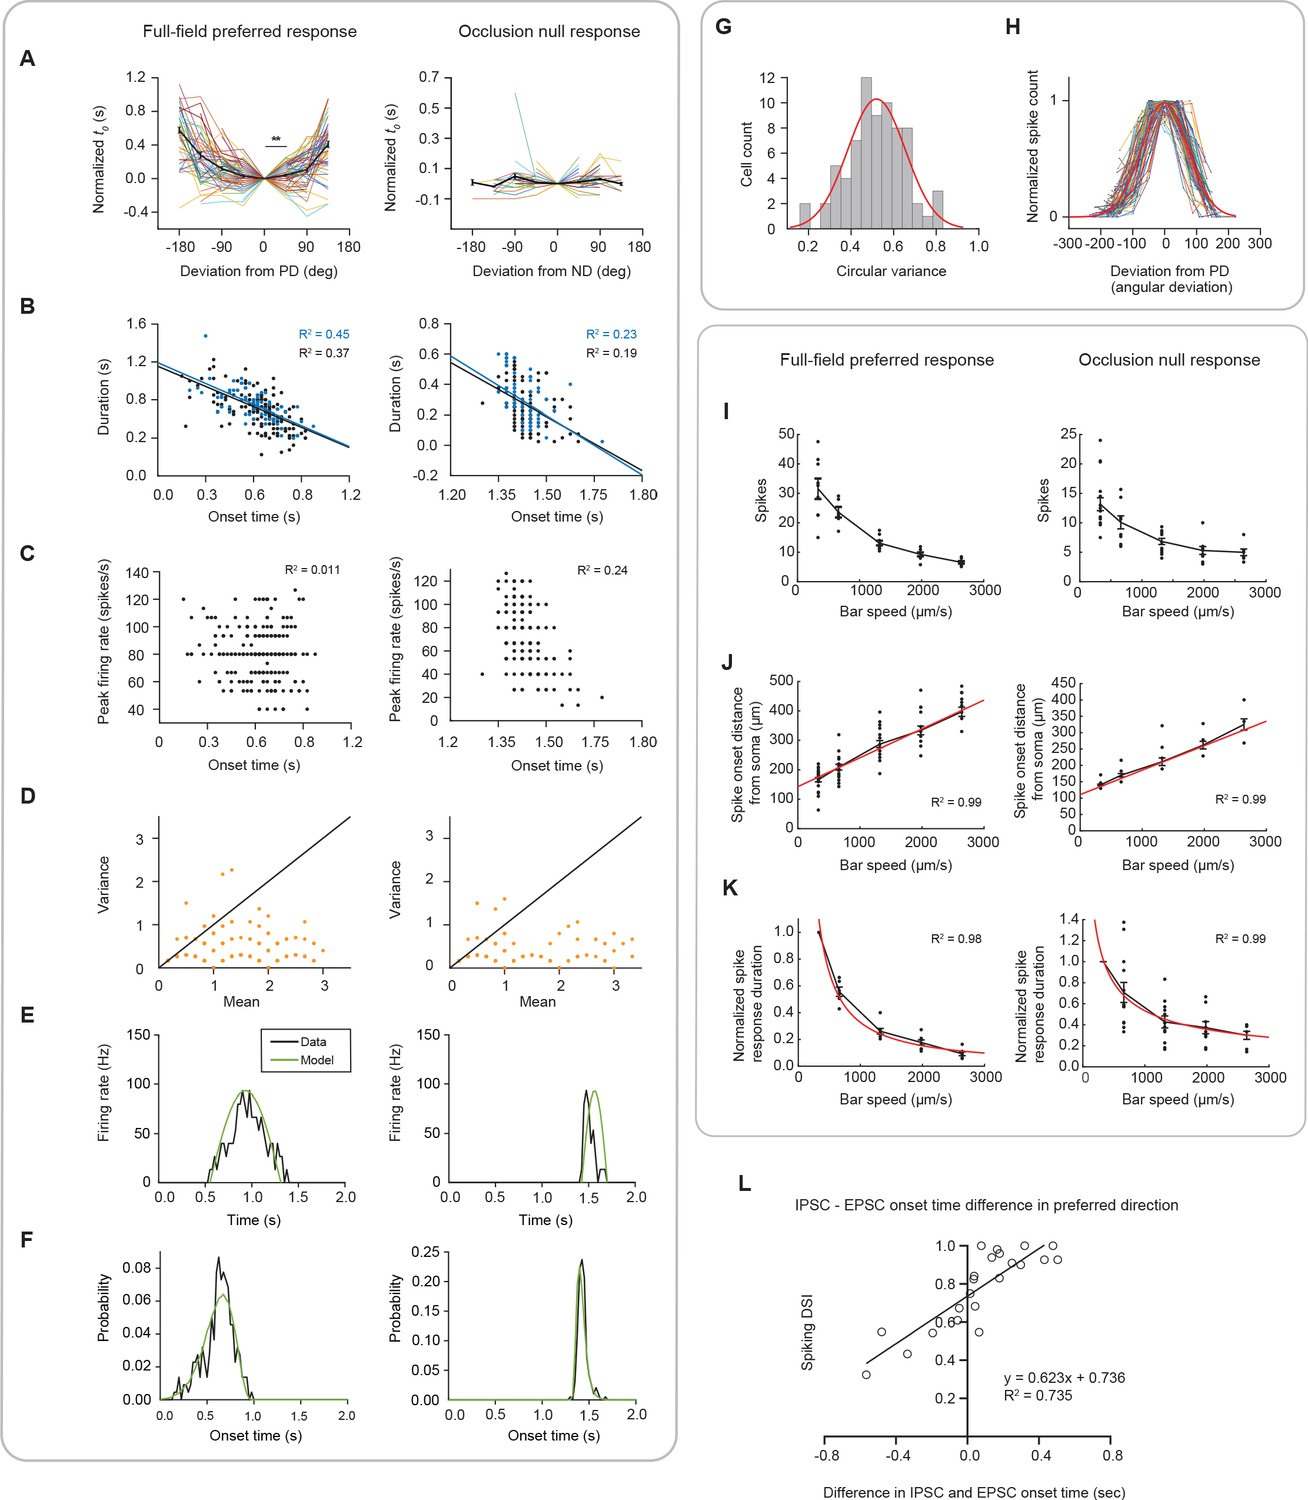
(A) Experimentally measured, normalized onset times, t0, as a function of motion direction, with the average shown in bold and black (left: full-field, 73 cells; right: occlusion, 69 cells). Onset times were aligned to the time when the bar moved in the cell’s preferred direction (full-field preferred response 0 vs 45: **p=0.004). (B) Linear correlation between spike response duration and spike response onset time. Data points are trials in which the bar moved in the preferred (left, full-field response) or null (right, occlusion response) direction (blue) or ±45 degrees around the preferred or null direction (black). Left: full-field (black slope = −0.71; blue slope = −0.73). Right: occlusion (black slope = −1.18; blue slope = −1.31). (C) Scatter plots of peak firing rate versus onset time. Left: full-field; right: occlusion. (D) Scatter plots of spike count mean and variance (left: full-field, 10 cells; right: occlusion, 9 cells). The unity line is plotted. The spiking is significantly sub-Poisson. (E) Example half sine wave fits (green) to PSTHs obtained from experimental data (left: full-field, 73 cells; right: occlusion, 69 cells). (F) Fits to probability distributions of spike response onset times. (G) Distribution of tuning curve widths fit to Gaussian. (H) Motion direction tuning curves of all cells normalized by their peaks and widths and their average (bold, red). (I) Spiking response across speeds to the full-field preferred response (right, 10 cells) and the occlusion null response (left, 17 cells). (J) Same as I but for the spike onset distance from soma. (K) Same as I but for the normalized spike response duration. (L) The onset time difference between the IPSC and EPSC to a full-field bar in the preferred direction versus direction selectivity. Summary statistics are mean ± SEM.
-
Figure 7—figure supplement 1—source data 1
Model fits to experimental recordings.
- https://cdn.elifesciences.org/articles/68181/elife-68181-fig7-figsupp1-data1-v2.xlsx
Tables
Key resources table
| Reagent type (species) or resource | Designation | Source or reference | Identifiers | Additional information |
|---|---|---|---|---|
| Gene (M. musculus) | 129S6-Chattm2(cre)Lowl/J | The Jackson Laboratory | RRID:IMSR_JAX:006410 | |
| Gene (M. musculus) | 129S6-Gt(ROSA)26Sortm9(CAG-tdTomato)Hze/J | The Jackson Laboratory | RRID:IMSR_JAX:007909 | |
| Gene (M. musculus) | Slc17a6tm2(cre)Lowl/J | The Jackson Laboratory | RRID:IMSR_JAX:012898 | |
| Gene (M. musculus) | B6J.Cg-Gt(ROSA)26Sortm95.1(CAG-GCaMP6f)Hze/MwarJ | The Jackson Laboratory | RRID:IMSR_JAX:028865 | |
| Chemical compound, drug | Dihydro-b-erythroidine hydrobromide | Tocris | Cat#2349 | |
| Chemical compound, drug | SR 9551 hydrobromide | Tocris | Cat#1262 |
Additional files
Download links
A two-part list of links to download the article, or parts of the article, in various formats.
Downloads (link to download the article as PDF)
Open citations (links to open the citations from this article in various online reference manager services)
Cite this article (links to download the citations from this article in formats compatible with various reference manager tools)
Spatially displaced excitation contributes to the encoding of interrupted motion by a retinal direction-selective circuit
eLife 10:e68181.
https://doi.org/10.7554/eLife.68181


