Defining function of wild-type and three patient-specific TP53 mutations in a zebrafish model of embryonal rhabdomyosarcoma
- Institute of Environmental Safety and Human Health, Wenzhou Medical University, China
- Greehey Children's Cancer Research Institute (GCCRI), UT Health Sciences Center, United States
- Department of Molecular Medicine, UT Health Sciences Center, United States
- Department of Pediatrics, Division of Hematology Oncology, UT Health Sciences Center, United States
- Department of Biochemistry and Structural Biology, UT Health Sciences Center, United States
- Department of Biology, University of Alabama at Birmingham, United States
- Department of Pathology and Laboratory Medicine, UT Health Sciences Center, United States
- Department of Population Health Sciences, UT Health Sciences Center, United States
- Developmental and Stem Cell Biology, Hospital for Sick Children, Canada
- Department of Laboratory Medicine and Pathology, University of Washington, United States
Figures
Figure 1 with 2 supplements
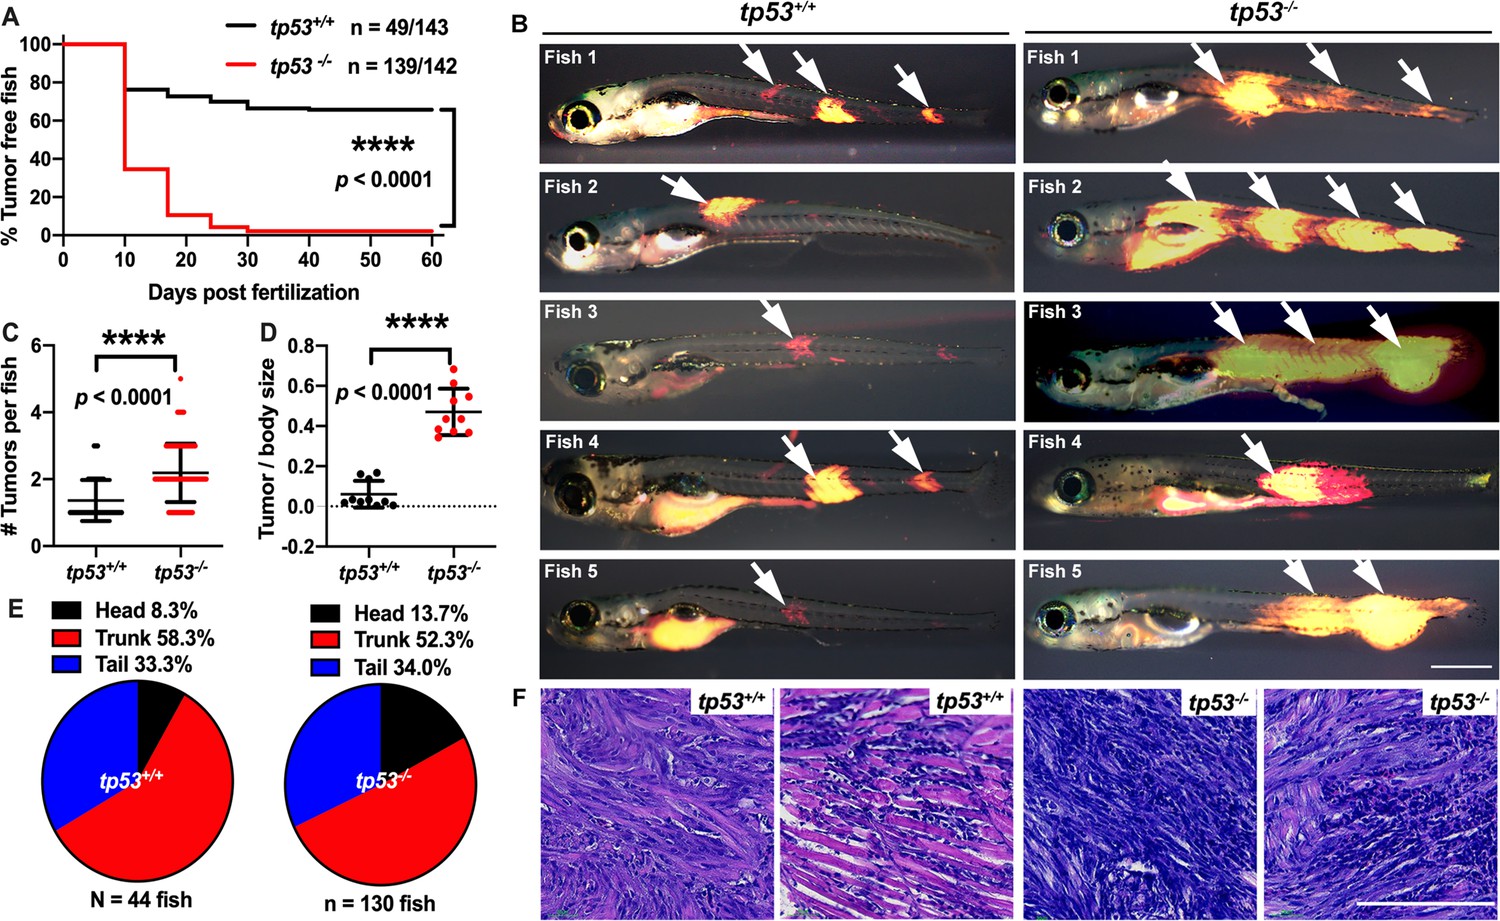
tp53 suppresses embryonal rhabdomyosarcoma (ERMS) tumor initiation.
(A) Kaplan–Meier plot showing ERMS tumor initiation in tp53-/- and tp53+/+ fish. (B) Representative images of DsRed-positive zebrafish ERMS. Arrows show tumor location for each fish. All tumor-burdened zebrafish are 10 days old. Scale bar = 0.5 mm. (C) Tumor numbers per zebrafish in tp53-/- and tp53+/+ fish. n = 44 (tp53+/+), n=130 (tp53-/-). (D) Ratio of tumor area to total body area in in tp53-/- and tp53+/+ fish. n = 10. (E) Pie chart showing percentage of tumors found in varying regions of tp53-/- and tp53+/+ fish, showing no significant differences in tumor localization. Head – p=0.25848, trunk – p=0.39532, tail – p=0.92034 (two-tailed two proportions Z-test). (F) Representative H&E staining of zebrafish ERMS tumors. Scale bar = 100 µm.
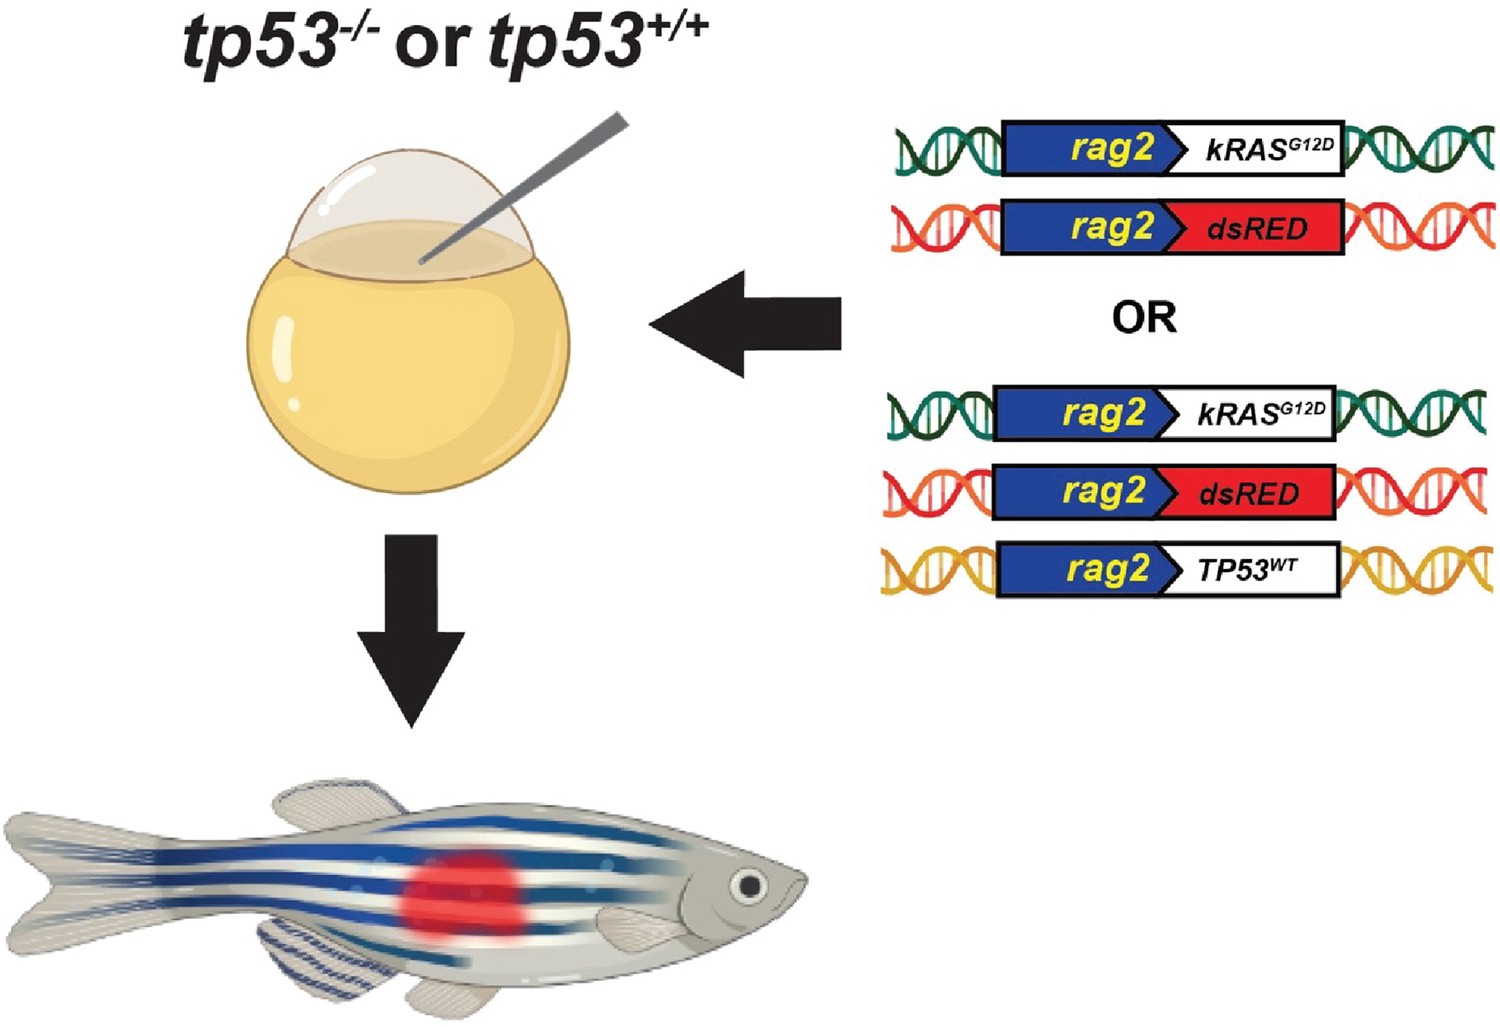
Figure 1—figure supplement 1
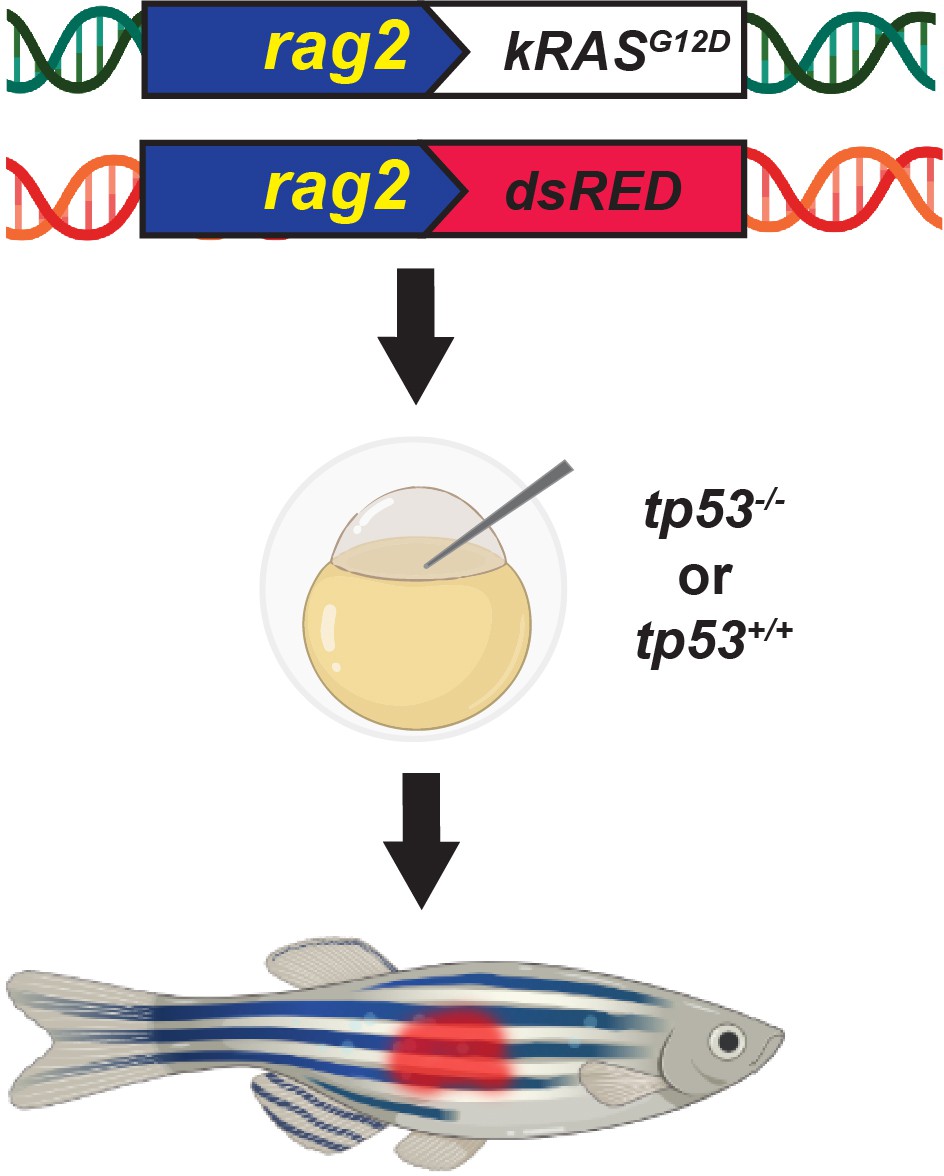
Schematic of the experimental setup to generate embryonal rhabdomyosarcoma (ERMS) tumors in zebrafish via microinjection of indicated linearized DNA constructs into the one-cell-stage zebrafish embryos generated from in crosses of tp53-/- or tp53+/+ zebrafish.
Figure 1—figure supplement 2
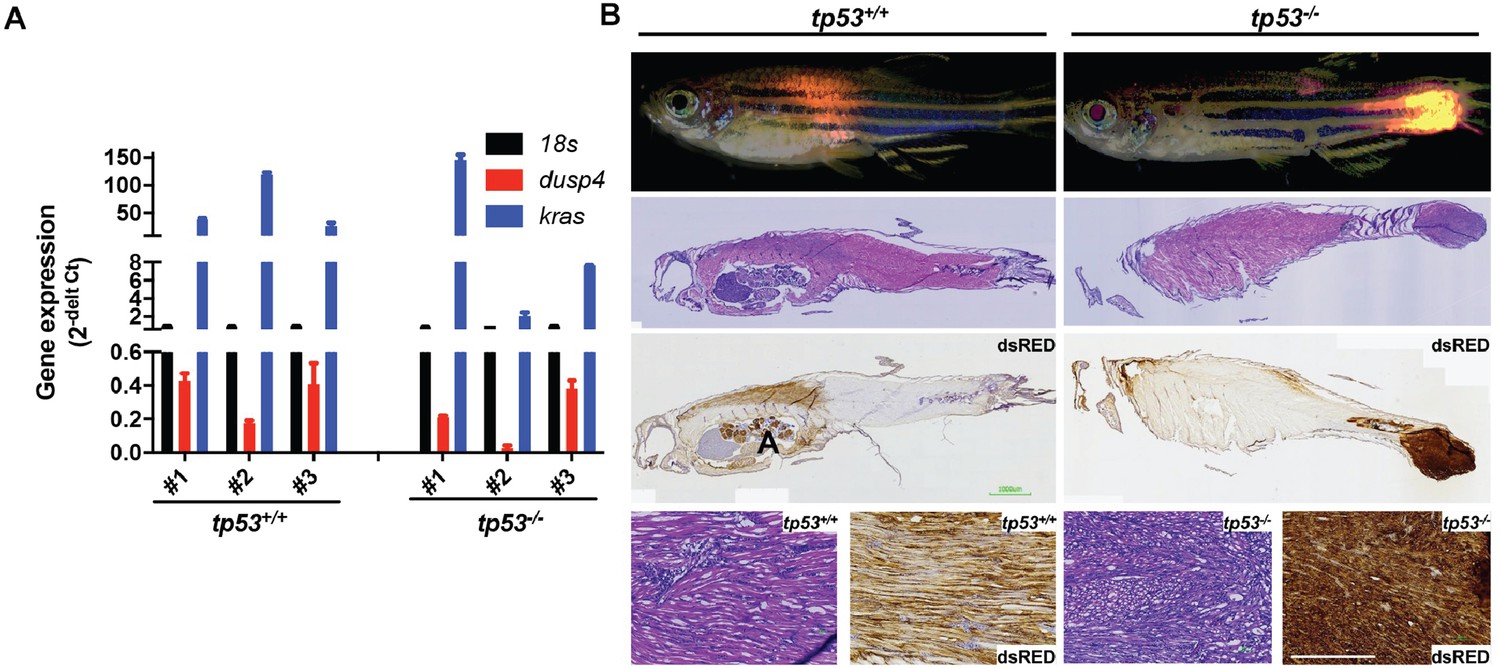
tp53 suppresses embryonal rhabdomyosarcoma (ERMS) tumor initiation.
(A) mRNA expression of kRASG12D and dusp4 in compared to 18s expression level. (B) Representative H&E and immunohistochemistry (anti-DsRed) staining in embryonal rhabdomyosarcoma (ERMS) tumor fish. Arrows denote location of tumors. Zebrafish shown are 35 days old. Scale bar = 100 µm.
Figure 2
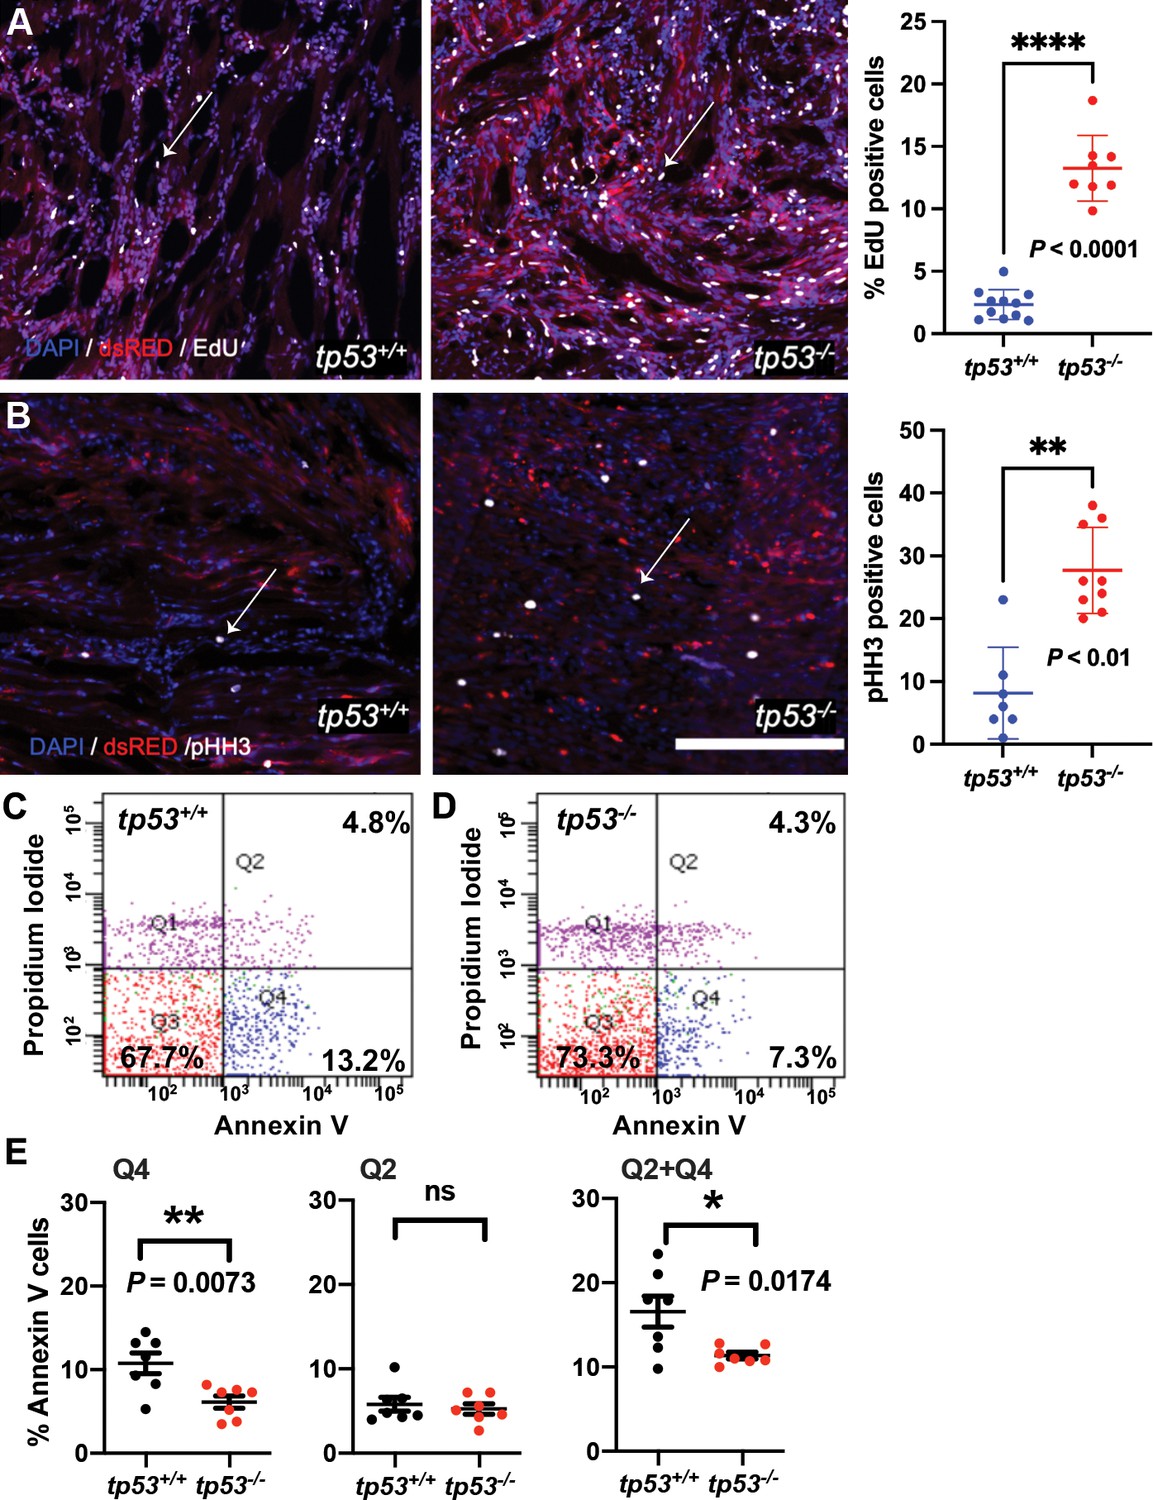
tp53 is a potent suppressor of proliferation and to a lesser extent of apoptosis.
(A) Representative confocal microscopy images of EdU staining on embryonal rhabdomyosarcoma (ERMS) tumor sections and a plot quantifying the percentage of EdU-positive cells. Average of n = 8–11/primary tumors. White arrows show EdU-positive cells. (B) Representative confocal microscopy images of phospho-histone H3 staining on ERMS tumor sections (scale bar = 100 µm). Total number pHH3-positive cells per single ERMS tumor ×200 confocal image section assessed from n7-9 primary tumors. One the right-most panel is a plot quantifying the total number of pHH3-positive cells per single ERMS section. White arrows show pHH3-positive cells. (C, D) Representative flow cytometry analysis of Annexin V staining of tp53+/+and tp53-/- ERMS tumors, respectively. (E) Quantification of flow cytometry analysis of Annexin V staining. Q1 = pre-necrotic cells, Q2 = late apoptosis + necrotic cells, Q3 = living cells, Q4 = early apoptotic cells. n = 7. ns, not significant, p=0.5926, unpaired t-test.
Figure 3 with 4 supplements
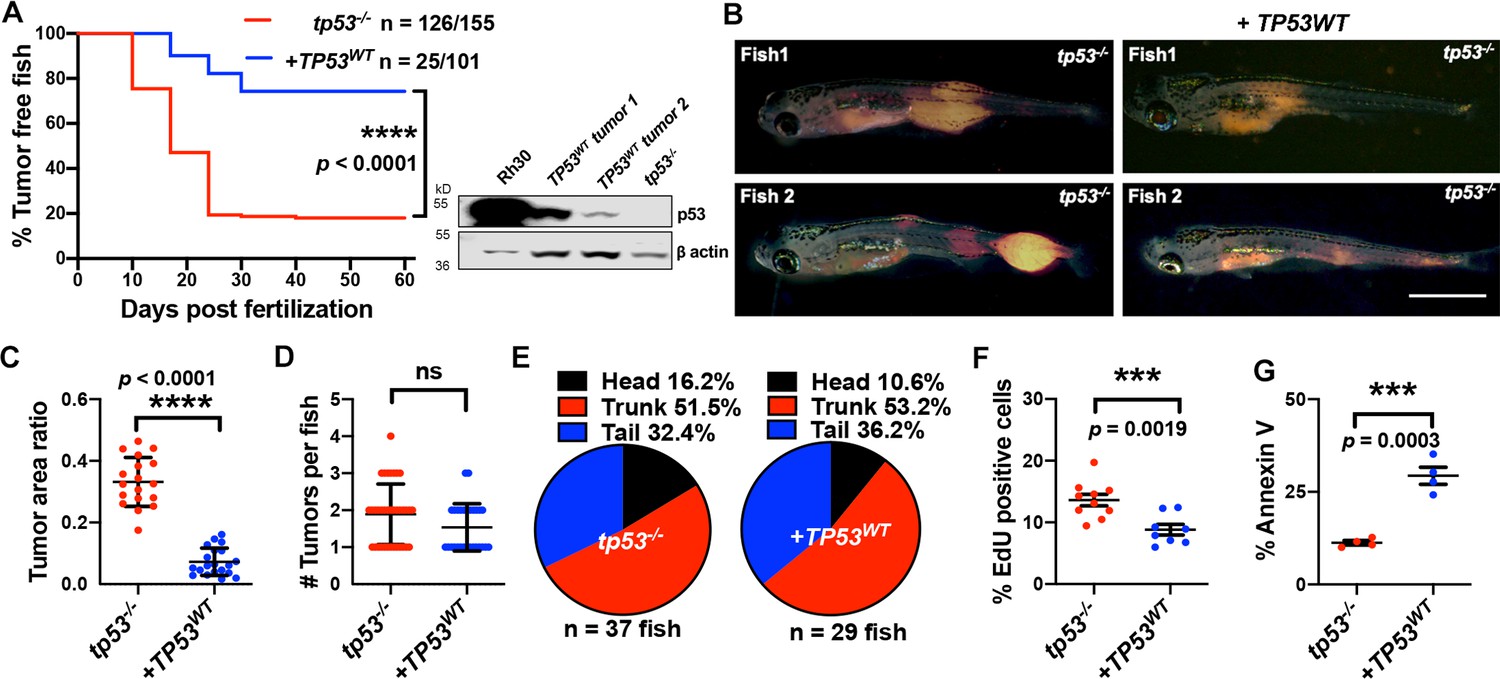
Human TP53 blocks tumor initiation, growth, and proliferation and increases apoptosis in tp53-/- zebrafish.
(A) Kaplan–Meier plot showing embryonal rhabdomyosarcoma (ERMS) tumor initiation in tp53-/- fish with or without p53WT expression. Western blot analysis was performed to assess p53WT expression level in tumors. (B) Representative images of ERMS tumors in tp53-/- fish with or without human TP53WT expression. Tumor-burdened zebrafish are between 15 and 20 days old. Scale bar = 1 mm. (C) Ratio of tumor area to total body area in tp53-/- fish with or without expression of TP53WT. n = 18. (D) Number of tumors per tp53-/- zebrafish with or without expression of TP53WT. ns, not significant. n = 36 (tp53-/-), n = 28 (TP53WT). (E) Pie chart showing site of tumor localization in tp53-/- fish with or without expression of TP53WT showing no statistical differences. Head – p=0.20045, trunk – p=0.42858, tail – p=0.3336. Quantification of proliferation (F) and apoptosis (G) via EdU staining (n = 10) and Annexin V staining (n = 3), respectively, for tumors arising in tp53-/- fish with or without expression of TP53WT.
Figure 3—figure supplement 1
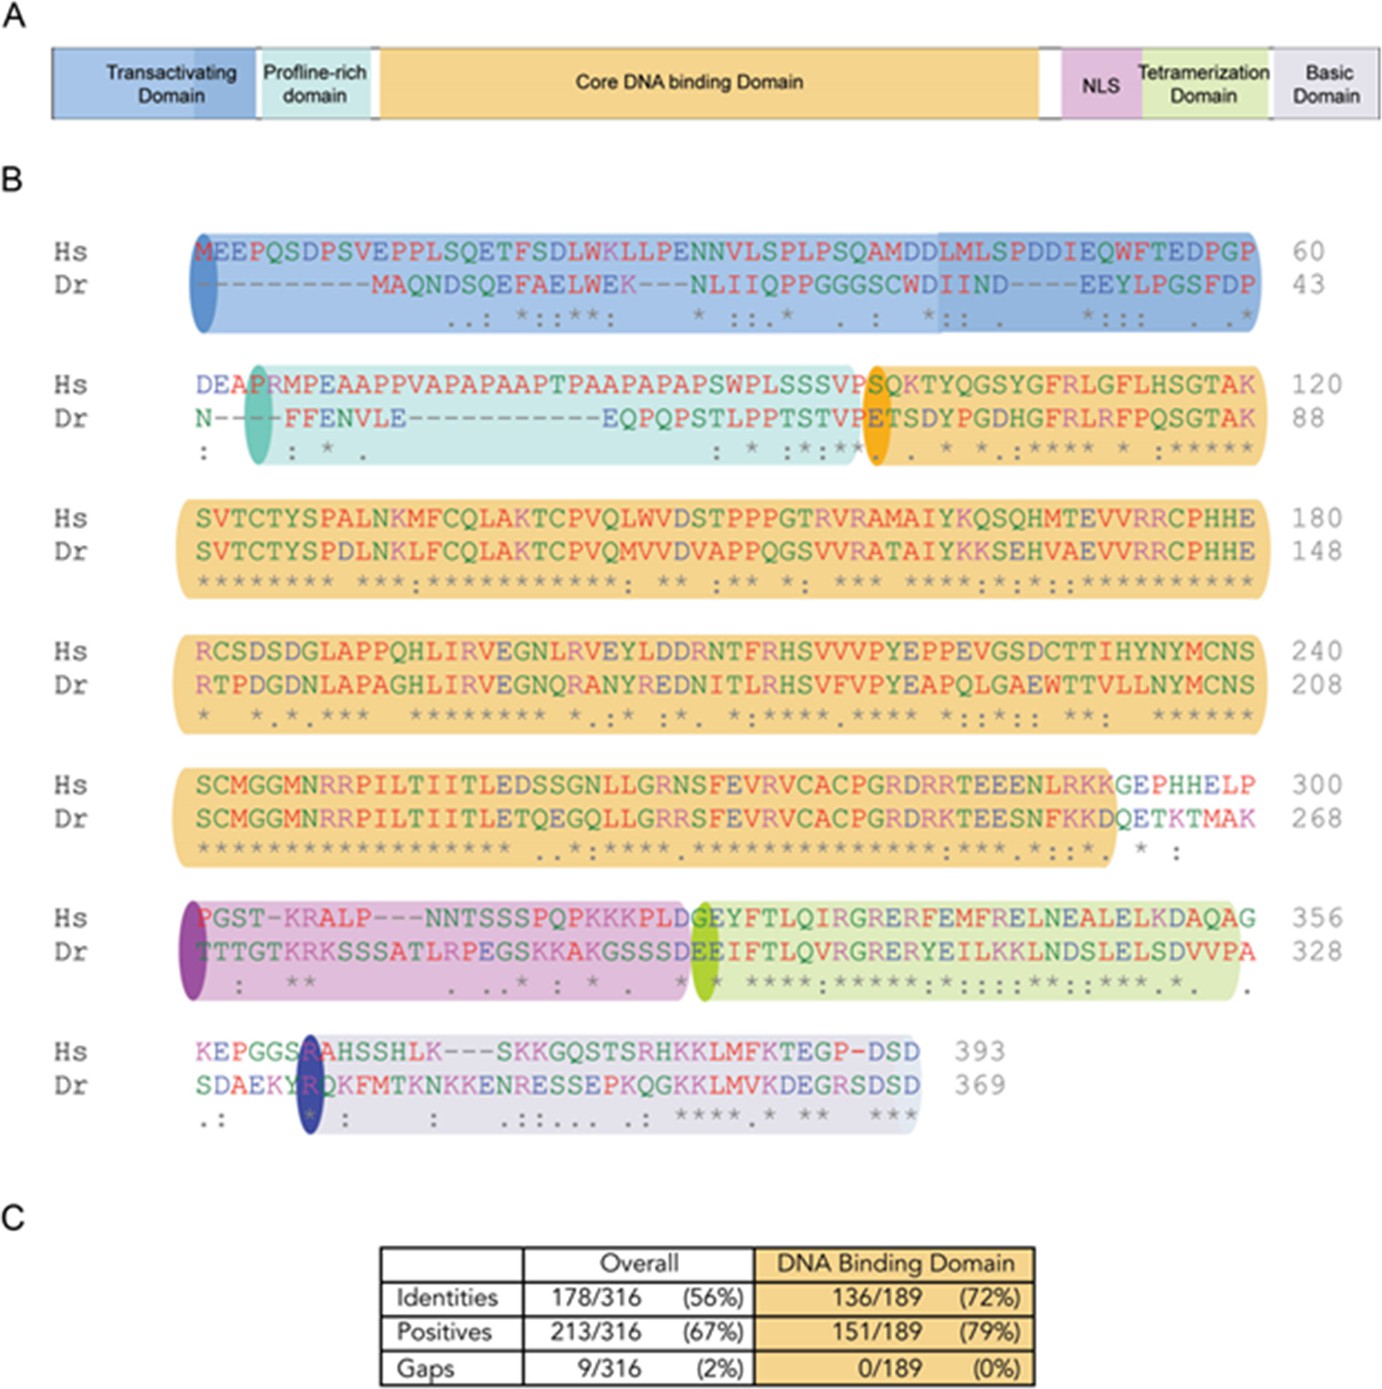
Human TP53 blocks tumor initiation, growth, and proliferation and increases apoptosis in tp53-/- zebrafish.
(A) Schematic of the protein structure of p53 with the different domains highlighted with different colors. (B) The amino acid sequence alignment for p53 between human (Hs) and zebrafish (Dr-Danio rerio). The colors highlight domains in (A); - indicates gaps; : indicates positive substitutions; * indicates conserved amino acids,. (C) Table showing amino acid conservation, positive substitutions, and gaps in the full-length and DNA-binding domain.
Figure 3—figure supplement 2
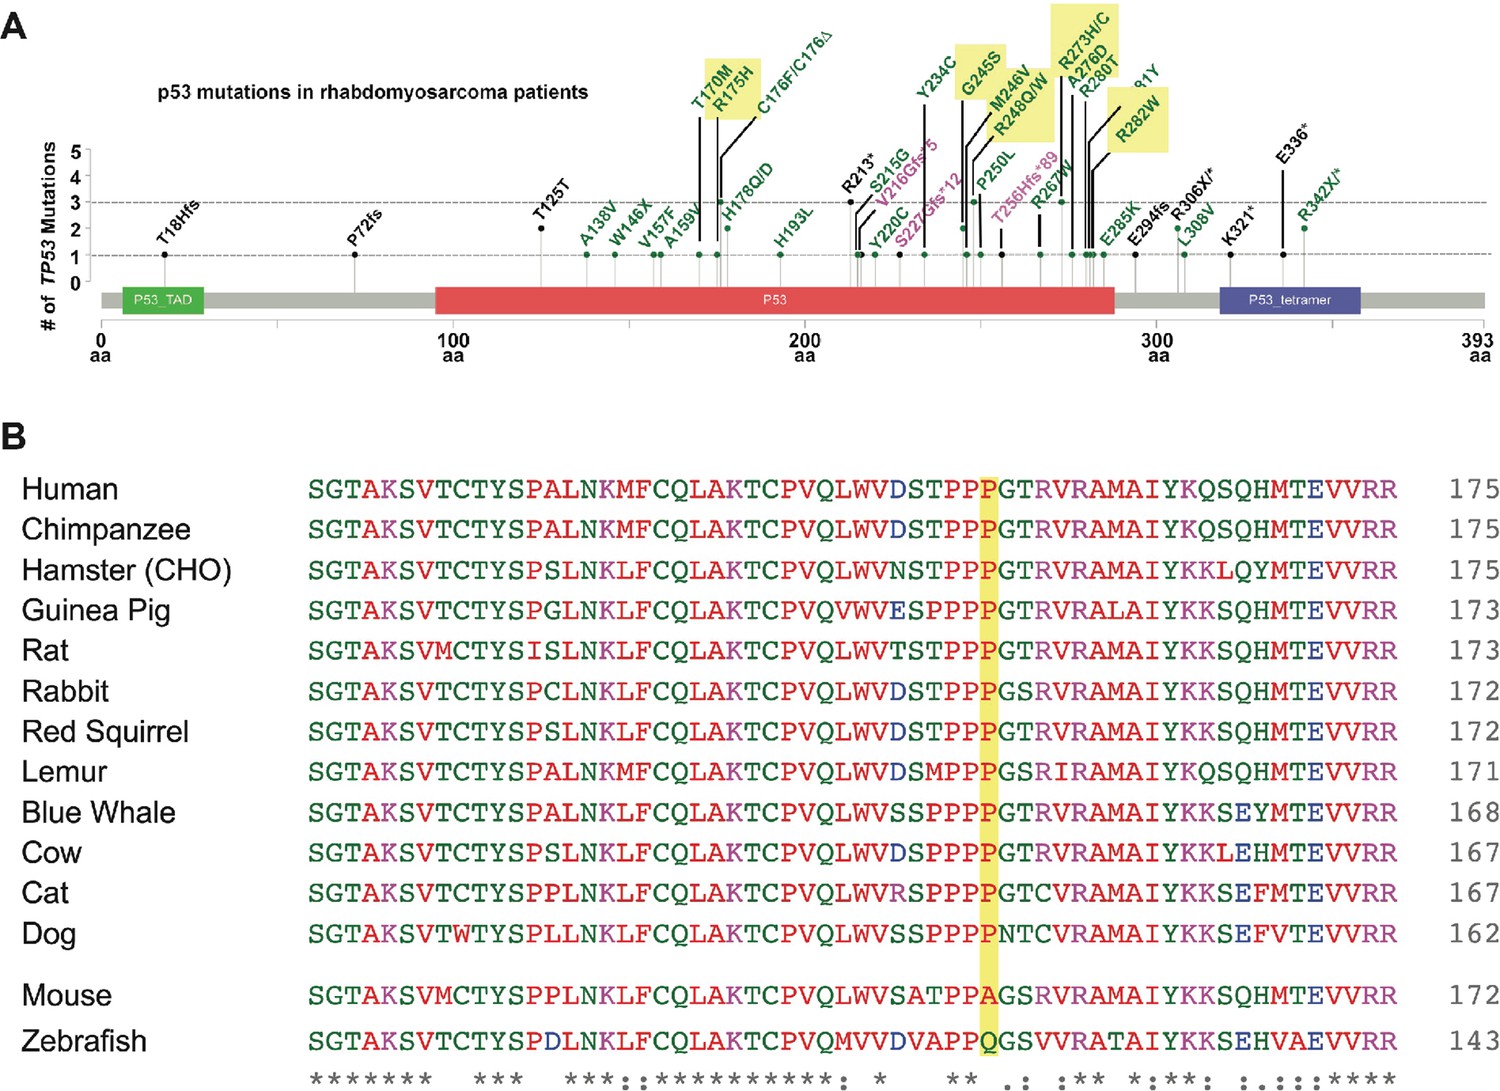
Human TP53 blocks tumor initiation, growth, and proliferation and increases apoptosis in tp53-/- zebrafish.
(A) Lollipop plot showing common p53 mutations in rhabdomyosarcoma patients as well as the seven most common p53 hot spot mutations across all cancers. (B) The amino acid sequence alignment for p53P153 with other species. The yellow highlight shows the amino acid of P153, the top panel shows the conserved ones, and the bottom five species show the non-conserved ones.
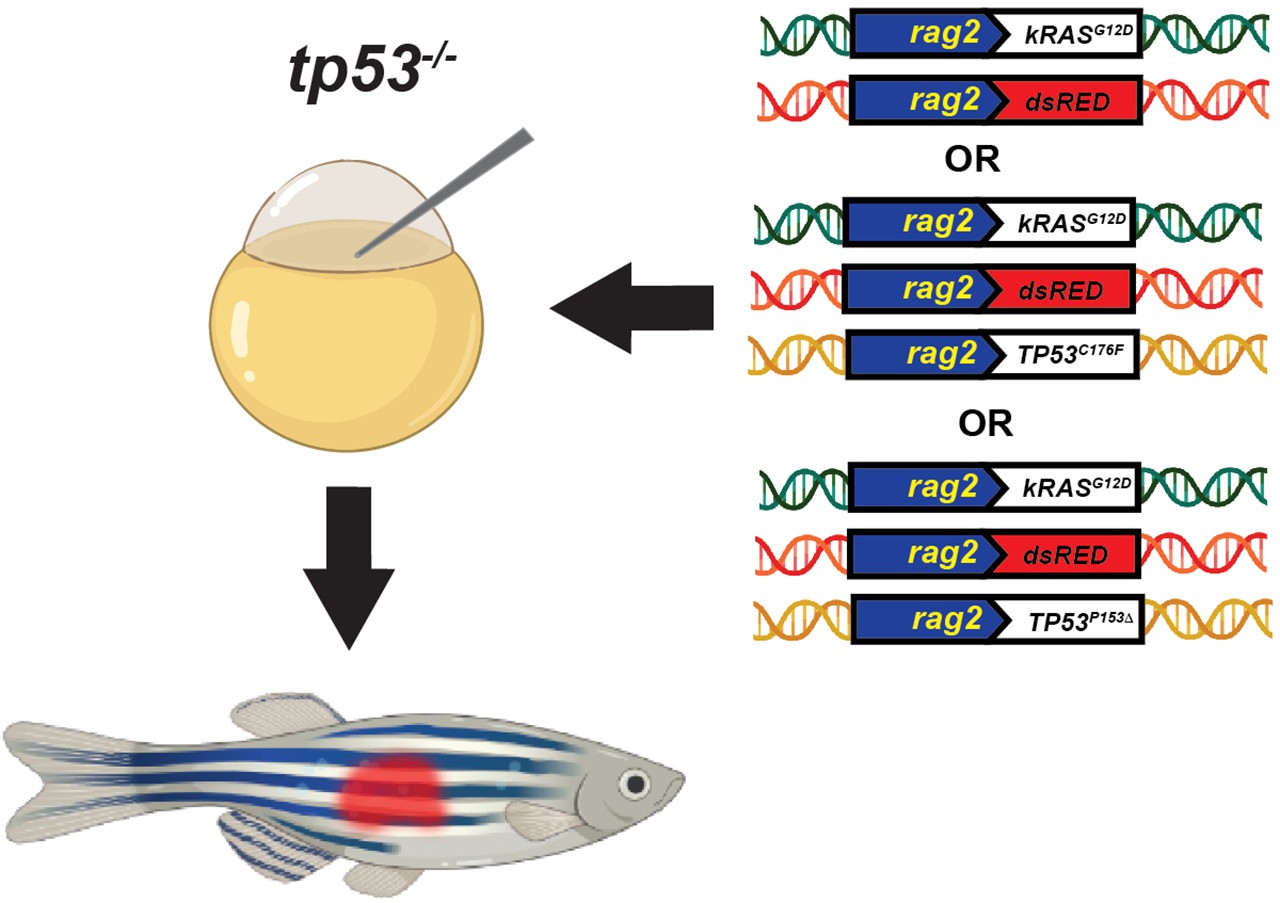
Figure 3—figure supplement 3
Schematic of the experimental setup to generate embryonal rhabdomyosarcoma (ERMS) tumors in zebrafish via microinjection of indicated linearized DNA constructs into the one-cell-stage zebrafish embryos generated from in crosses of tp53-/- zebrafish.
Figure 3—figure supplement 4
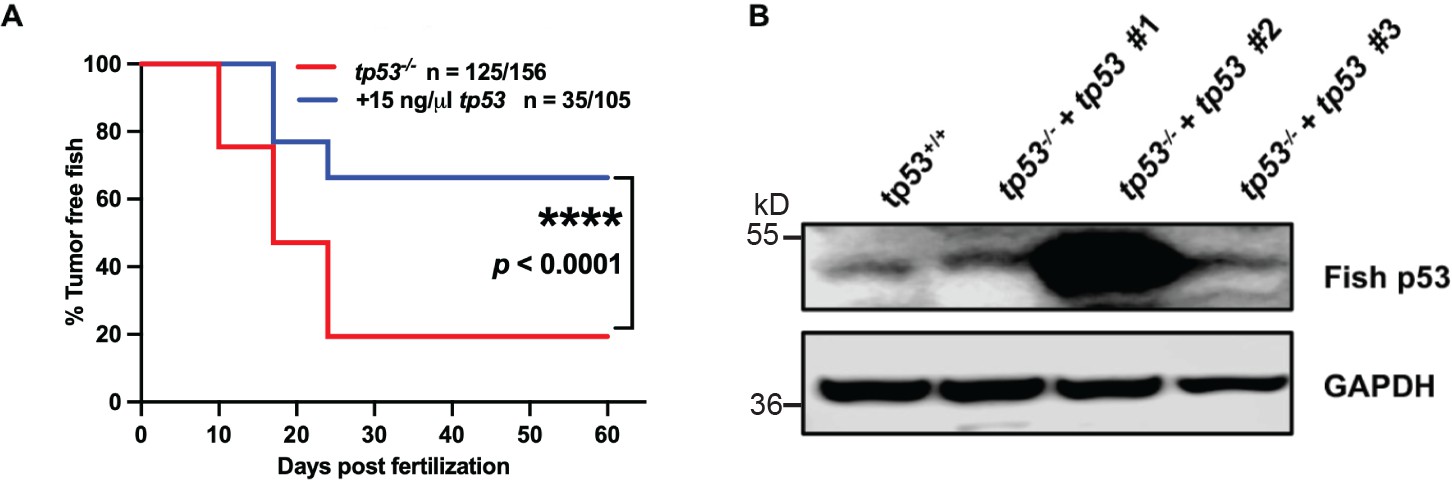
Zebrafish tp53 (italics) blocks tumor initiation in tp53-/- zebrafish.
(A) Kaplan–Meier plot showing embryonal rhabdomyosarcoma (ERMS) tumor initiation in tp53-/- fish (AB WT strain) with or without tp53. (B) Zebrafish p53 expression levels in three tp53-/- tumors expressed rag2:tp53 along with rag2:kRASG12D, using AB WT tumor driven by rag2:kRASG12D as control.
Figure 4 with 3 supplements

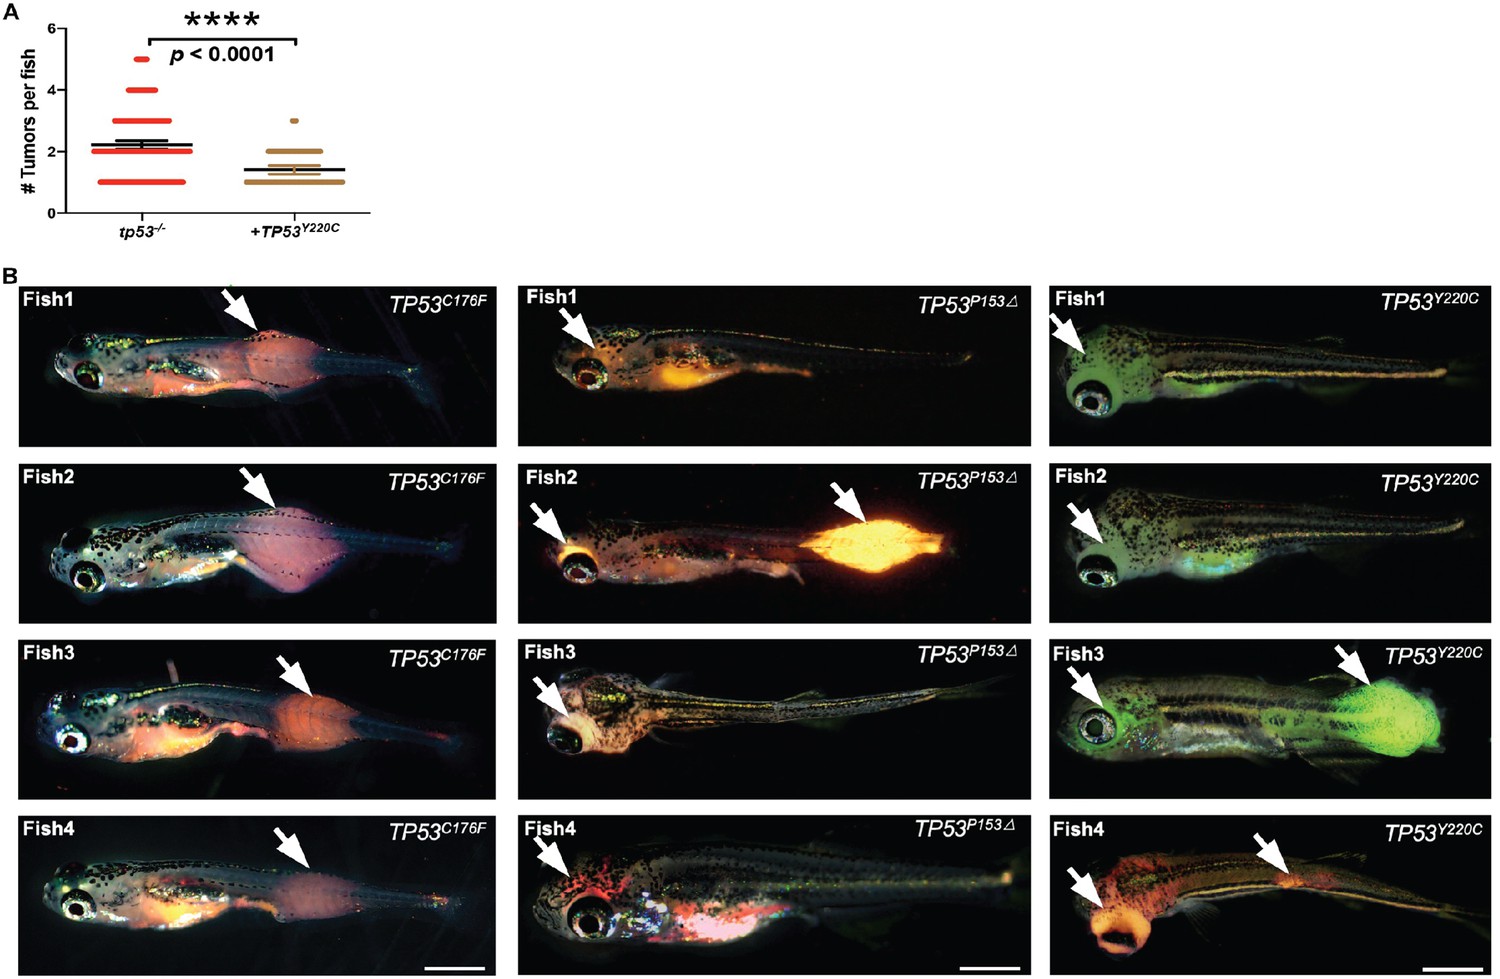
Assigning pathogenicity to two human TP53 sarcoma mutations in the kRASG12D-driven embryonal rhabdomyosarcoma (ERMS) model.
(A) Lollipop plot showing the two novel, human p53 mutations P153Δ and C176F, as well as the amino acid sequence alignment for human, mouse, and zebrafish protein. (B) DNA sequencing data from osteosarcoma patient confirming the germline P153Δ mutation, as well as somatic A159V mutation. (C, D) p53 immunohistochemistry staining of p53 in ERMS patient-derived xenograft (PDX) SJRHB00011 expressing p53C176F and osteosarcoma expressing p53P153Δ. (E, F) Representative H&E staining of ERMS PDX expressing the C176F mutation and diagnostic biopsy of osteosarcoma tumor expressing osteosarcoma expressing p53P153Δ showing neoplastic tumor cells with pleomorphic nuclei, irregular chromatin pattern, as well as irregular disorganized trabeculae of unmineralized malignant osteoid (stars). (G) Protein expression of mutant p53 in zebrafish ERMS tumors, with rhabdomyosarcoma (RMS) cell line, Rh30, as a control. (H) Kaplan–Meier plot showing tumor initiation in tp53-/- fish with or without expression of mutant TP53. (I) Representative images of tumor localization in tp53-/- fish with or without expression of mutant TP53. Age of zebrafish in panels is 37 d. Scale bar = 1 mm (J) Pie chart showing percentage of tumors found in varying regions of tp53-/- fish with or without expression of mutant TP53. Percentages in red indicate a significant difference to tp53-/- (p=0.0096, two-tailed two proportions Z-test). (K) Quantification of Annexin V staining in tumors arising in tp53-/- fish with or without expression of mutant TP53. n = 6–7. (L) Representative H&E staining of tumors arising in tp53-/- fish with or without expression of mutant TP53. Scale bar = 100 µm.
Figure 4—figure supplement 1
Schematic of the experimental setup to generate embryonal rhabdomyosarcoma (ERMS) tumors in zebrafish via microinjection of indicated linearized DNA constructs into the one-cell-stage zebrafish embryos generated from in crosses of tp53-/- zebrafish.
Figure 4—figure supplement 2
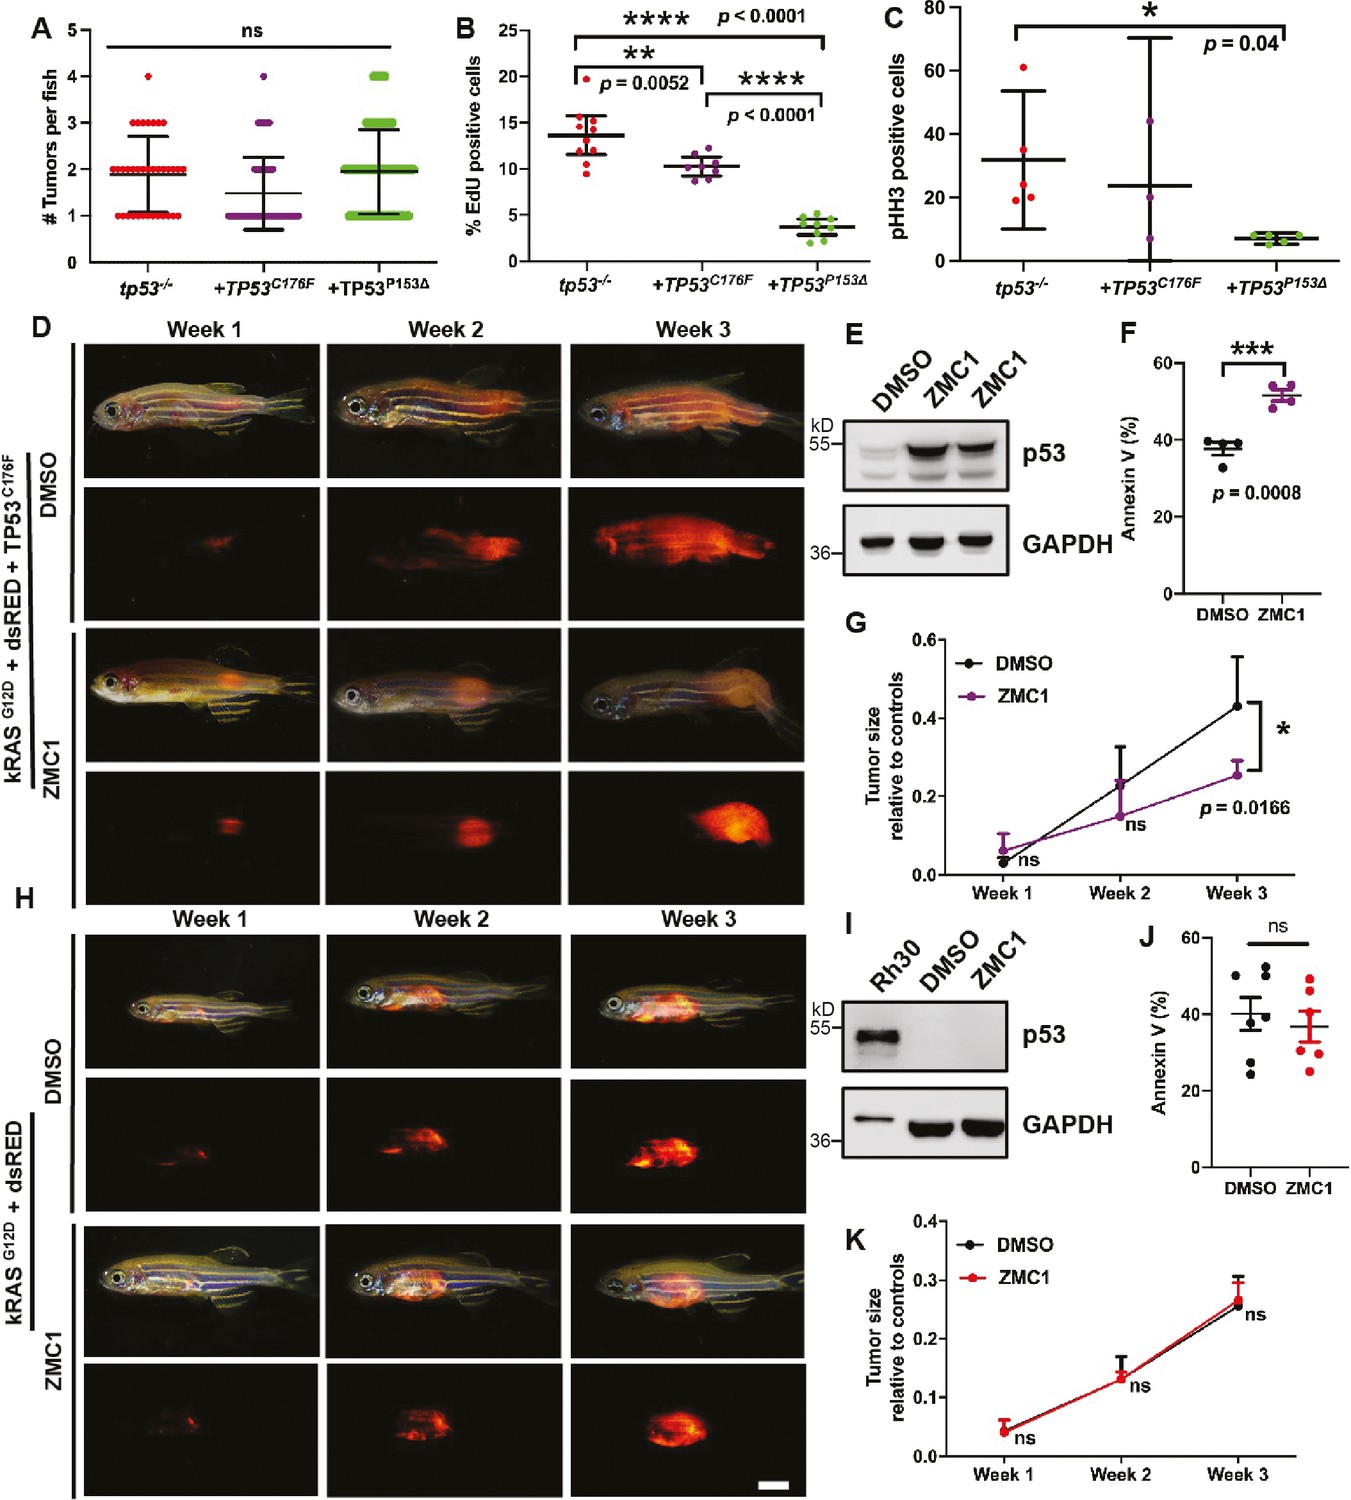
Assigning pathogenicity to two human TP53 sarcoma mutations in the kRASG12D-driven embryonal rhabdomyosarcoma (ERMS) model.
(A) Tumor numbers per zebrafish expressing no TP53 (tp53-/-), or TP53C176F, or TP53P153Δ.n = 36 (tp53-/-), n = 58 (TP53C176F), n = 81 (TP53P153Δ). (B) Percentage of EdU-positive cells in representative areas of fish tumors expressing either no TP53 (tp53-/-), TP53C176F, or TP53P153Δ. n = 8–10. (C) Total number of pHH3-positive cells per single ERMS tumor ×200 confocal image section assessed from tumors expressing WT TP53, TP53C176F, or TP53P153Δ intp53-/- zebrafish; n = 3–5 primary tumors. (D) Representative images of tumor-burdened adult zebrafish (4–6 months of age) with tumors expressing kRASG12D + TP53C176F (DsRed+) treated with either DMSO or ZMC1 over a span of 3 wk. (E) Western blot showing p53 expression levels in fish tumors expressing kRASG12D + TP53C176F and treated with either DMSO or ZMC1. (F) Percentage of Annexin V-positive cells in tumors expressing kRASG12D + TP53C176F that were treated with either DMSO or ZMC1. n = 4. (G) Ratio of tumor size to total body for in fish tumors expressing kRASG12D + TP53C176F, treated with either DMSO or ZMC1. ns, not significant, n = 4. (H) Representative images of tumor-burdened zebrafish expressing kRASG12D (DsRed+) treated with either DMSO or ZMC1 over a span of 3 wk. Scale bar = 2 mm (I) Western blot showing p53 expression levels in Rh30 cells (control) and fish tumors expressing kRASG12D, treated with either DMSO or ZMC1. (J) Percentage of Annexin V staining of fish tumors expressing kRASG12D, treated with either DMSO or ZMC1. ns, not significant. n = 6–7. (K) Ratio of tumor size to total body in tumors expressing kRASG12D, treated with either DMSO or ZMC1. ns, not significant, n = 4.
Figure 4—figure supplement 3
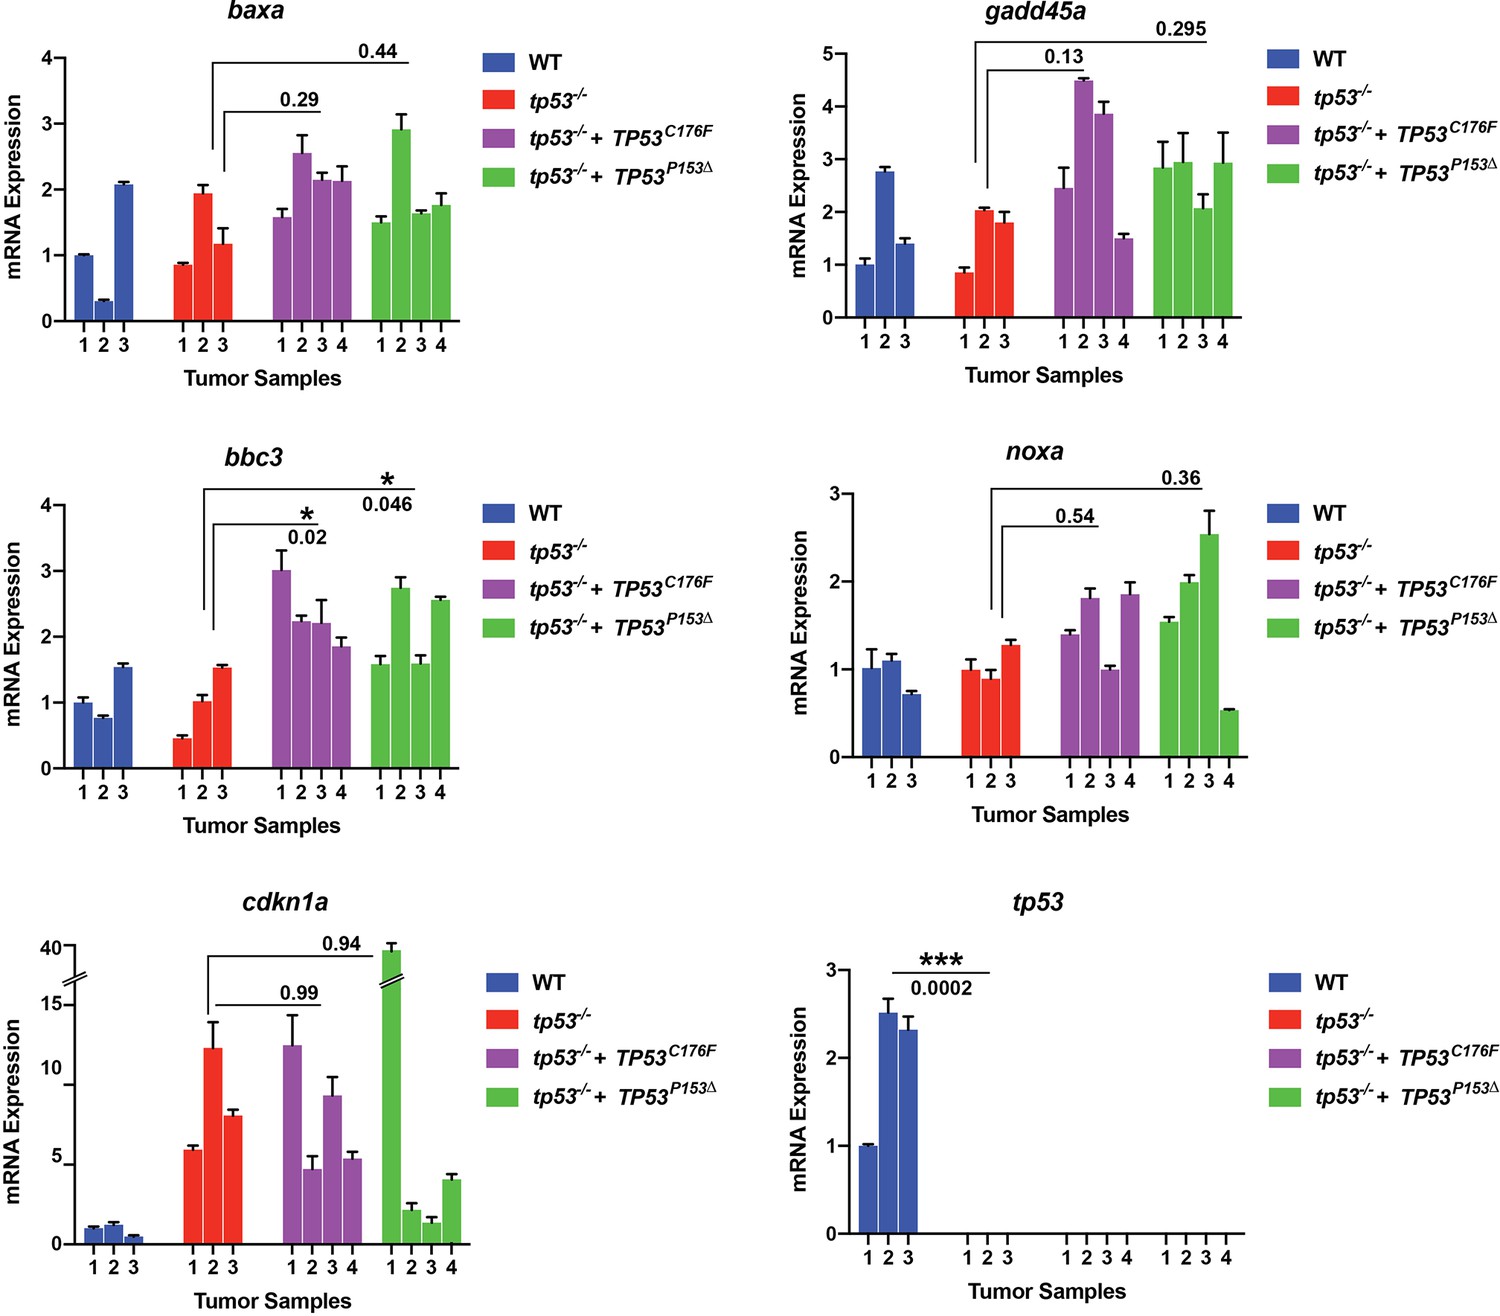
Semi-quantitative qPCR analyses comparing expression of known p53 direct regulated genes baxa, bbc3, cdkn1a, gadd45a, and noxa in primary zebrafish embryonal rhabdomyosarcoma (ERMS) expressing wt tp53 (blue, n = 3), tp53-/- (red, n = 3), tp53-/- + TP53C176F (purple, n = 4), or tp53-/- + TP53P153Δ (green, n = 4).
Also shown is expression of zebrafish tp53 across the tumors.
Figure 5 with 4 supplements
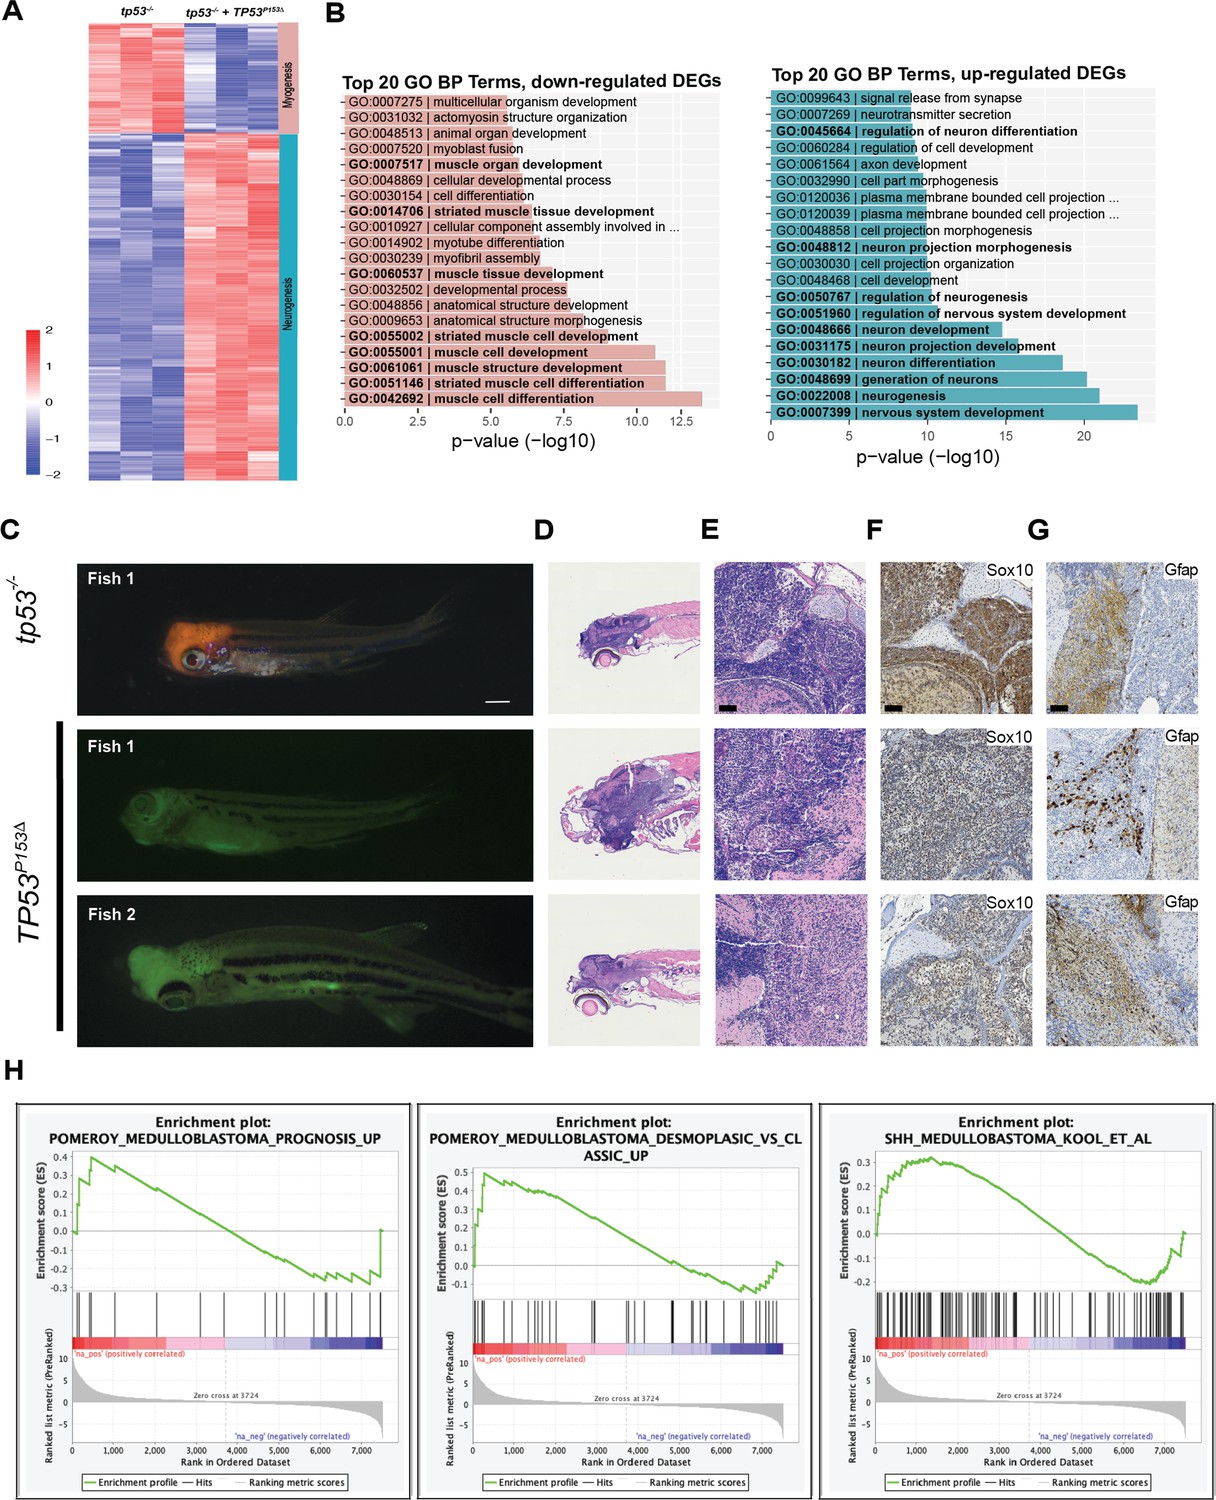
Expression of TP53P153Δ with kRASG12D in tp53-/- zebrafish results in the initiation of medulloblastomas with a shh gene signature.
(A) Heatmap from RNAseq analyses comparing tumors expressing kRASG12D;tp53-/- to kRASG12D; tp53-/-; TP53P153Δ (n = 3/group). A total of 643 genes were selected for the heatmap, with adjusted p-value<0.01 and fold-change >10. (B) Enriched Gene Ontology (GO) Biological Processes (BP) in upregulated genes in p53-/- group (left panel with pink bars) consistent with the expected tissue of origin for kRASG12D;tp53-/- to kRASG12D; tp53-/-; TP53P153Δ (right panel with light blue bars). (C) Representative images of medulloblastoma tumors expressing kRASG12D and DsRED (top panel) or GFP (bottom two panels) in tp53-/- fish with or without human TP53P153Δ expression. Tumor-burdened zebrafish are between 30 (Fish 1) and 70 (Fish 2, 3) days old. Scale bar = 1 mm. (D) Representative H&E staining of tumors arising in the head region of tp53-/- fish with or without expression of human TP53P153Δ. Images between 40 and 60 times magnification. (E–G) Representative sections of tumor-burdened zebrafish showing H&E staining (D, E) and IHC staining for Sox10 (F), and Gfap (G) in head tumors expressing kRASG12D in tp53-/- fish or kRASG12D andTP53P153Δ in tp53-/- fish. Scale bar = 60 µm (H) Gene set enrichment analysis (GSEA) showing the enrichment of medulloblastoma gene signatures from Pomeroy et al., and Kool et al., with our zebrafish brain tumors. Log-fold-change derived from the differential expression analysis between tp53-/- and tp53-/-; TP53P153Δ was used with GSEA pre-ranked function (GSEA, v4.0.3, Broad Institute, MA).
Figure 5—figure supplement 1
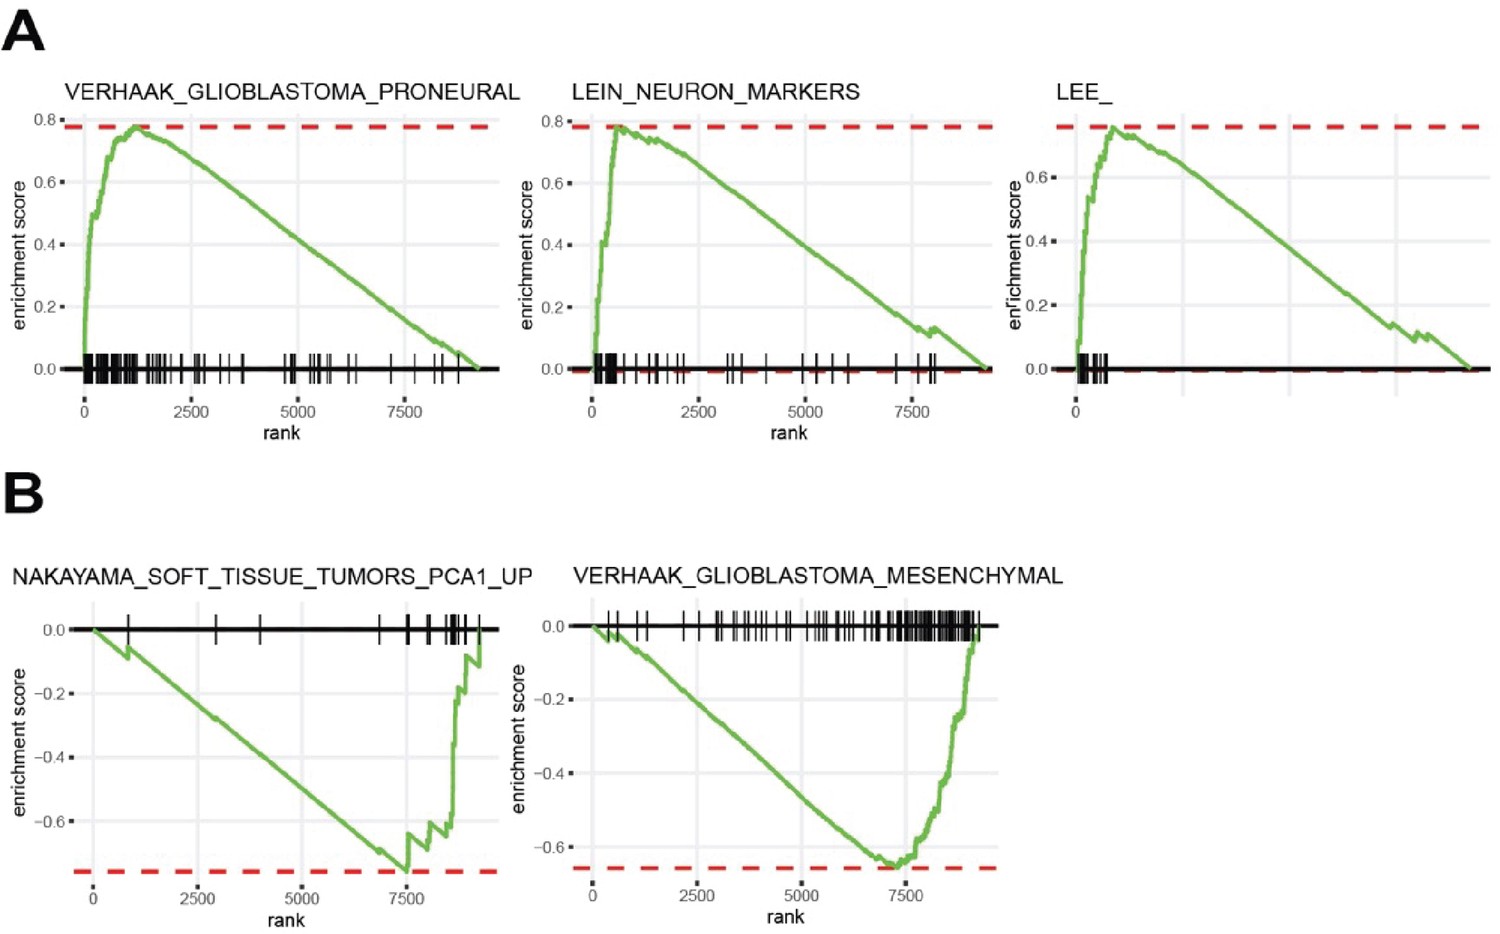
Unbiased gene set enrichment analysis (GSEA) (GSEApreranked function) comparing gene expression between tp53-/- to tp53-/-; TP53P153Δ tumors (log-fold-change) were performed with chemical and genetic perturbation (CGP) gene sets, part of MSigDB C2 curated gene set collection.
Figure 5—figure supplement 2
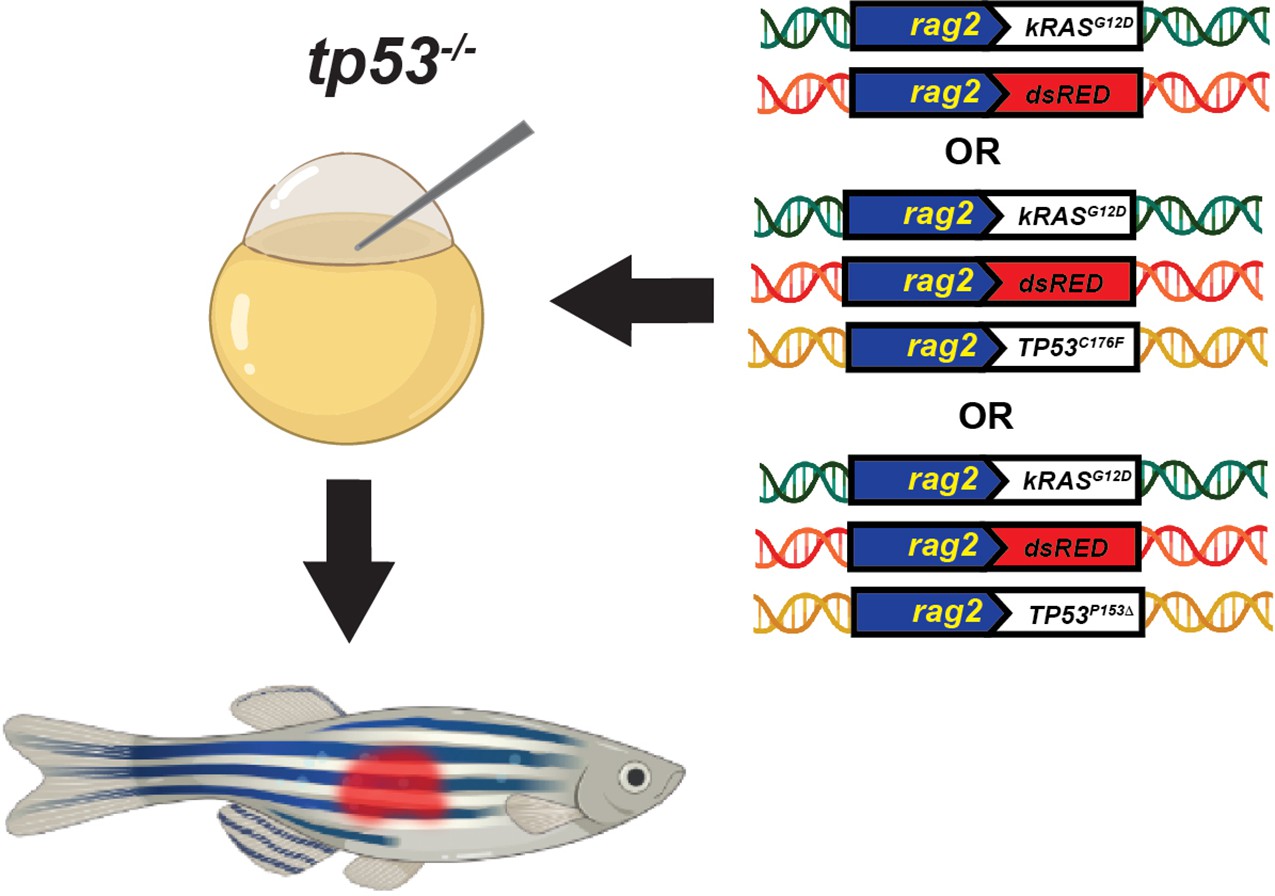
Schematic of the experimental setup to generate embryonal rhabdomyosarcoma (ERMS) tumors in zebrafish via microinjection of indicated linearized DNA constructs into the one-cell-stage zebrafish embryos generated from in crosses of tp53-/- zebrafish.
Figure 5—figure supplement 3
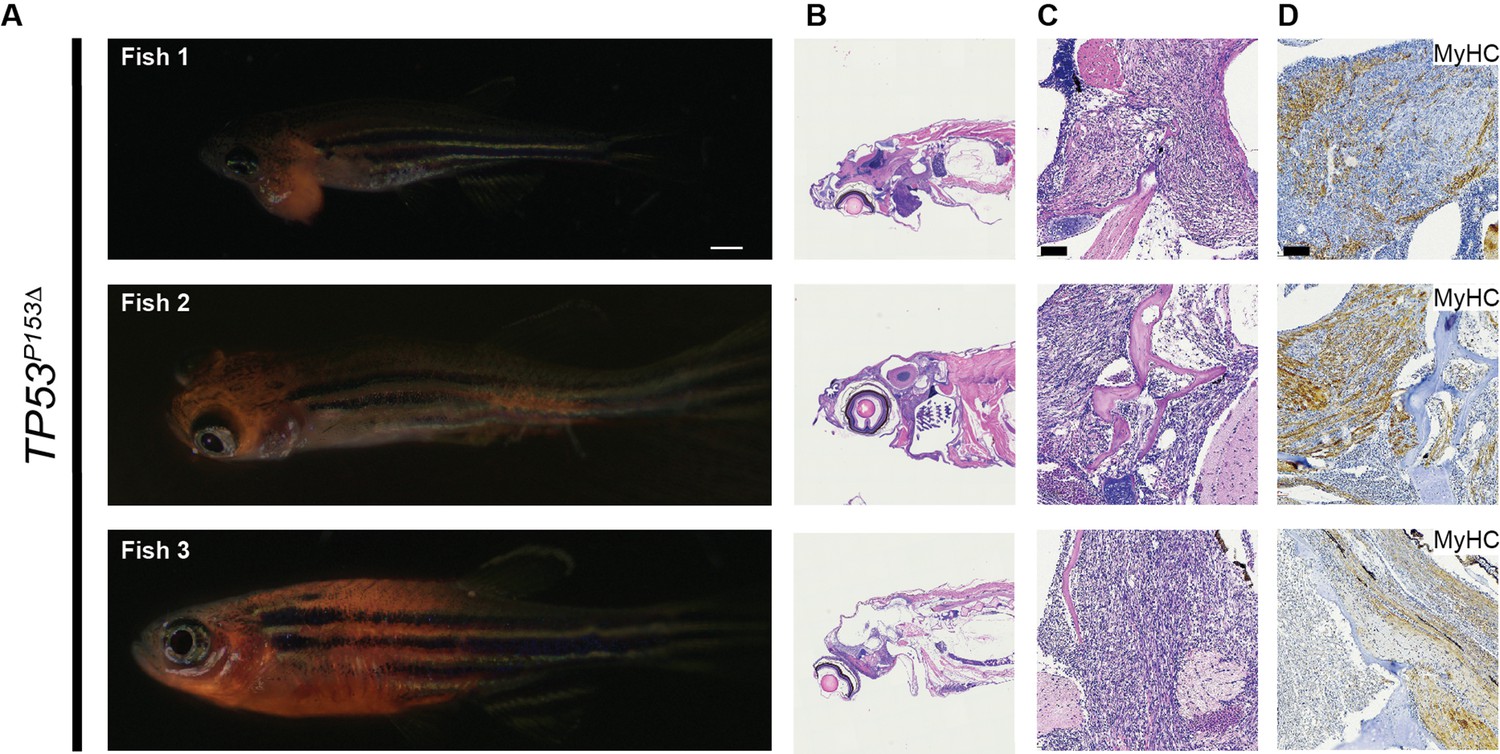
Expression of TP53P153Δ with kRASG12D in tp53-/- zebrafish results in the initiation of medulloblastomas with a shh gene signature. (TP53P153Δ).
(A) Representative images of tp53-/- fish with head embryonal rhabdomyosarcoma (ERMS) tumors, expressing TP53P153Δ (DsRED positive). The zebrafish in (A) are between 25 and 50 d. Scale bar = 1 mm. (B) H&E of the head regions of tp53-/- fish with head ERMS tumors, expressing TP53P153Δ. (C) H&E stained sections at ×20 magnification of tp53-/- fish with head ERMS tumors, expressing TP53P153Δ. (D) IHC for myosin heavy chain at ×20 magnification of tp53-/- fish with head ERMS tumors, expressing TP53P153Δ. Scale bar = 100 µm.
Figure 5—figure supplement 4
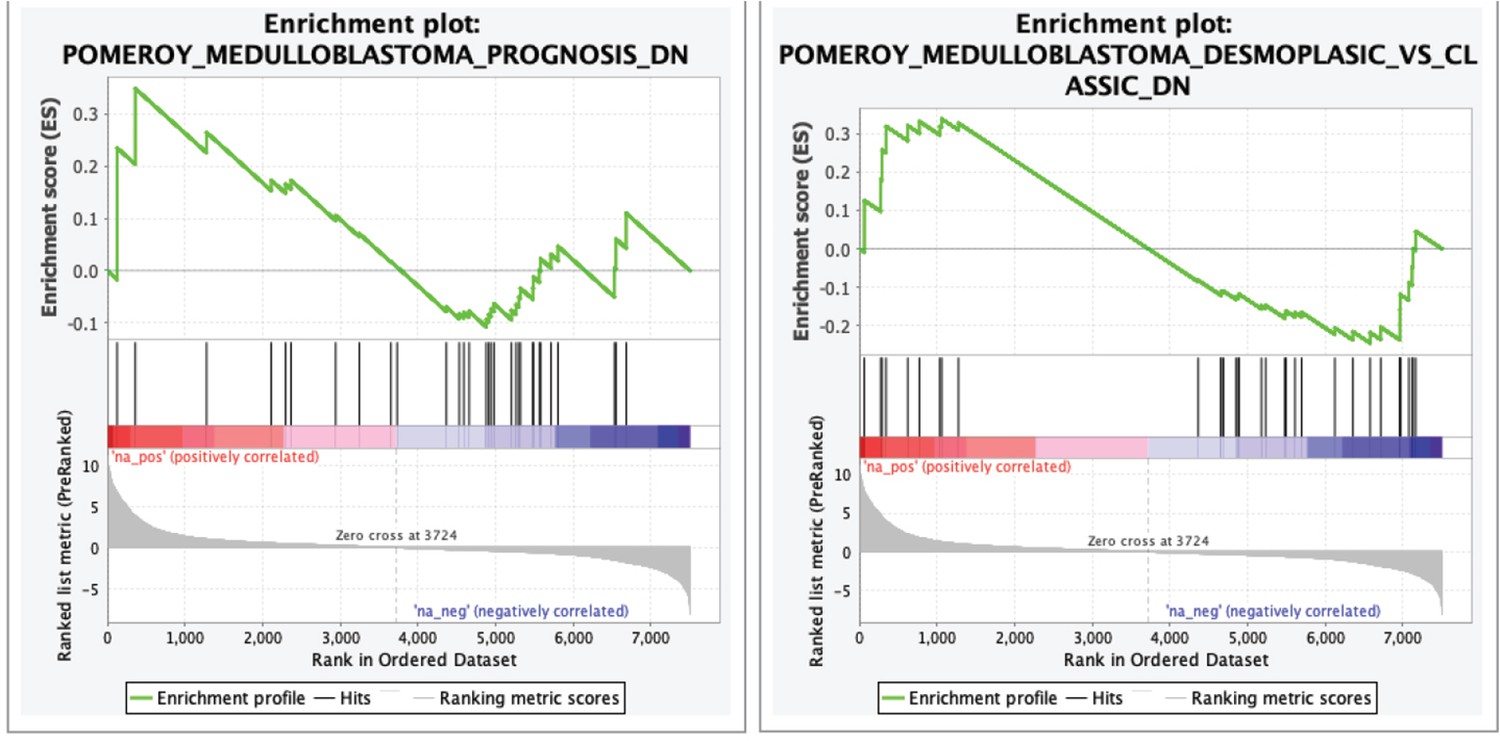
Gene set enrichment analysis (GSEA) showing the enrichment of medulloblastoma gene signatures from Pomeroy et al., with our zebrafish brain tumors.
Log-fold-change derived from the differential expression analysis between tp53-/- to tp53-/-; TP53P153Δ was used with GSEApreranked function (GSEA, v4.0.3, Broad Institute, MA).
Figure 6 with 4 supplements
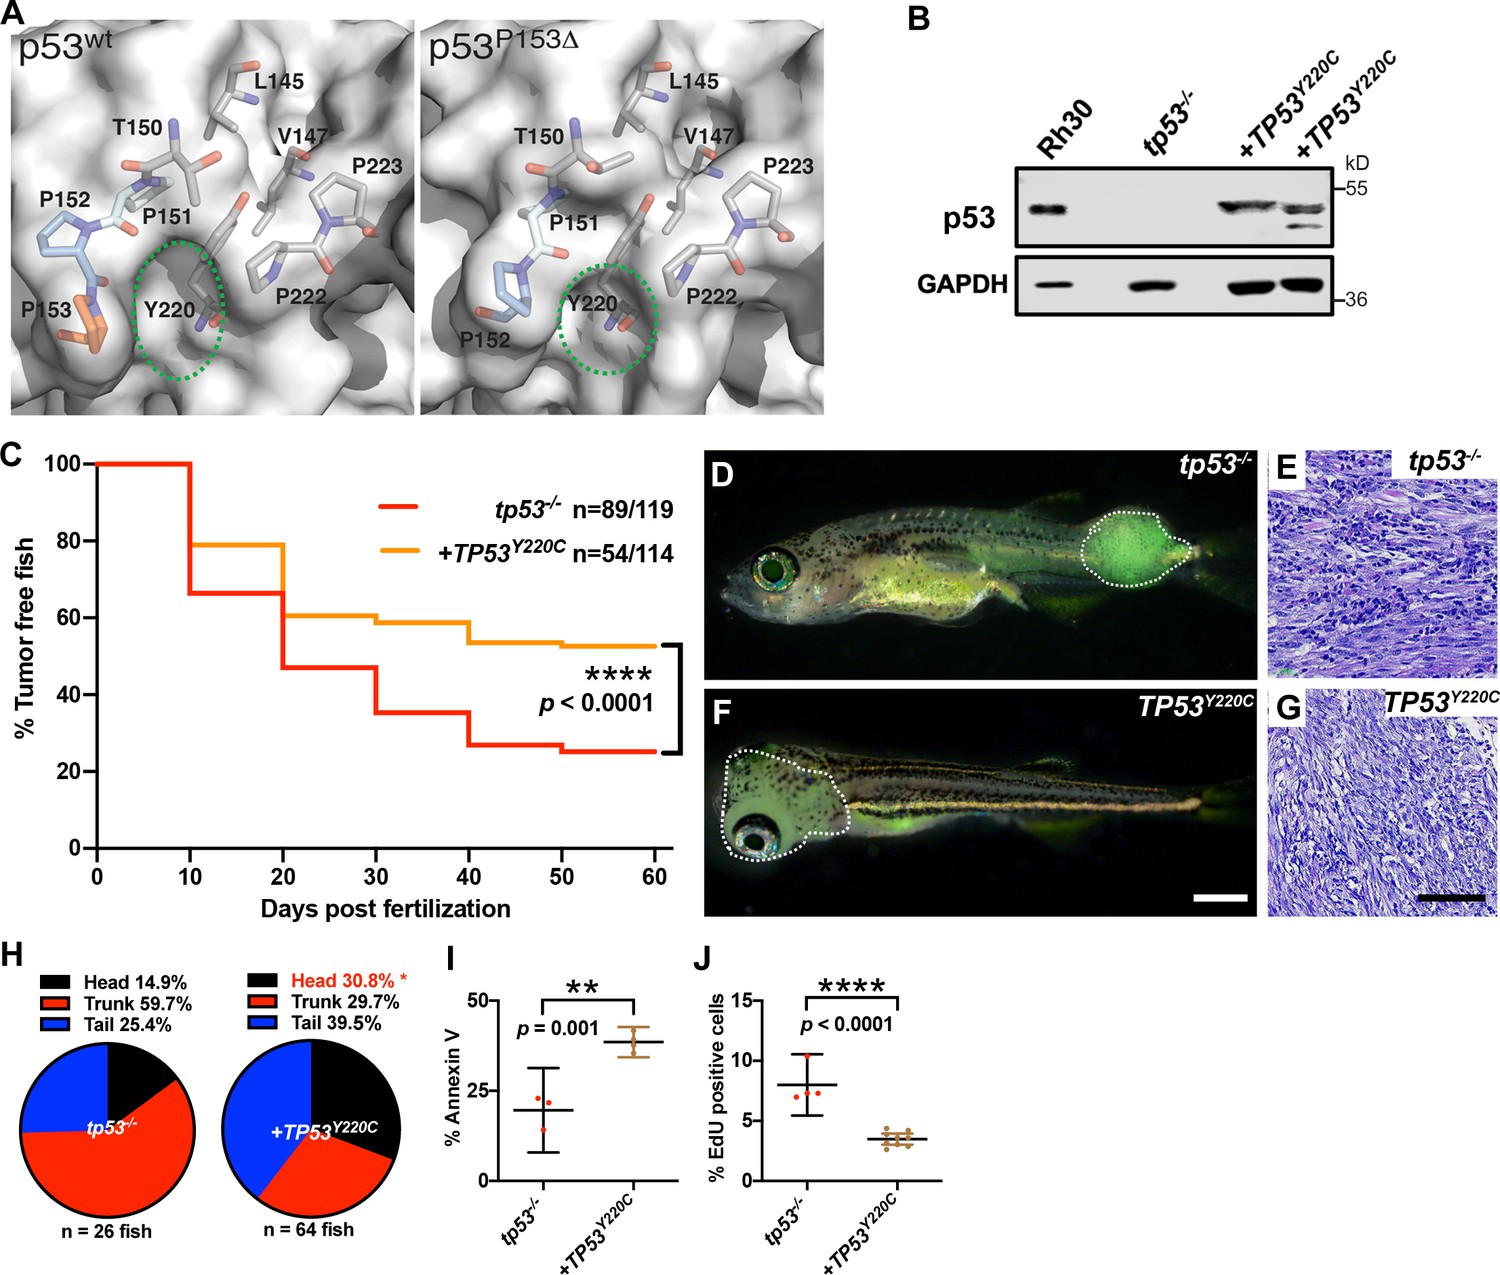
TP53Y220C predisposes to head embryonal rhabdomyosarcoma (ERMS) in zebrafish.
(A) Surface representation of p53WT (PDB 2XWR) and p53P153Δ (homology model) showing key residues lining a surface exposed pocket (sticks). The green ovals compare the size and shape of the pocket between the two structures. (B) p53 protein expression levels in tp53-/- fish tumors with or without TP53Y220C, with rhabdomyosarcoma (RMS) cell line, Rh30, as a control. (C) Kaplan–Meier plot showing tumor initiation in tp53-/- fish, with or without TP53Y220C. (D, F) Representative images of tp53-/- fish with ERMS tumors, with or without TP53Y220C (GFP-positive). Dashed region outlines the tumor. The zebrafish in (F) are 35 d. Scale bar in (F) 1 mm. (E, G) Representative H&E staining of tumors in tp53-/- fish, with or without TP53Y220C. Scale bar = 100 µm. (H) Pie chart showing localization of tumors expressed as a percentage found in varying regions of in tp53-/- fish with and without TP53Y220C. Percentage in red indicates a significant difference to tp53-/- (p=0.01928, two-tailed two proportions Z-test). (I) Quantification of Annexin V staining in tumors of tp53-/- fish with or without expression of TP53Y220C. n = 3–4. (J) Quantification of EdU staining in tumors of tp53-/- fish with or without expression of TP53Y220C. n = 4–9.
Figure 6—figure supplement 1
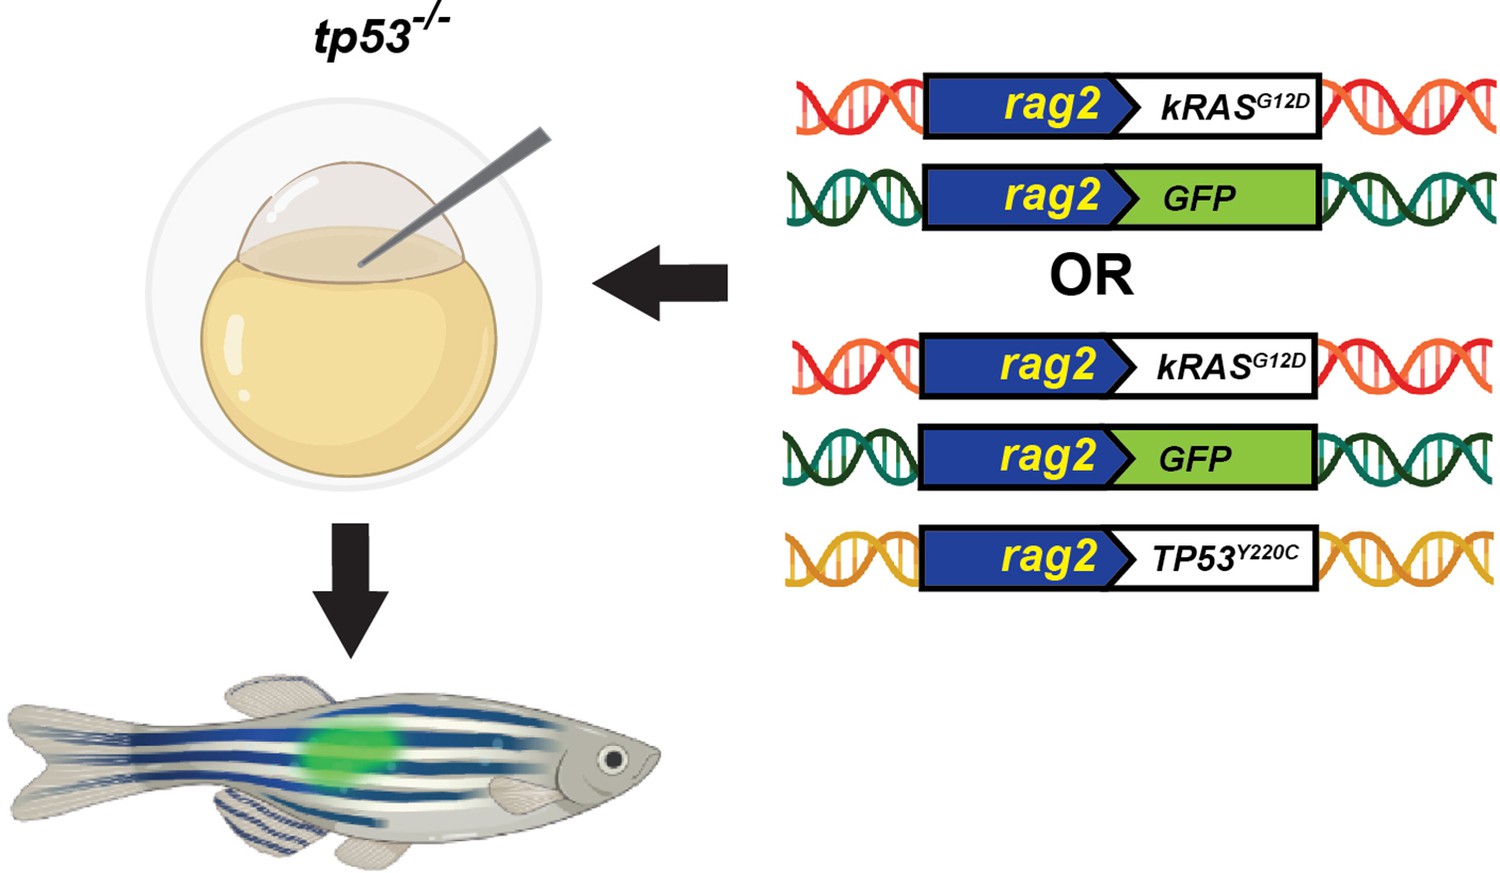
Schematic of the experimental setup to generate embryonal rhabdomyosarcoma (ERMS) tumors in zebrafish via microinjection of indicated linearized DNA constructs into the one-cell-stage zebrafish embryos generated from in crosses of tp53-/- zebrafish.
Figure 6—figure supplement 2
TP53Y220C predisposes to head embryonal rhabdomyosarcoma (ERMS) in zebrafish.
(A) Tumor numbers per zebrafish tumor expressing either no TP53 (tp53-/-) or TP53Y220C. n = 89 (tp53-/-), n = 54 (TP53Y220C). (B) Representative images showing variation in tumor localization in fish expressing mutant TP53 (either DsRed positive or GFP positive). Scale bar = 1 mm. Age of the fish 35–45 d.
Figure 6—figure supplement 3
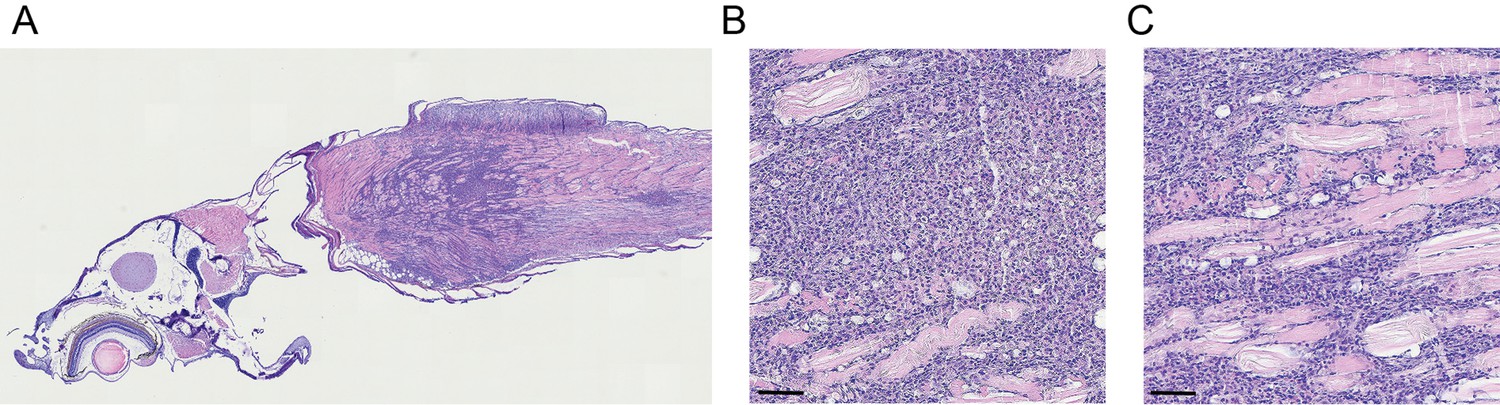
TP53Y220C predisposes to a round blue cell tumor in zebrafish.
(A) H&E section of the head and trunk regions of a tp53-/-;TP53Y220C zebrafish with a round blue cell tumor (×40–60 magnification). (B, C) H&E stained sections at ×20 magnification of tp53-/-;TP53Y220C zebrafish with a round blue cell tumor. Scale bar = 100 µm.
Figure 6—figure supplement 4
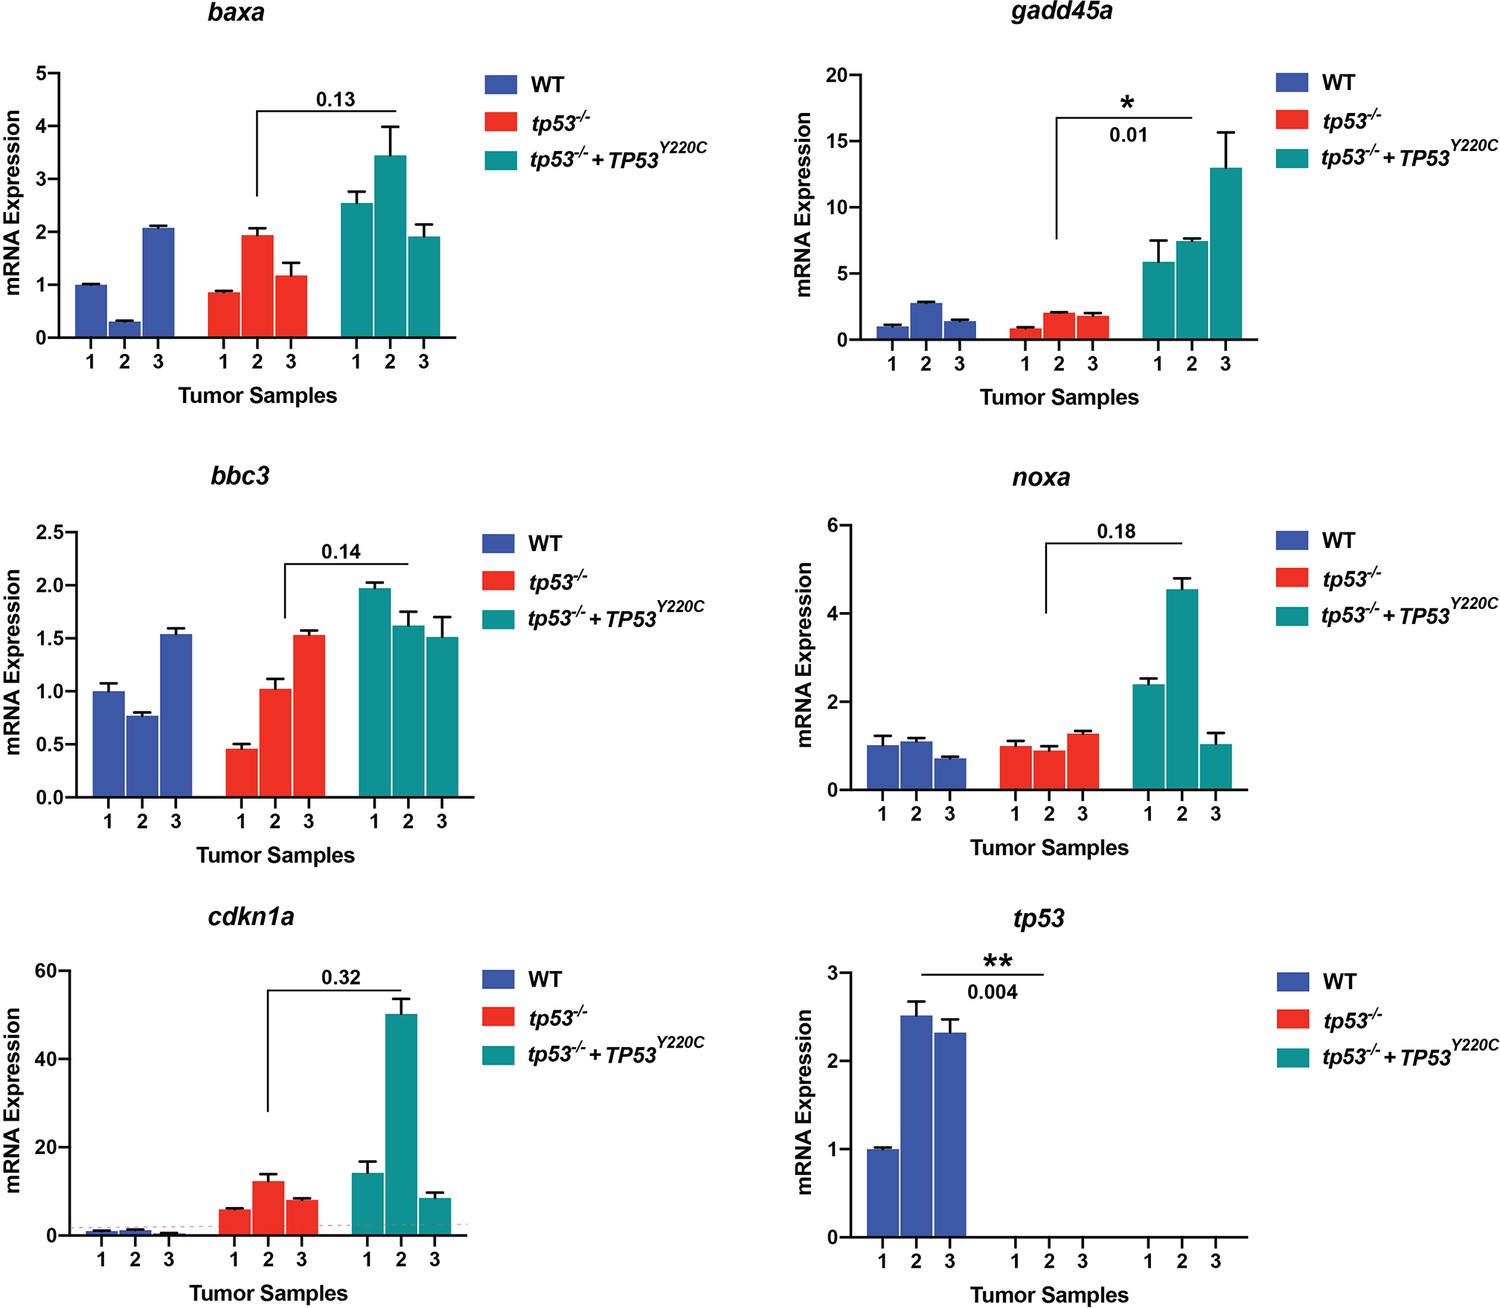
Semi-quantitative qPCR analyses comparing expression of known p53 direct regulated genes baxa, bbc3, cdkn1a, gadd45a, and noxa in primary zebrafish embryonal rhabdomyosarcoma (ERMS) expressing wt tp53 (blue, n = 3), tp53-/- (red, n = 3), and tp53-/- + TP53Y220C (green, n = 3).
Also shown is expression of zebrafish tp53 across the tumors. The wt and tp53-/- tumors are the same controls from Figure 4—figure supplement 3.
Figure 7 with 1 supplement
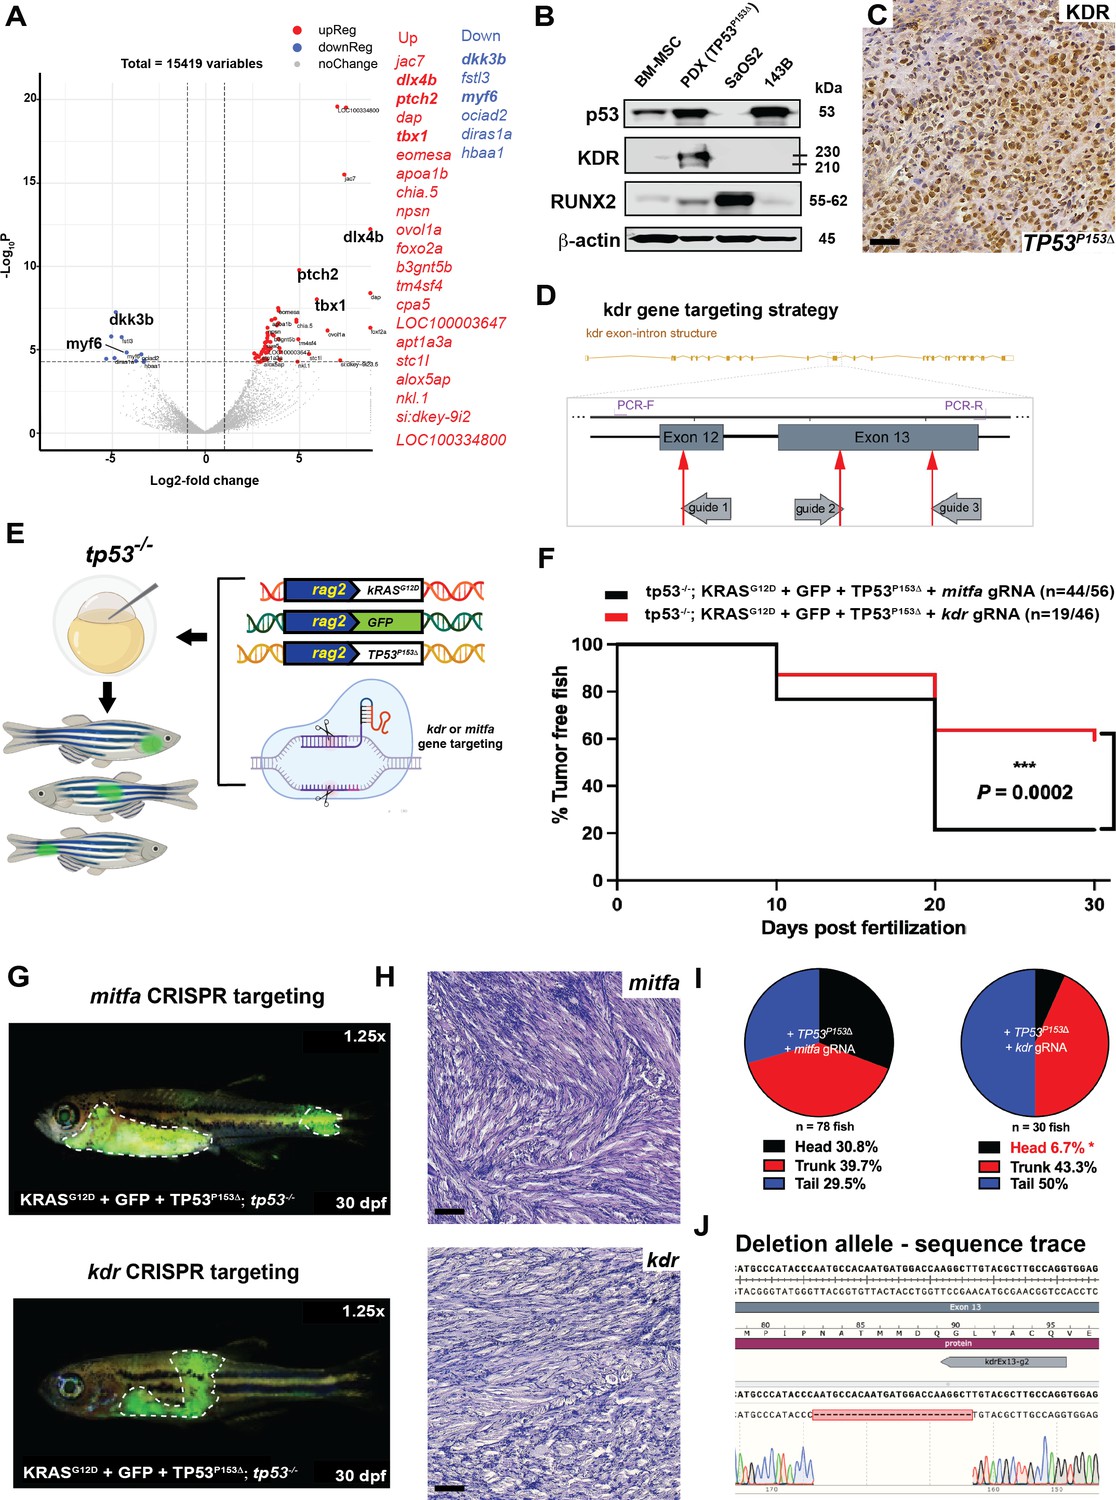
kdr downstream of TP53P153Δ predisposes to head embryonal rhabdomyosarcoma (ERMS) in tp53-/- zebrafish.
(A) Volcano plot comparing head to trunk ERMS tumors. Genes with adj. p-value<0.01 and fold-change >2 are colored in red (upregulated in head tumor) or blue (downregulated in head tumor). Table adjacent the plot shows the top differentially expressed genes. (B) Western blot showing p53, KDR, and RUNX2 protein expression in bone marrow mesenchymal cells, the osteosarcoma PDX expressing TP53P153Δ, and osteosarcoma cell lines SaOS2 and 143B. (C) Representative KDR IHC staining of osteosarcoma PDX expressing p53P153Δ. Scale bar = 60 µm. (E) Schematic demonstrating microinjection into the one-cell-stage zebrafish embryos with the indicated constructs to generate GFP-expressing tumors with either kdr or mitfa mosaically deleted in vivo. (F) Kaplan–Meier plot showing ERMS tumor initiation in tp53-/- fish expression TP53P153Δ with either mitfa or kdr ablation. (H) Representative H&E staining of tumors in tp53-/- fish or tp53-/- fish expressingTP53P153Δ with either mitfa or kdr ablation. Scale bar = 60 µm (G) Representative images of tumor localization in tp53-/- fish with expression of TP53P153Δ with either mitfa or kdr deletion. Fish in the panels are 30 days old. (I) Pie chart showing the percentage of tumors found in varying regions of tp53-/- fish with expression of TP53P153Δ with either mitfa or kdr deletion, showing significant differences in the head region. *p=0.0088 (two-tailed two proportions Z-test). (J) Example of sequencing from an ERMS tumor with a deletion in a portion of kdr exon 13. Five of five of ERMS tumors analyzed have deletions in kdr.
Figure 7—figure supplement 1
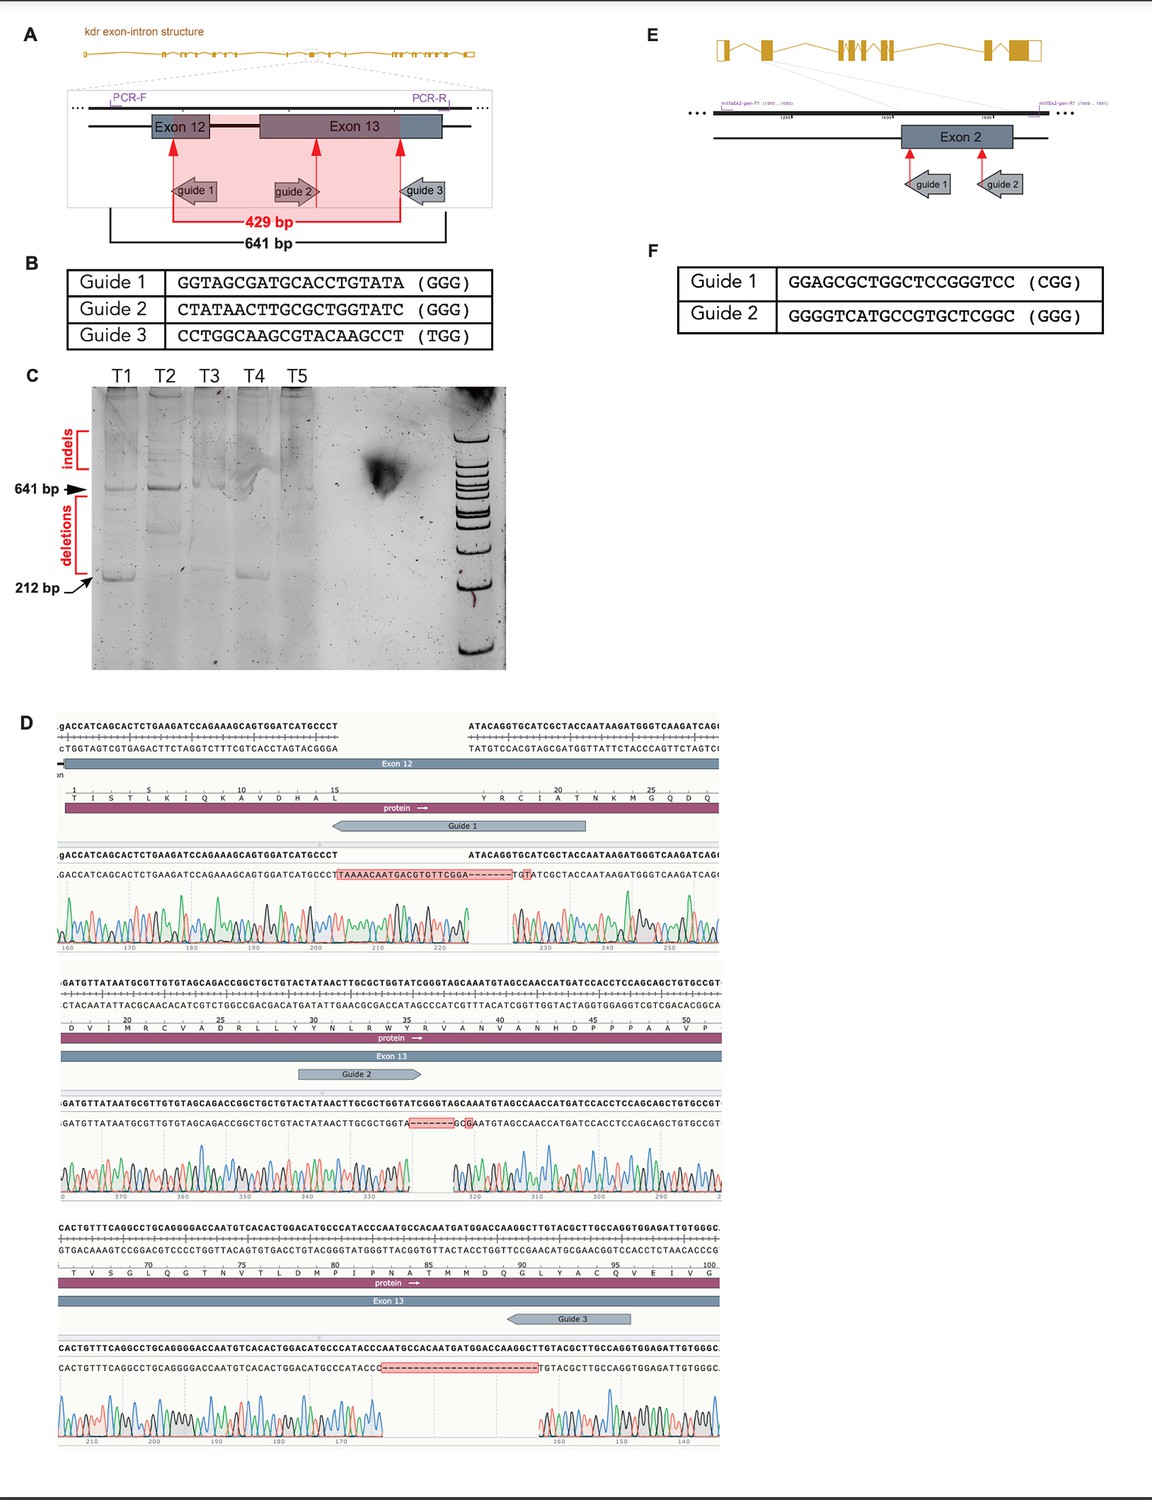
kdr downstream of TP53P153Δ predisposes to head embryonal rhabdomyosarcoma (ERMS) in tp53-/- zebrafish.
(A) Schematic of the strategy to target exons 12 and 13 in kdr that contains the enzymatic catalytic domain. (B) Sequence of the targeting guide RNAs targeting exon 12/13 in zebrafish kdr. (C) Polyacrylamide gel showing wild type, mutant heteroduplex, and complete deletion DNA bands obtained from a 641 PCR amplicon of the region of exons 12 and 13 of kdr that was targeted for ablation by three guide RNAs from five independent embryonal rhabdomyosarcoma (ERMS) tumors (T1–T5) from the tp53-/- + TP53P153Δ + Cas9/gRNA targeting kdr experimental group. The presence of deletions as visualized by small PCR amplicons corresponding to a loss of 334 bp in a 641 bp wild-type PCR product (deletion mutant amplicon = 212 bp). In addition, presence of heteroduplex products can be seen via PAGE, indicating the presence of indels. (D) Trace DNA sequencing reads from four independent tumors showing that the gRNA used are active and can introduce deletions in exons 12 and 13 of kdr. Indels were confirmed by cloning PCR products and sequencing individual clones. Please see indels +21 bp, –7 bp at the g1 site, 7 bp deletion at the g2 site, and 25 bp deletion at the g3 site. (E) Schematic of the strategy to target exon 2 in mitfa. (F) Sequence of the targeting guide RNAs targeting exon 2 in zebrafish mitfa.
Author response image 1
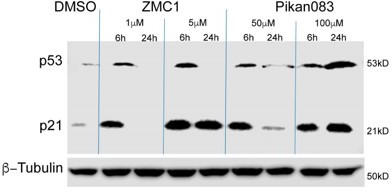
Addition of Pikan083 to EW8 (p53Y220C) ewing sarcoma cells results in increased p53 and p21 expression.
p53 and p21 expression in EW8 cells treated DMSO or with 1 and 5 μM ZMC1 or 50 and 100 μM Pikan083. Β-tubulin was used as a loading control.
Author response image 2
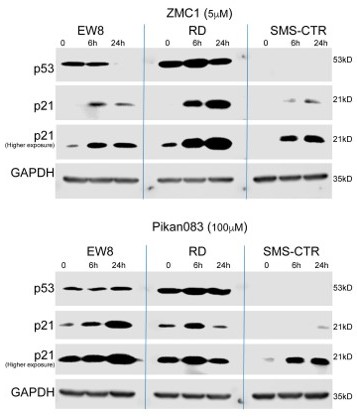
Addition of ZMC1 and Pikan083 has differential effects on p53 and p21 expression in EW8, RD and SMC-CTR cells.
EW8 (p53Y220C), RD (p53R248W) and SMS-CTR (p53 null) cells treated with 5 µM ZMC1 (top panel) or 100 µM Pikan083 (bottom panel). GAPDH was used as a loading control.
Author response image 3
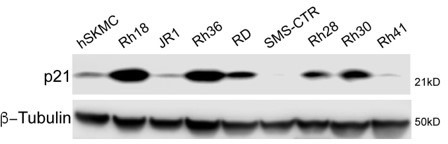
p21 expression across commonly used rhabdomyosarcoma cell lines.
Rh18, Rh36 are WT for p53. RD, JR1, Rh28, Rh30, Rh41 are p53 mutant and SMS-CTR are p53 deficient (Hinson et al., 2013). Β-tubulin was used as a loading control.
Additional files
-
Supplementary file 1
Table summarizing the main findings for wild-type and mutant TP53 on tumor initiation, localization, proliferation, apoptosis, and ability to transactivate gene expression.
- https://cdn.elifesciences.org/articles/68221/elife-68221-supp1-v2.docx
-
Supplementary file 2
Table with RNAseq data for gene expression comparing three kRASG12D;tp53-/-TP53P153Δ;GFP-positive tumors to three kRASG12D; tp53-/-;GFP-positive tumors.
- https://cdn.elifesciences.org/articles/68221/elife-68221-supp2-v2.docx
-
Supplementary file 3
Table with RNAseq data for gene expression comparing one head to two trunks ERMS expressing kRASG12D; tp53-/-;GFP.
- https://cdn.elifesciences.org/articles/68221/elife-68221-supp3-v2.docx
-
Supplementary file 4
List of primers and guide RNAs used in this study.
- https://cdn.elifesciences.org/articles/68221/elife-68221-supp4-v2.docx
-
Supplementary file 5
List of antibodies used in this study.
- https://cdn.elifesciences.org/articles/68221/elife-68221-supp5-v2.docx
-
Supplementary file 6
List of reagents used in this study.
- https://cdn.elifesciences.org/articles/68221/elife-68221-supp6-v2.docx
-
Transparent reporting form
- https://cdn.elifesciences.org/articles/68221/elife-68221-transrepform1-v2.pdf
-
Source data 1
Source data containing full immunoblots for the data presented in the figures.
- https://cdn.elifesciences.org/articles/68221/elife-68221-data1-v2.pptx
Download links
A two-part list of links to download the article, or parts of the article, in various formats.
Downloads (link to download the article as PDF)
Open citations (links to open the citations from this article in various online reference manager services)
Cite this article (links to download the citations from this article in formats compatible with various reference manager tools)
Defining function of wild-type and three patient-specific TP53 mutations in a zebrafish model of embryonal rhabdomyosarcoma
eLife 12:e68221.
https://doi.org/10.7554/eLife.68221


