Spectral signature and behavioral consequence of spontaneous shifts of pupil-linked arousal in human
- Neuroscience Institute, New York University School of Medicine, United States
- Departments of Neurology, Neuroscience & Physiology, and Radiology, New York University School of Medicine, United States
Figures
Figure 1
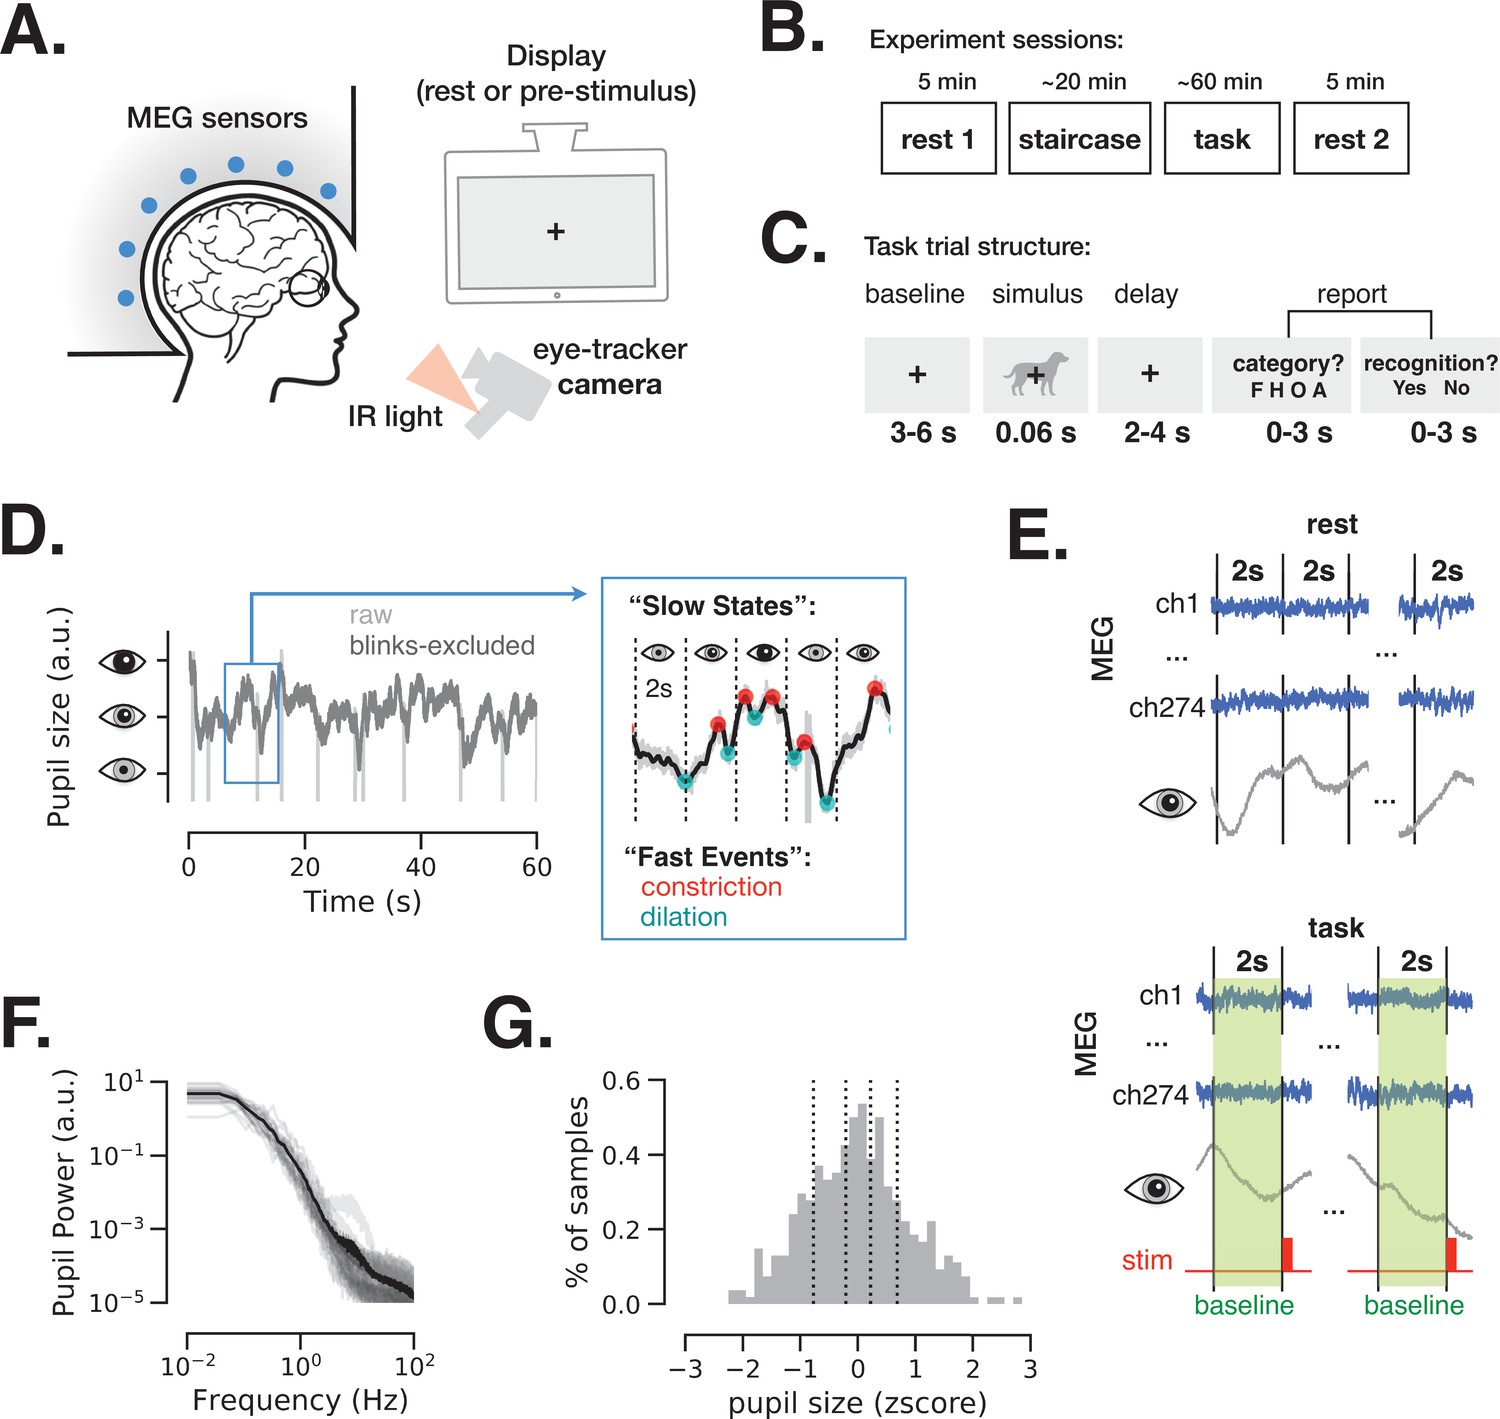
Magnetoencephalography (MEG) and pupil size monitoring in rest and task.
(A) The experiment included simultaneous MEG recordings and eye-tracking while participants (N = 24) fixated at all times the fixation cross is present. (B) Acquisition timeline: two 5 min rest sessions (beginning and end), a staircase procedure determining the threshold contrast and a main task involving liminal stimuli presented at a staircase-determined contrast. (C) Each trial of the task included a prestimulus interval, followed by a liminal object stimulus (i.e., leading to ~50% ‘yes’ reports) and two forced-choice decisions: first, ‘category’ (face, house, object, or animal) of the stimulus and, second, ‘recognition’ (yes or no) to indicate whether a meaningful stimulus was perceived or not. A meaningful stimulus was present on most trials (n = 300) whereas a scrambled image was presented on the remaining trials (n = 60, more details in Figure 4). (D) An example 1-min pupil size recording during rest. Light gray trace depicts raw data and dark gray trace depicts the same time course with blink periods excluded and 5 Hz low-pass filter applied. The blue-frame inset shows magnified 10 s recording with pupillary constriction/dilation ‘events’ (red/cyan) and examples of slower ‘states’ spanning 2 s non-overlapping time windows. (E) To study variation in slow states, we defined consecutive non-overlapping 2 s epochs in rest and 2 s baseline periods before each stimulus presentation in task. (F) Power spectrum of a 5 min pupil size recording in rest reveals aperiodic pupil fluctuations since no oscillatory peaks are evident. Transparent light gray curves denote individual subjects and solid black curve denotes across-subject average spectrum. (G) Example distribution of ‘slow state’ pupil size (i.e., averaged in 2 s windows) recorded during rest for one subject. The black lines depict percentiles (20, 40, 60, 80) according to which the 2 s windows were split in groups in Figures 2 and 4. Source data is available as a supplementary file.
-
Figure 1—source data 1
Source data for Figure 1F, including power spectrum of pupil size fluctuations from individual subjects.
- https://cdn.elifesciences.org/articles/68265/elife-68265-fig1-data1-v2.csv
Figure 2

Dynamic imaging of coherent sources (DICS) power maps of resting state and prestimulus baseline brain activity grouped according to pupil size.
(A) The source power analysis (DICS) conducted in 2 s non-overlapping time windows recorded during continuous resting state fixation. The 2 s windows were grouped according to the five pupil size percentiles (0–20%, 20–40%, 40–60%, 60–80%, 80–100%). Power in each frequency band is normalized by average power across all pupil sizes. (B) Same as A but for 2 s prestimulus intervals extracted from task data.
Figure 3 with 4 supplements
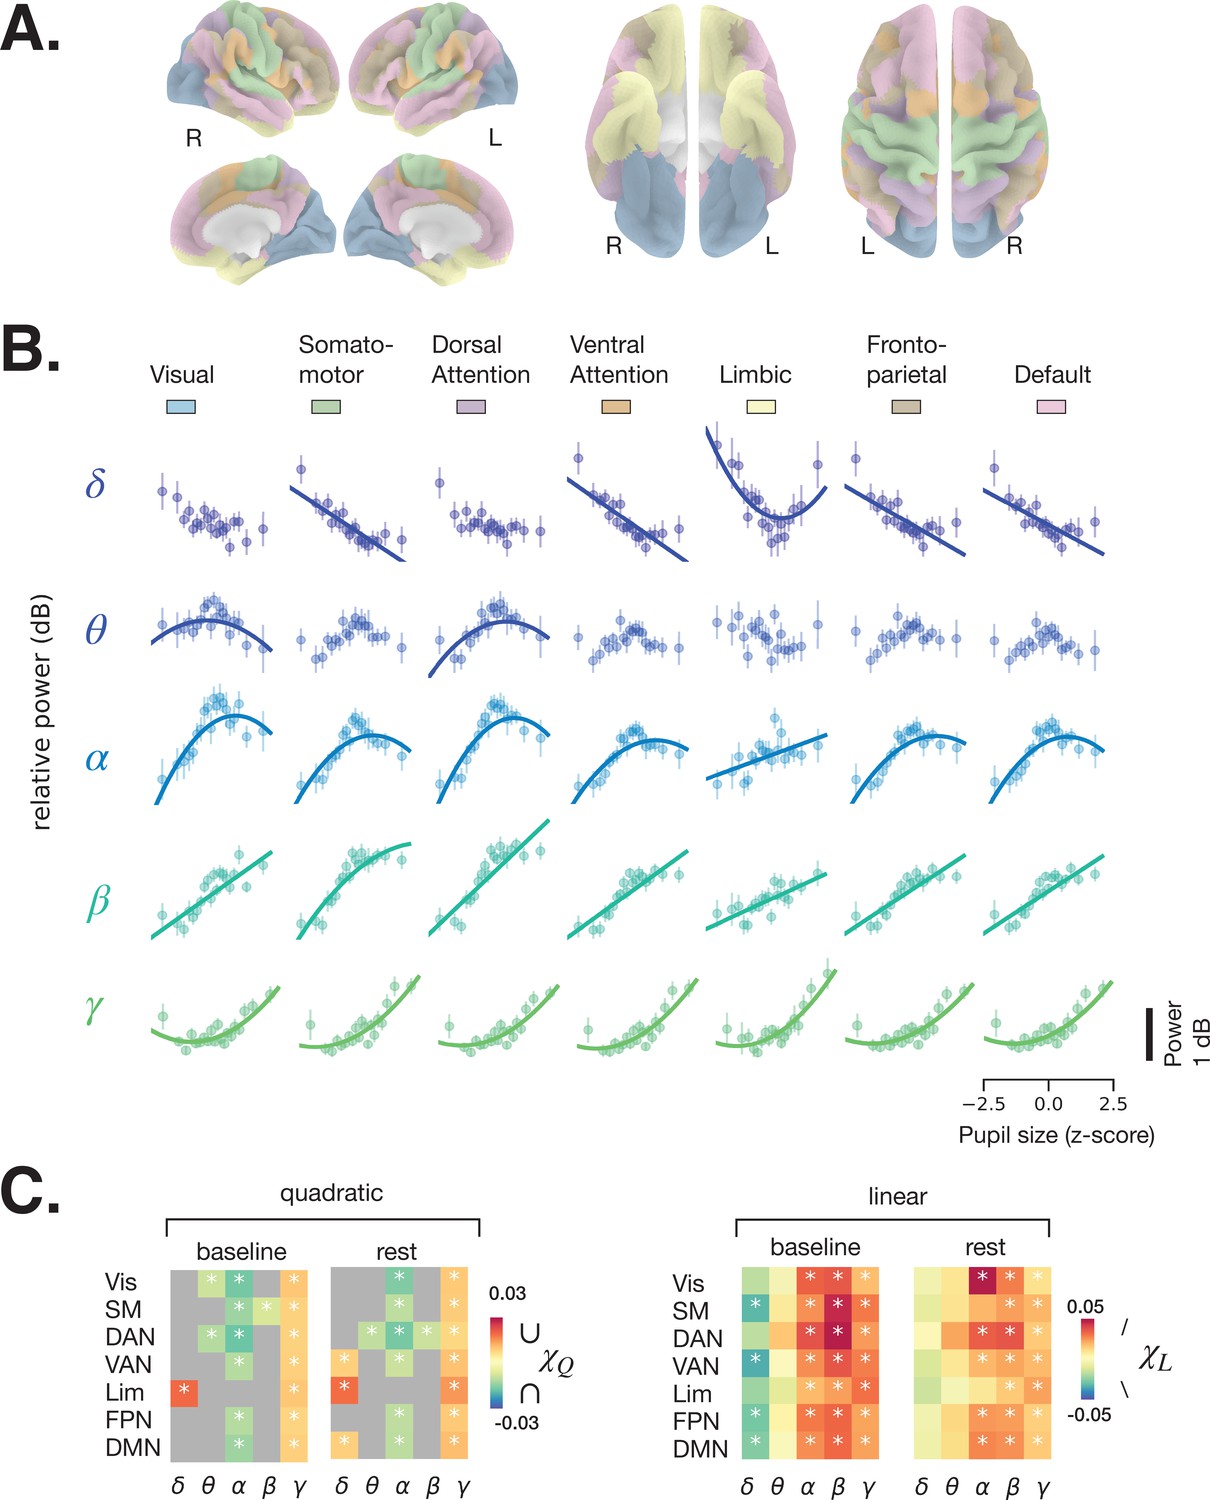
Spectral power of spontaneous activity in all frequency bands covaries with pupil size across large-scale resting state networks (RSNs).
(A) Human functional RSNs according to Yeo 2011 atlas (Yeo et al., 2011). (B) Predicted fit of spectral power based on pupil size was estimated using linear mixed models in prestimulus baseline data (equivalent results from rest are shown in Figure 3—figure supplement 1, and single-subject data in Figure 3—figure supplement 2 and Figure 3—figure supplement 3). For visualization purposes only, the spectral power was binned by pupil size percentiles in 5% intervals; colored circles and error bars represent mean and standard error of the mean across subjects, respectively. The models were fit using all individual epochs (n = 8460 prestimulus, n = 6705 rest, N = 24). Only models with a lower Bayesian information criterion (BIC) and a significant parameter estimate (p < 0.05, FDR-corrected) are plotted. (C) Parameter estimates of the quadratic () and linear () components of each model fit to resting state and prestimulus baseline data. Gray color indicates that a model with a linear component only was preferred (lower BIC), otherwise both and are plotted for the quadratic model. Vis: visual, SM: somatomotor, DAN: dorsal attention network, VAN: ventral attention network, Lim: limbic, FPN: frontoparietal network, DMN: default-mode network. Asterisks denote p < 0.05 after FDR correction across RSNs. Figure source data is available as a supplementary file.
-
Figure 3—source data 1
Source data for Figure 3B, including individual subject-level data for power-pupil relationship per RSN and frequency band using prestimulus baseline data.
- https://cdn.elifesciences.org/articles/68265/elife-68265-fig3-data1-v2.csv
-
Figure 3—source data 2
Source data for Figure 3—figure supplement 1, including individual subject-level data for power-pupil relationship per RSN and frequency band using resting state data.
- https://cdn.elifesciences.org/articles/68265/elife-68265-fig3-data2-v2.csv
Figure 3—figure supplement 1
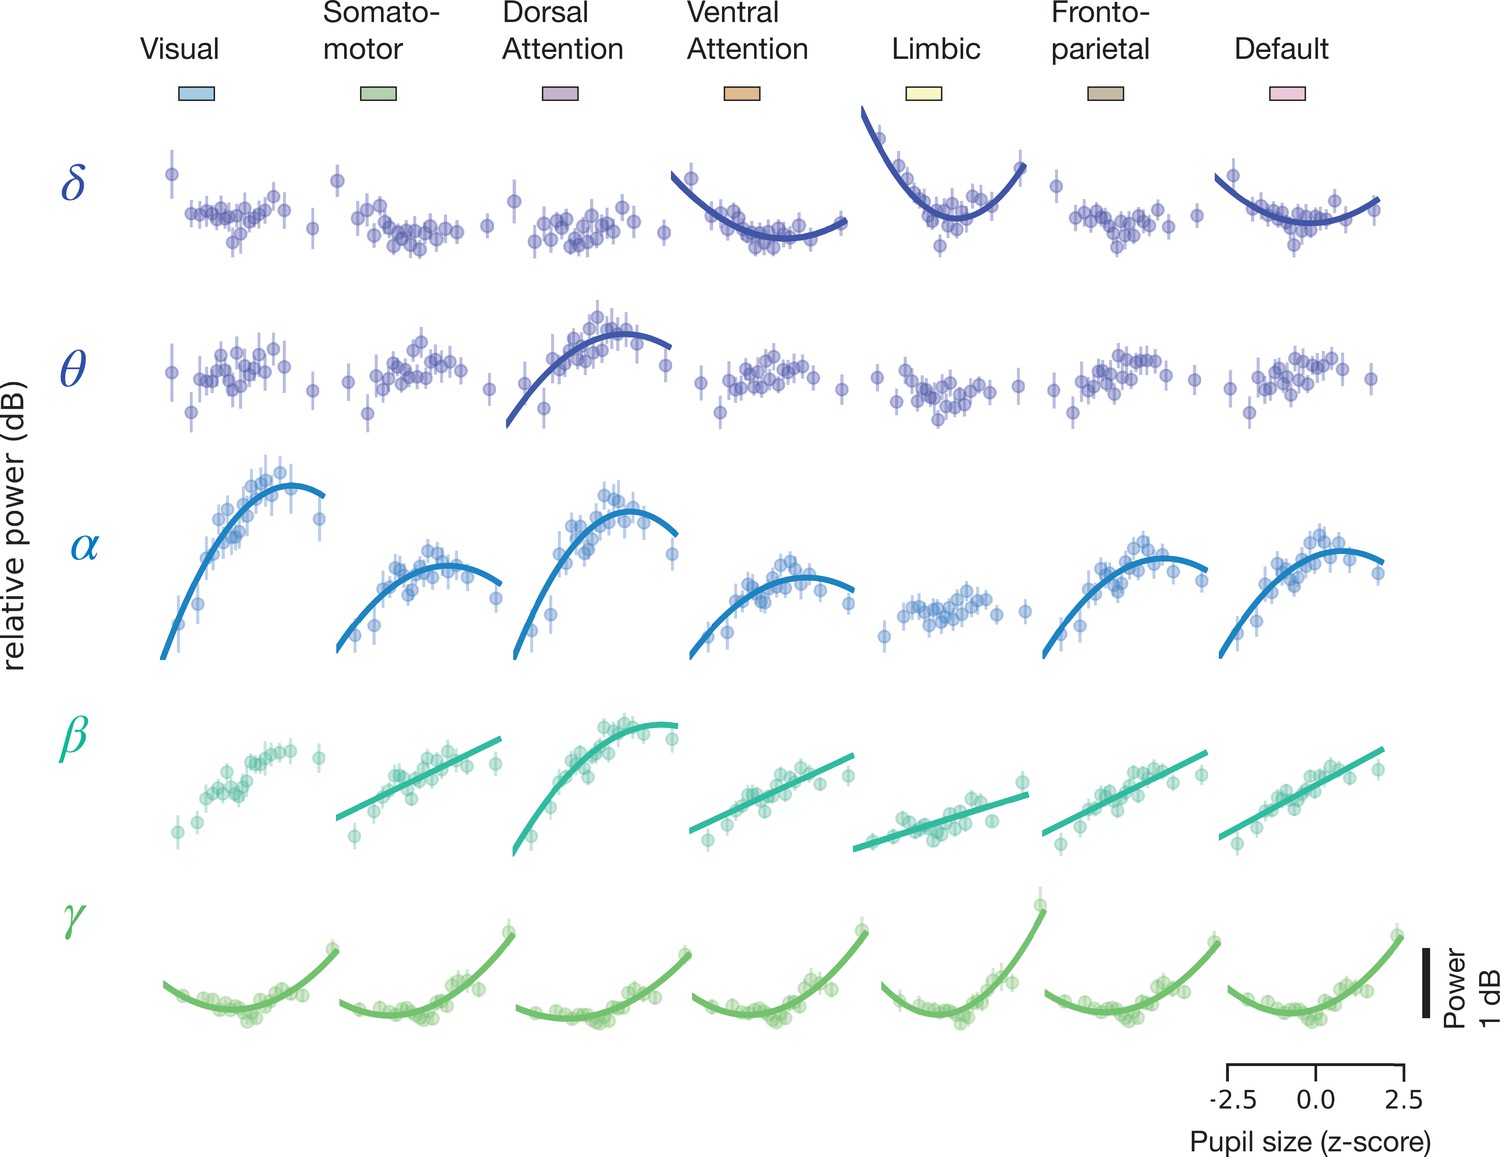
Same as Figure 3B, but for resting state data.
Figure 3—figure supplement 2
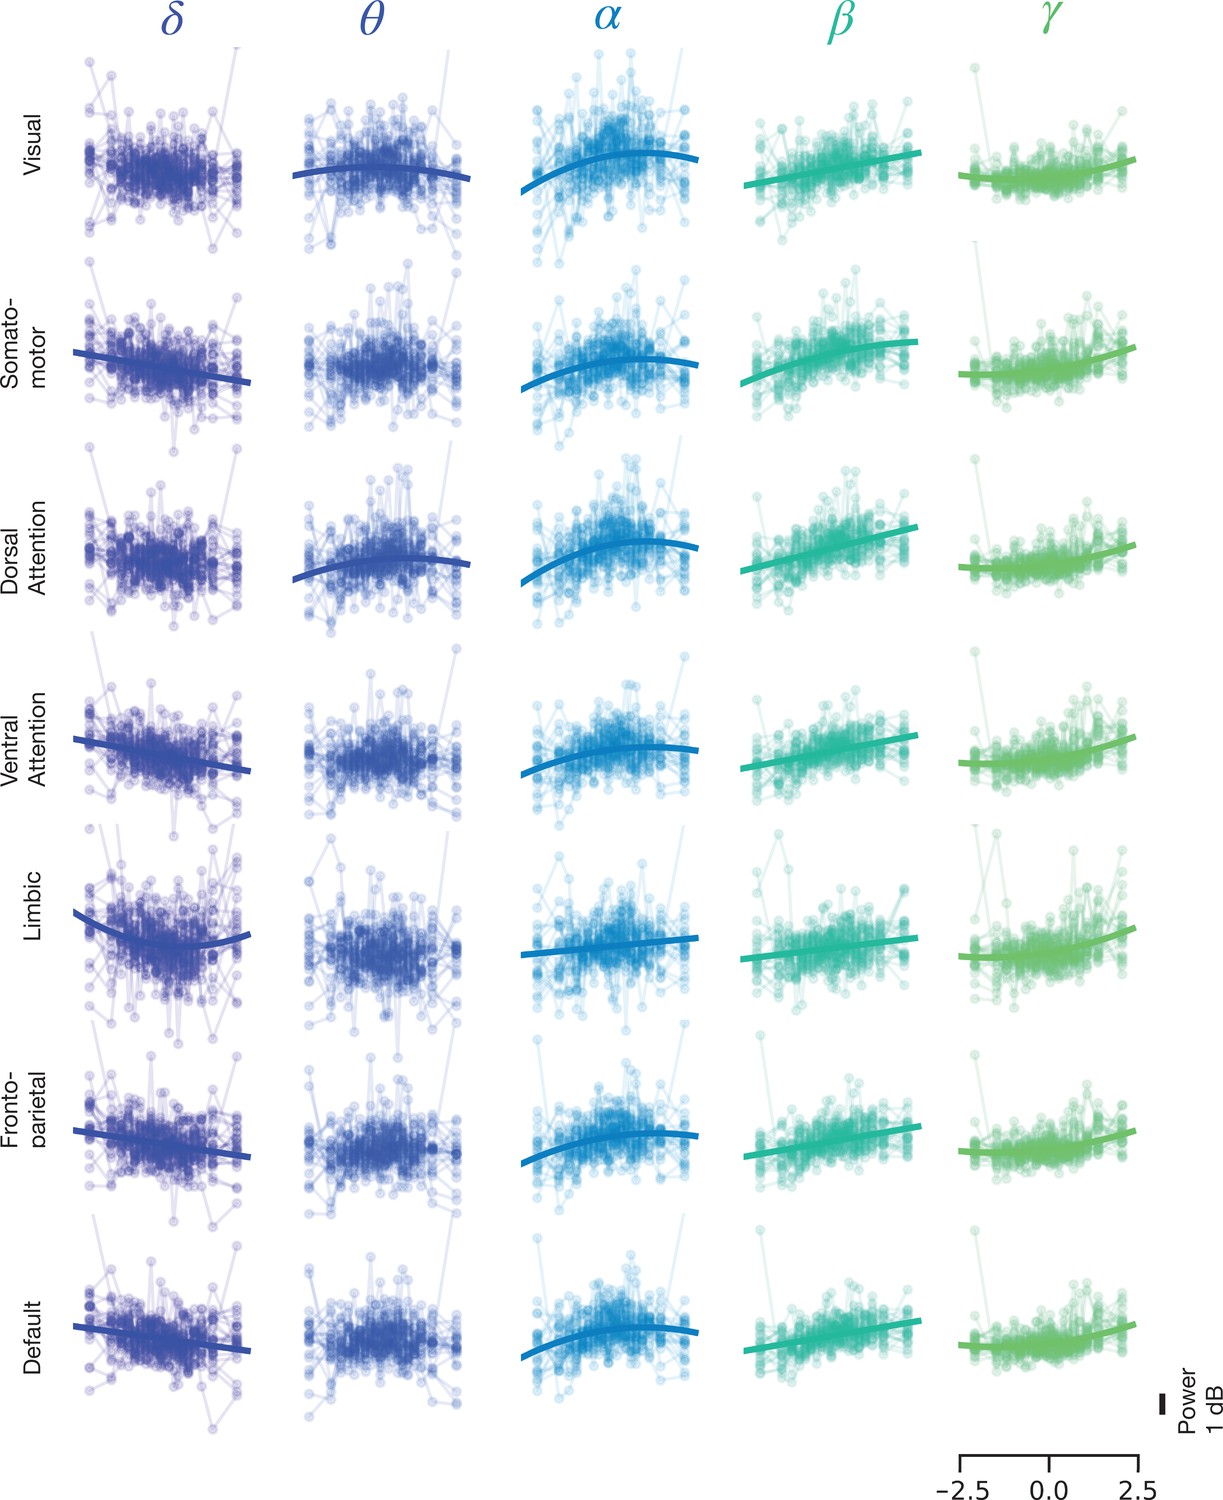
Same as Figure 3B, with individual subject data.
Figure 3—figure supplement 3

Same as Figure 3B, but for resting state with individual subject data.
Figure 3—figure supplement 4
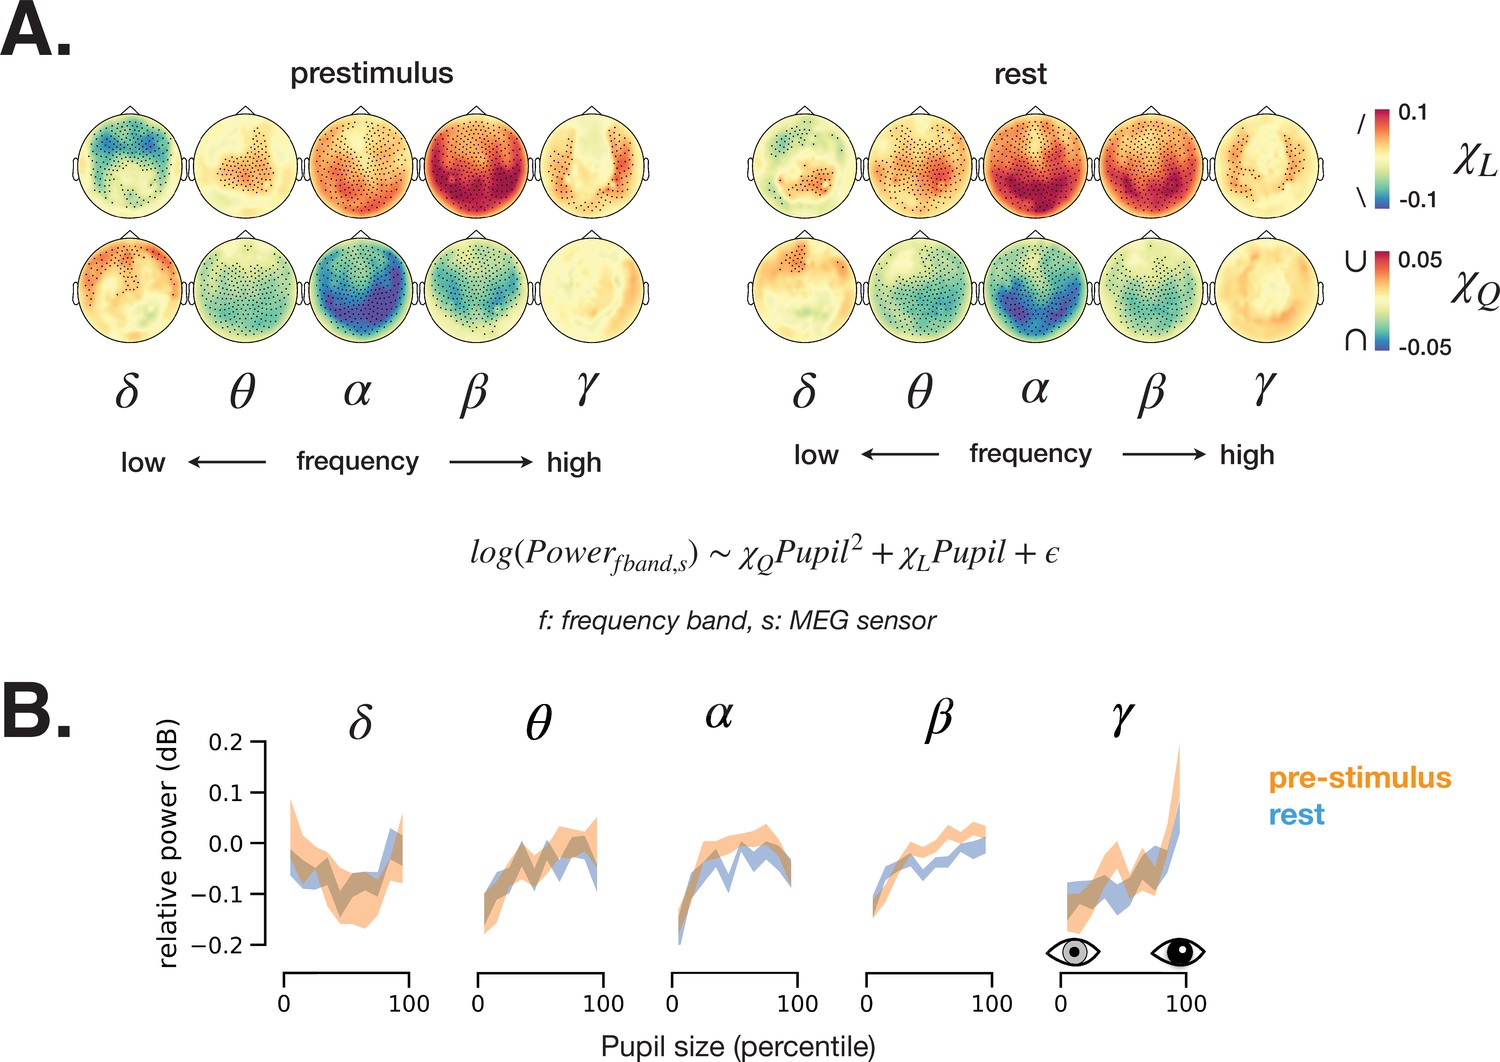
Analysis of pupil-linked spectral power in sensor-level magnetoencephalography (MEG) data.
(A) Parameters estimates of a quadratic model. Black dots indicate significance after spatial cluster correction. (B) Averaged relative spectral power in significant sensors, shading indicates standard error of the mean across subjects.
Figure 4 with 1 supplement

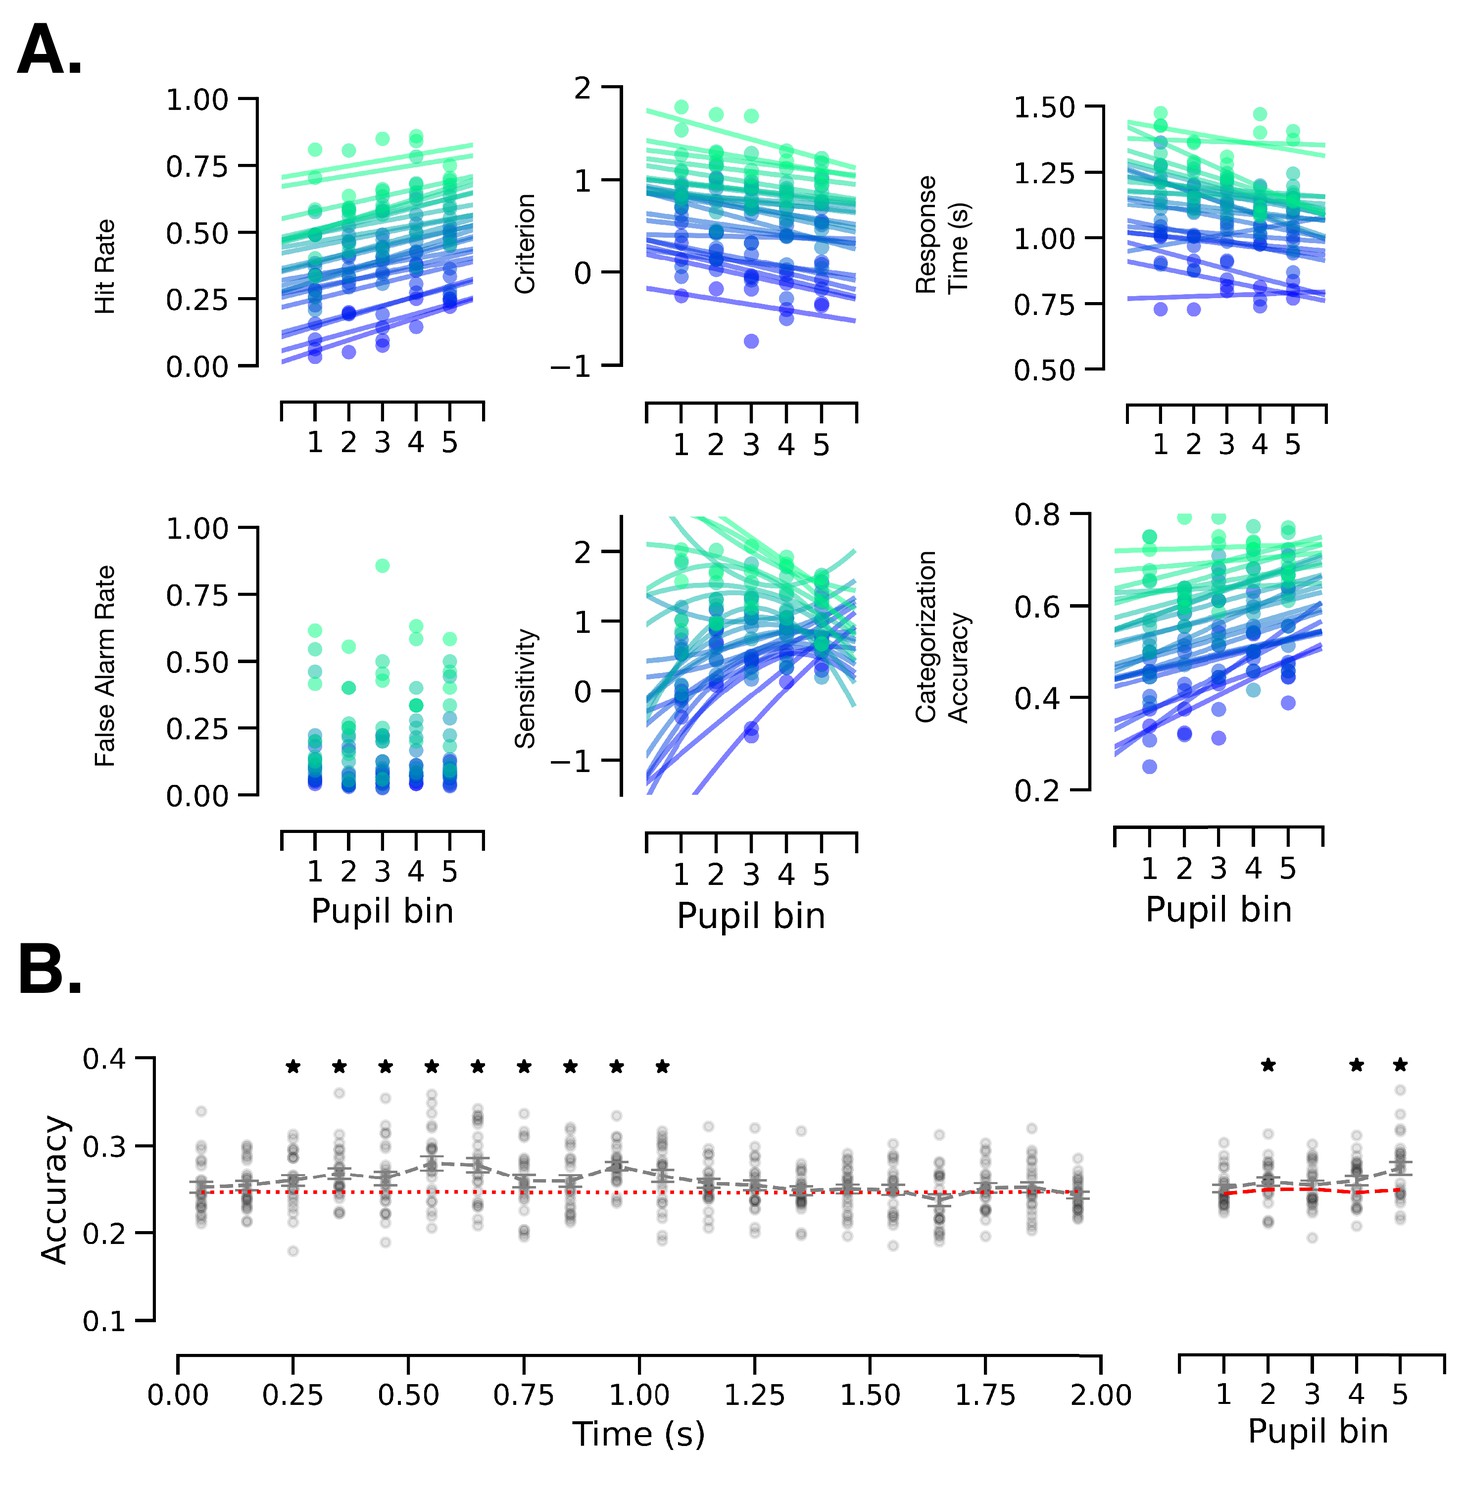
Behavioral and neural consequence of variation in baseline pupil-linked state.
(A) Schematic of experimental stimulus types and their classification into behavioral metrics. C: correct, I: incorrect, FA: false alarm, CR: correct rejection. (B) Illustration of changes in detection criterion and sensitivity with prestimulus baseline pupil-linked state, summarizing results in (C). (C) Recognition behavior in a perceptual decision-making task in groups of trials sorted in bins according to prestimulus baseline pupil size. Statistical tests were performed using linear mixed model (LMM). Models with quadratic and linear or only linear terms were considered and plotted when the fit was significant (p < 0.05, full statistics are given in Table 1). (D) Categorization behavior: reaction time (top) and categorization accuracy (bottom) as a function of prestimulus baseline pupil size. (E) Single-trial decoding of stimulus category from whole-brain sensor-level stimulus-triggered magnetoencephalography (MEG) activity. The heatmap shows decoding accuracy in trials sorted according to prestimulus baseline pupil size (rows) and in 100 ms time windows following stimulus onset (columns). The top and right panels show averaged decoding accuracy across pupil-linked states or time; red dashed lines indicate the empirical chance level obtained through label permutations (K = 500) and asterisks indicate the time points/conditions where decoding accuracy was significantly better than chance (p < 0.05, FDR-corrected, label permutation test). Two-way repeated-measures ANOVA shows significant main effects of decoding time and prestimulus pupil diameter on decoding accuracy (p < 0.05) with no significant interaction. Error bars in all panels indicate s.e.m. across subjects.
-
Figure 4—source data 1
Source data for Figure 4C,D, including individual subject-level data for perceptual behavior as a function of pupil size.
- https://cdn.elifesciences.org/articles/68265/elife-68265-fig4-data1-v2.csv
-
Figure 4—source data 2
Source data for Figure 4E, including individual subject-level data for post-stimulus category decoding accuracy according to time point and prestimulus pupil size.
- https://cdn.elifesciences.org/articles/68265/elife-68265-fig4-data2-v2.csv
Figure 4—figure supplement 1
Individual-subject data accompanying Figure 4C,D,E.
(A) Behavior in a perceptual decision-making task in groups of trials sorted in bins according to prestimulus baseline pupil size. Individual subject data and model fit are shown. Each color represents one subject. (B) Decoding accuracy for individual subjects.
Figure 5
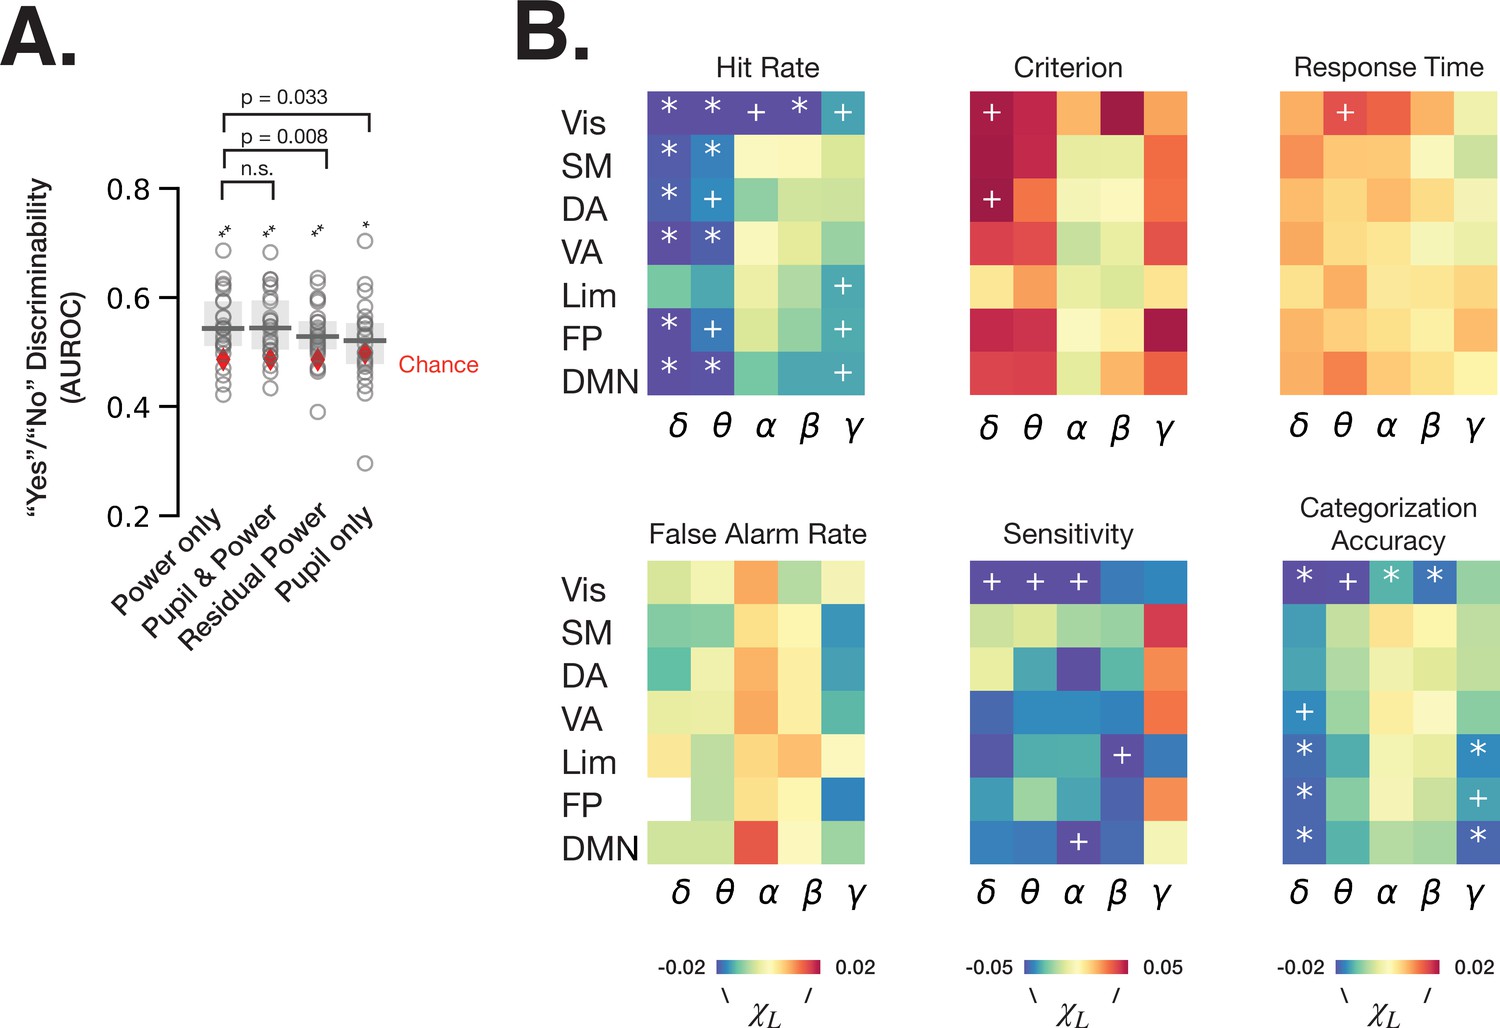
Spontaneous fluctuations of power shape behavior through both arousal-linked and arousal-independent mechanisms.
(A) Performance of logistic regression models (quantified as AUROC [area under the receiver-operator curve]) predicting recognition behavior (‘yes’/’no’ reports) from prestimulus power in all frequency bands and resting state networks (RSNs) (‘power only’), with prestimulus pupil size in addition to power (‘pupil and power’), with residual power that was independent from pupil size (‘residual power’), and with prestimulus pupil size as a single model feature (‘pupil only’). Model performance was compared against chance through label permutation tests (* indicates p < 0.05, **p < 0.01 after FDR correction). ‘Power only’ model performance was compared with other models by Wilcoxon signed-rank test. (B) Parameter estimates of fitted linear mixed-effects model (LMM) where the trials were sorted according to the residual (independent-of-pupil) power. Each table element indicates parameter estimate for one frequency band and one RSN. * indicate p < 0.05 after FDR correction across RSNs, and + indicate p < 0.05 uncorrected (full statistics can be found in Table S2). Source data is available as a supplementary file.
-
Figure 5—source data 1
Source data for Figure 5A, including individual subject-level data for “Yes”/“No” discrimination.
- https://cdn.elifesciences.org/articles/68265/elife-68265-fig5-data1-v2.csv
-
Figure 5—source data 2
Source data for Figure 5B, including individual subject-level data for residual power’s relationship to perceptual behavior, separately for each RSN and frequency band.
- https://cdn.elifesciences.org/articles/68265/elife-68265-fig5-data2-v2.csv
Figure 6 with 1 supplement
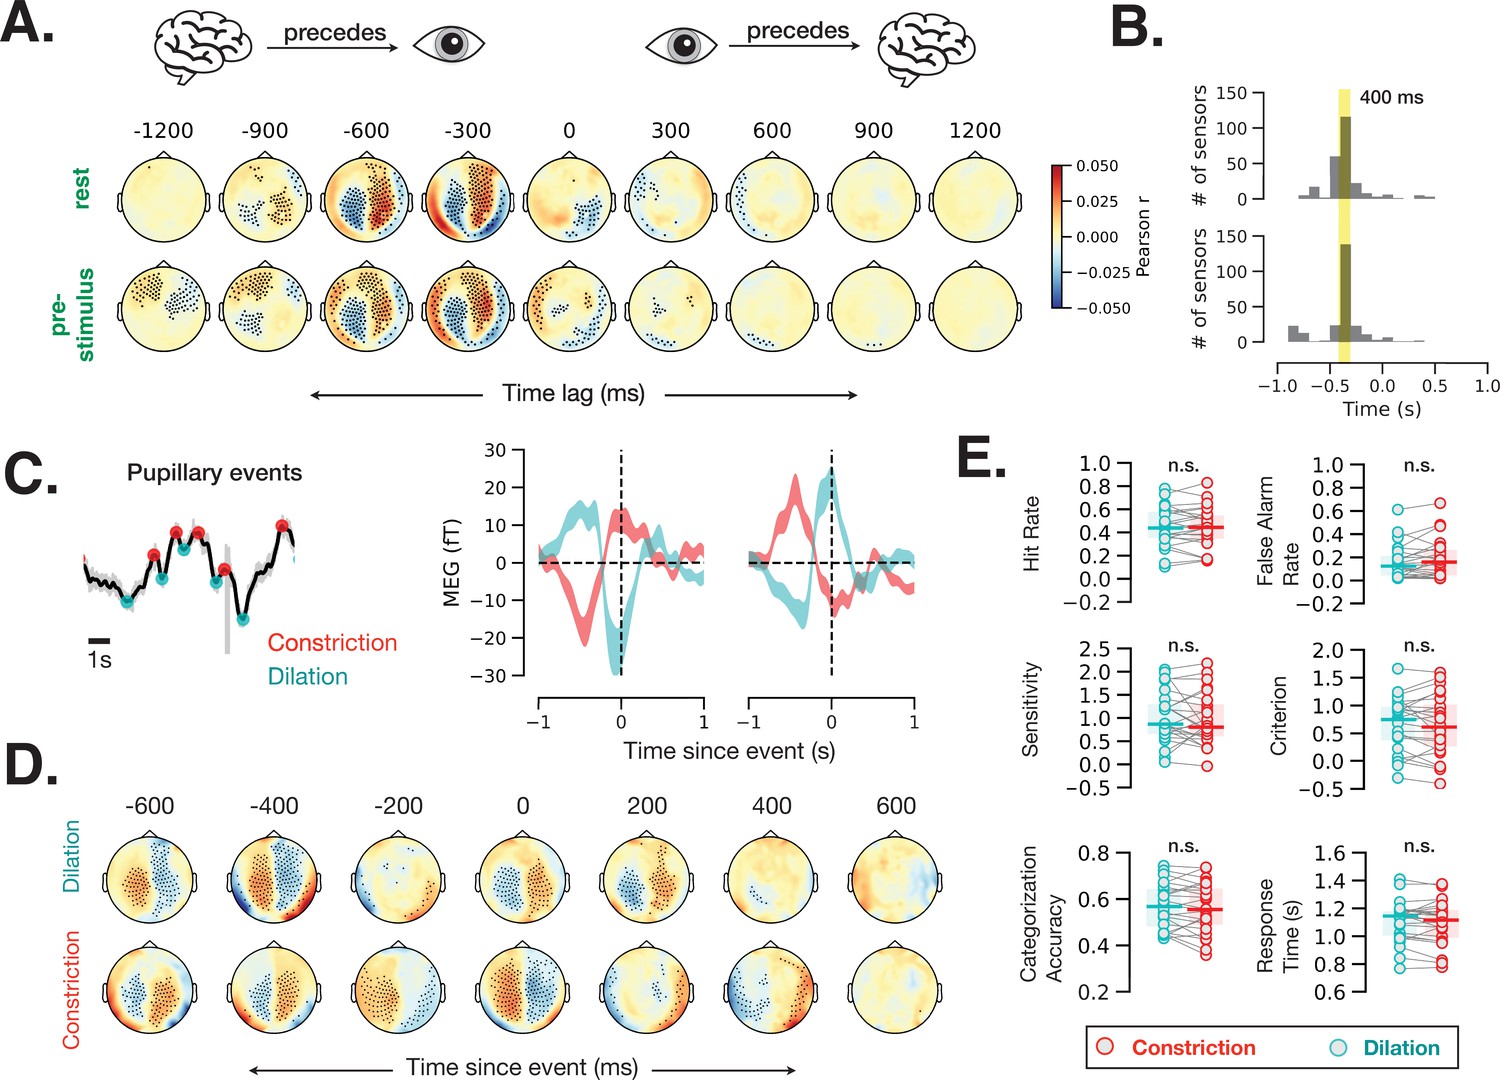
Fast (sub-second) timescale of pupil and brain interaction.
(A) Cross-correlation between pupil size and sensor-level magnetoencephalography (MEG) activity during rest and prestimulus baseline. (B) Distribution of the cross-correlation peak and trough times in MEG sensors that showed significant correlation at any time point. Most sensors correlate with pupil size with a 400 ms delay. (C) Example of identified pupillary events, spontaneous constriction and dilation, and MEG activity triggered by such events in two occipital MEG sensors. (D) Same analysis as (C) across all sensors. Black dots in A and D indicate significant sensor-time locations (p < 0.05, spatiotemporal cluster-based permutation test). (E) A lack of behavioral consequence of stimulus presentation during a constriction or a dilation event. Constriction and dilatation are defined as a decreasing/increasing pupil size in the 100 ms before stimulus presentation.
-
Figure 6—source data 1
Source data for Figure 6E, including individual subject-level data for perceptual behavior sorted by prestimulus fast pupil dynamics.
- https://cdn.elifesciences.org/articles/68265/elife-68265-fig6-data1-v2.csv
Figure 6—figure supplement 1
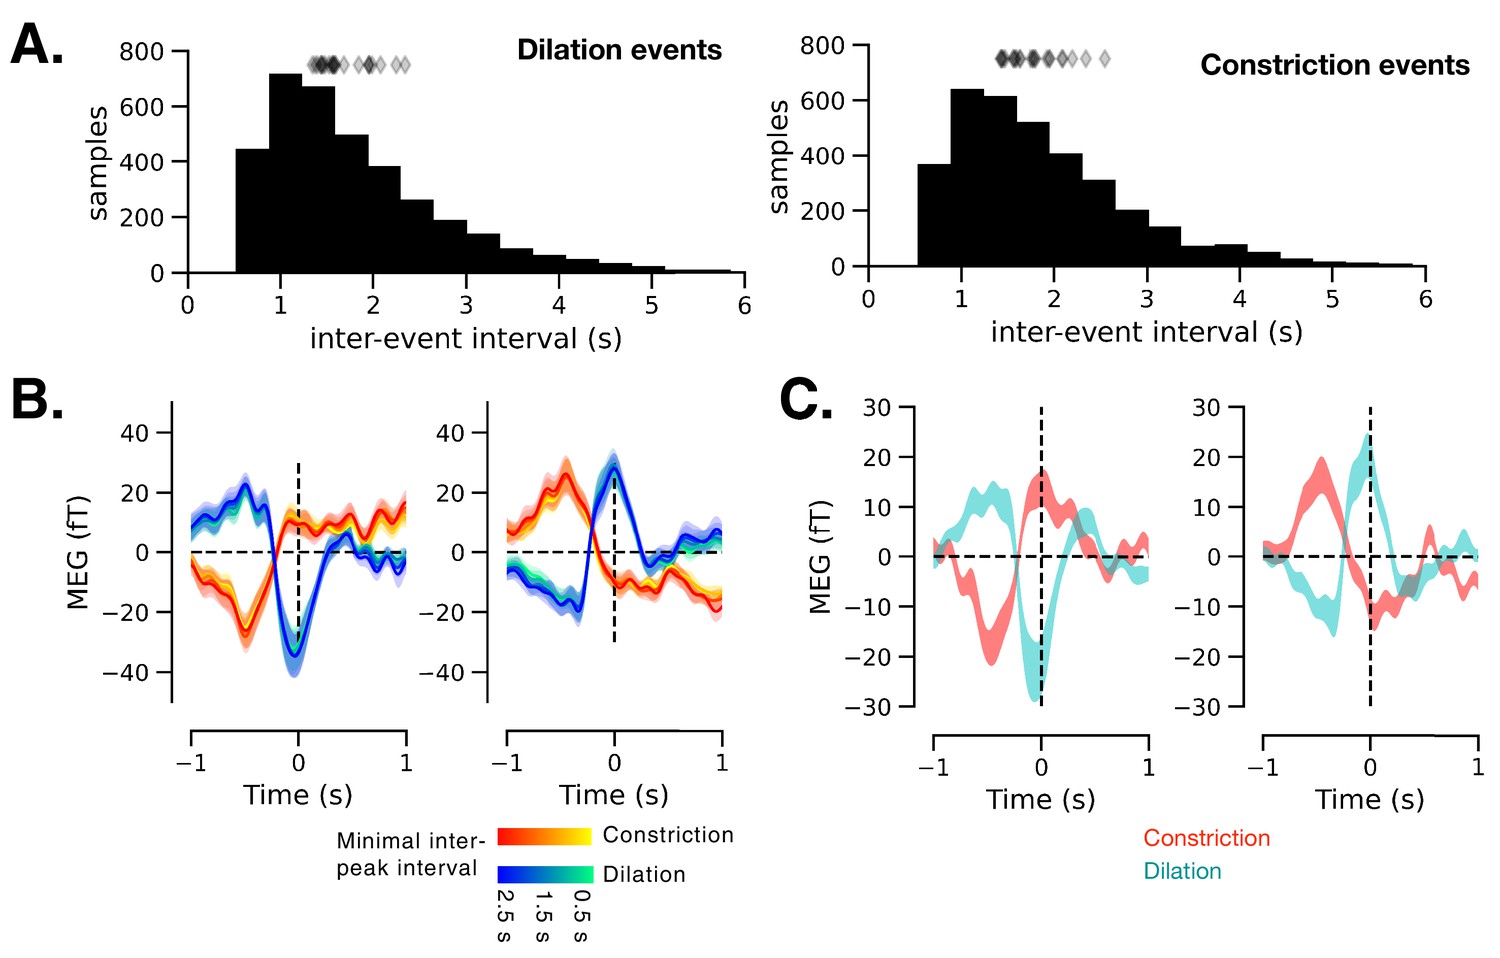
Additional analyses of dilation and constriction events.
(A) Distribution of inter-event intervals combined for all subjects. Diamonds show median of each subject. (B) Brain response to events identified by peak prominence (i.e., peak height in relationship to local minima) of >0.5 s.d. with an inter-event interval restricted to at least 0.5, 1, 1.5, 2, 2.5 s (color bar). Time courses are from the same magnetoencephalography (MEG) channels shown in Figure 6C. (C) Same analysis as presented in 6C but events are identified on unfiltered pupil data.
Author response image 1
Tables
Table 1
Behavioral consequence of pupil-linked states.
Gray shading indicates models plotted in Figure 4C–D, where p < 0.05 for in Q-models and in L-models. HR: hit rate, FAR: false alarm rate; c: criterion, d’: sensitivity, Acc: accuracy, RT: reaction time. L-model and Q-model denote models with linear only or both linear and quadratic components, specified in and Equations 4 and 5, respectively. Marginal and conditional R2 indicate the proportion of total variance explained by fixed effects only and the proportion of variance explained by both fixed and random effects, respectively. BIC: Bayesian information criterion.
| BHV | χQ | Std | pval | χL | Std | pval | BIC | Marginal R2 | Conditional R2 | |
|---|---|---|---|---|---|---|---|---|---|---|
| Q-model | HR | –0.020 | 0.007 | 0.006 | 0.043 | 0.007 | 8.48E-09 | –166.659 | 0.037 | 0.923 |
| FAR | 0.002 | 0.010 | 0.85 | 0.009 | 0.009 | 0.299 | –131.423 | 0.002 | 0.850 | |
| c | 0.021 | 0.022 | 0.34 | –0.083 | 0.022 | 1.655E-04 | 82.371 | 0.016 | 0.917 | |
| d’ | –0.080 | 0.034 | 0.0196 | 0.098 | 0.017 | 4.38E-09 | 141.827 | 0.036 | 0.660 | |
| Acc | –0.013 | 0.007 | 0.063 | 0.031 | 0.008 | 3.745E-05 | –205.201 | 0.052 | 0.816 | |
| RT | 0.013 | 0.008 | 0.096 | –0.029 | 0.008 | 7.248E-04 | –192.939 | 0.020 | 0.938 | |
| L-model | HR | 0.043 | 0.007 | 6.943E−09 | –178.111 | 0.057 | 0.846 | |||
| FAR | 0.009 | 0.009 | 0.299 | –149.132 | 0.003 | 0.746 | ||||
| c | –0.083 | 0.022 | 1.31E−04 | 67.171 | 0.027 | 0.848 | ||||
| d’ | 0.098 | 0.039 | 0.011 | 187.050 | 0.036 | 0.446 | ||||
| Acc | 0.031 | 0.008 | 3.539E−05 | –220.347 | 0.078 | 0.676 | ||||
| RT | –0.029 | 0.008 | 7.346E−04 | –200.883 | 0.033 | 0.854 |
Additional files
-
Supplementary file 1
Supplementary tables 1 and 2 containing detailed statistics related to Figures 3 and 5.
- https://cdn.elifesciences.org/articles/68265/elife-68265-supp1-v2.docx
-
Transparent reporting form
- https://cdn.elifesciences.org/articles/68265/elife-68265-transrepform1-v2.docx
Download links
A two-part list of links to download the article, or parts of the article, in various formats.
Downloads (link to download the article as PDF)
Open citations (links to open the citations from this article in various online reference manager services)
Cite this article (links to download the citations from this article in formats compatible with various reference manager tools)
Spectral signature and behavioral consequence of spontaneous shifts of pupil-linked arousal in human
eLife 10:e68265.
https://doi.org/10.7554/eLife.68265


