A modified fluctuation assay reveals a natural mutator phenotype that drives mutation spectrum variation within Saccharomyces cerevisiae
- Department of Genome Sciences, University of Washington, United States
- Molecular and Cellular Biology Program, University of Washington, United States
- Department of Laboratory Medicine and Pathology, University of Washington, United States
- Department of Computational Biology, Fred Hutchinson Cancer Research Center, United States
Figures
Figure 1 with 5 supplements
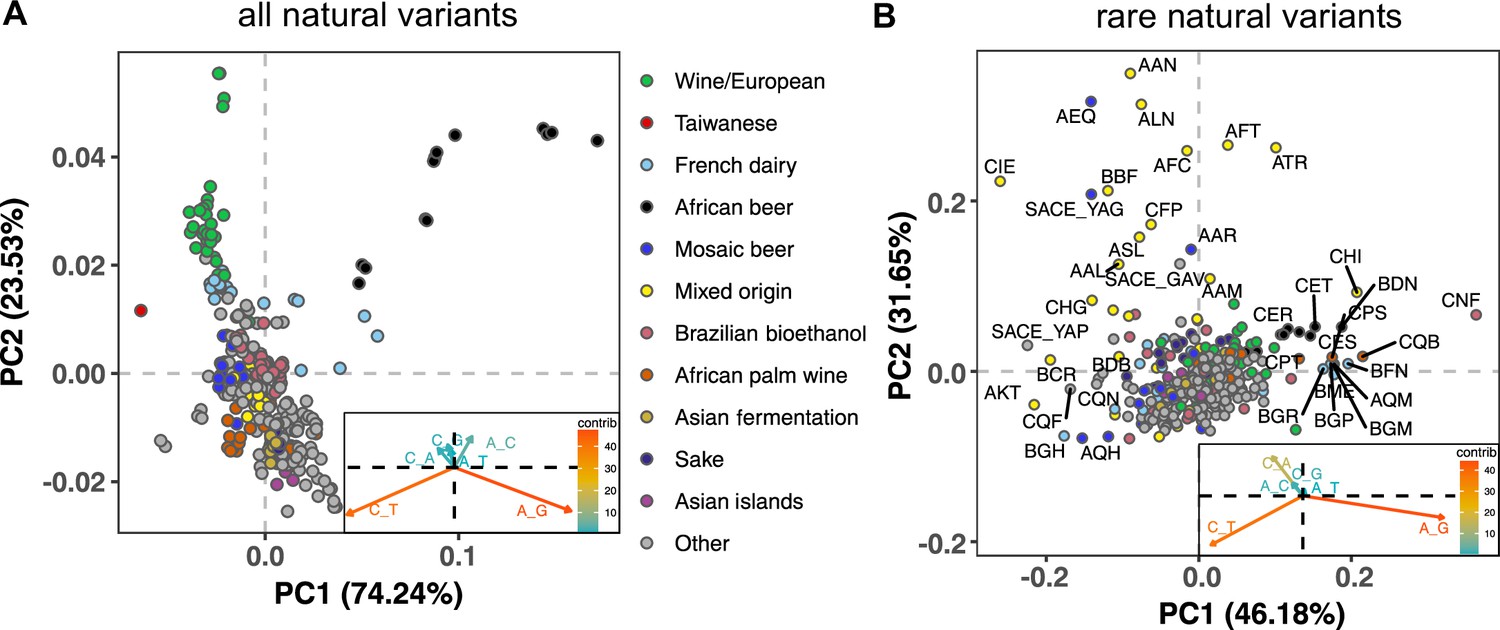
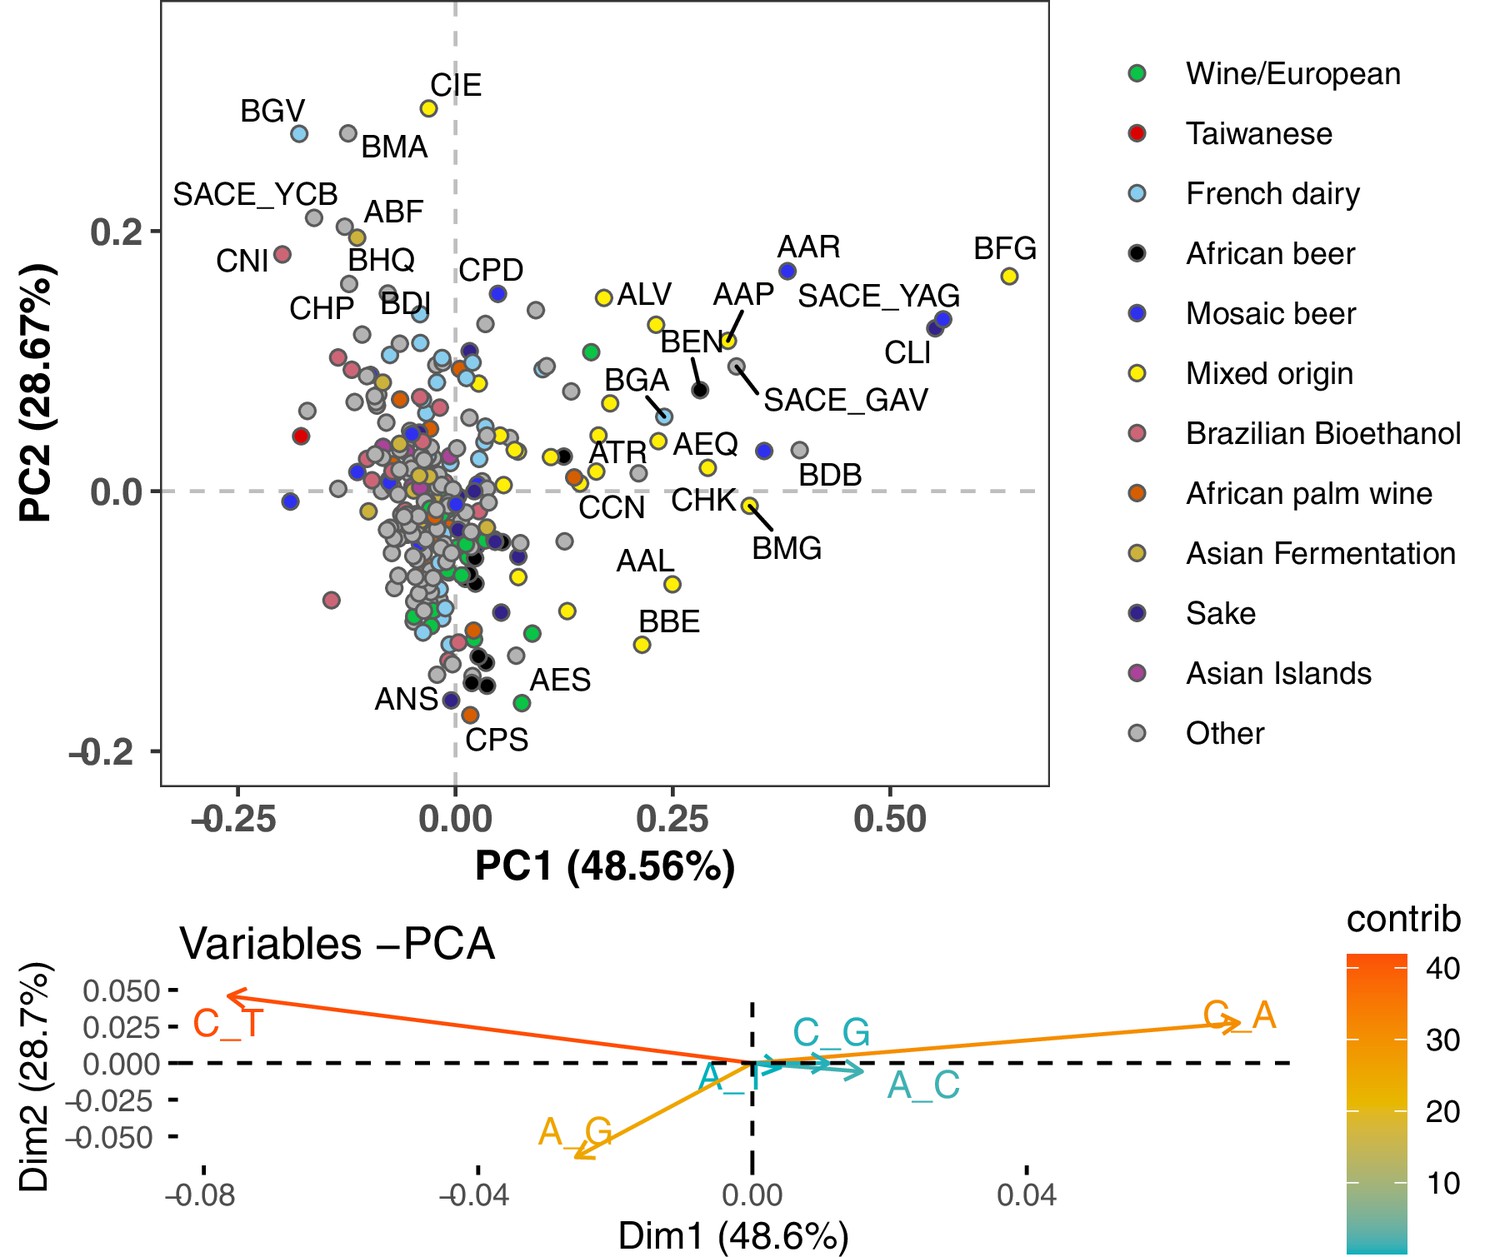
Mutation spectra of natural isolates of S. Cerevisiae.
Principal component analysis of segregating mutation spectrum variation from a subset of the 1011 yeast strains. (A). Mutation spectrum PCA of all natural variants under 50% derived allele frequency. Each strain’s mutation spectrum histogram is projected as a single point, colored to indicate its population of origin (Peter et al., 2018). The inset summarizes the loadings of the first and second principal component vectors. (B). Mutation spectrum PCA of rare variants (derived allele count 2–4). Singleton variants are excluded to minimize the impact of sequencing error. Strains appearing more than 1.8 standard deviations from the origin along both PC1 and PC2 are labeled with their strain names.
Figure 1—figure supplement 1
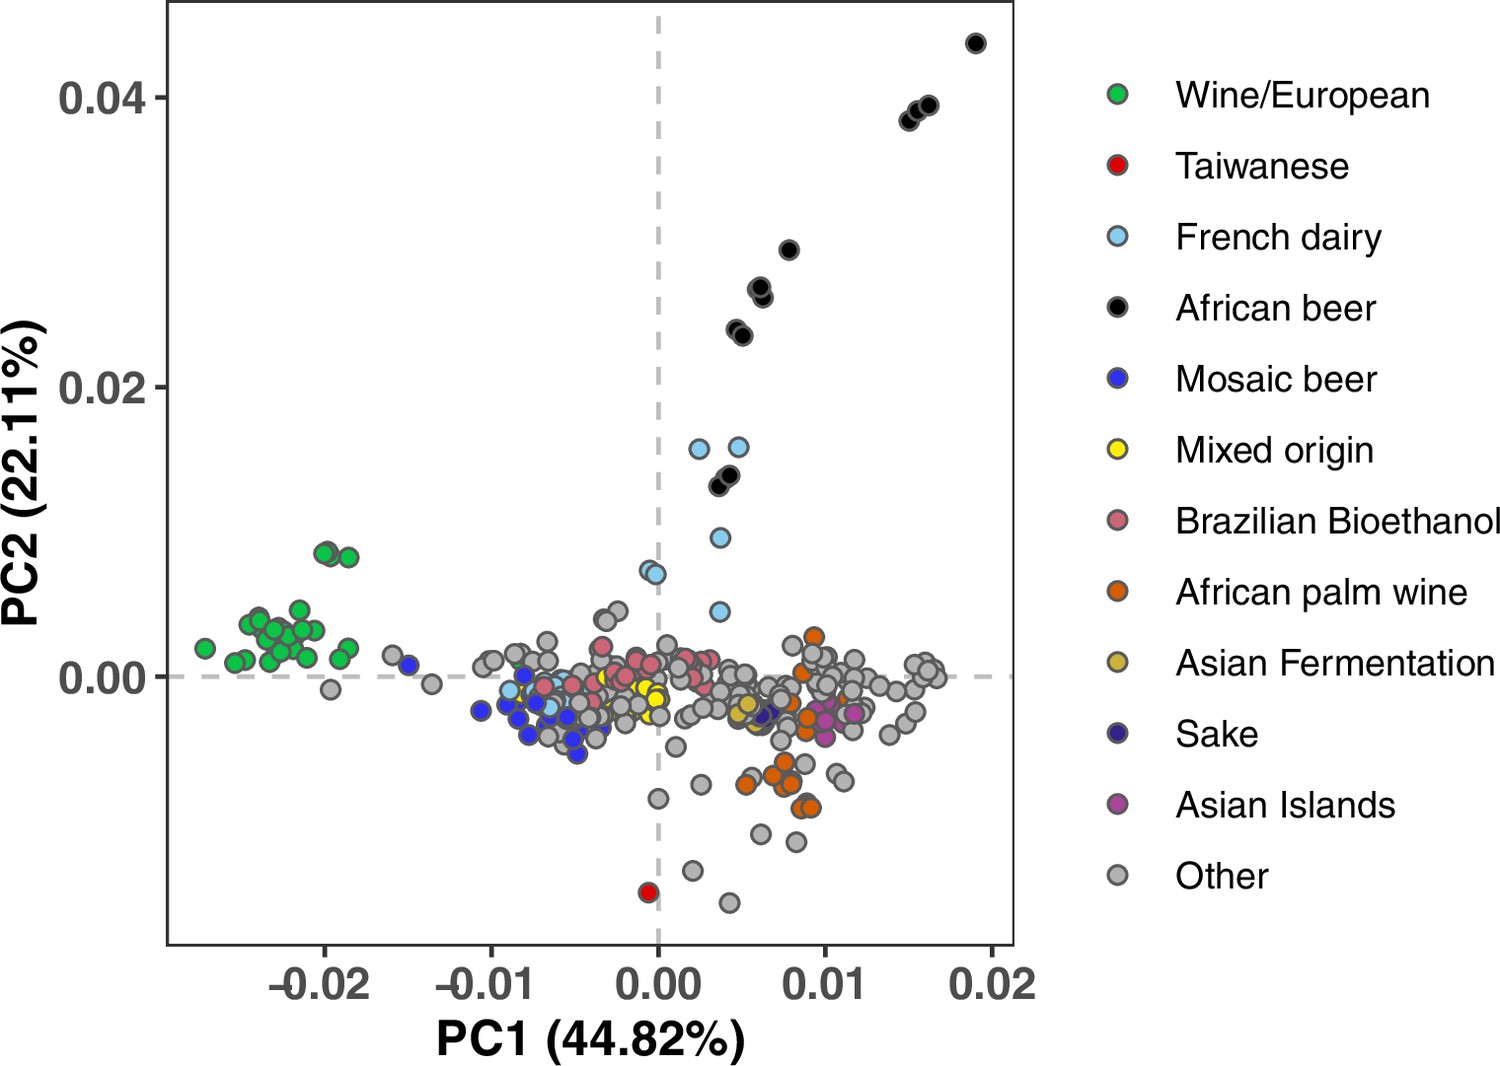
Mutation spectrum PCA after subsampling to avoid overlap between lineages.
To eliminate any clustering of strains as a result of shared variation, we randomly assigned each mutation of frequency k/n to one of the k haplotypes carrying the derived allele, then computed each strain’s spectrum based on these resampled mutation counts. The results still show similar clustering of outlier lineages to what is seen in Figure 1A without this subsampling, although with slightly more noise and dispersion.
Figure 1—figure supplement 2
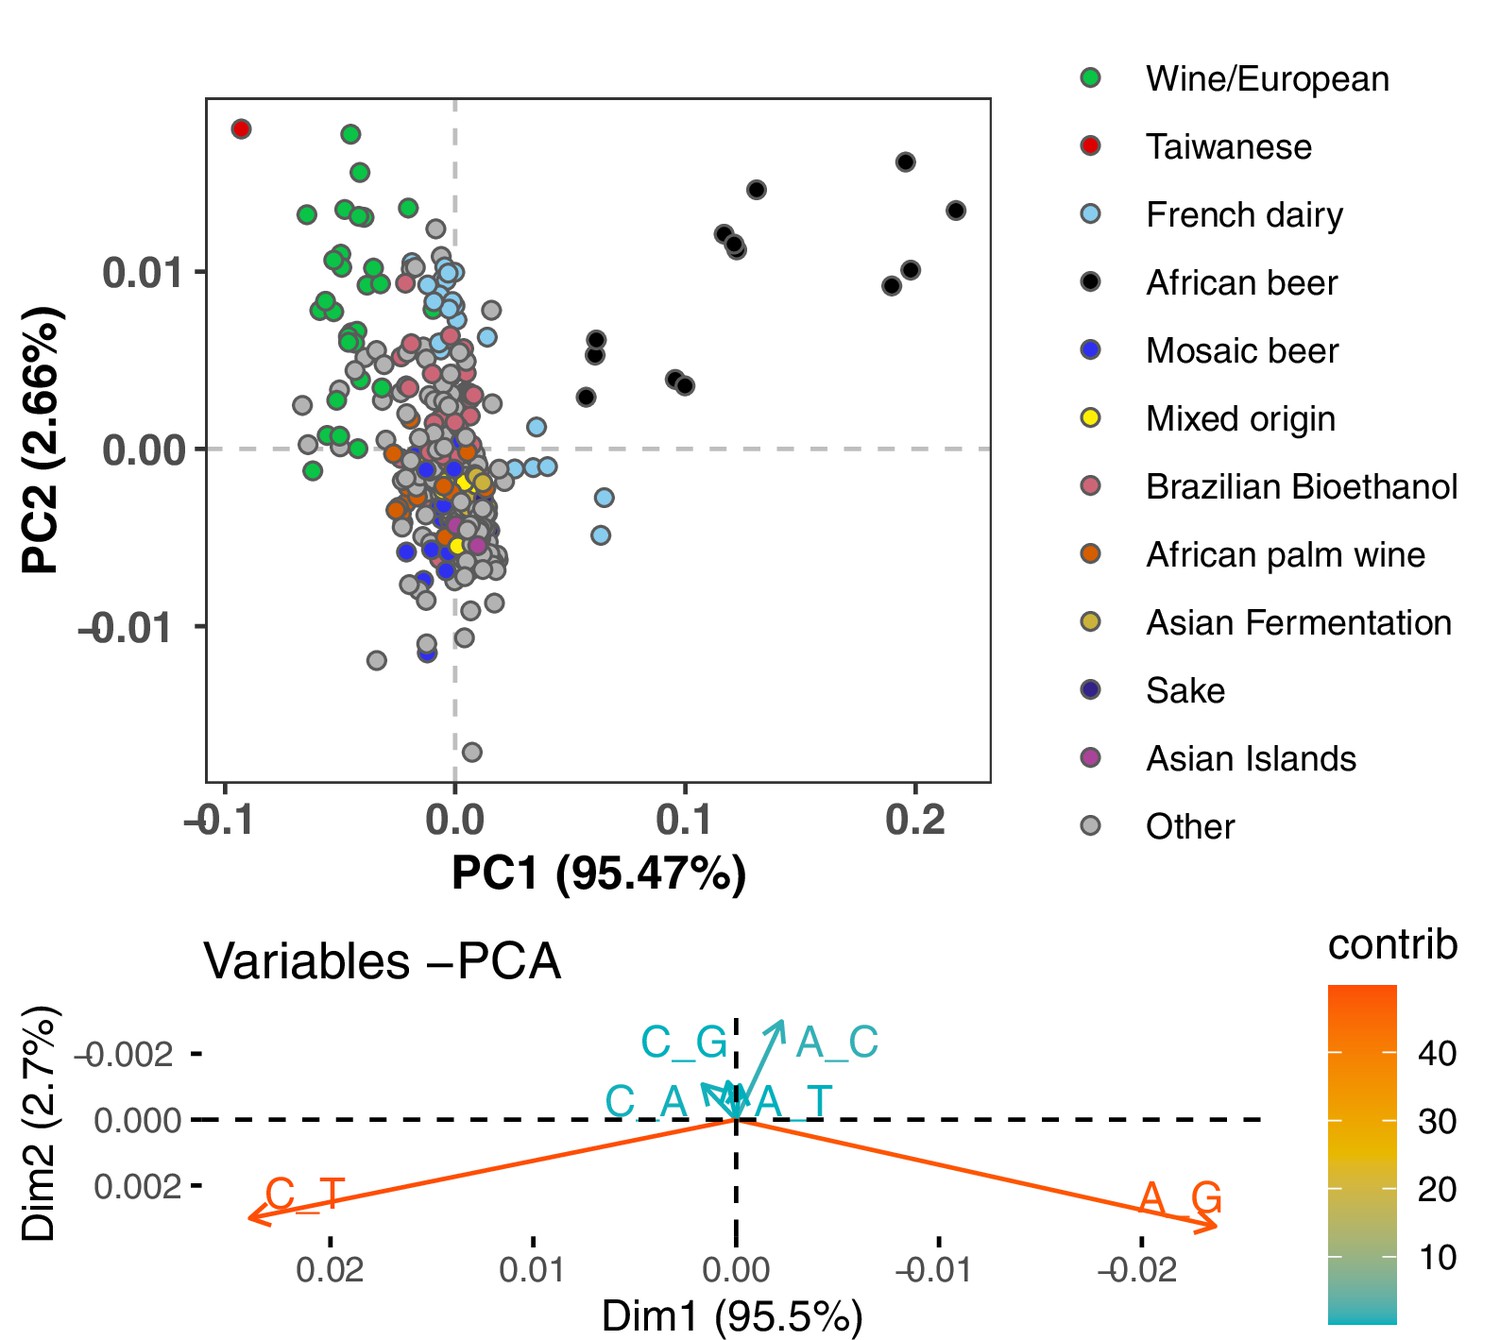
PCA of synonymous variant mutation spectra.
To avoid the confounding effects of selection on nonsynonymous variants, we compute the spectrum of synonymous mutations present in each strain and normalize it by the spectrum of mutational opportunities for synonymous variants to arise. The resulting spectra display a similar PCA structure to what is seen in Figure 1A.
Figure 1—figure supplement 3
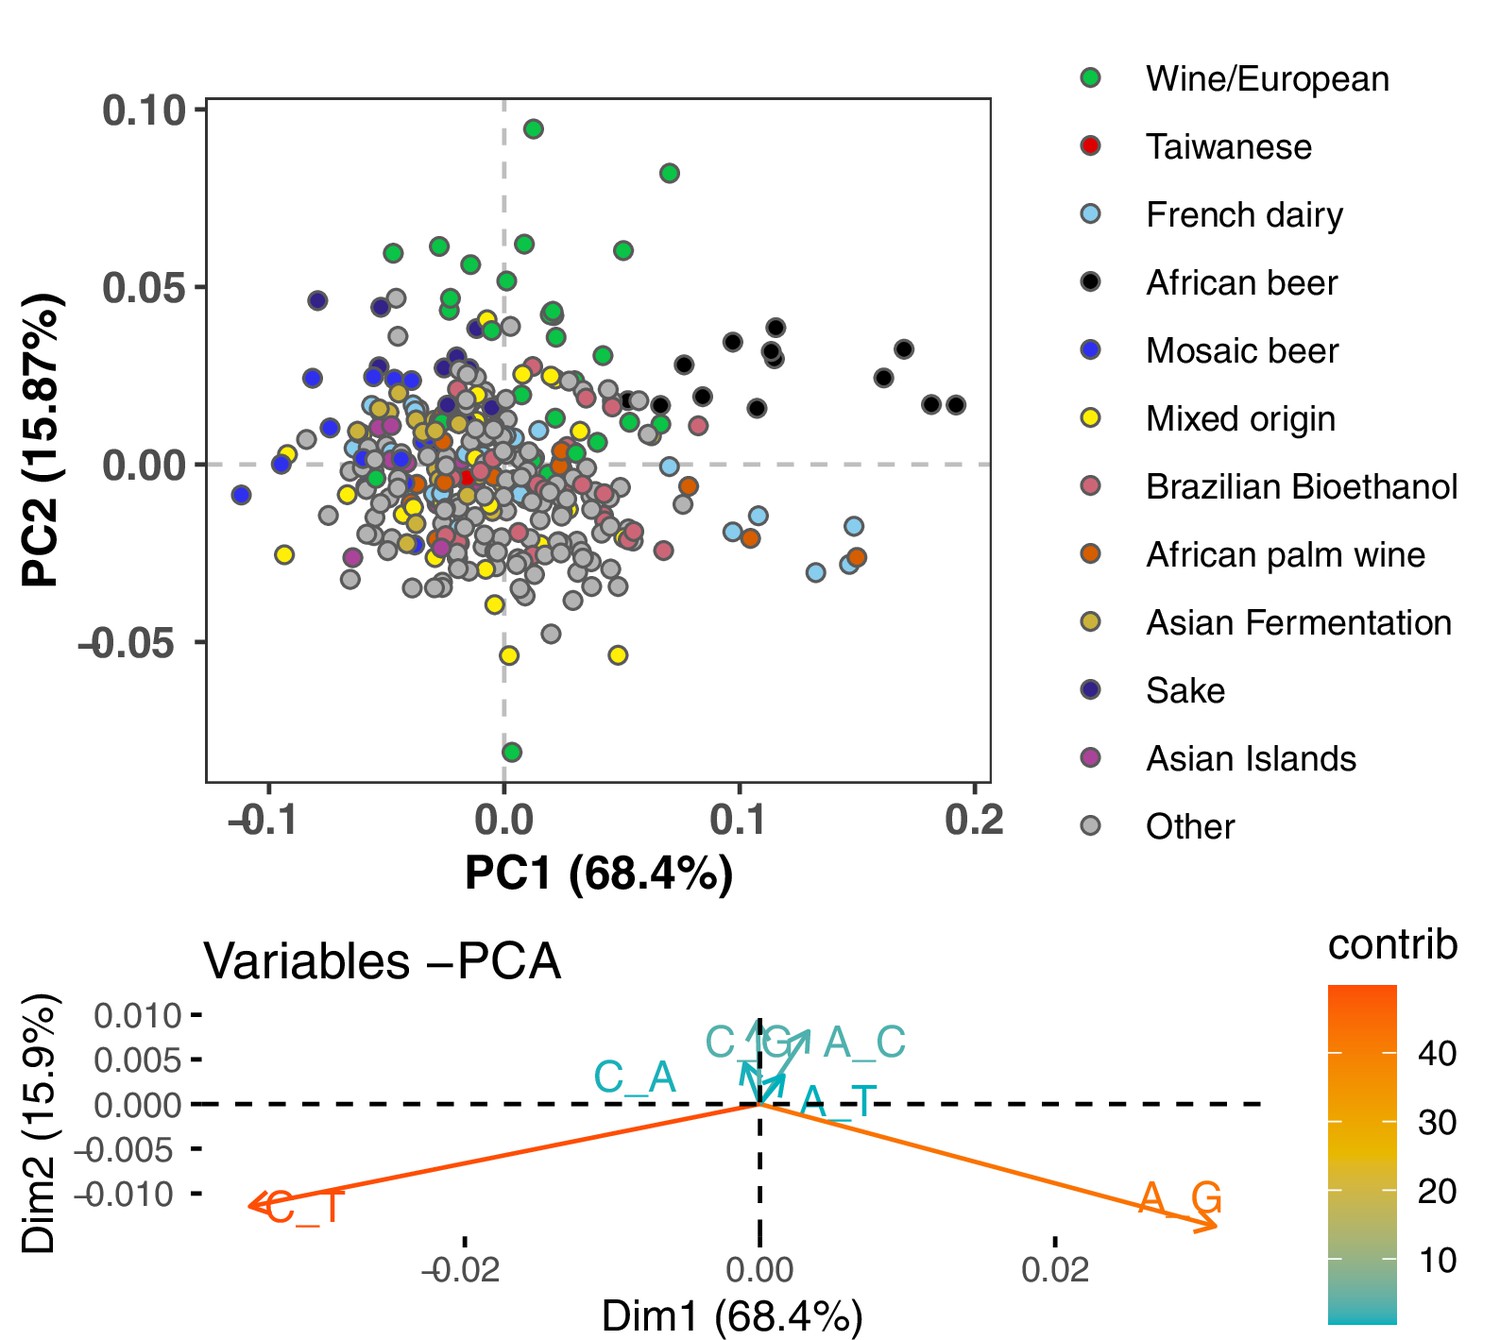
Mutation PCA using all variants stratified by triplet context.
This PCA shows substructure among the 96-dimensional mutation spectra obtained by classifying all variants by the left and right adjacent base pairs as well as the ancestral and derived alleles. Clustering is qualitatively similar to what is observed in Figure 1A using six-dimensional mutation spectra, classifying each variant by its ancestral and derived allele but no surrounding sequence context.
Figure 1—figure supplement 4
PCA of singleton mutation spectra.
This PCA clusters mutation spectra that were computed using only singletons: variants present in the focal strain and no other strains. It shows a similar structure to Figure 1B, where spectra were computed from nonsingleton rare variants.
Figure 1—figure supplement 5
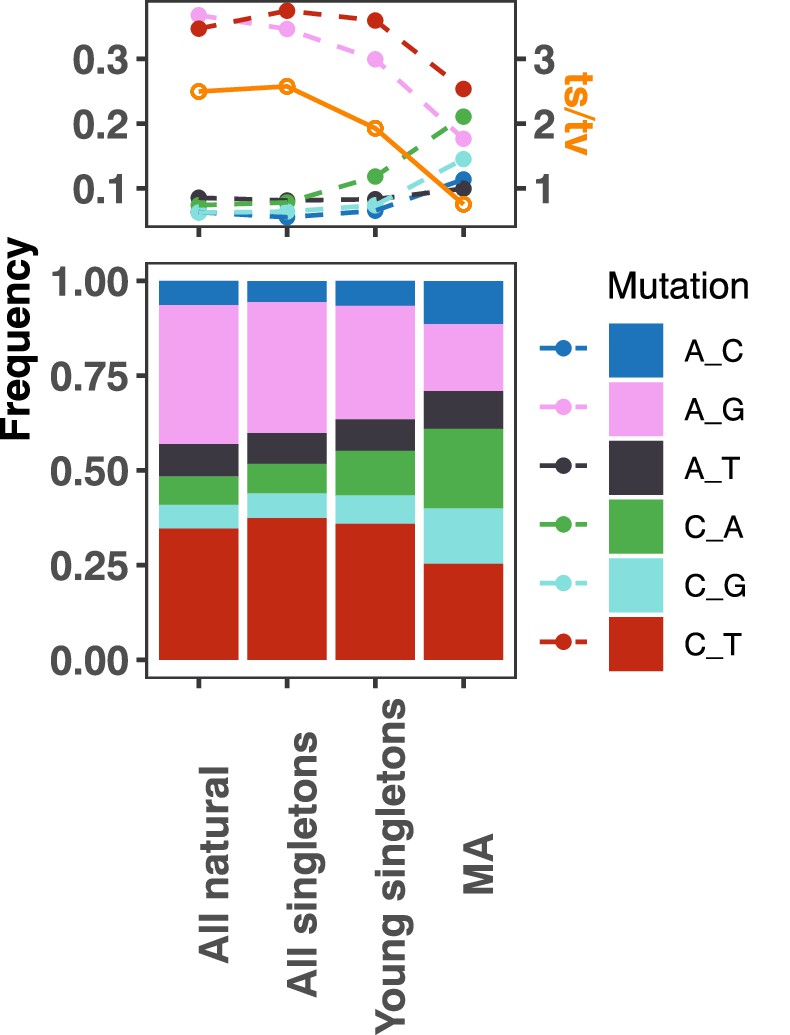
Mutation spectrum comparison of natural variants versus de novo mutations from a previous mutation accumulation (MA) study.
From left to right are mutation spectra from (1) all natural variants, (2) all singletons, (3) young singletons (see Materials and methods), and (4) MA experiments (Sharp et al., 2018, from haploids in RDH54+ backgrounds). These datasets are ordered such that mutations are expected to get younger from left to right. The top panel represents the frequency of each mutation type as a solid dot and the ts/tv ratio with an orange dot. The bottom panel shows the stacked frequency of each mutation type. Young singletons are defined similarly to the convention of Zhu et al., 2017 as having a density of less than 0.0087 count/kb.
Figure 2
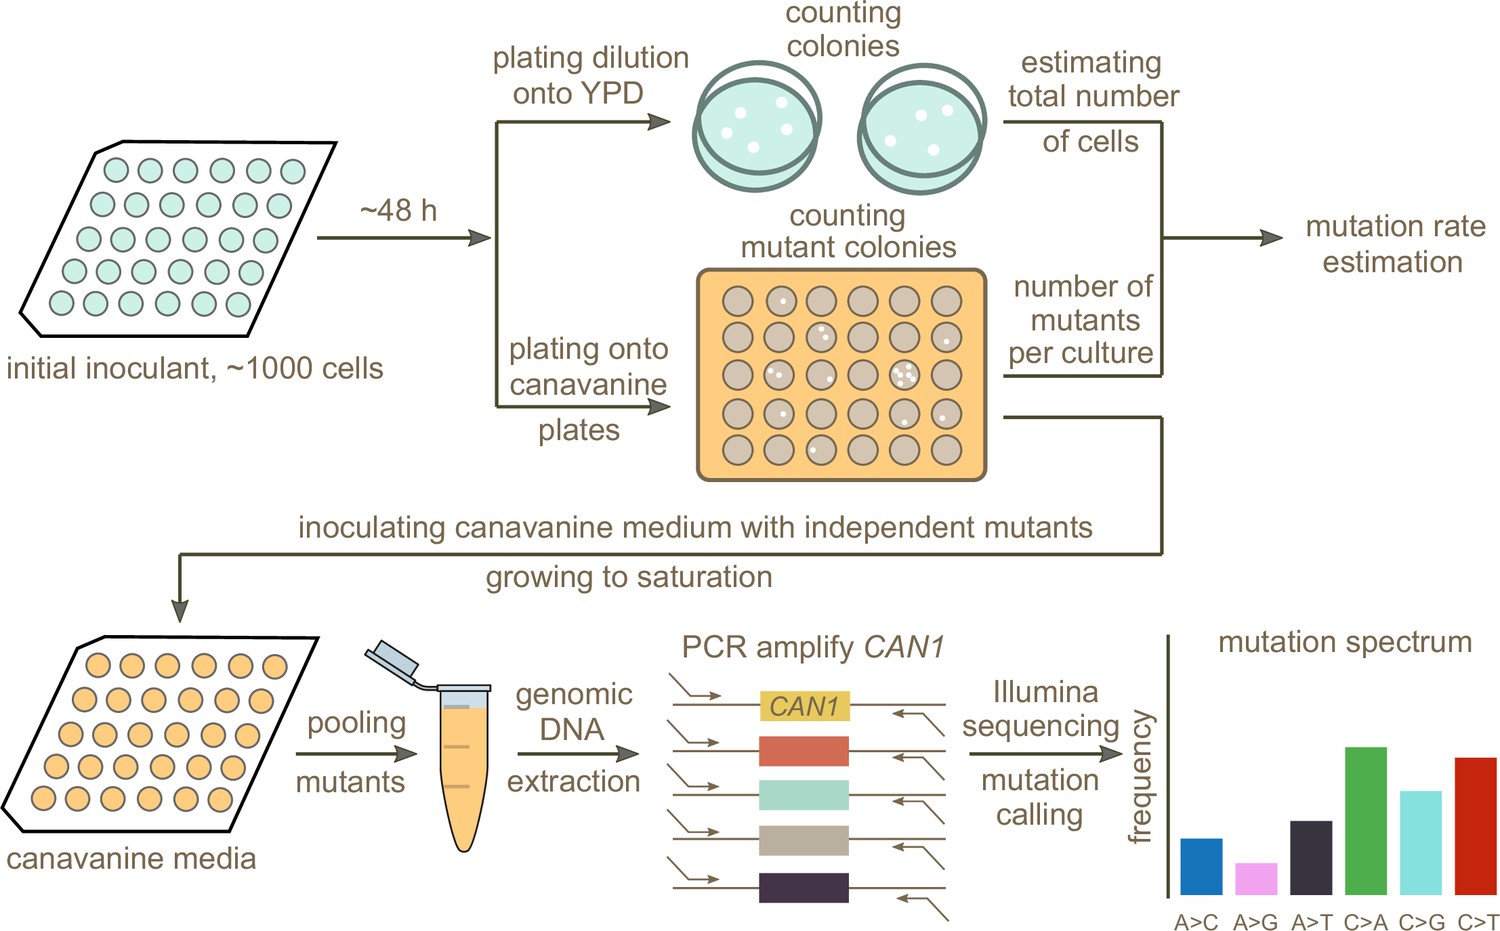
Schematic overview of the experimental pipeline.
Overview of the experimental pipeline used to estimate the mutation rate and spectrum for each strain using the reporter gene CAN1. First, mutation rates were estimated using fluctuation assays. Independent mutants were then pooled and sequenced to estimate the mutation spectrum of each strain.
Figure 3 with 1 supplement
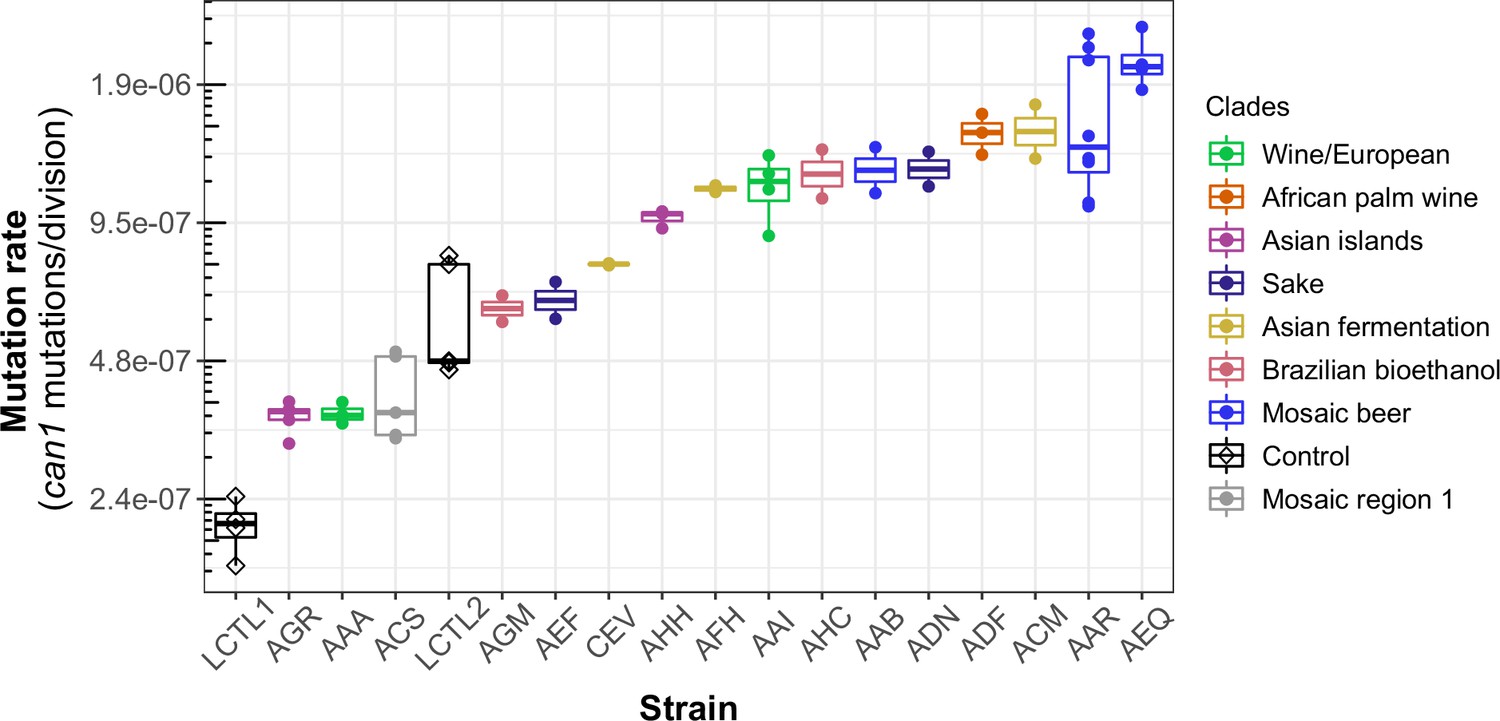
Haploid natural isolates exhibit a 10-fold range of mutation rate variation.
Mutation rate variation measured among haploid natural isolates using our CAN1 reporter gene Luria-Delbrück fluctuation assays. Strains are shown ordered by their mean mutation rates. Mutation rates for each strain were estimated using at least two replicates, each estimate represented here by a dot. A standard boxplot spans the interquartile confidence interval of possible mutation rates for each strain.
Figure 3—figure supplement 1
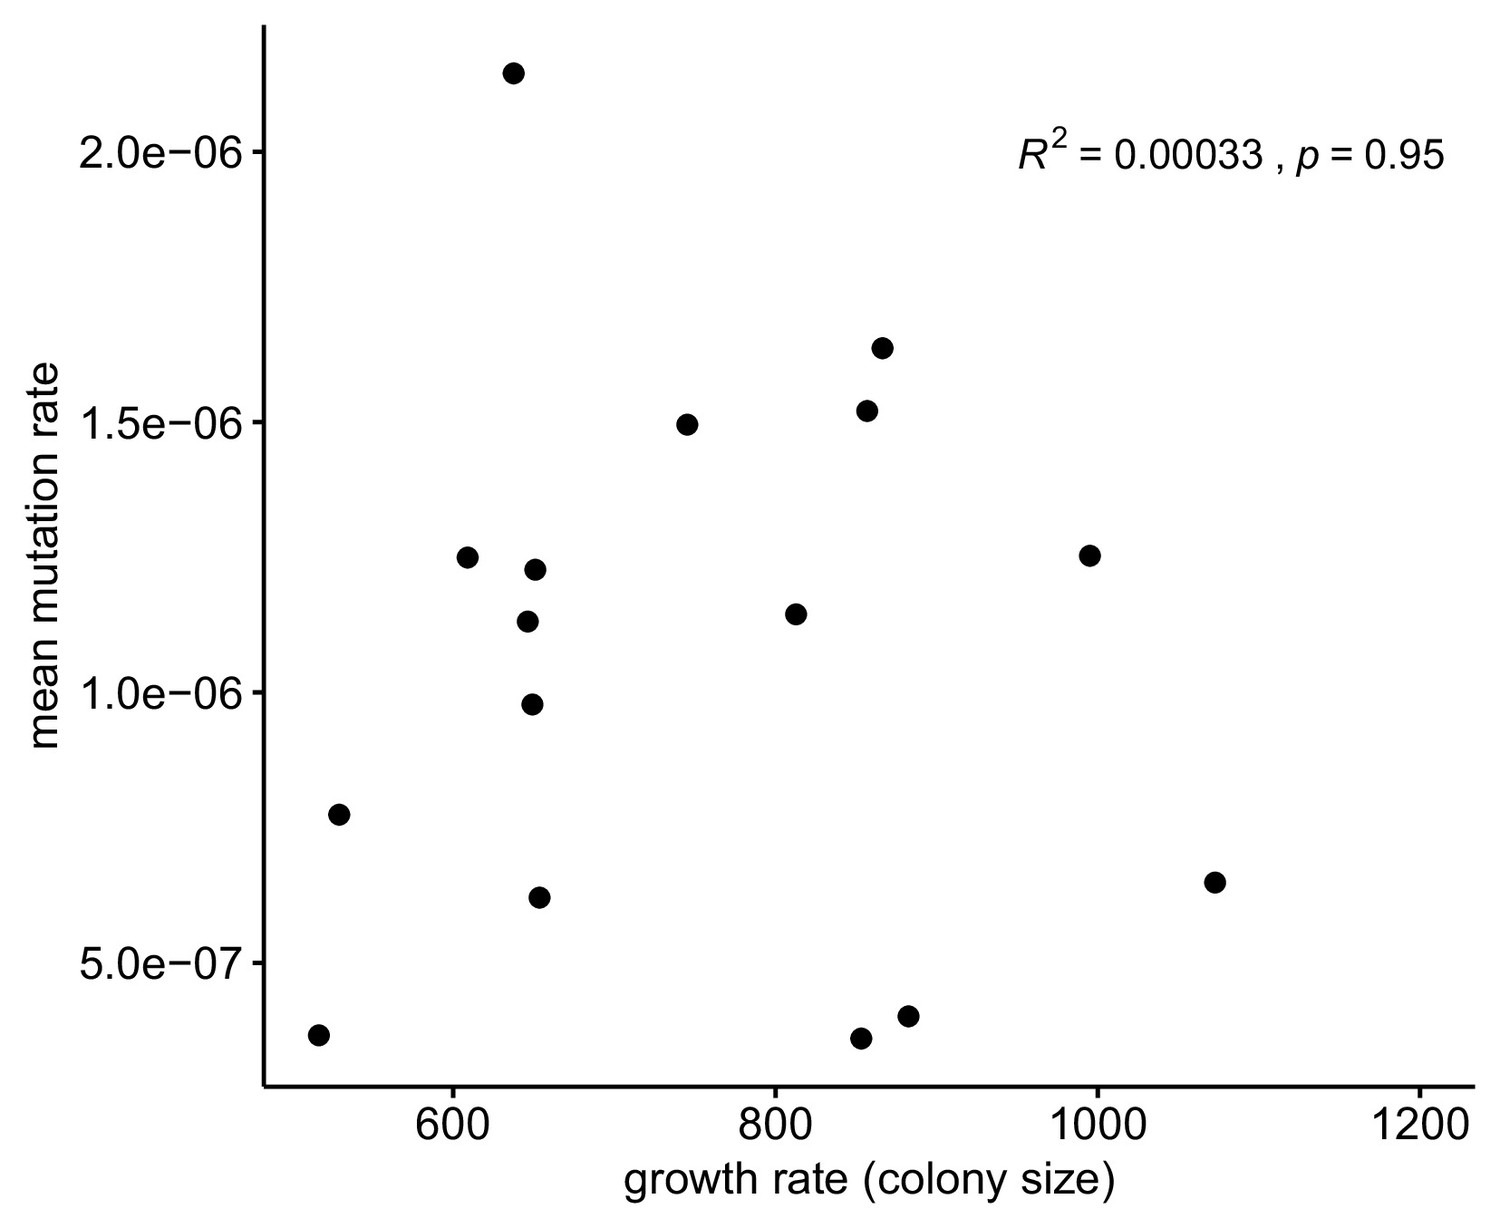
Relationship between growth rate versus measured mean mutation rate.
Peter et al., 2018 measured growth rates from colony size from each of the 1011 yeast genomes. As shown, we see no evidence of a relationship between these variables for the strains included in our fluctuation study.
Figure 4 with 7 supplements
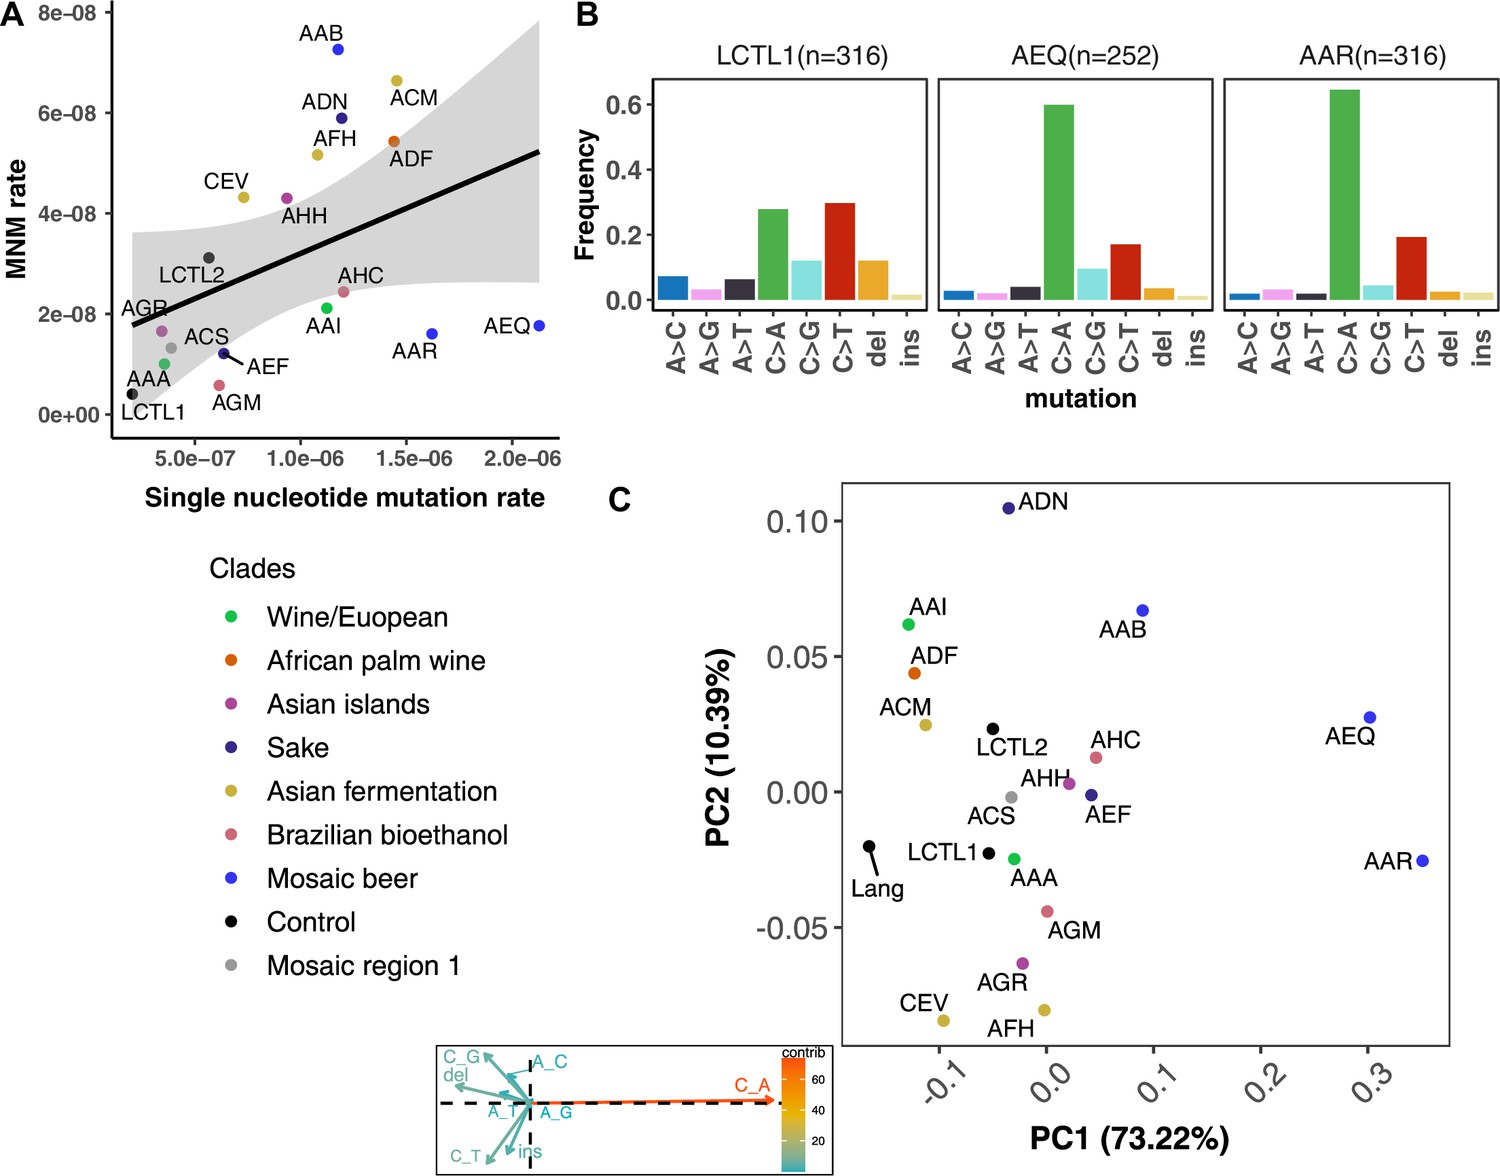
De novo mutation rates and spectra in natural isolates.
(A). Single nucleotide mutation rates plotted against MNM rates across strains. These rates were calculated by multiplying the mean mutation rate estimated using CAN1 by the proportion of mutations in each strain measured to be either single-nucleotide mutations or MNMs. Here, single nucleotide mutations include both single base pair substitutions and indels. (B). Mutation spectra in AEQ and AAR show significant enrichment of C > A mutations compared to the control lab strain LCTL1. Only single base-pair indels were used to generate these counts. (C). A PCA of the same strains’ de novo mutation spectra compared to the mutation spectrum reported in Lang and Murray, 2008.
Figure 4—figure supplement 1
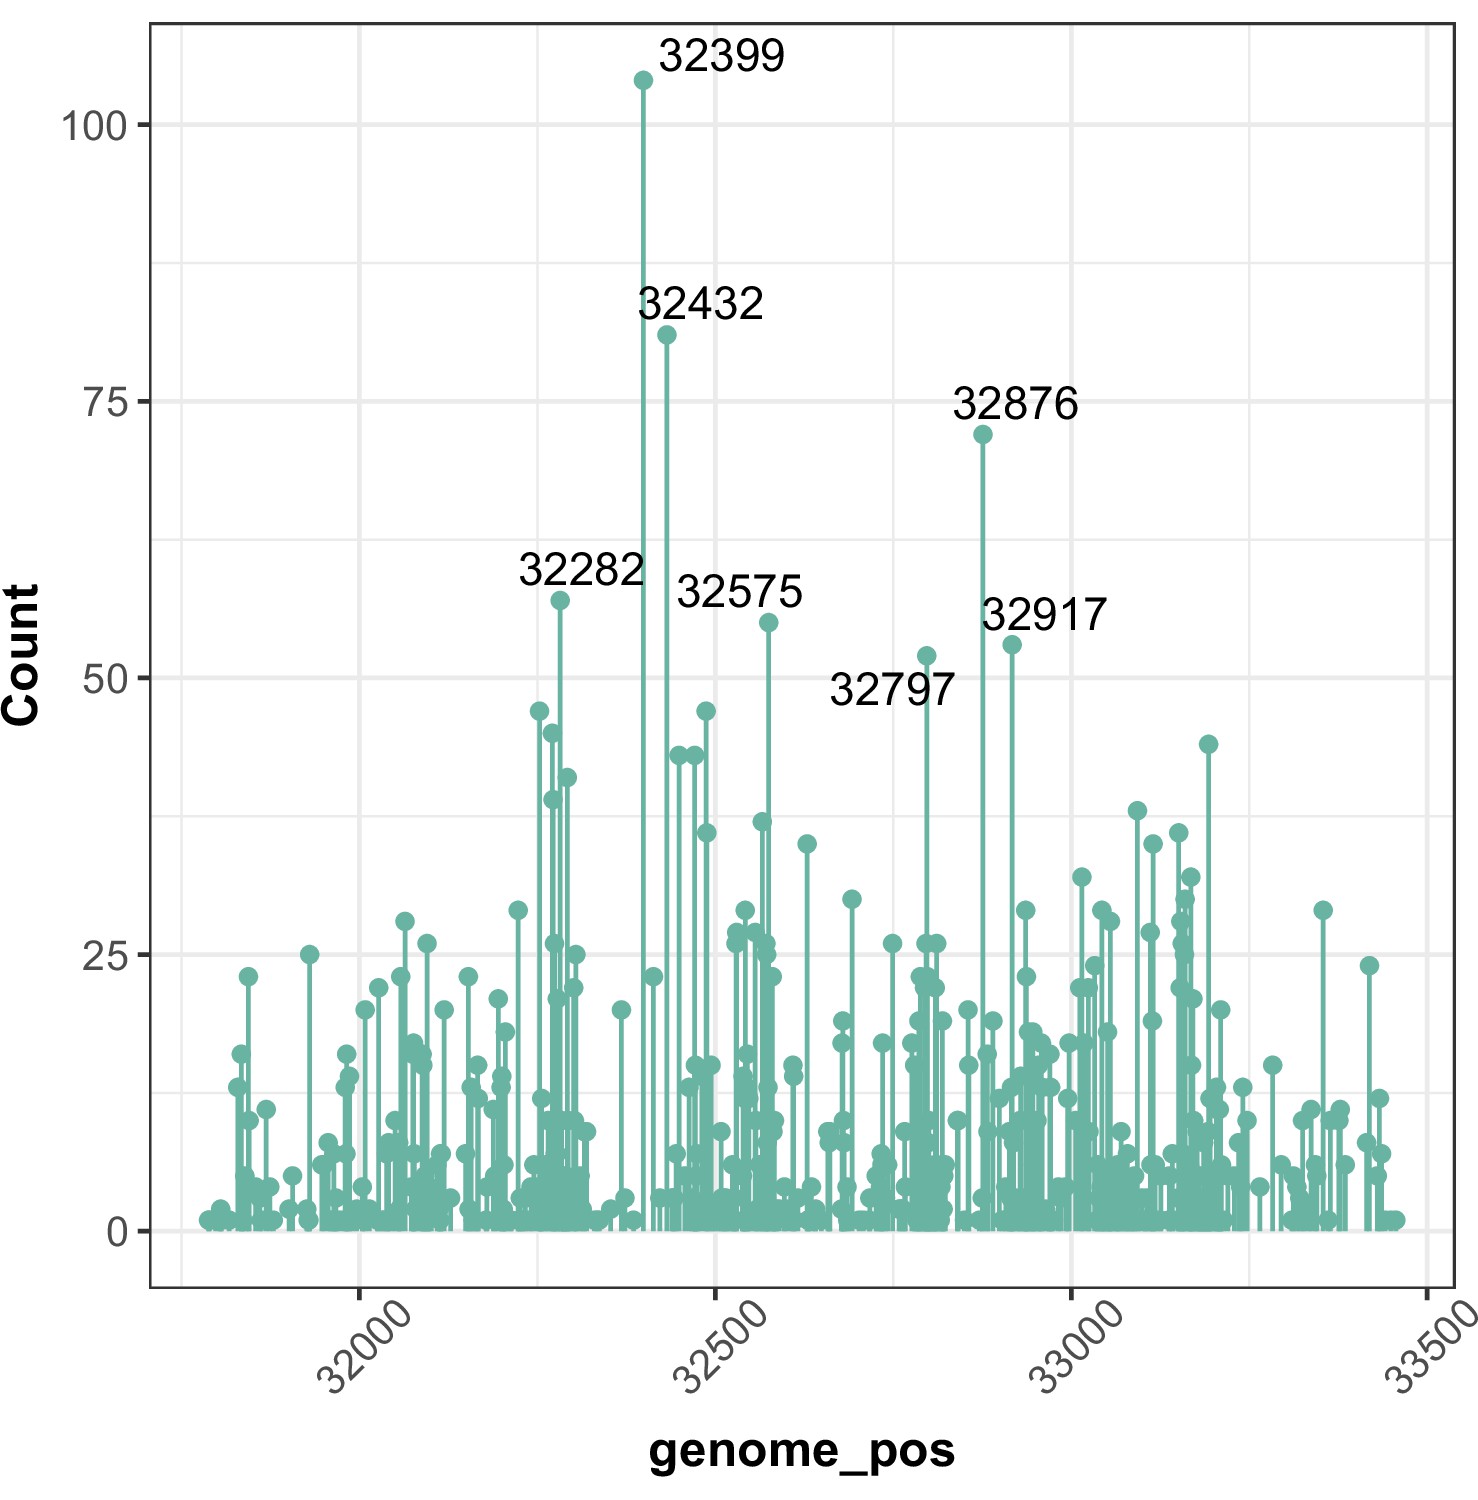
Hotspots of CAN1 mutation across different strain backgrounds (chr V).
Here, we plot the number of mutations observed at each genomic position across all fluctuation assays combined. Hotspots where 50 or more mutations were observed are labeled with their genomic positions.
Figure 4—figure supplement 2
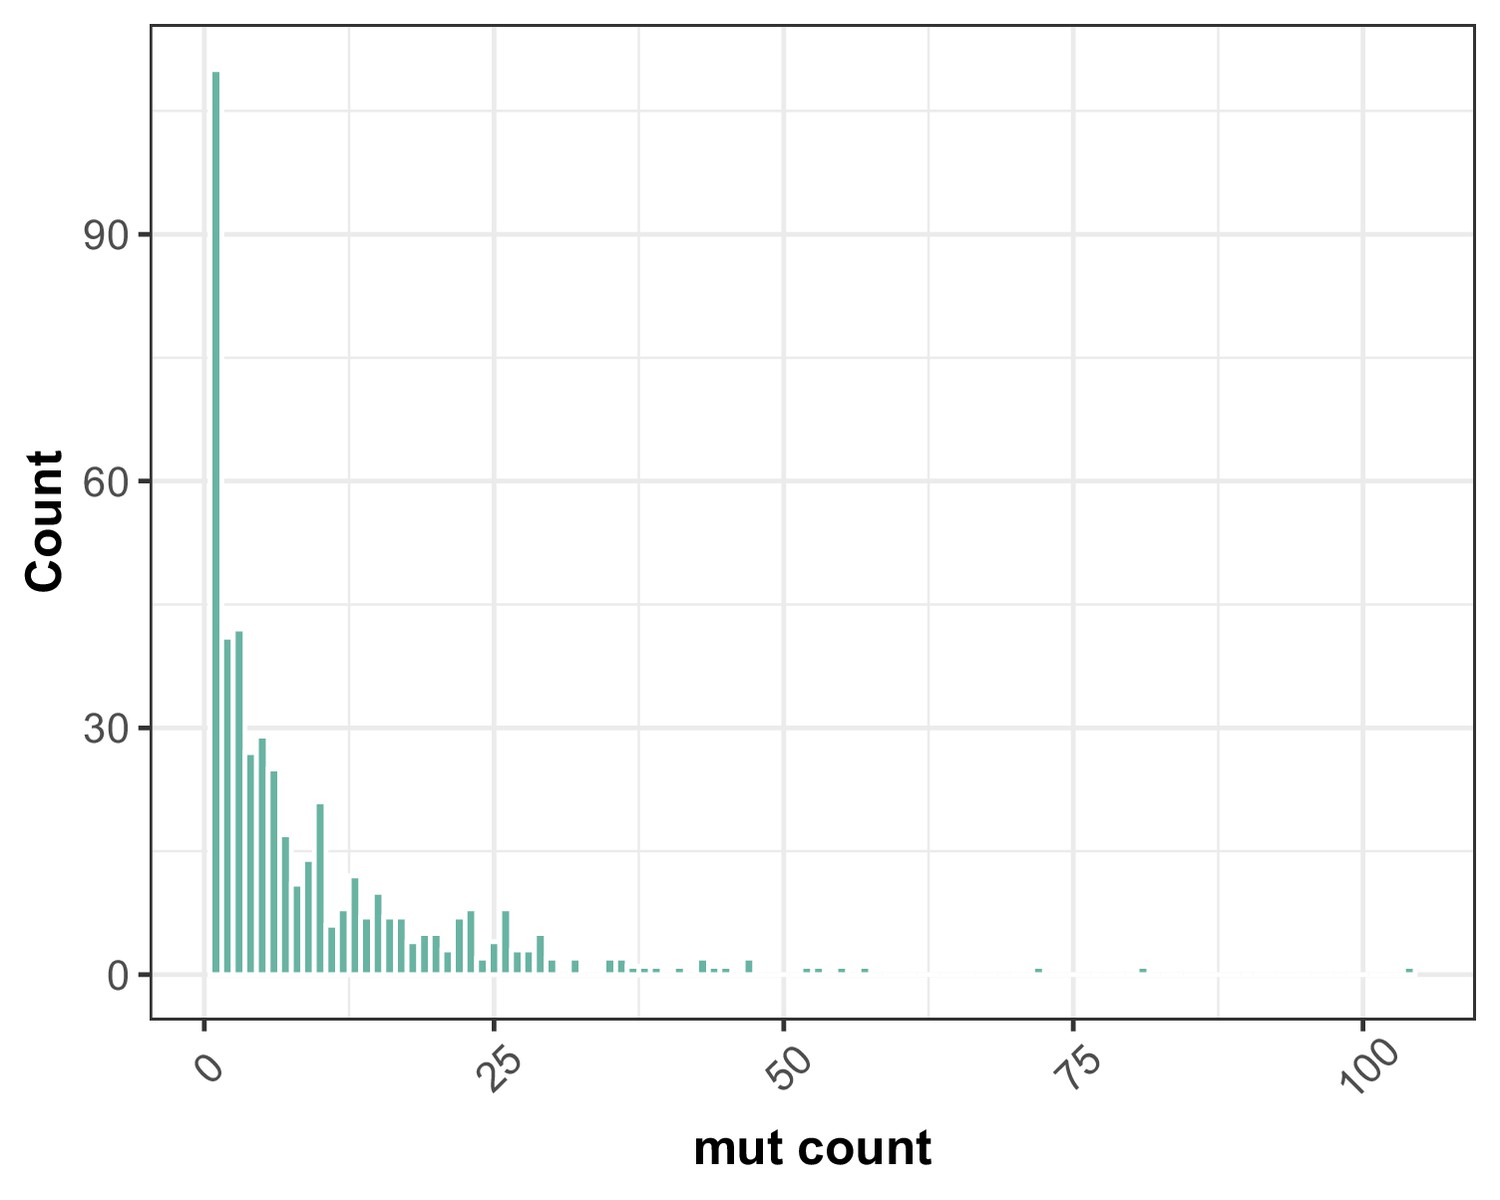
Distribution of multiplicity of mutations observed at each mutated site in CAN1.
As summarized in this frequency spectrum, a plurality of mutations were observed just once, but some sites appear to be mutation hotspots that were found to be mutated in 50 or more independent fluctuation assays.
Figure 4—figure supplement 3
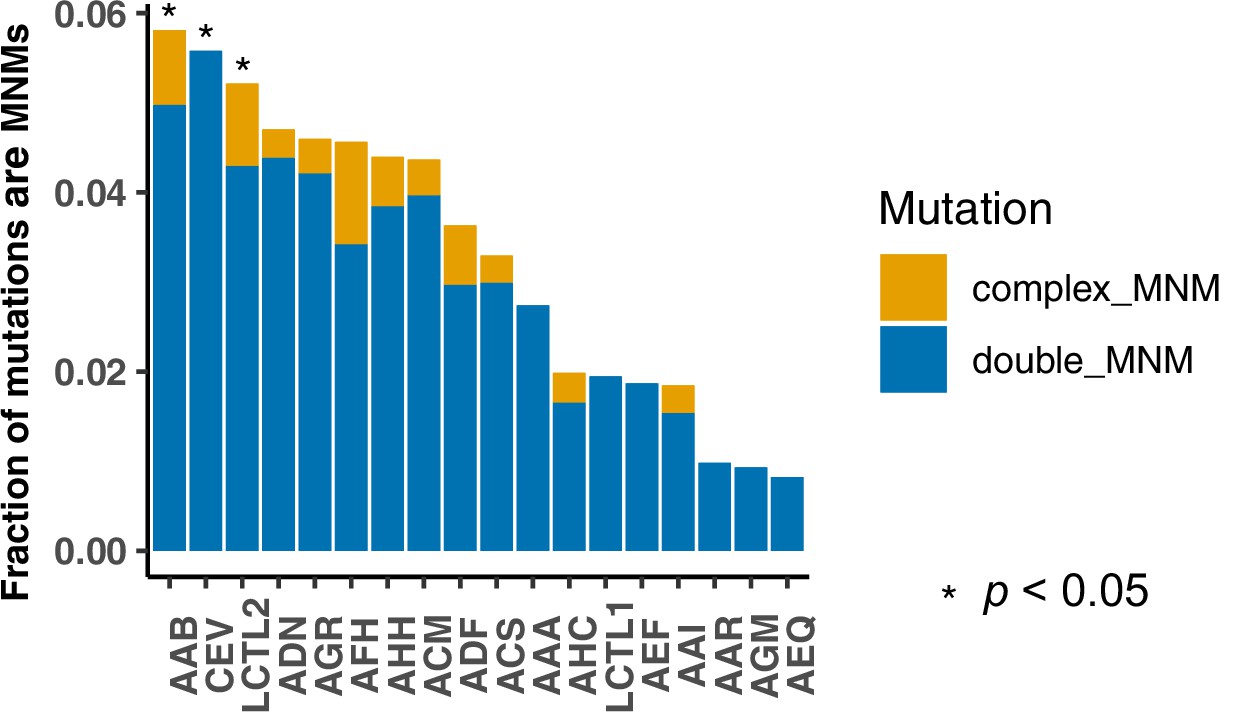
Fraction of multinucleotide mutations (MNMs) in each strain.
A Chi-square test was performed on each strain to compare its ratio of MNM counts to single mutation counts to the ratio observed in the standard reference LCTL1 strain. Asterisks denote strains with significantly elevated MNM-to-SNP ratios (p < 0.05).
Figure 4—figure supplement 4
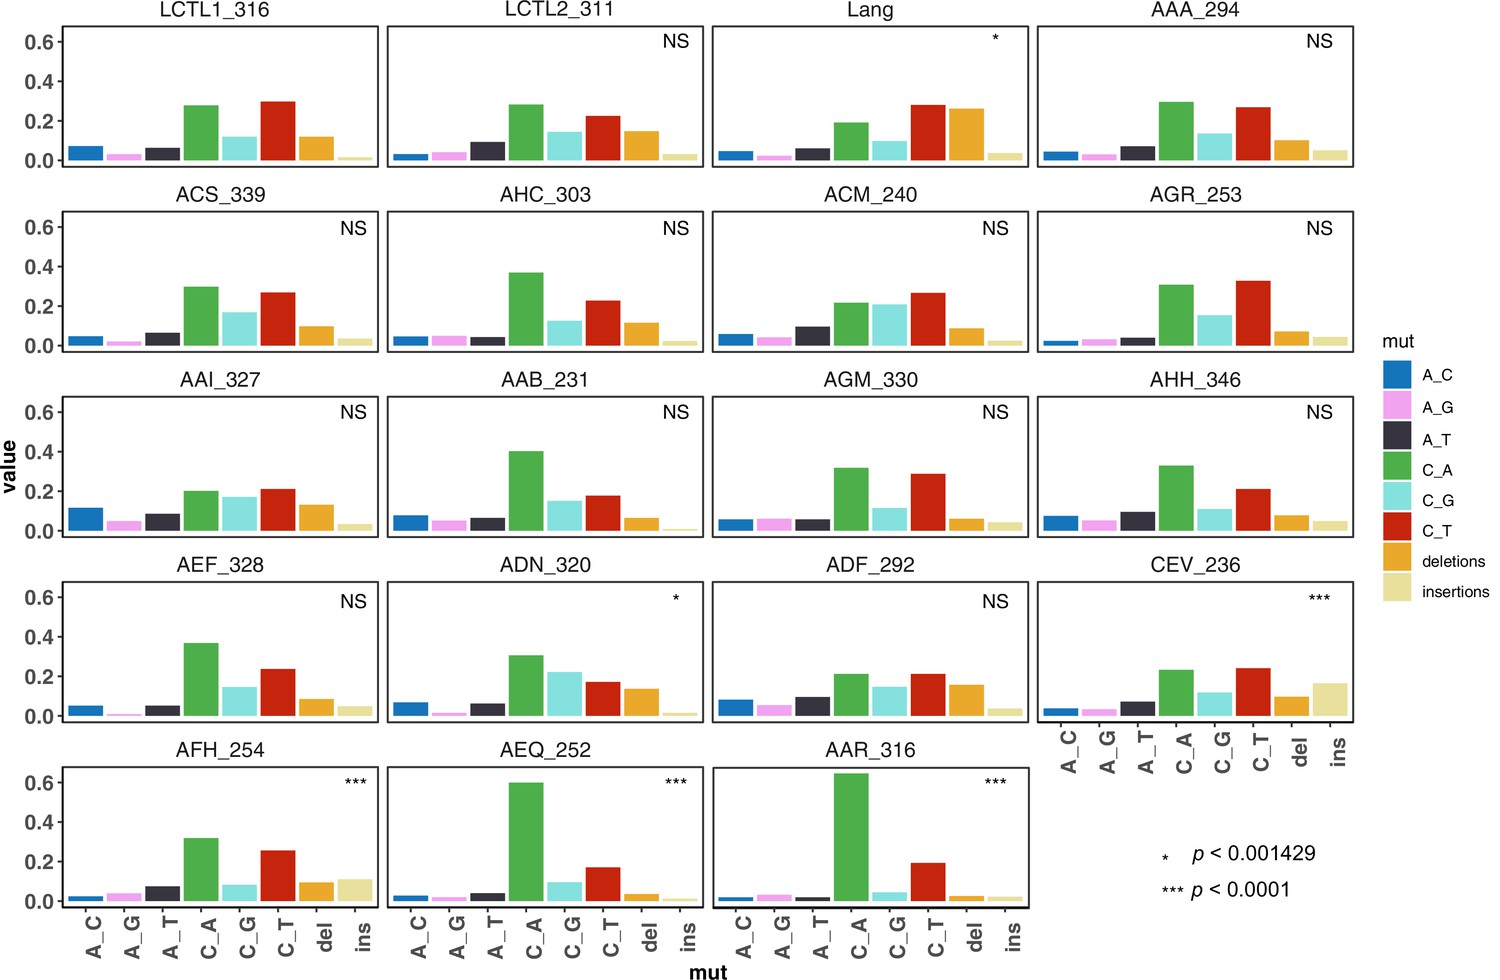
De novo mutation spectra of all strains (single base-pair substitutions and single base-pair indels).
Each strain is marked by the strain name followed by the total number of mutants collected from that strain. We used a hypergeometric test to compare the mutation spectrum of each strain to that of the control LCTL1 strain, and those which differ significantly after Bonferoni correction are marked with asterisks.
Figure 4—figure supplement 5
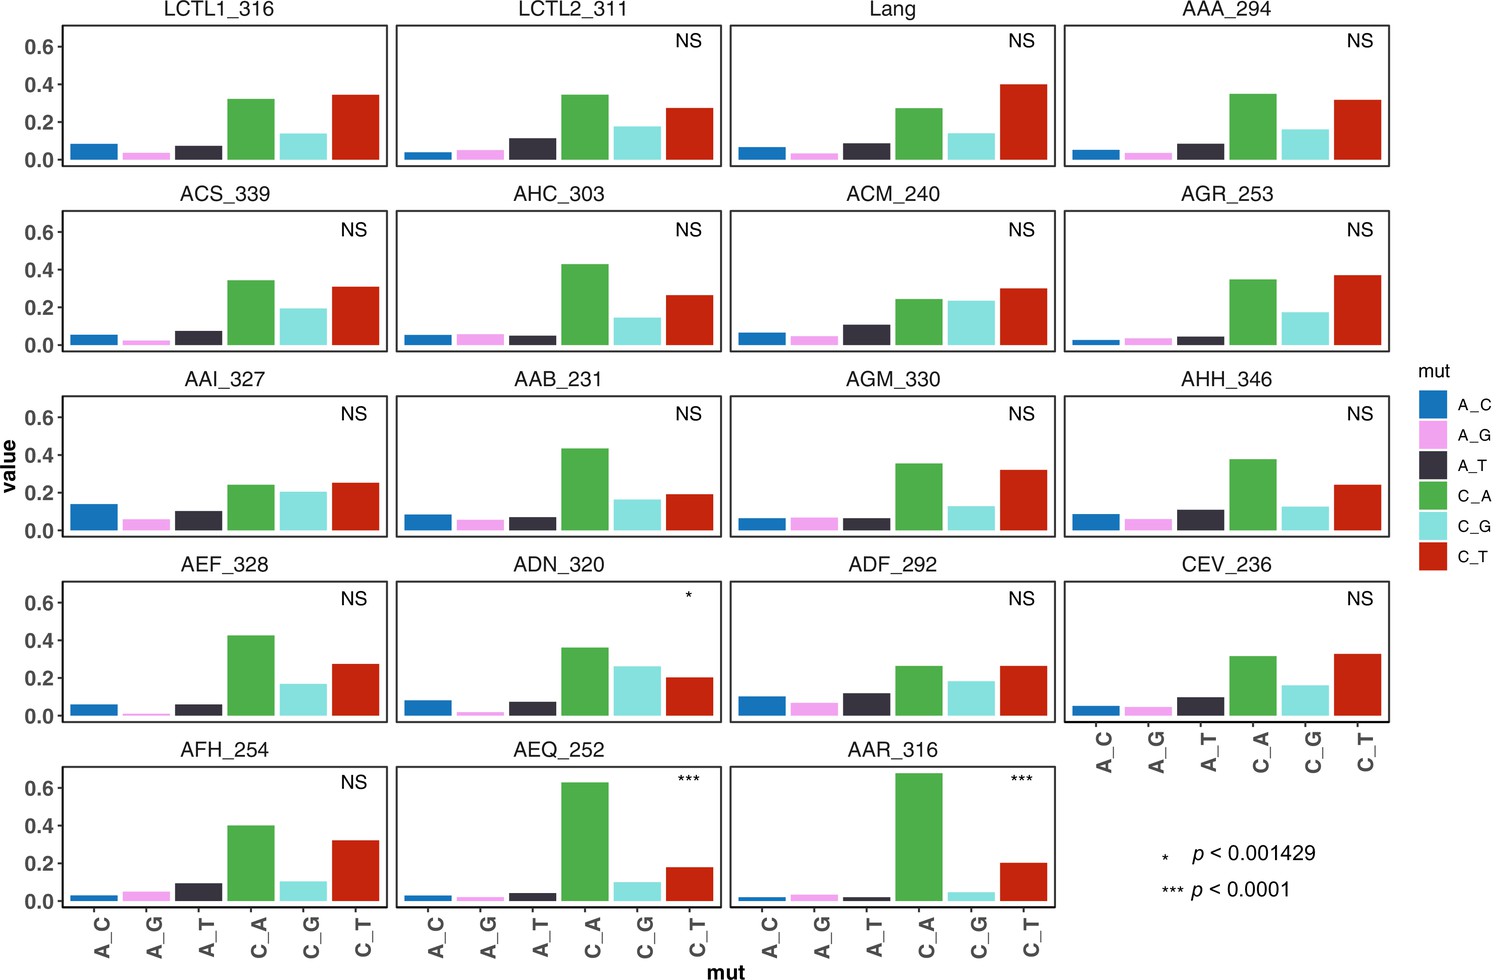
De novo mutation spectra of all strains (single base-pair substitutions only).
We used a hypergeometric test to compare each strain to the control LCTL1 strain, and those which differ significantly after Bonferoni correction are marked with asterisks.
Figure 4—figure supplement 6
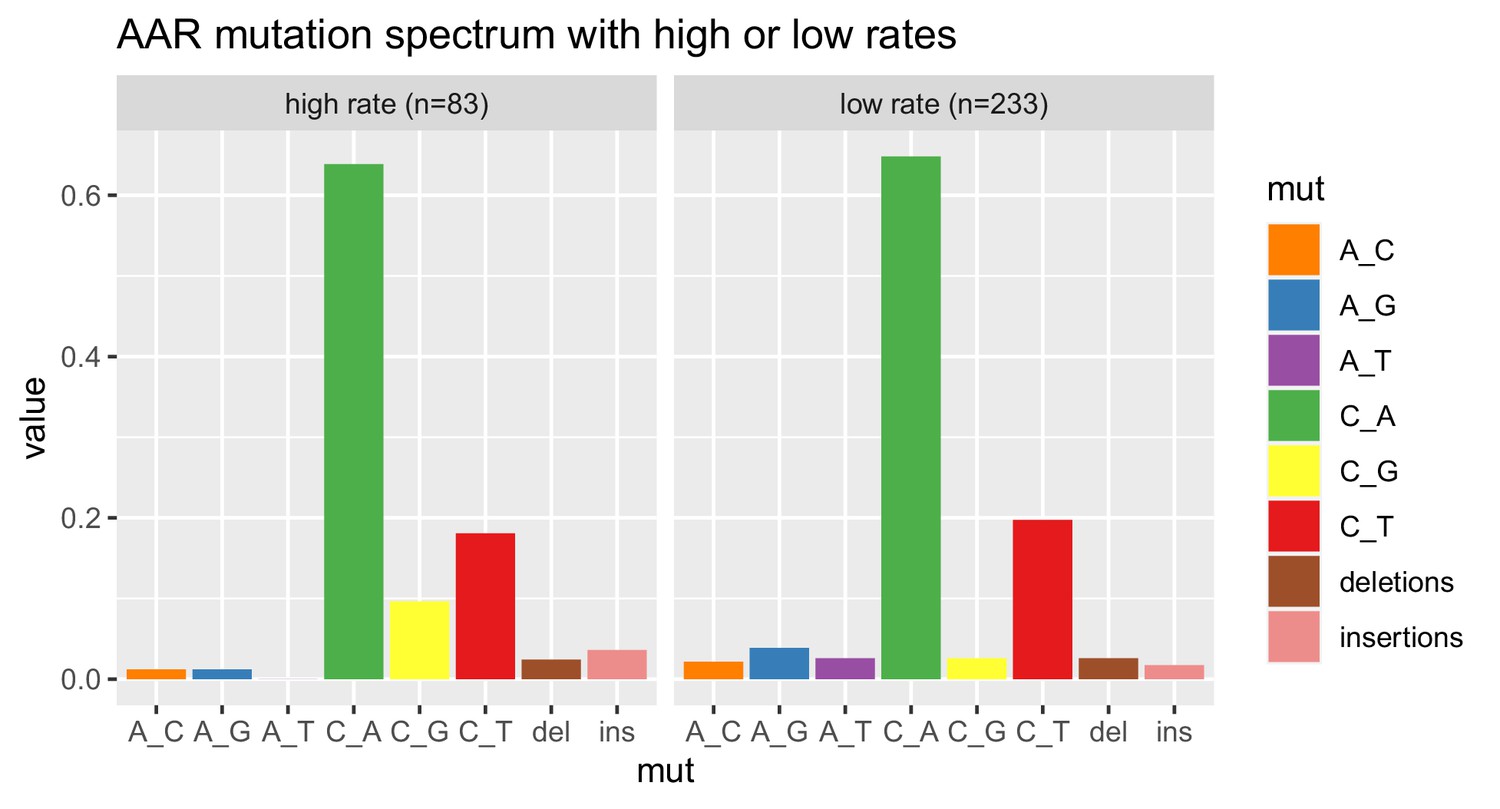
Comparison of AAR mutation spectra from high versus low mutation rate batches.
As shown in Figure 3, we measured a bimodal distribution of mutation rates in the strain AAR. To investigate whether AAR pools with different measured mutation rates also have different mutation spectra, we classified each replicate as a high-rate or low-rate replicate based on whether the rate from the replicate was greater or less than 1.9e-6, then computed the mutation spectrum of each rate bin. The two spectra both exhibit the strain’s distinctive enrichment of C > A mutations.
Figure 4—figure supplement 7
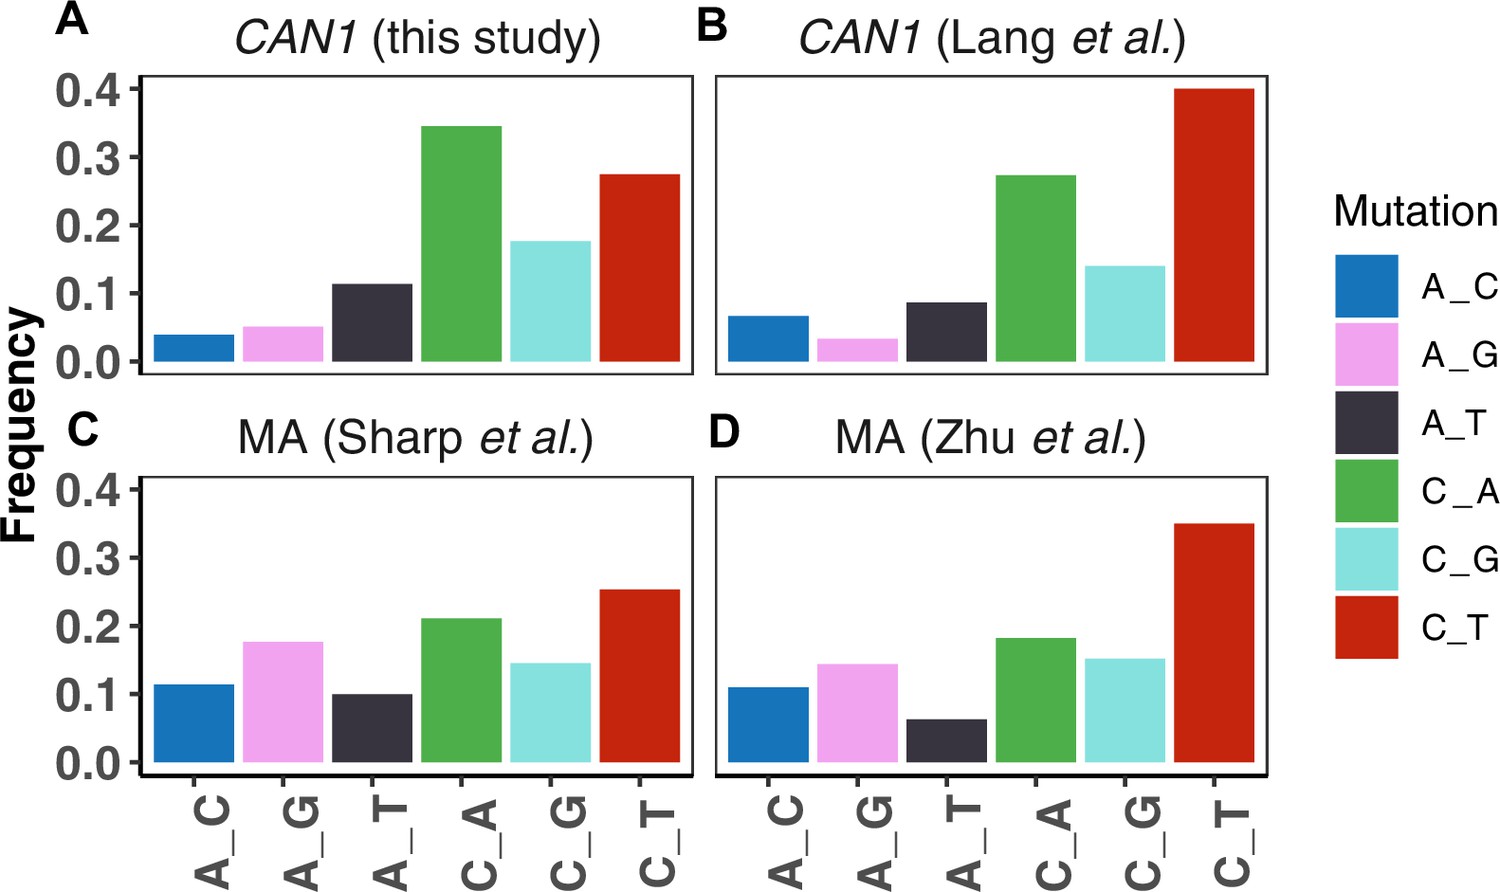
Comparison of mutation spectra from CAN1 reporter assays versus whole genome mutation accumulation (MA).
A. The CAN1 mutation spectrum from the strain LCTL2 measured in this study (the same strain was previously used in Lang and Murray, 2008). B. The CAN1 mutation spectrum of LCTL2 previously reported in Lang and Murray, 2008 C. A whole genome mutation spectrum from an MA study by Sharp et al., 2018, using haploid yeast from the RDH54+ strain. D. A whole-genome mutation spectrum of diploid MA study by Zhu et al., 2014.
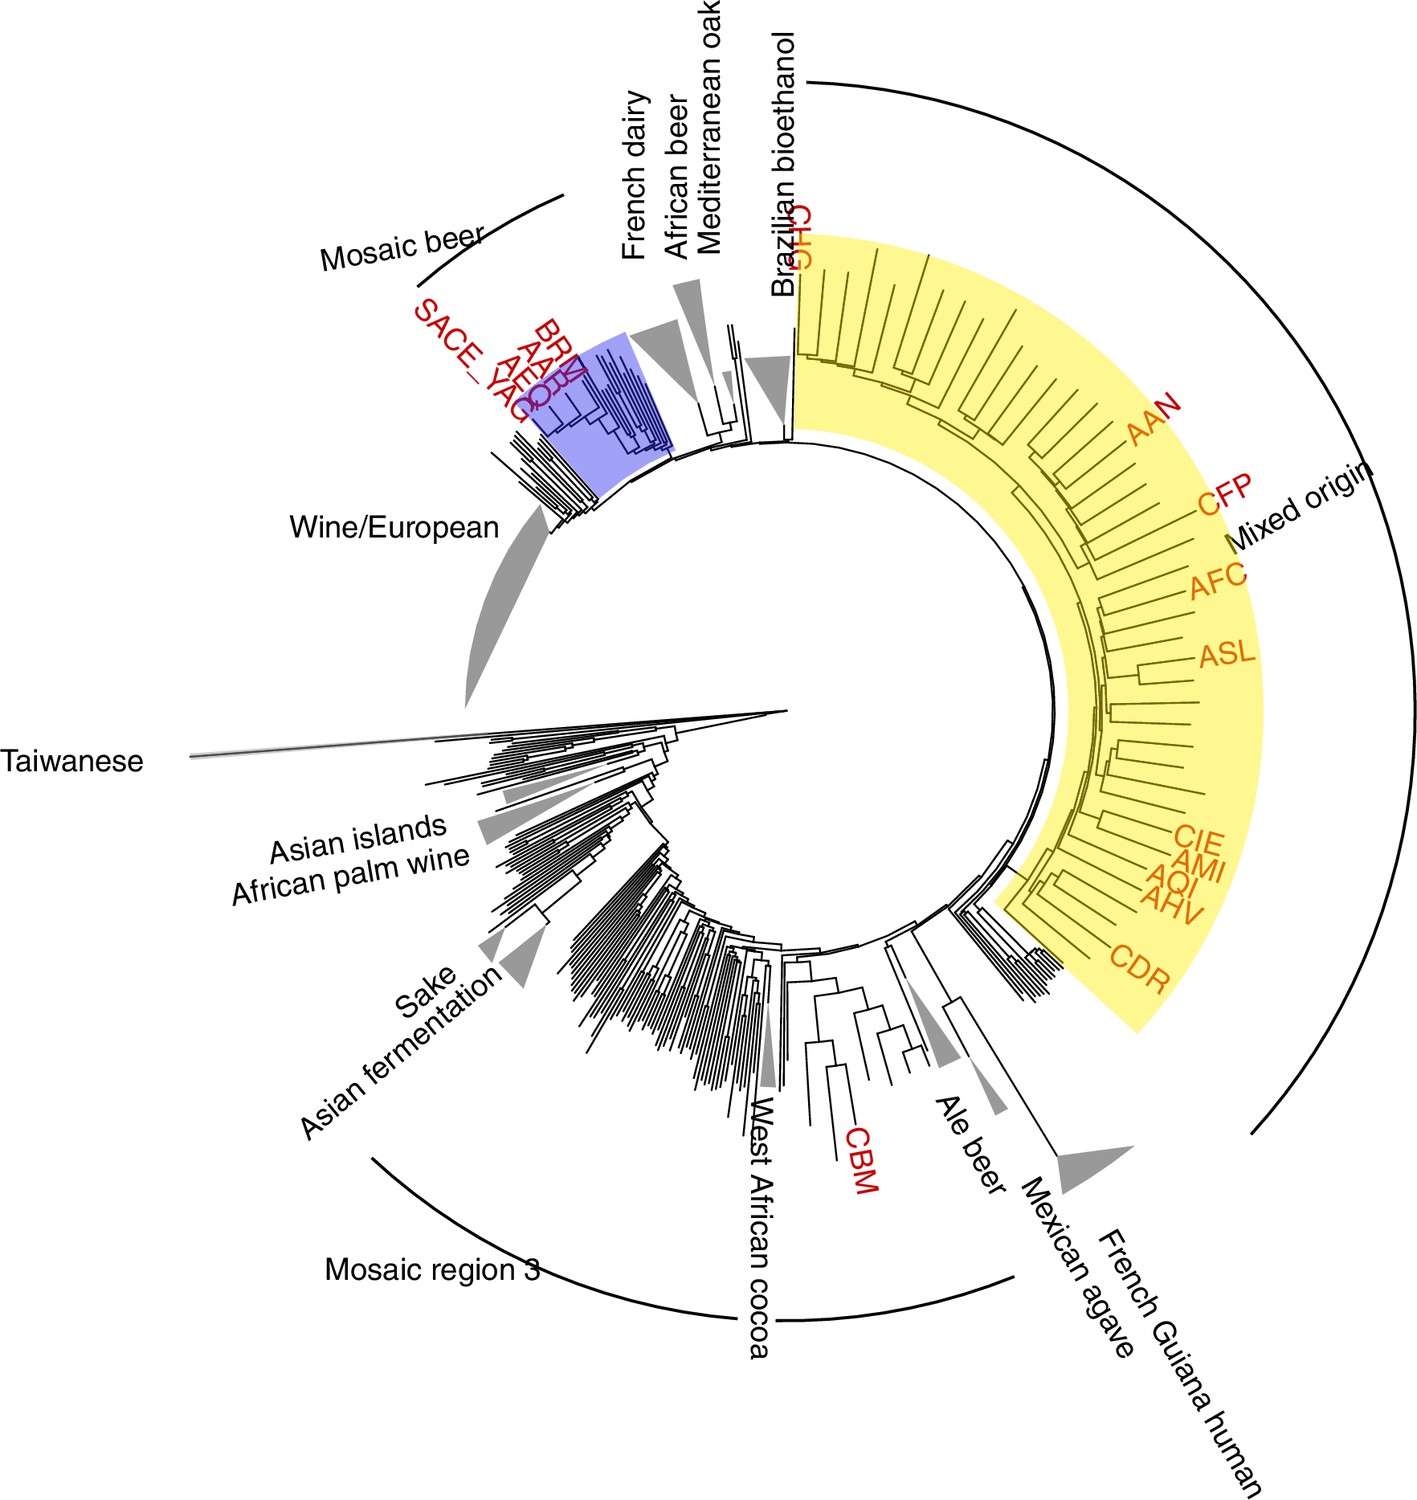
Figure 5 with 3 supplements
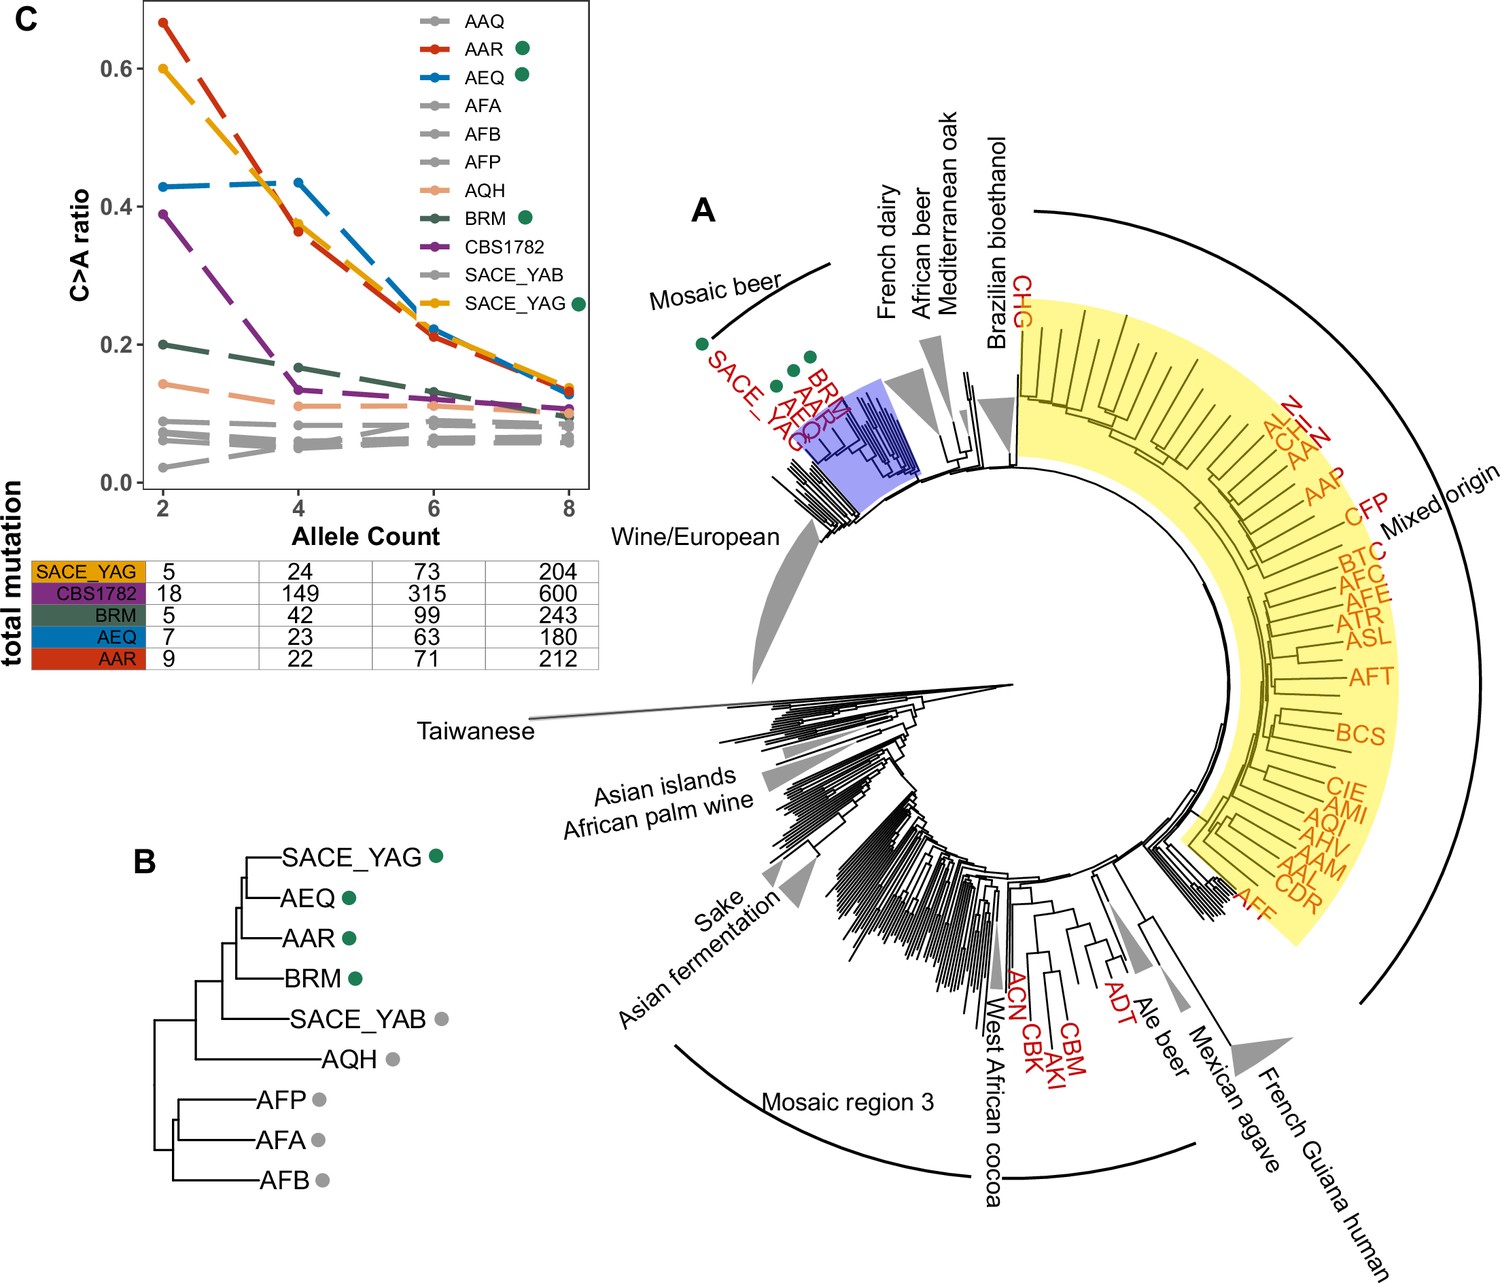
Enrichment of C > A mutations in rare natural variants.
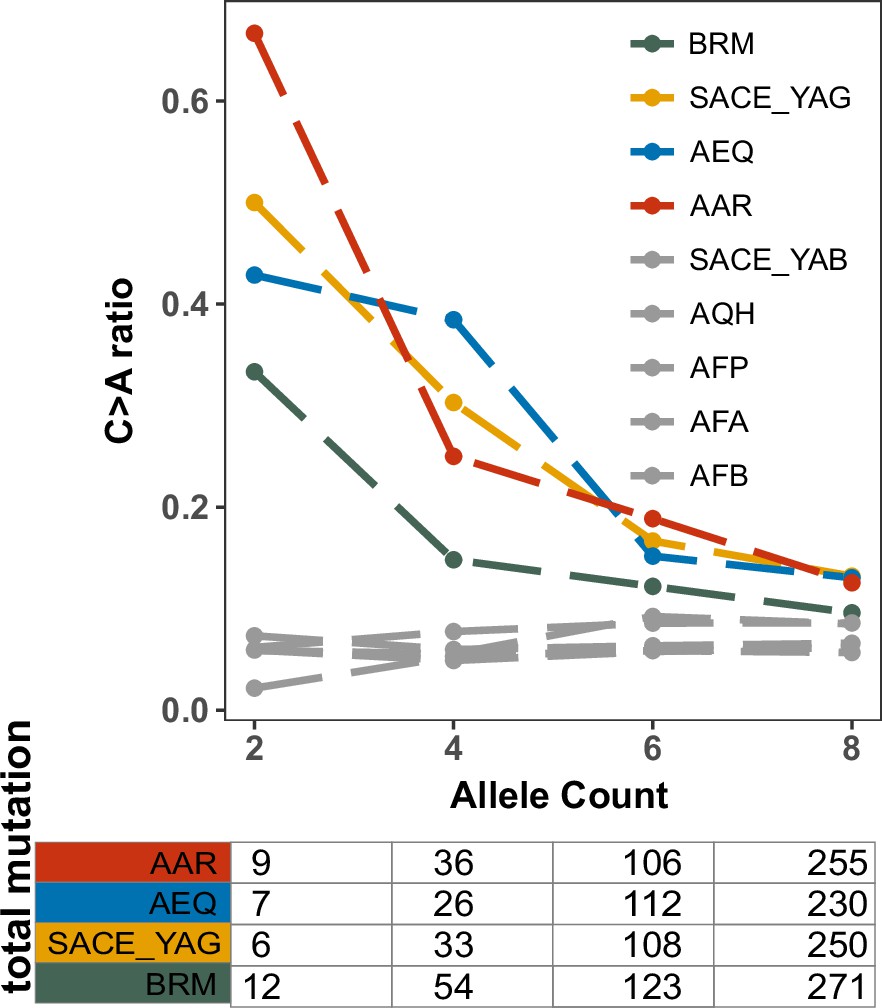
(A) Phylogeny of the 1011 collection with strains in the top 5% of C > A fraction shown in red. (B) Phylogeny of AEQ, AAR, and closely related Mosaic beer strains (C) Top panel: The C > A ratio as a function of minor allele count in Mosaic beer strains that are closely related to AEQ and AAR, including AEQ’s and AAR’s the diploid common ancestor CBS 1782. C > A ratios in polymorphisms are calculated across allele count (AC) bins with cutoffs of 2, 4, 6, and 8. When computing allele counts, closely-related strains are excluded, and each strain is represented as a diploid in genotype. Bottom panel: total number of variants in each AC bin.
Figure 5—figure supplement 1
Enrichment of C > A in rare polymorphisms in the 1,011 collection (measured using empirical bootstrapping).
To further investigate the robustness of the enrichment of various lineages for rare C > A mutations, we compared their rare variant spectra to synthetic spectra obtained by subsampling rare variants from the 1011 collection. Each empirical spectrum was compared to 100 synthetic spectra created by subsampling variants to match the strain’s total count of rare variants with global allele counts 2, 3, and 4. The strains highlighted here are the subset of the strains highlighted in Figure 5A that also appear significantly enriched for C > A by this bootstrapping approach, with an empirical p-value of less than 0.05.
Figure 5—figure supplement 2
Enrichment of C > A mutations in rare natural variants from Mosaic beer strains that are closely related to AEQ and AAR from the 1,011 collection.
C > A ratios in polymorphisms were calculated across allele count (AC) bins with cutoffs of 2, 4, 6, and 8. These allele counts are based on variation from the 1011 yeast genomes. They differ slightly from the counts in Figure 5A which include both the 1011 yeast genomes and the strain CBS 1782.
Figure 5—figure supplement 3
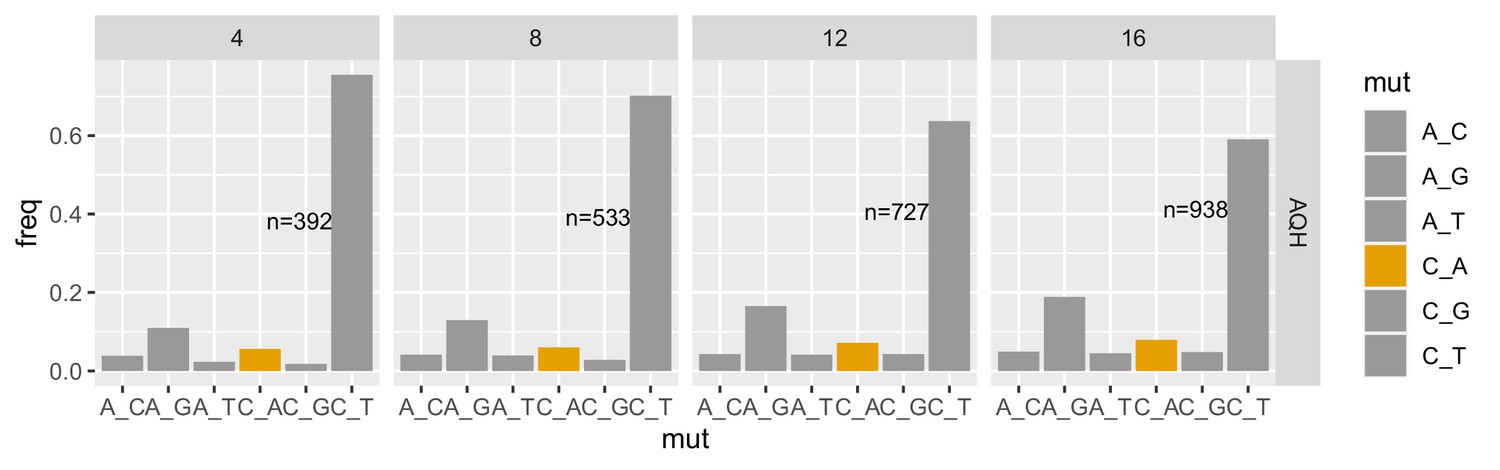
Mutation spectra of rare natural polymorphisms in AQH stratified by minor allele count.
Each panel is labeled with its maximum allele count (AC) cutoff, meaning all variants with allele count less than or equal to the cutoff are included. Singletons are excluded.
Figure 6
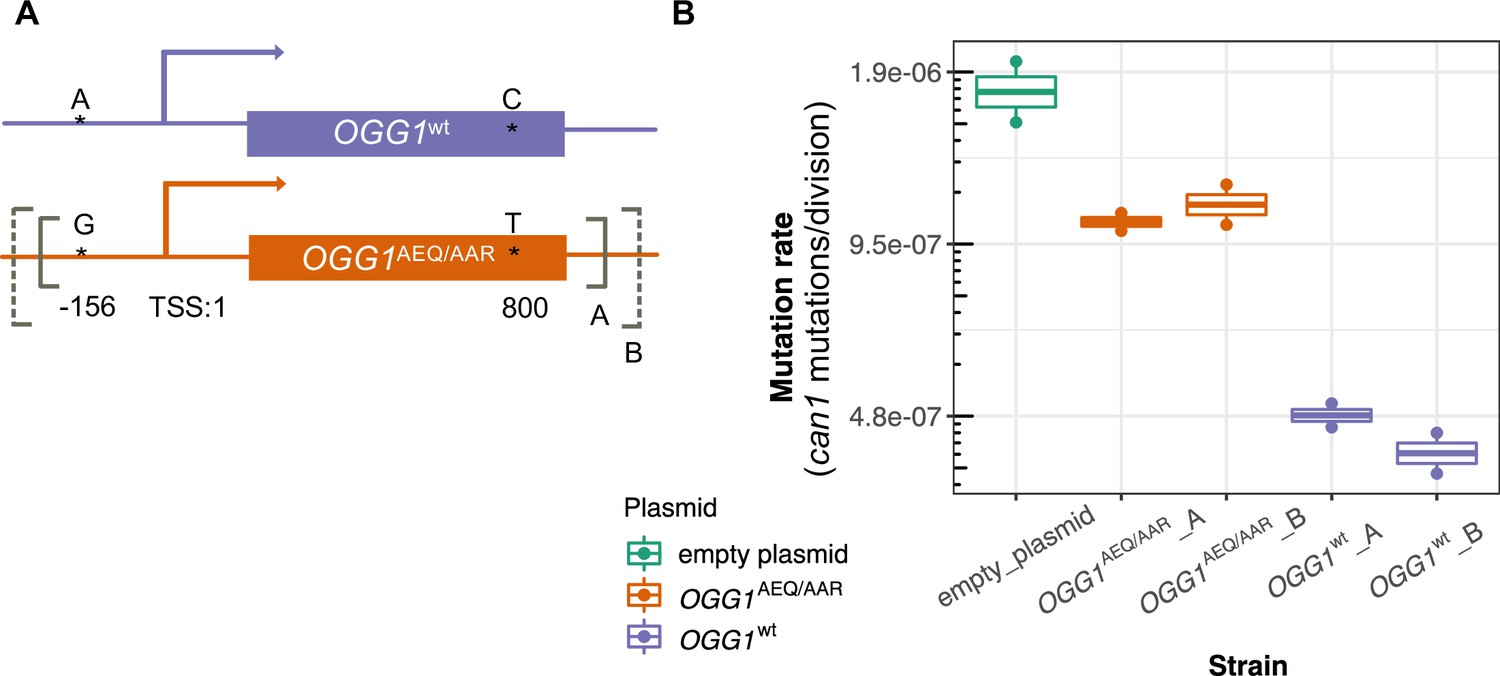
Mutation rates of an ogg1 deletion strain complemented by OGG1AEQ/AAR versus OGG1wt.
(A) Locations of the genetic variants differentiating the OGG1wt and OGG1AEQ/AAR alleles. Solid and dashed lines denote the boundaries of OGG1_A and OGG1_B (not to scale). OGG1_A contains a 1.7 kb PCR fragment including OGG1, while OGG1_B contains a 2.2 kb PCR fragment. (B) Mutation rate estimates of ogg1 deletion strains transformed by plasmids containing different OGG1 alleles.
Additional files
-
Transparent reporting form
- https://cdn.elifesciences.org/articles/68285/elife-68285-transrepform1-v4.docx
-
Supplementary file 1
List of strains from the 1011 Genomes used for the mutation spectrum PCA.
- https://cdn.elifesciences.org/articles/68285/elife-68285-supp1-v4.xlsx
Download links
A two-part list of links to download the article, or parts of the article, in various formats.
Downloads (link to download the article as PDF)
Open citations (links to open the citations from this article in various online reference manager services)
Cite this article (links to download the citations from this article in formats compatible with various reference manager tools)
A modified fluctuation assay reveals a natural mutator phenotype that drives mutation spectrum variation within Saccharomyces cerevisiae
eLife 10:e68285.
https://doi.org/10.7554/eLife.68285


