Striking parallels between dorsoventral patterning in Drosophila and Gryllus reveal a complex evolutionary history behind a model gene regulatory network
- Institute for Zoology/Developmental Biology, Biocenter, University of Cologne, Germany
- The Natural History Museum, United Kingdom
- Regional Computing Centre (RRZK), University of Cologne, Germany
- Department of Biological Sciences, University of Illinois at Chicago, United States
Figures
Figure 1

The evolution of dorsoventral (DV) patterning in insects.
The upper-left frame shows a cross section through a blastoderm embryo, indicating the prospective regions along the DV axis. The gradient filled triangles indicate the two major signalling pathways required for establishing these fates in most insect embryos. The phylogenetic tree shows the relationships of five insects for which the DV patterning system has been analysed at the functional level, including Gryllus, the subject of this paper. For each insect, key findings are depicted schematically using cross sections through blastoderm embryos and egg chambers. The sections on the left show half-embryos with Toll (left) and BMP (right) signalling gradients. The depicted distribution of Toll signalling is based on indirect evidence in the case of Nasonia, Oncopeltus and Gryllus. The middle column of sections shows the fate map shift upon loss of BMP signalling uncovering the BMP-independent patterning functions of Toll signalling. The right column shows the follicular epithelium surrounding the oocyte with the oocyte nucleus in green. pipe expression is indicated in blue.
Figure 2 with 11 supplements
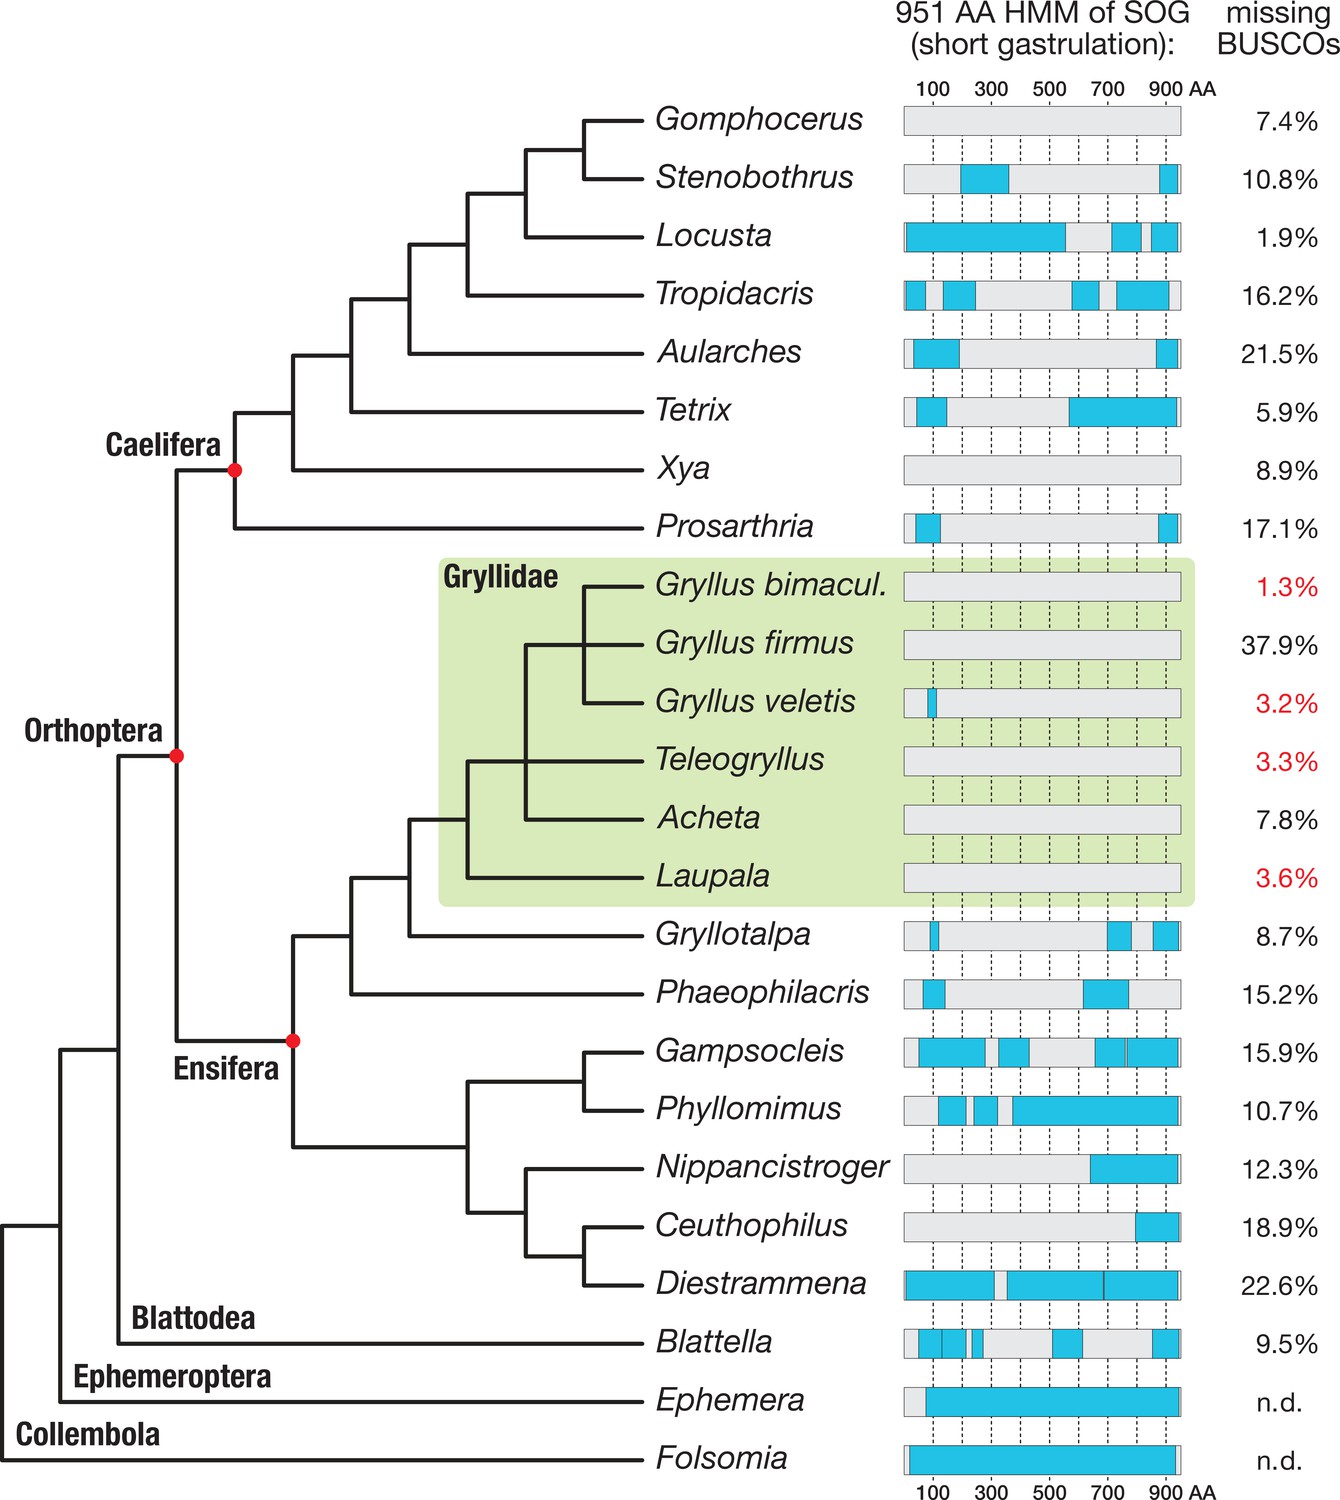
Search for short gastrulation (Sog) in Orthoptera.
A 951 amino acid long Sog hidden Markov model (HMM, see Materials and methods) was used to identify Sog or Sog fragments in the transcriptomes of 21 orthopteran species and in the outgroup species Blattella germanica (Supplementary file 1 for full species names). Known Ephemera danica and Folsomia candida Sog sequences were directly scanned with the HMM as control. Sog HMM regions with transcriptomic evidence (i.e. Blast reciprocal best hit-controlled matches to the Sog HMM) are indicated as blue boxes, mapped onto a schematic phylogenetic tree of the corresponding species (phylogeny after Leubner, 2017; Song et al., 2015; Zhang et al., 2013). The BUSCO (Basic Universal Single Copy Orthologue) values (right column; Supplementary file 1) provide a measure for the completeness of the respective transcriptomes. Among the most complete transcriptomes are those of four Gryllidae (green box; missing BUSCOs indicated in red). Sog might have been lost in several orthopteran lineages. In particular, none of the transcriptomes of the Gryllidae contained significant matches to the HMM.
Figure 2—figure supplement 1
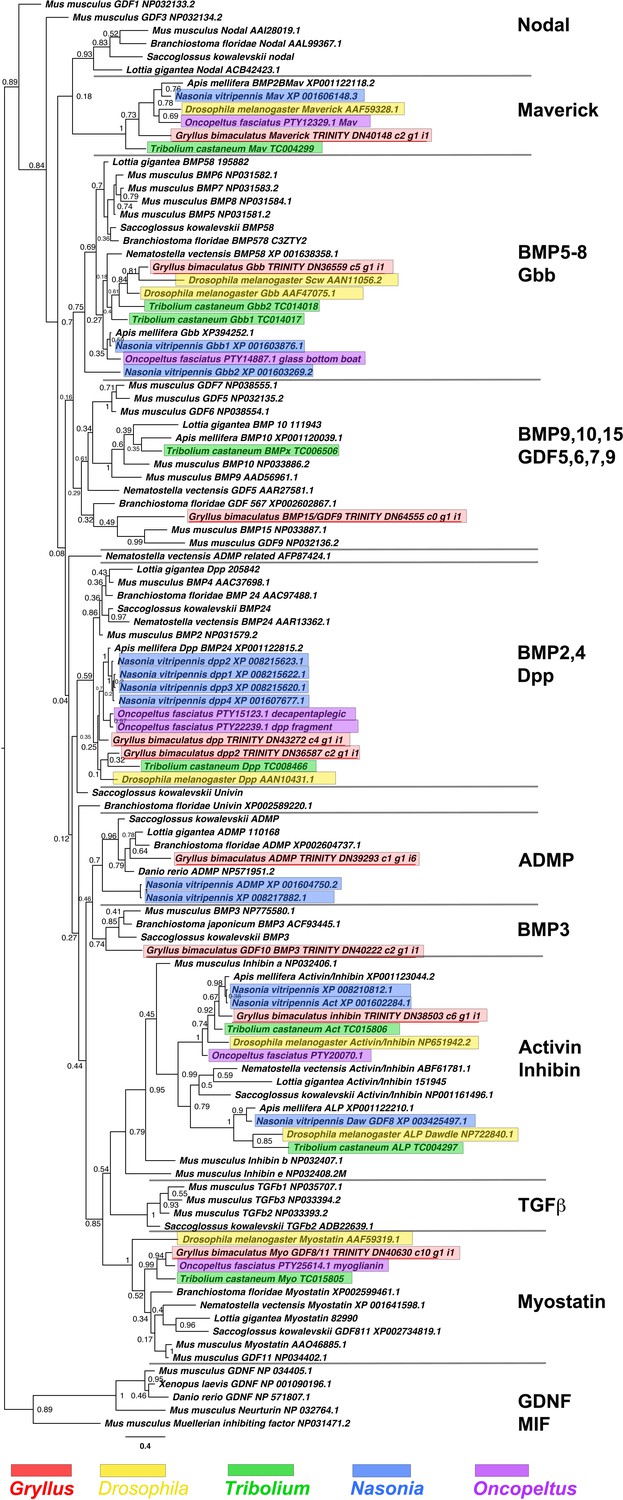
Phylogeny of BMP and TGFβ-like ligand class interrelationships across the Metazoa, as determined by Bayesian (Huelsenbeck and Ronquist, 2001) methods.
Alignment generated using MAFFT –add (Katoh and Standley, 2013) with the previously established dataset used in Kenny et al., 2014 and homologues of known identity from NCBI’s nr database using the L-INS-i strategy, resulting in a 61 informative amino acid alignment of the mature ligand domains after the exclusion of gaps. Phylogeny determined using the Whelan And Goldman (WAG) model (Whelan and Goldman, 2001). Posterior probabilities (after 5,000,000 generations) can be seen at the nodes of trees. Phylogeny rooted with known Neurturin and glial cell line-derived neurotrophic factor (GDNF) outgroups. Scale bars represent substitutions per site at given distances. The sequences of Gryllus bimaculatus, Drosophila melanogaster, Tribolium castaneum, Nasonia vitripennis and Oncopeltus fasciatus are highlighted by indicated colours.
Figure 2—figure supplement 2
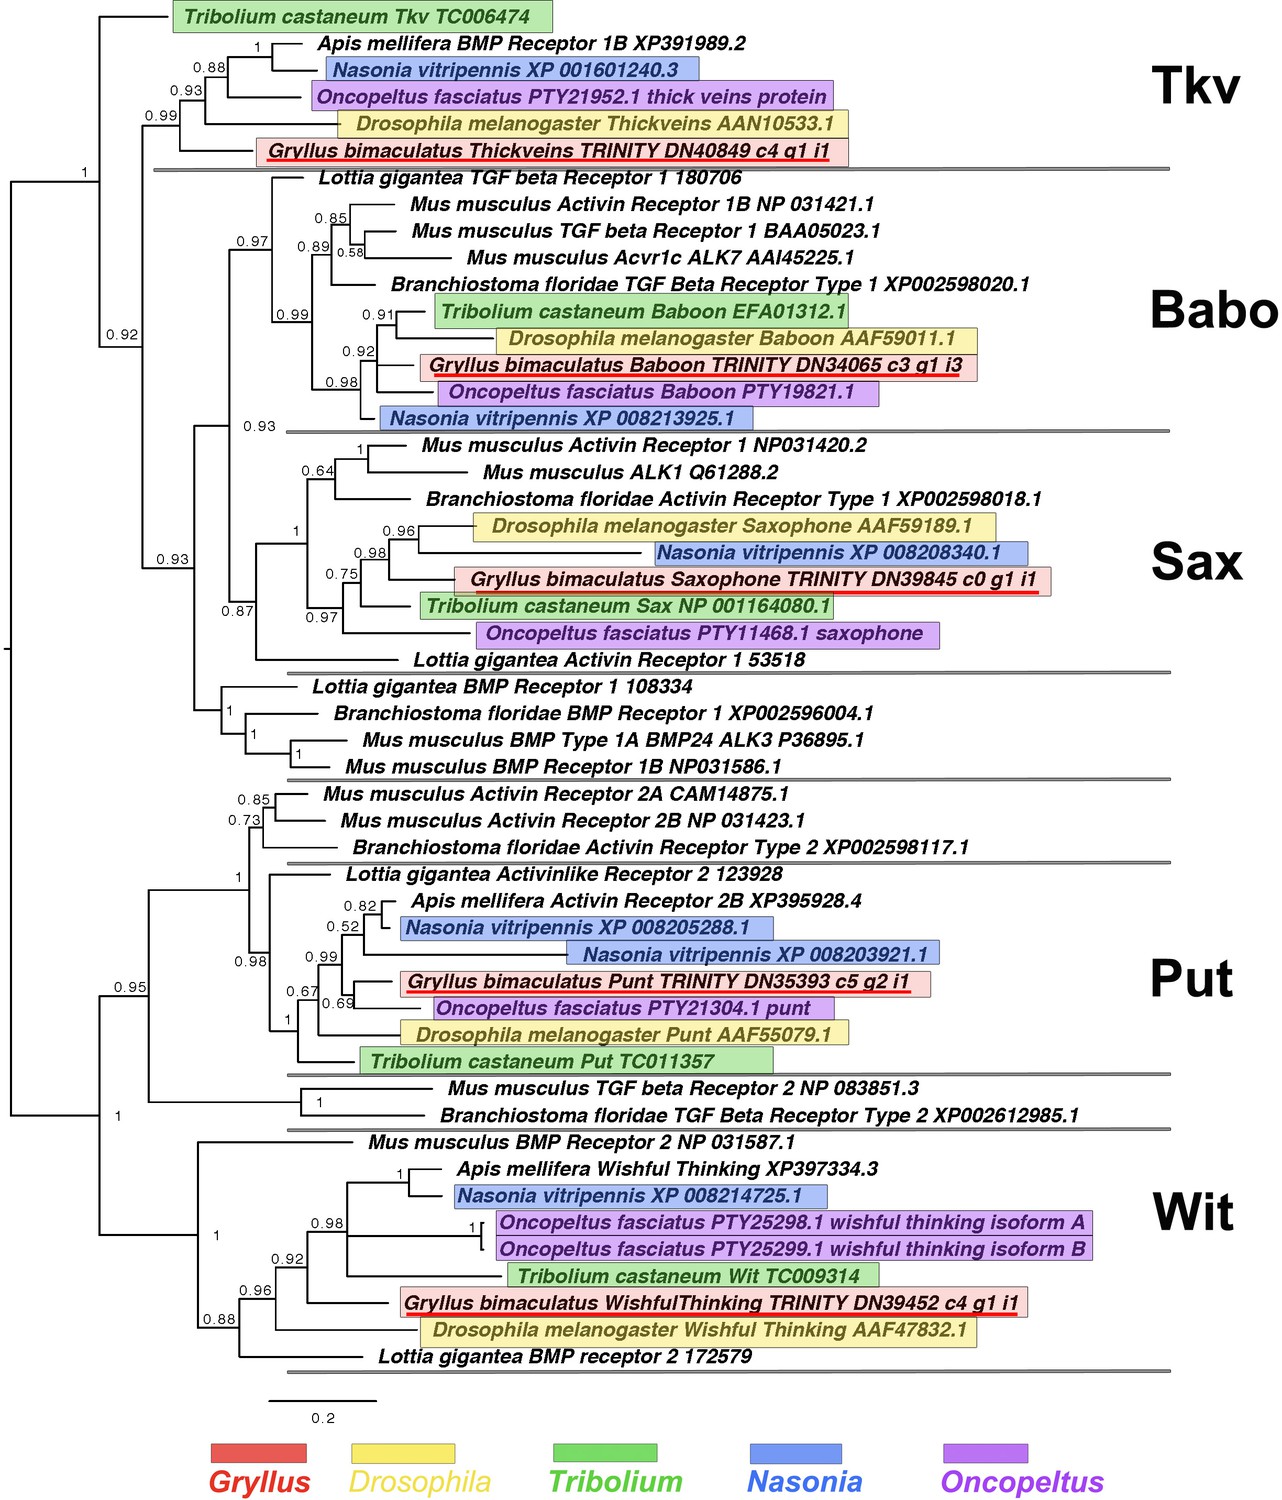
TGFβ and BMP receptor molecule interrelationships across the Metazoa, as determined by Bayesian (Huelsenbeck and Ronquist, 2001) methods, and rooted at the midpoint.
Predominantly TGFβ-like and BMP-like cascade receptors shown in green and blue, respectively. Alignment generated using MAFFT –add (Katoh and Standley, 2013) and homologues of known identity from NCBI’s nr database against the previously established dataset used in Kenny et al., 2014 using the G-iNS-i strategy, resulting in a 136 informative amino acid alignment spanning the protein kinase domain (Pfam ID PF00069). Phylogenies determined using the WAG model (Whelan and Goldman, 2001). Posterior probabilities can be seen at nodes. Scale bars represent substitutions per site at given distances. The sequences of Gryllus bimaculatus, Drosophila melanogaster, Tribolium castaneum, Nasonia vitripennis and Oncopeltus fasciatus are highlighted by indicated colours.
Figure 2—figure supplement 3
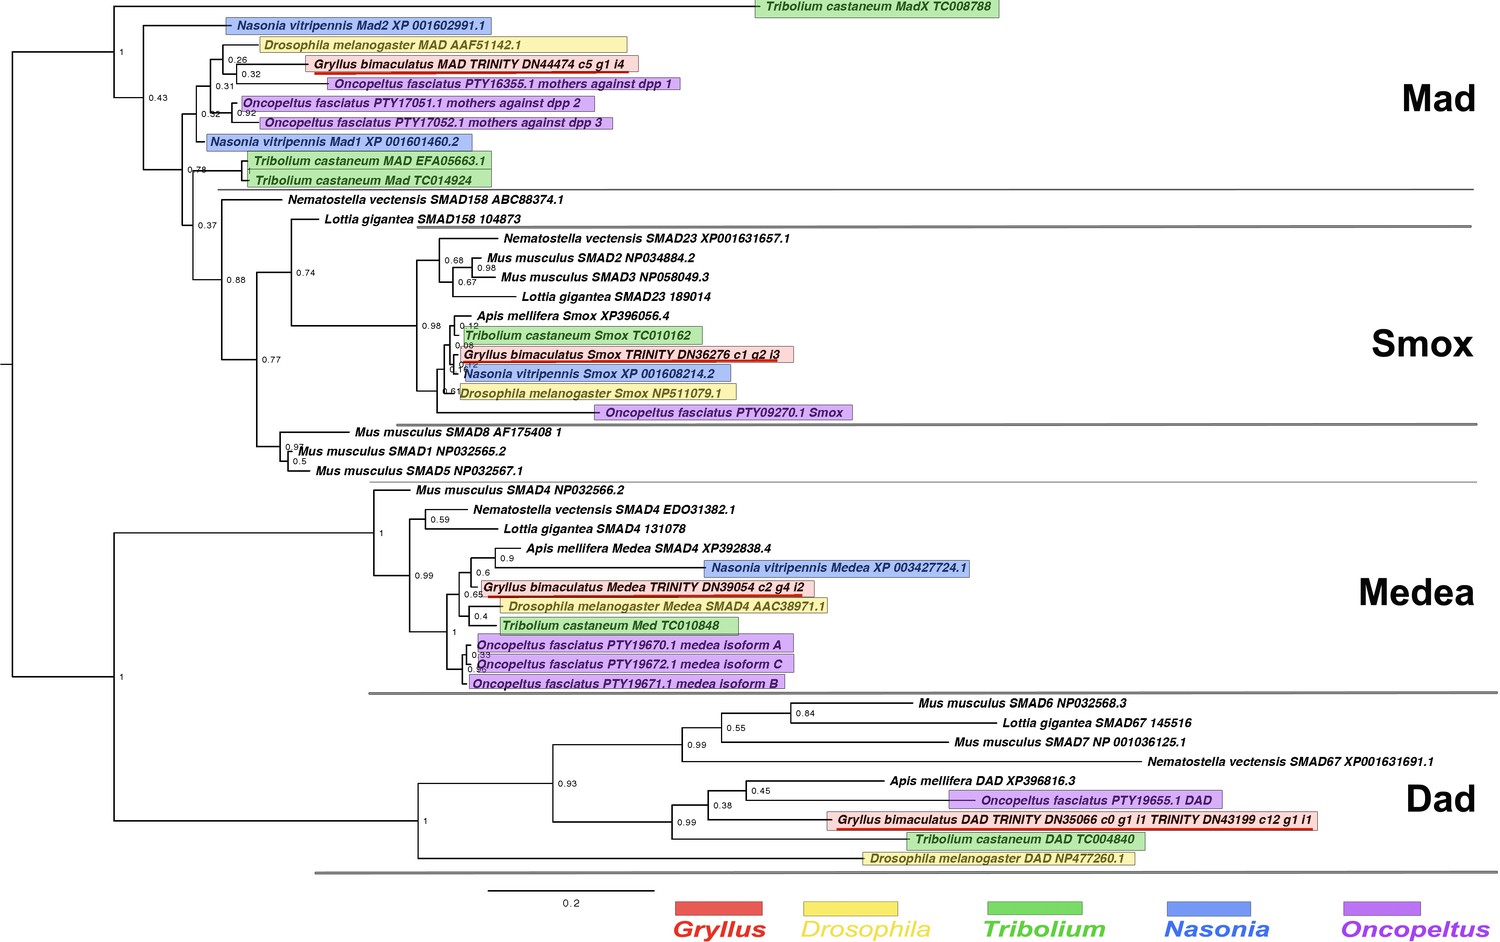
Smad and Dad interrelationships across the Metazoa, as determined by Bayesian (Huelsenbeck and Ronquist, 2001) methods.
Alignment generated using MAFFT –add (Katoh and Standley, 2013) against the previously established dataset used in Kenny et al., 2014 and homologues of known identity from NCBI’s nr database using the G-iNS-i strategy, with the section used for analysis a 127 informative amino acid region spanning the MH2 domain (Pfam ID PF03166). Phylogenies determined using the Jones model, rooted at midpoint. Posterior probabilities (after 2 million generations) can be seen at nodes. Scale bars represent substitutions per site at given distances. The sequences of Gryllus bimaculatus, Drosophila melanogaster, Tribolium castaneum, Nasonia vitripennis and Oncopeltus fasciatus are highlighted by indicated colours.
Figure 2—figure supplement 4
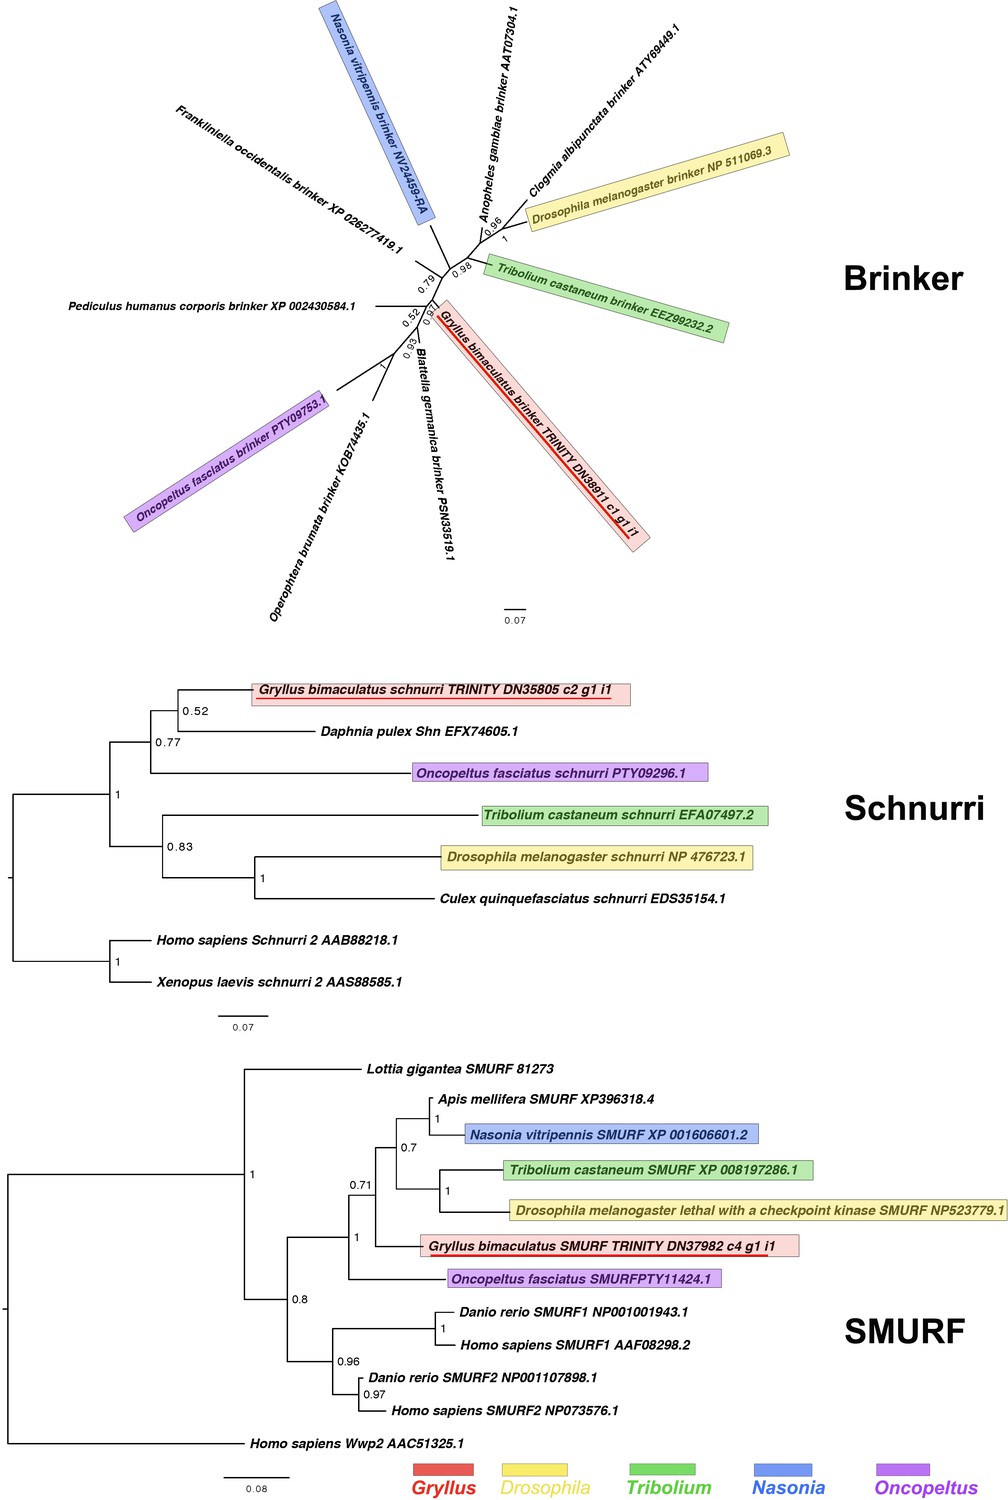
Brinker, Schnurri and SMURF interrelationships as determined by Bayesian (Huelsenbeck and Ronquist, 2001) methods.
Brinker phylogenies inferred on the basis of a MAFFT alignment (Katoh and Standley, 2013, G-INS-i strategy vs. homologues of known identity from NCBI’s nr database) with 66 informative sites, analysed under the Dayhoff model, and shown unrooted. Schnurri phylogeny based on a 135 informative amino acid global alignment generated using MAFFT (Katoh and Standley, 2013) alongside homologues of known identity from NCBI’s nr database using the G-iNS-i strategy, analysed under the WAG model, and rooted with known vertebrate sequence. The Smurf phylogeny was calculated under the Jones model, based on a 195 informative amino acid alignment generated using MAFFT –add (Katoh and Standley, 2013) using the G-iNS-i strategy, against the Kenny et al., 2014 dataset and homologues of known identity from NCBI’s nr database with outgroup specified as Homo sapiens Wwp2 (AAC51325.1). Scale bars represent substitutions per site at given distances. The sequences of Gryllus bimaculatus, Drosophila melanogaster, Tribolium castaneum, Nasonia vitripennis and Oncopeltus fasciatus are highlighted by indicated colours.
Figure 2—figure supplement 5

Noggin, Follistatin and Pentagone interrelationships across the Metazoa, as determined using Bayesian (Huelsenbeck and Ronquist, 2001) methods.
Noggin phylogeny based on a 80 informative amino acid global alignment generated using MAFFT –add (Katoh and Standley, 2013) with the previously established dataset used in Kenny et al., 2014 and homologues of known identity from NCBI’s nr database using the G-iNS-i strategy rooted at midpoint. Posterior probabilities (2 million generations) can be seen at the base of nodes. Follistatin phylogenies inferred on the basis of a MAFFT –add alignment (Katoh and Standley, 2013, G-INS-i strategy vs. the Kenny et al., 2014 dataset and homologues of known identity from NCBI’s nr database) with 149 informative sites, analysed under the WAG model (Whelan and Goldman, 2001), rooted with Nematostella vectensis Follistatin (XP 001624524.1). Posterior probabilities can be seen at the base of nodes. Pentagone phylogeny based on a 220 informative amino acid global alignment generated using MAFFT (Katoh and Standley, 2013) alongside homologues of known identity from NCBI’s nr database using the G-iNS-i strategy, rooted with cnidarian SPARC-related modular calcium-binding protein sequence. Tree was run for 2 million generations under the WAG model. Posterior probabilities can be seen at the base of nodes. Scale bars represent substitutions per site at given distances. The sequences of Gryllus bimaculatus, Drosophila melanogaster, Tribolium castaneum, Nasonia vitripennis and Oncopeltus fasciatus are highlighted by indicated colours.
Figure 2—figure supplement 6
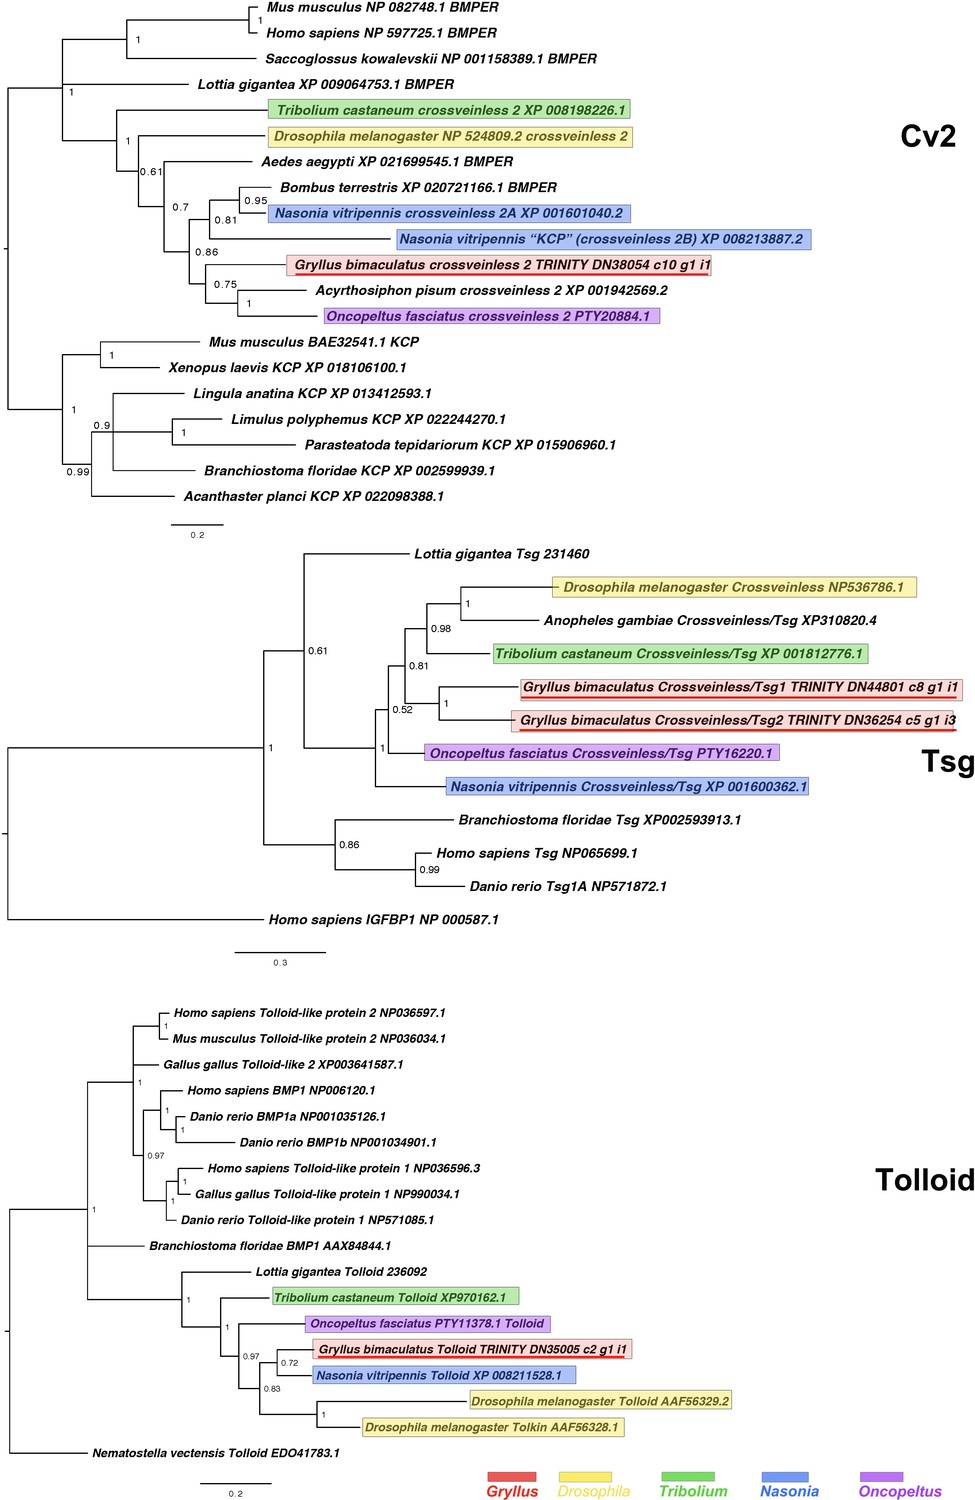
Crossveinless2/BMPER and KCP (Cv2), Twisted Gastrulation/Crossveinless (Tsg) and Tolloid interrelationships across the Metazoa, as determined by Bayesian (Huelsenbeck and Ronquist, 2001) methods.
Crossveinless2/BMPER tree based on 213 informative residue global alignment made in MAFFT –add (Katoh and Standley, 2013) with the G-iNS-i strategy with all gaps removed. Phylogeny determined with the Tree rooted with Mus musculus Kcp protein after Ikeya et al., 2006. Crossveinless 2/BMPER tree determined using WAG (Whelan and Goldman, 2001) model. Tsg phylogeny based on a 140 informative amino acid global alignment generated using MAFFT –add (Katoh and Standley, 2013) against the previously established dataset used in Kenny et al., 2014 and homologues of known identity from NCBI’s nr database using the G-iNS-i strategy, rooted with H. sapiens IGFBP (NP 000587.1) after Vilmos et al., 2001, with Tsg phylogeny determined using the Dayhoff model. Tolloid phylogeny generated according to the WAG model from a 160 informative amino acid alignment spanning the calcium-binding EGF domain and immediately preceeding the Cub domain, generated using MAFFT –add (Katoh and Standley, 2013) under the G-INS-i strategy and rooted with Tolloid-like protein sequence. Scale bars represent substitutions per site at given distances. The sequences of Gryllus bimaculatus, Drosophila melanogaster, Tribolium castaneum, Nasonia vitripennis and Oncopeltus fasciatus are highlighted by indicated colours.
Figure 2—figure supplement 7
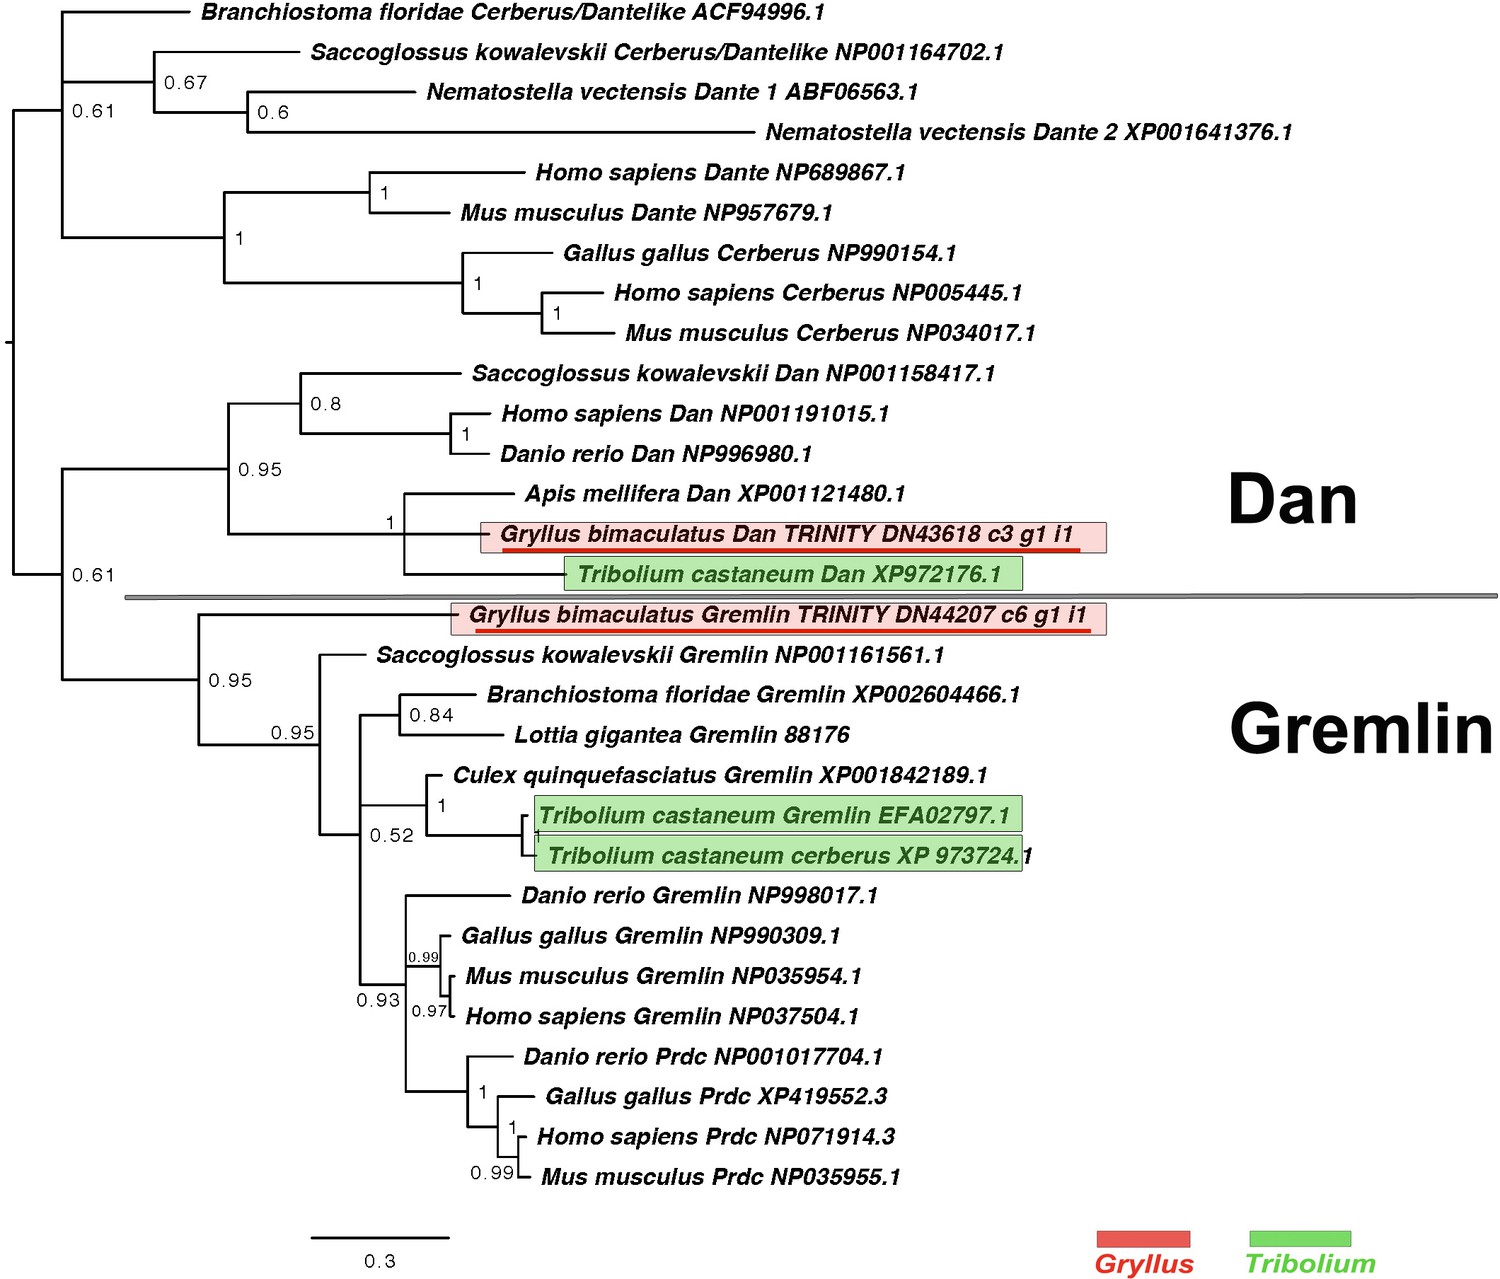
DAN class interrelationships across the Metazoa, as determined by Bayesian (Huelsenbeck and Ronquist, 2001) methods.
Alignment generated using MAFFT –add (Katoh and Standley, 2013) against the previously established dataset used in Kenny et al., 2014 and homologues of known identity from NCBI’s nr database using the G-iNS-i strategy. Phylogenies calculated on the basis of a 76 informative amino acid alignment spanning the DAN domain (Pfam ID PF03045). Phylogenies determined using the WAG model (Whelan and Goldman, 2001) and rooted at midpoint. Posterior probabilities can be seen at the base of nodes. Scale bars represent substitutions per site at given distances. The sequences of Gryllus bimaculatus and Tribolium castaneum are highlighted by indicated colours.
Figure 2—figure supplement 8

pipe, windbeutel and nudel interrelationships across the Metazoa, as determined by Bayesian (Huelsenbeck and Ronquist, 2001) methods.
pipe phylogeny based on a 259 informative amino acid global alignment generated using MAFFT (Katoh and Standley, 2013) alongside homologues of known identity from NCBI’s nr database using the G-iNS-i strategy. Tree was run for 1 million generations under the WAG model and rooted with non-insect pipe sequences. windbeutel phylogeny based on a 227 informative amino acid global alignment generated using MAFFT (Katoh and Standley, 2013) alongside homologues of known identity from NCBI’s nr database using the G-iNS-i strategy and rooted with the human outgroup sequence. Tree was run for 1 million generations under the WAG model. nudel phylogenies inferred on the basis of a MAFFT alignment (Katoh and Standley, 2013, G-INS-i strategy vs. homologues of known identity from NCBI’s nr database) with 305 informative sites analysed under the Blosum model for 1 million generations and shown rooted with outgroup enterokinases. Gryllus bimaculatus sequences underlined in red. Scale bars represent substitutions per site at given distances.
Figure 2—figure supplement 9

spaetzle interrelationships across the Metazoa, as determined by Bayesian (Huelsenbeck and Ronquist, 2001) methods.
spaetzle phylogeny based on a 92 informative amino acid global alignment generated using MAFFT (Katoh and Standley, 2013) alongside homologues of known identity from NCBI’s nr database using the G-iNS-i strategy, analysed under the WAG model for 2 million generations, and rooted with non-insect spaetzle sequences. Please note, in Oncopeltus some sequences were excluded due to truncated sequence lying outside the domain used for phylogenetic reconstruction. Gryllus bimaculatus sequences underlined in red. Scale bars represent substitutions per site at given distances.
Figure 2—figure supplement 10

pelle and tube interrelationships across the Metazoa, as determined by Bayesian (Huelsenbeck and Ronquist, 2001) methods.
pelle and tube phylogenies inferred on the basis of a MAFFT alignment (Katoh and Standley, 2013, G-INS-i strategy vs. homologues of known identity from NCBI’s nr database) with 132 informative sites and shown with the root chosen between the two gene families. Tree was run for 1 million generations under the WAG model. Gryllus bimaculatus sequences underlined in red. Scale bars represent substitutions per site at given distances. MyD88 phylogeny based on a 126 informative amino acid global alignment generated using MAFFT L-INS-I (Katoh and Standley, 2013) alongside homologues of known identity from NCBI’s nr database. Tree was run for 1 million generations under the WAG model, rooted with Toll-like outgroups. Gryllus bimaculatus sequences underlined in red. Scale bars represent substitutions per site at given distances.
Figure 2—figure supplement 11
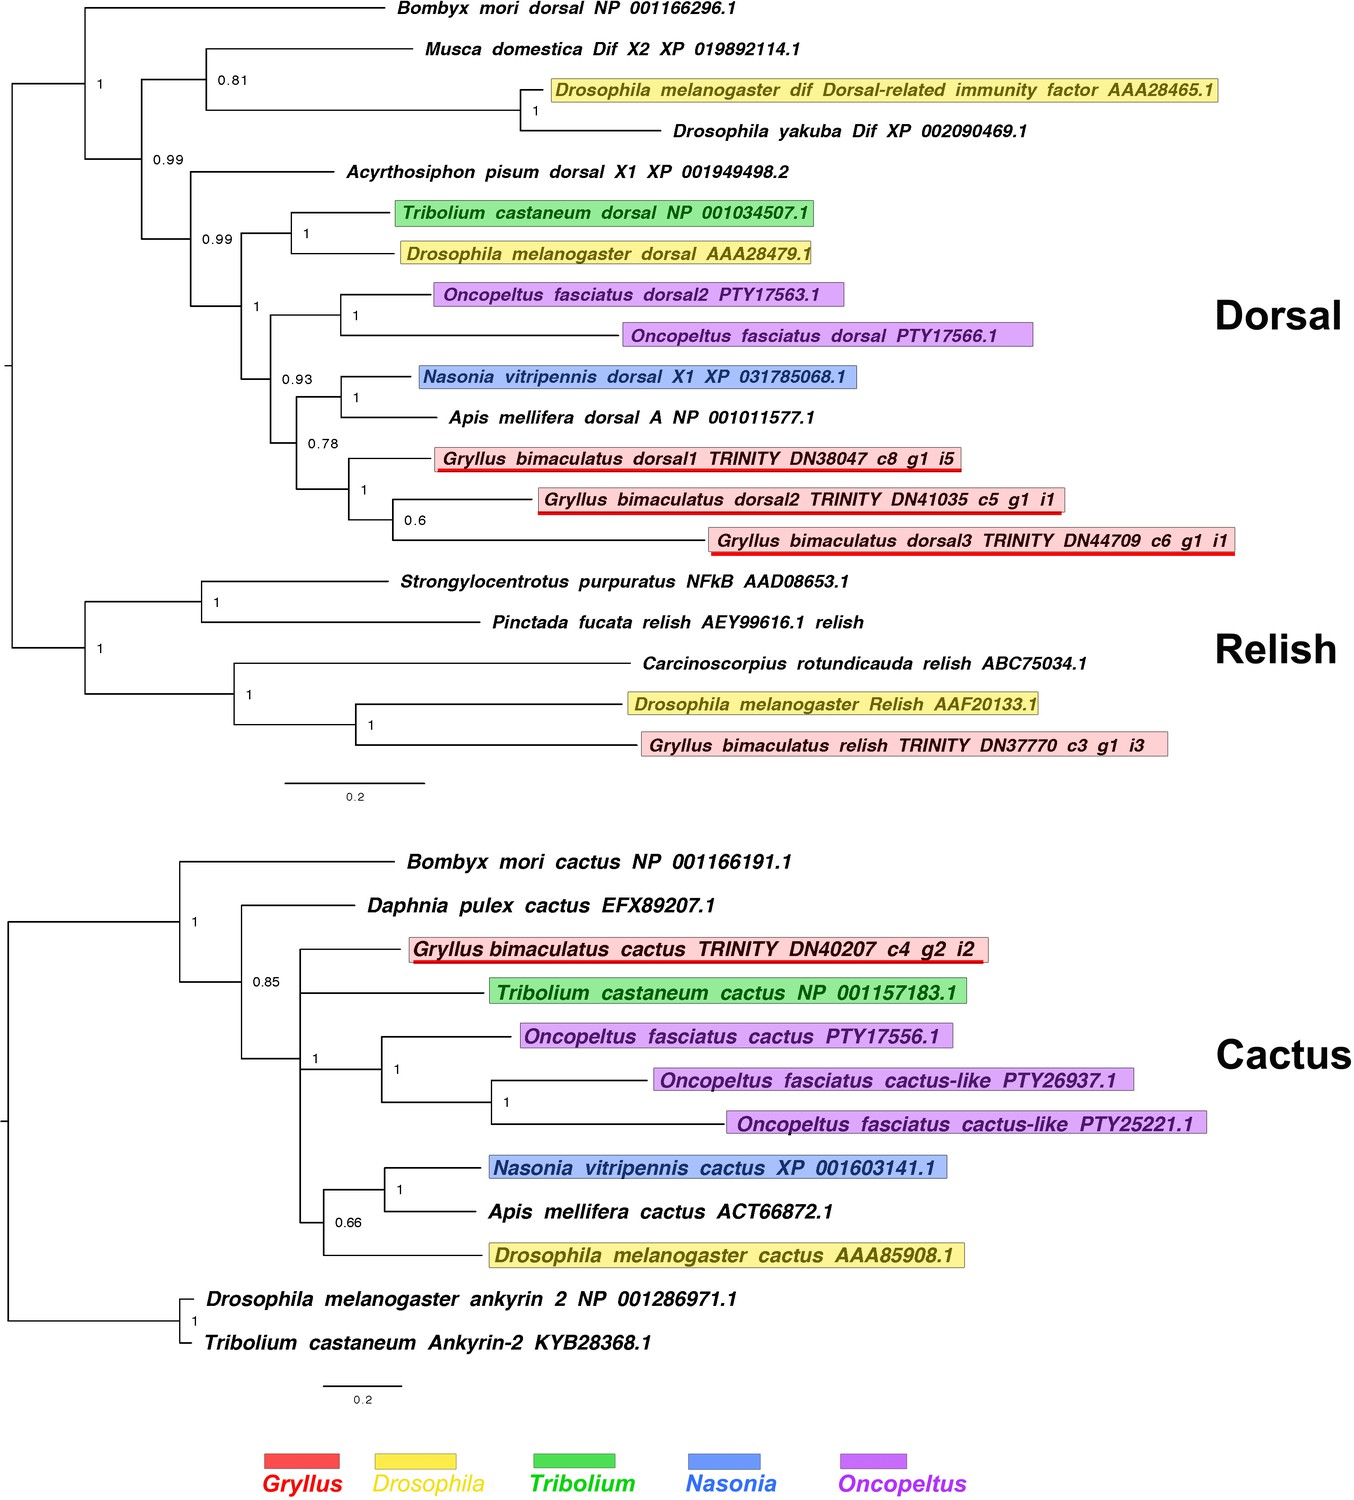
dorsal, relish and cactus interrelationships across the Metazoa, as determined by Bayesian (Huelsenbeck and Ronquist, 2001) methods.
dorsal phylogeny based on a 221 informative amino acid global alignment generated using MAFFT (Katoh and Standley, 2013) alongside homologues of known identity from NCBI’s nr database using the G-iNS-i strategy, analysed under the WAG model for 2 million generations, and rooted with relish sequences (including that of Gryllus bimaculatus).cactus phylogenies inferred on the basis of a MAFFT alignment (Katoh and Standley, 2013, G-INS-i strategy vs. homologues of known identity from NCBI’s nr database) with 122 informative sites, analysed under the cpREV model for 1 million generations, and shown rooted with ankyrin two sequences. Scale bars represent substitutions per site at given distances. Please note, for cactus some Oncopeltus sequences were excluded due to truncated sequence lying outside the domain used for phylogenetic reconstruction.
Figure 3 with 2 supplements
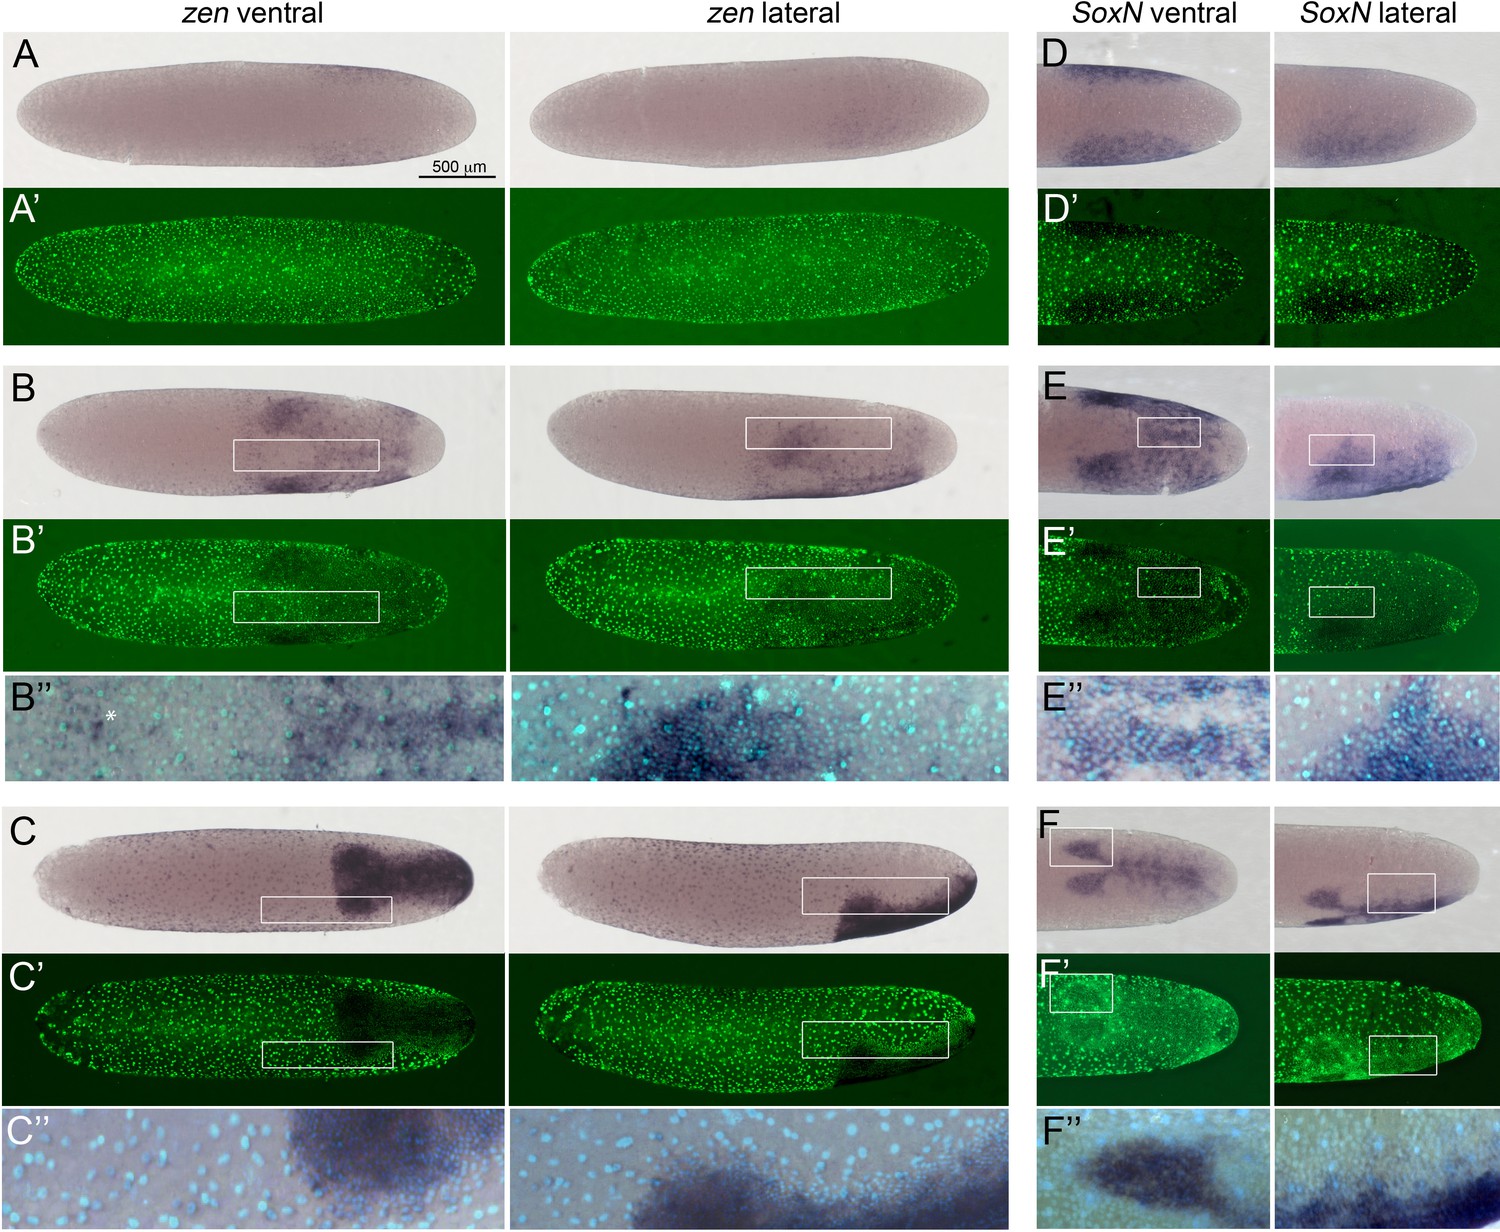
Expression of Gb-zen and Gb-SoxN in early Gryllus embryos.
(A–C) Whole-mount ISH for Gb-zen showing ventral and lateral surface views of embryos (A) at early germ anlage condensation (ES 2.2–2.3), (B) late condensation (ES 2.4–2.5) and (C) early germ band stage (ES 4). (A’–C’) DNA staining (Sytox) of respective embryos. (B’’, C’’) Magnified overlay of ISH and DNA staining of regions boxed in (B, B’) and (C, C’). (D, E) Whole-mount ISH for Gb-SoxN showing ventral and lateral surface views of the posterior 40% of embryos (D) at early germ anlage condensation (ES 2.2–2.3), (E) late condensation (ES 2.4–2.5) and (F) early band stage (ES 4). (D’, E’) DNA staining (Sytox) of respective embryos. (E’’, F’’) Magnified overlay of ISH and DNA staining of regions boxed in (E, E’) and (F, F’). All embryos are oriented with the posterior pole pointing to the right. Staging according to Donoughe and Extavour, 2016; Sarashina et al., 2005. White asterisk in B’’ indicates Gb-zen expression in serosa cells.
Figure 3—figure supplement 1
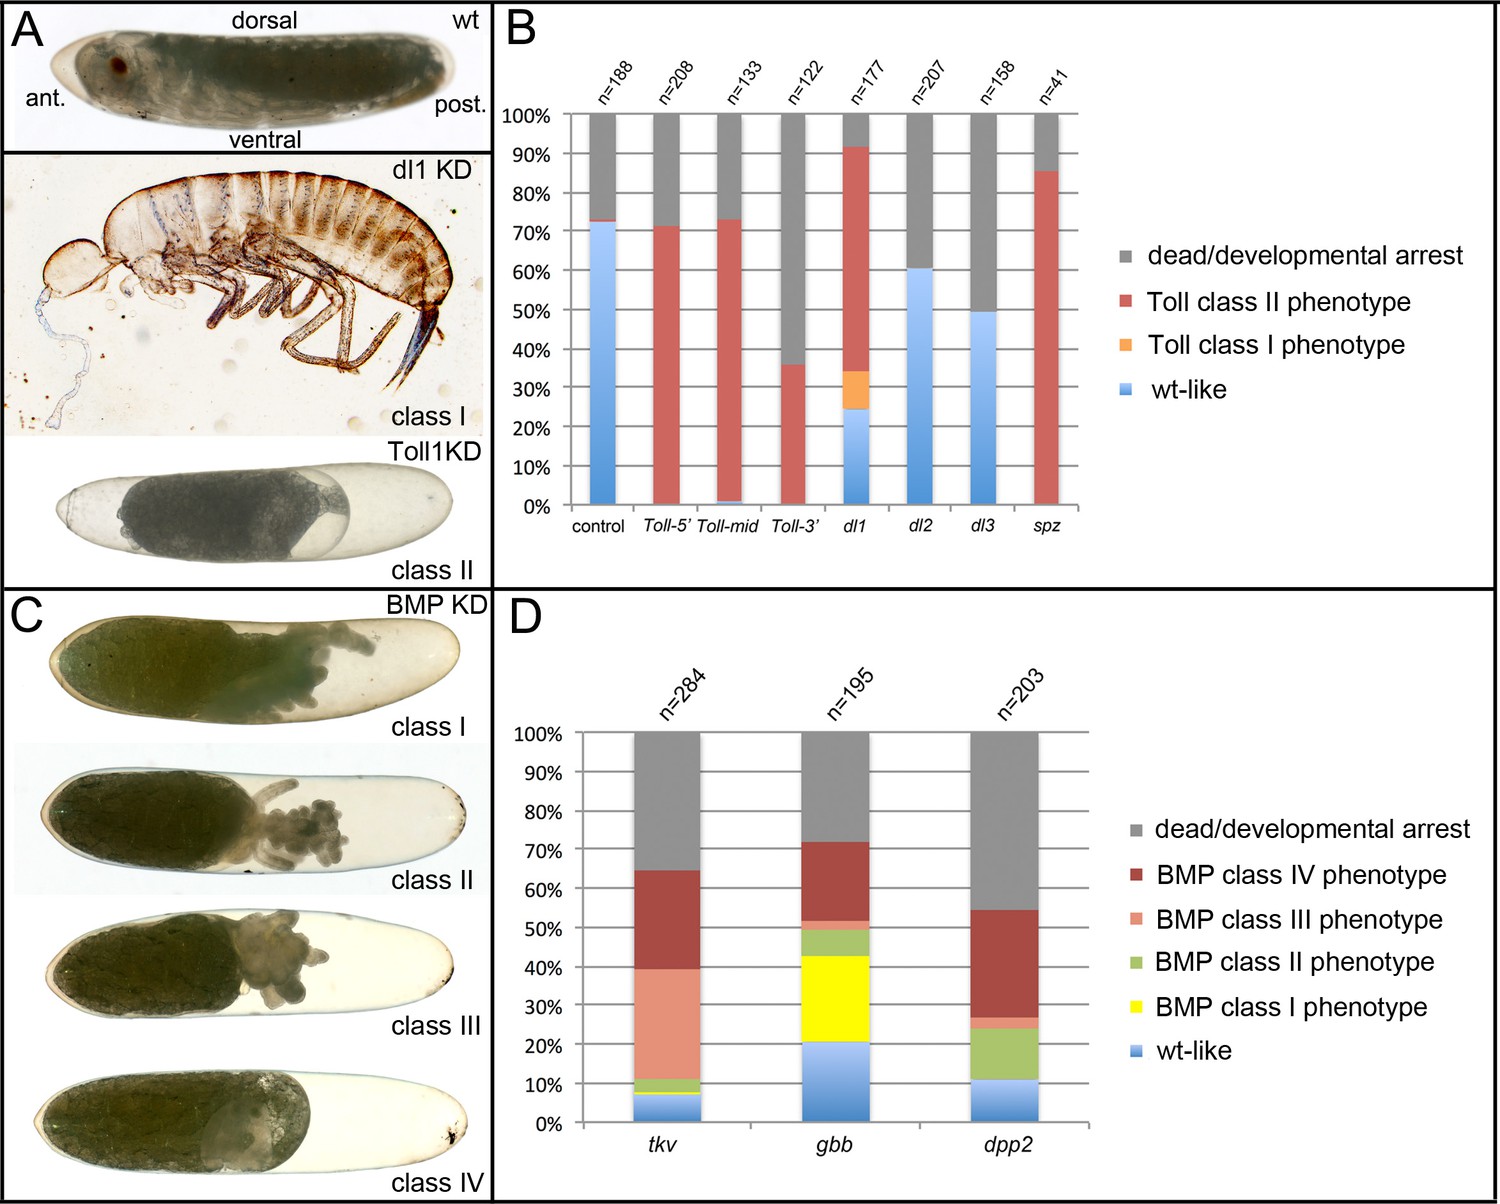
Phenotype classes resulting from reduced Toll and BMP signalling.
(A) Control wildtype (wt) embryo and terminal phenotypes produced by knockdown (KD) of Toll signalling components. The wt larva is at egg stage 20. The anterior pole of the egg is pointed, the dorsal side concave, the ventral side convex. Weak (class I) phenotypes (Gb-dl1 KD) are characterised by the production of fully segmented larvae, which completed katatrepsis and dorsal closure. Patterning defects are strongest in the thoracic and head region with cuticle constrictions, eye fusions or deletion of eyes (see also Figure 7—figure supplement 3). Strong (class II) phenotypes (here Gb-Toll1 KD) do not produce recognisable cuticle structures. Embryonic tissue fragments remain engulfed within the yolk (Figure 4—figure supplement 3). The serosa contracts from both anterior and posterior poles, leaving large fluid-filled spaces at both egg poles (see also Figure 9—figure supplement 1, Video 6). (B) Frequency of phenotypic classes upon pRNAi of Toll signalling components (three non-overlapping fragments of Gb-Toll1, Gb-dl1, Gb-dl2, Gb-dl3 and Gb-spz). Weak phenotypes (class I) were rare and only found upon Gb-dl1 KD (Figure 7—figure supplement 3). (C) Terminal phenotypes produced by KD of BMP signalling components. Weak (class I) phenotypes possess thoracic and head appendages. Eyes are frequently present, but may be fused at the dorsal side, indicating a loss of dorsal tissue and compensating expansion of ventral structures (Figure 7—figure supplement 3). The abdomen is reduced to a tube-like structure (Figure 7—figure supplement 4). Medium strong (class II) phenotypes carry only head segments, most prominently the antennae. Like in class I, the abdomen is reduced to a tube-like structure. Strong (class III) phenotypes lack recognisable segmental structures altogether. Class IV embryos have not undergone katatrepsis and thus remain engulfed within yolk and serosa. As this phenotype occurs independent from degree of segmental defects used to distinguish classes I–III, its strength cannot be determined. (D) Frequency of phenotypic classes upon pRNAi of BMP signalling components.
Figure 3—figure supplement 2
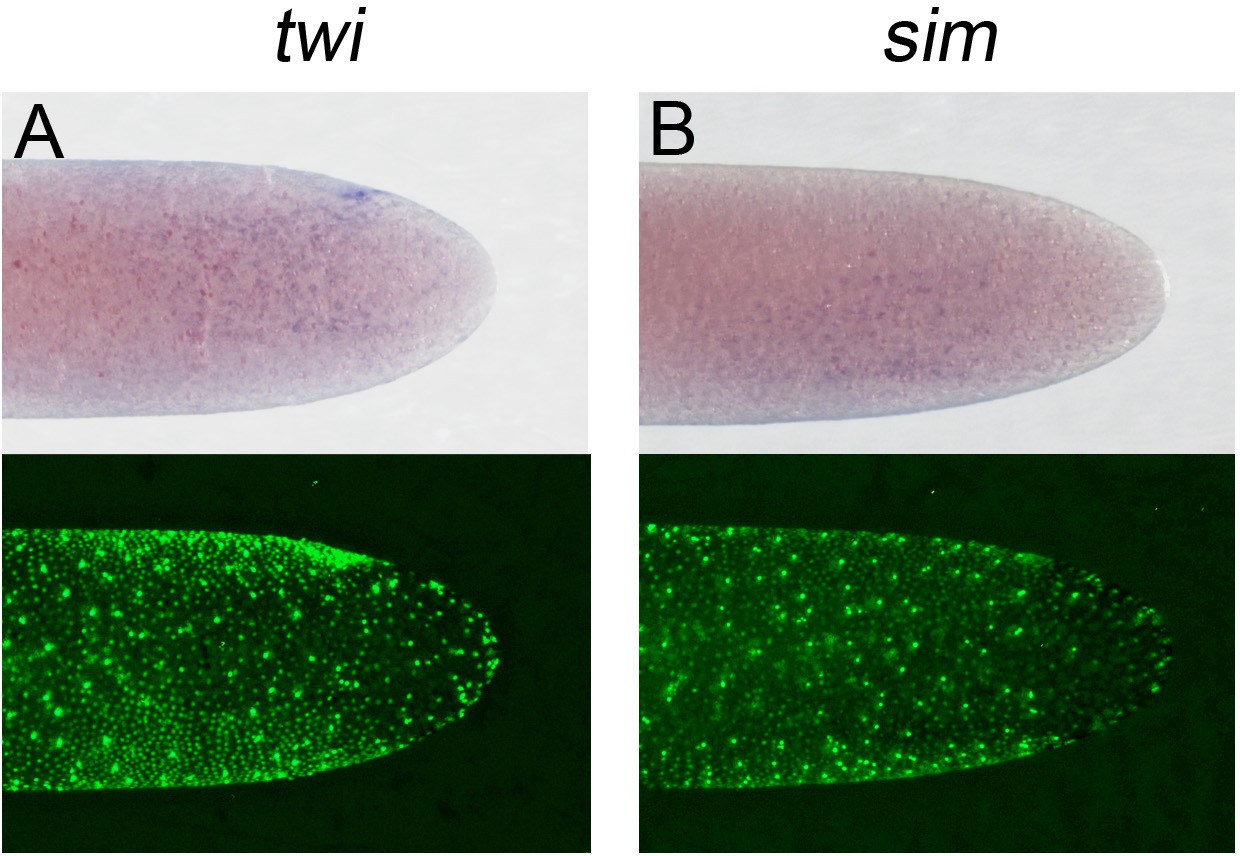
Expression of (A) Gb-twi and (B) Gb-sim in early Gryllus embryos.
Whole-mount ISH for indicated genes and DNA staining (Sytox) showing ventral surface views of the posterior 40% of embryos at early germ anlage condensation (ES 2.2–2.3).
Figure 4 with 3 supplements
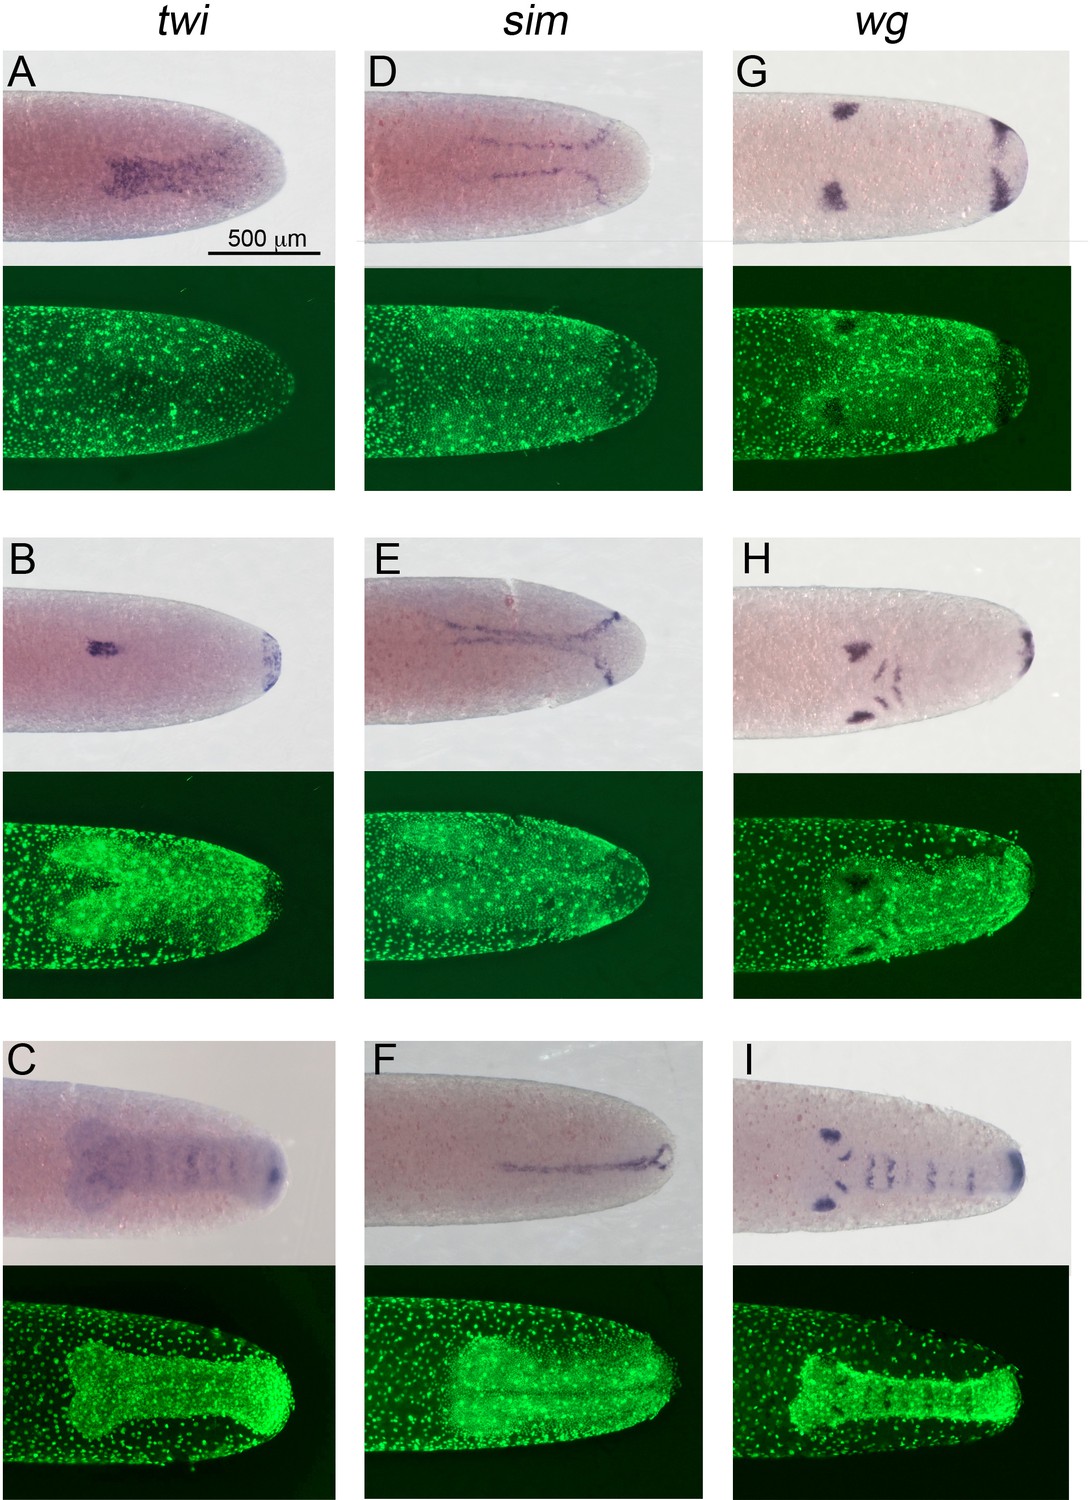
Expression of Gb-twi, Gb-sim and Gb-wg in early Gryllus embryos.
Whole-mount ISH for indicated genes and DNA staining (Sytox) showing ventral surface views of the posterior 40% of embryos at (A, D) mid germ anlage condensation (ES 2.4–2.5), (B, E, G) late germ anlage condensation (ES 2.6–3.0) and (C, F, H, I) during early germ band extension (ES 4.0–4.4). All embryos are oriented with the posterior pole pointing to the right. Staging according to Donoughe and Extavour, 2016; Sarashina et al., 2005.
Figure 4—figure supplement 1
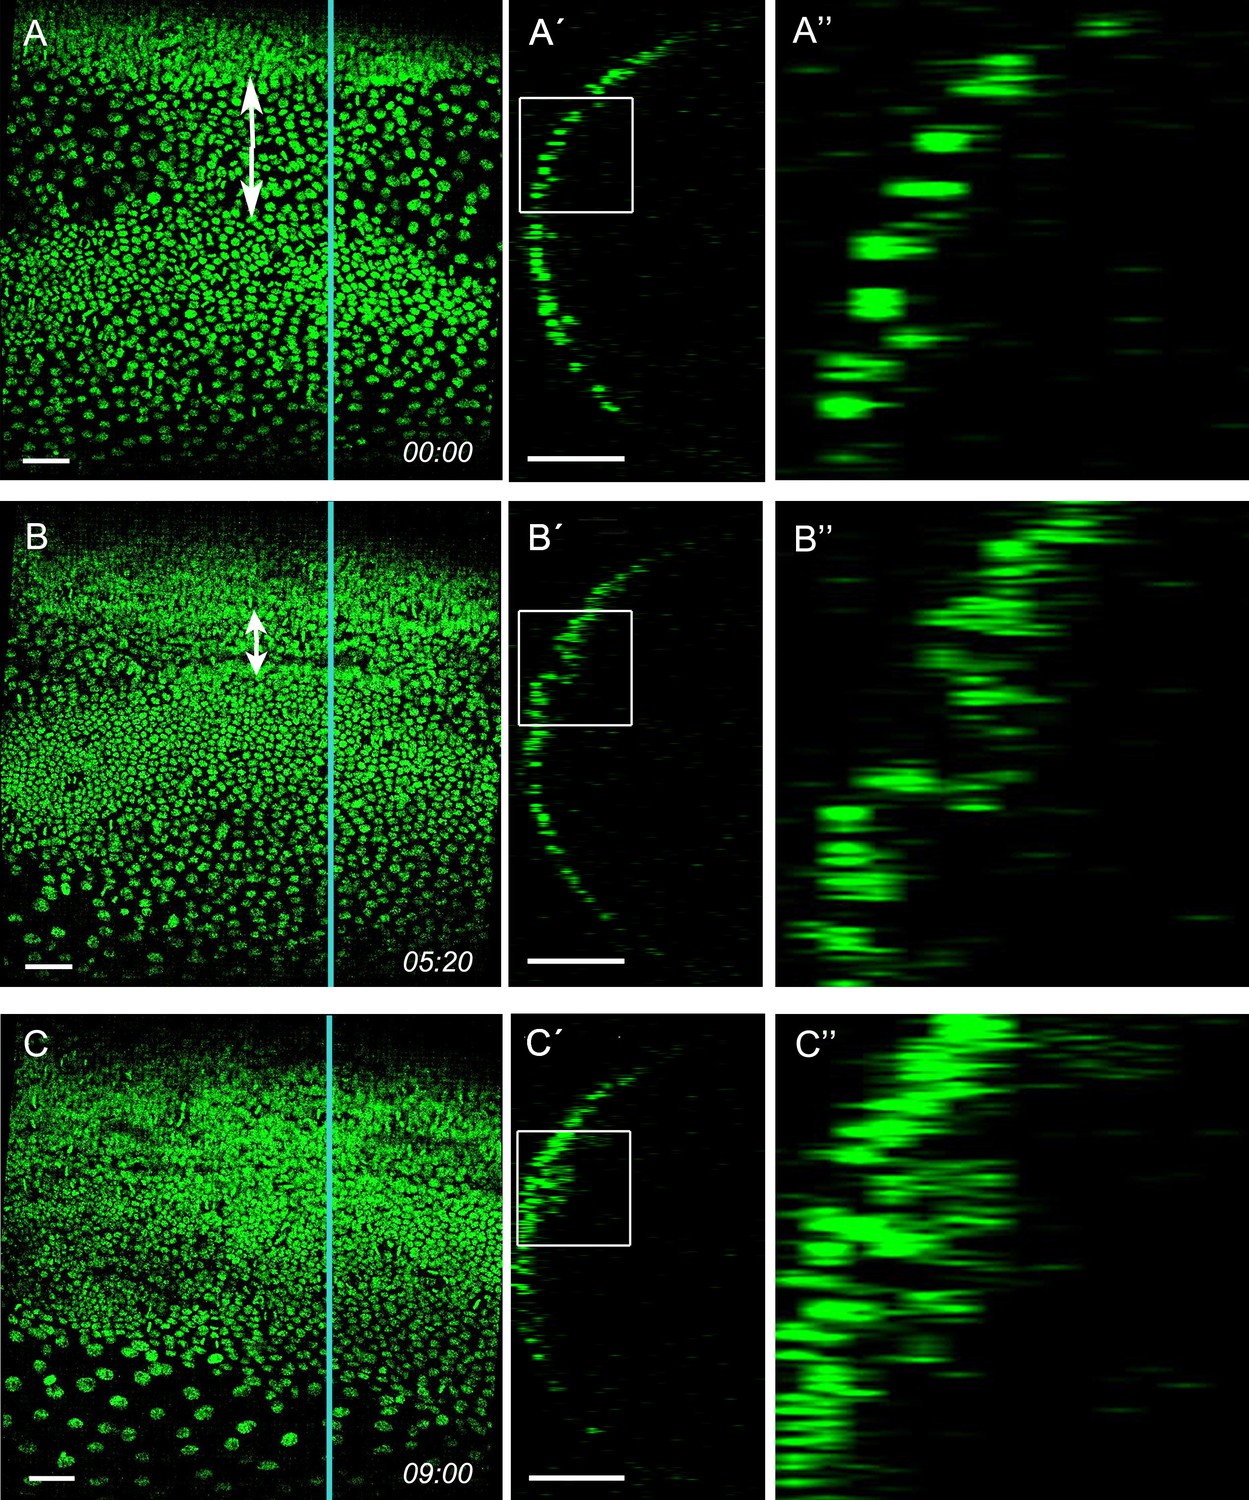
Mesoderm internalisation stills from Video 1.
Ventral surface view and z-sections of embryo carrying a pXLBGact Histone2B:eGFP transgene. (A) Early germ anlagen condensation (ES 2.3). (B) Mid germ anlagen condensation (ES 2.4–2.5). (C) Late germ anlagen condensation (ES 2.6). (A'-C') The z-sections show that cells positioned between the lateral plates of high cell density become internalised as the plates move ventrally. (A''-C'') Enlarged views of the regions marked by white squares in (A'-C'). Staging according to Donoughe and Extavour, 2016; Sarashina et al., 2005.
Figure 4—figure supplement 2
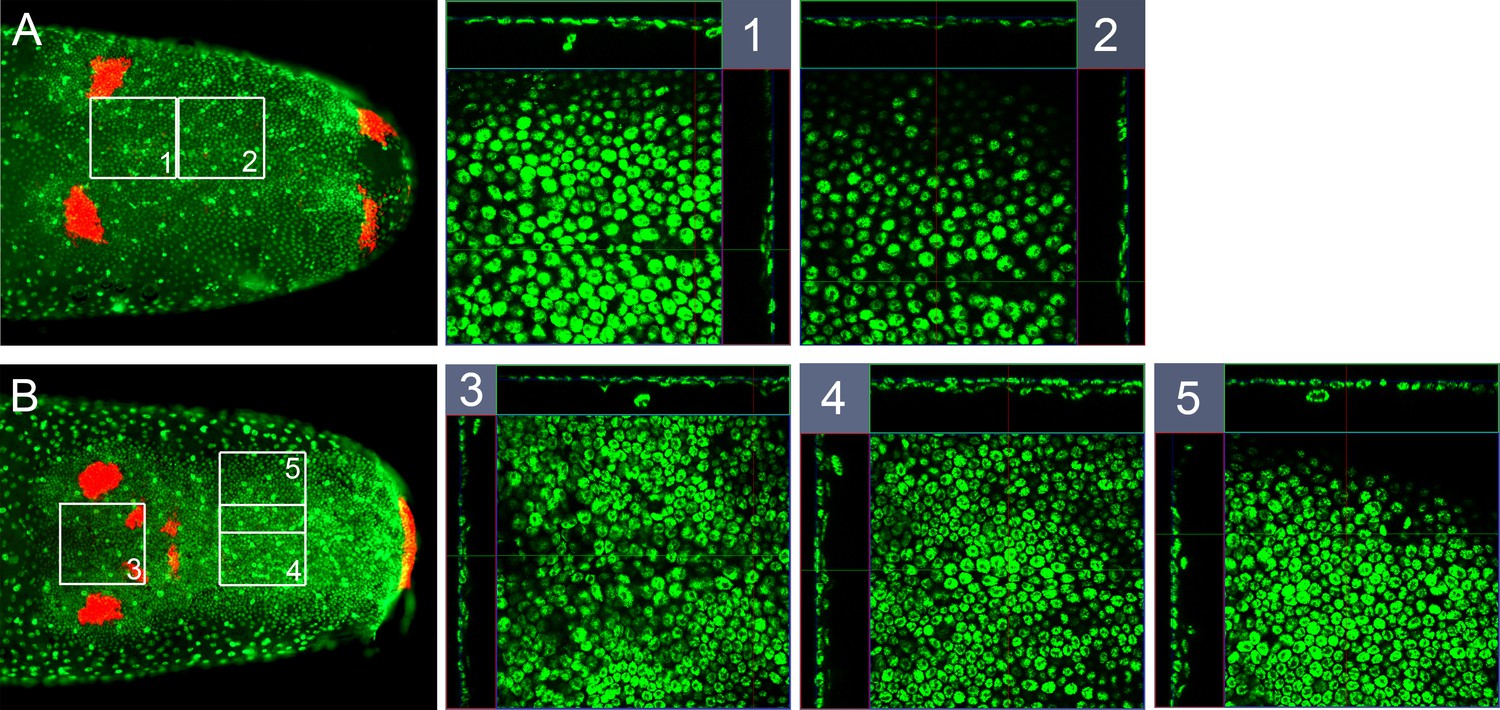
Mesoderm in early germ band embryos.
Whole-mount ISH for Gb-wg and DNA staining (Sytox) showing ventral surface views of the posterior 30% of embryos and z-sections at indicated positions (A) shortly after ventral fusion of the lateral plates (early ES 3.0, only ocular and posterior Gb-wg domains) and (B) at early germ band elongation (late ES 3.0, additional antennal and mandibular Gb-wg stripes). The white squares numbered 1-5 are shown enlarged with z-sections along corresponding white lines. In 1 and 2 a thin inner cell layer is visible in central regions of the germ band. In 4 and 5, the inner cell layer becomes more pronounced. Staging according to Donoughe and Extavour, 2016; Sarashina et al., 2005.
Figure 4—figure supplement 3
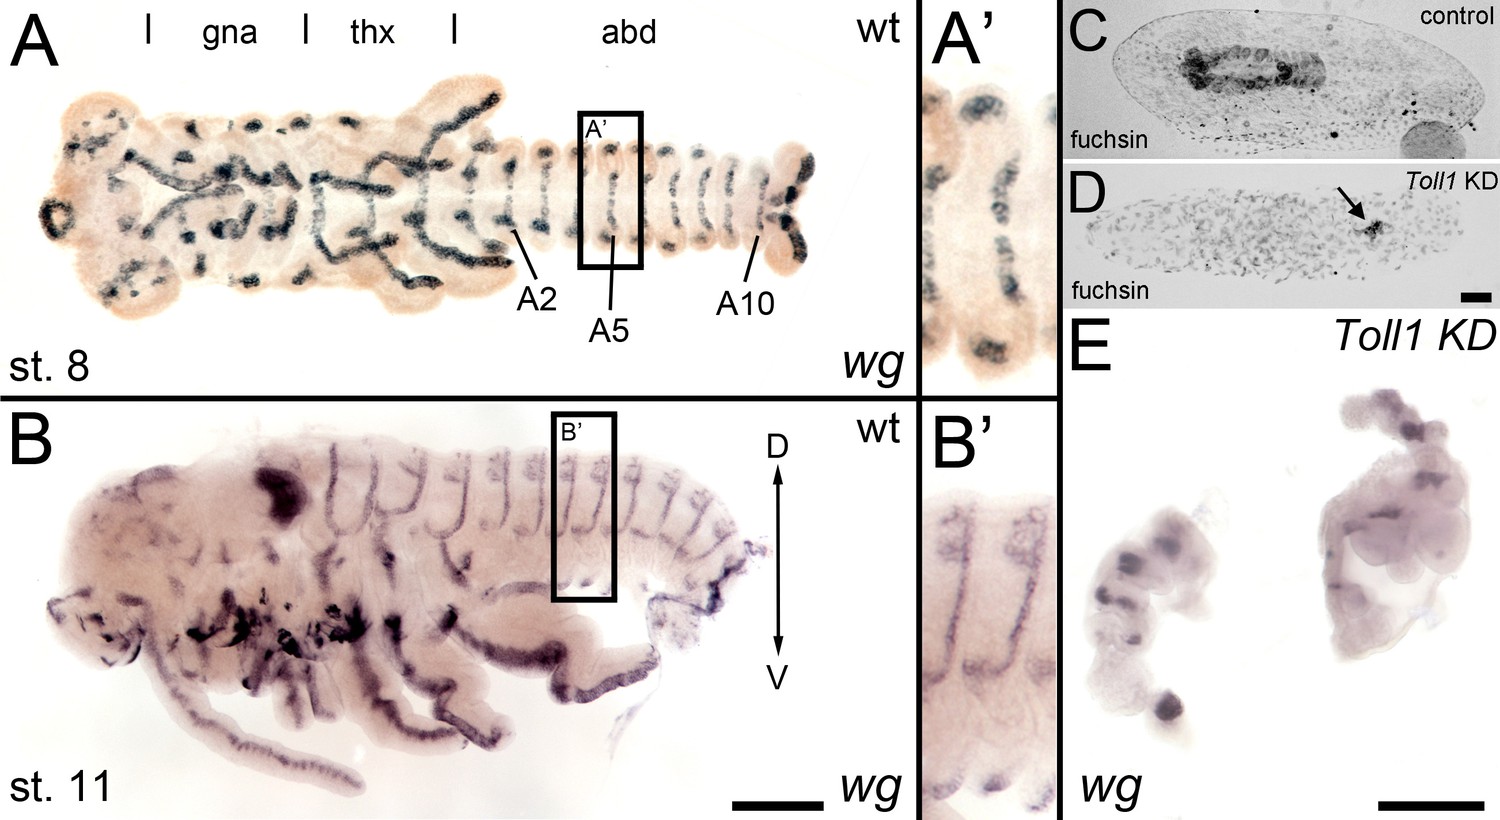
wingless expression in late Gb-Toll1 knockdown (KD) embryos.
Gb-wg expression in control embryos and Gb-Toll1 KD embryos. (A) Ventral view of ES 8 embryo. Different tagmata (gna: gnathal; thx: thorax; abd: abdomen) and abdominal segments 2, 5 and 10 (A2, A5, A10) are indicated. (A’) Gb-wg stripes are largely restricted to the ventral ectoderm. (B) Lateral view of ES 11 embryo. (B’) At this stage, Gb-wg becomes expressed in the dorsal ectoderm. (C) Fuchsin staining of control embryo after anatrepsis. The embryo has been internalised into the yolk. (D) Anatrepsis also occurs in Gb-Toll1 KD embryos (see Video 5); however, the embryo remains engulfed within the yolk. It consists of small tissue fragments (arrow), which express Gb-wg (E). As Gb-Toll1 KD embryos lack segmental Gb-wg expression prior to anatrepsis (Figure 8), we assume that the Gb-wg expression in late embryos corresponds to the dorsal ectodermal Gb-wg stripes of control embryos. Staging according to Donoughe and Extavour, 2016; Sarashina et al., 2005.
Figure 5
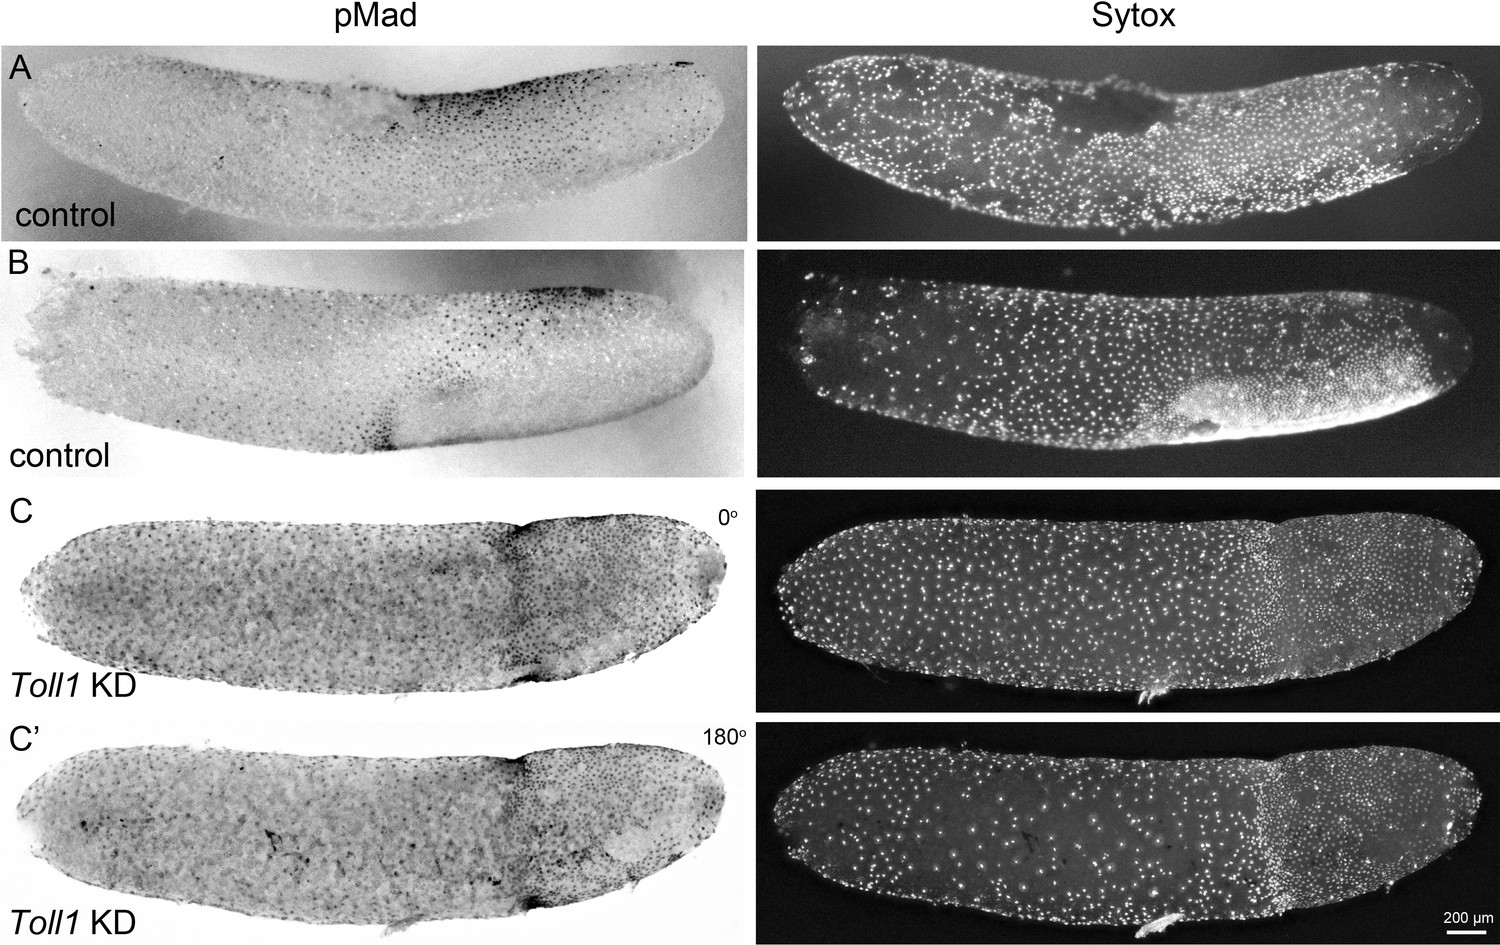
BMP pathway activity in early control and Gb-Toll1 pRNAi embryos.
Lateral surface views of embryos stained for phosphorylated Mad (pMad) and DNA (Sytox). The degree of nuclear accumulation of pMad indicates the strength of BMP signalling. (A) Control embryo at the beginning of germ anlage condensation (ES 2.0). Nuclear pMad forms a dorsal-to-ventral gradient between 20% and 60% egg length (0% is the posterior pole). (B) Control embryo at late germ anlage condensation (ES 2.6–3.0). Cells with high nuclear pMad levels surround the condensing germ anlage. (C) Gb-Toll1 knockdown embryo showing a radially symmetric distribution of nuclear pMad. The embryo is in a similar stage than the control embryo shown in (B). (C’) The embryo shown in (C) turned around by 180°. Staging according to Donoughe and Extavour, 2016; Sarashina et al., 2005.
Figure 6 with 1 supplement
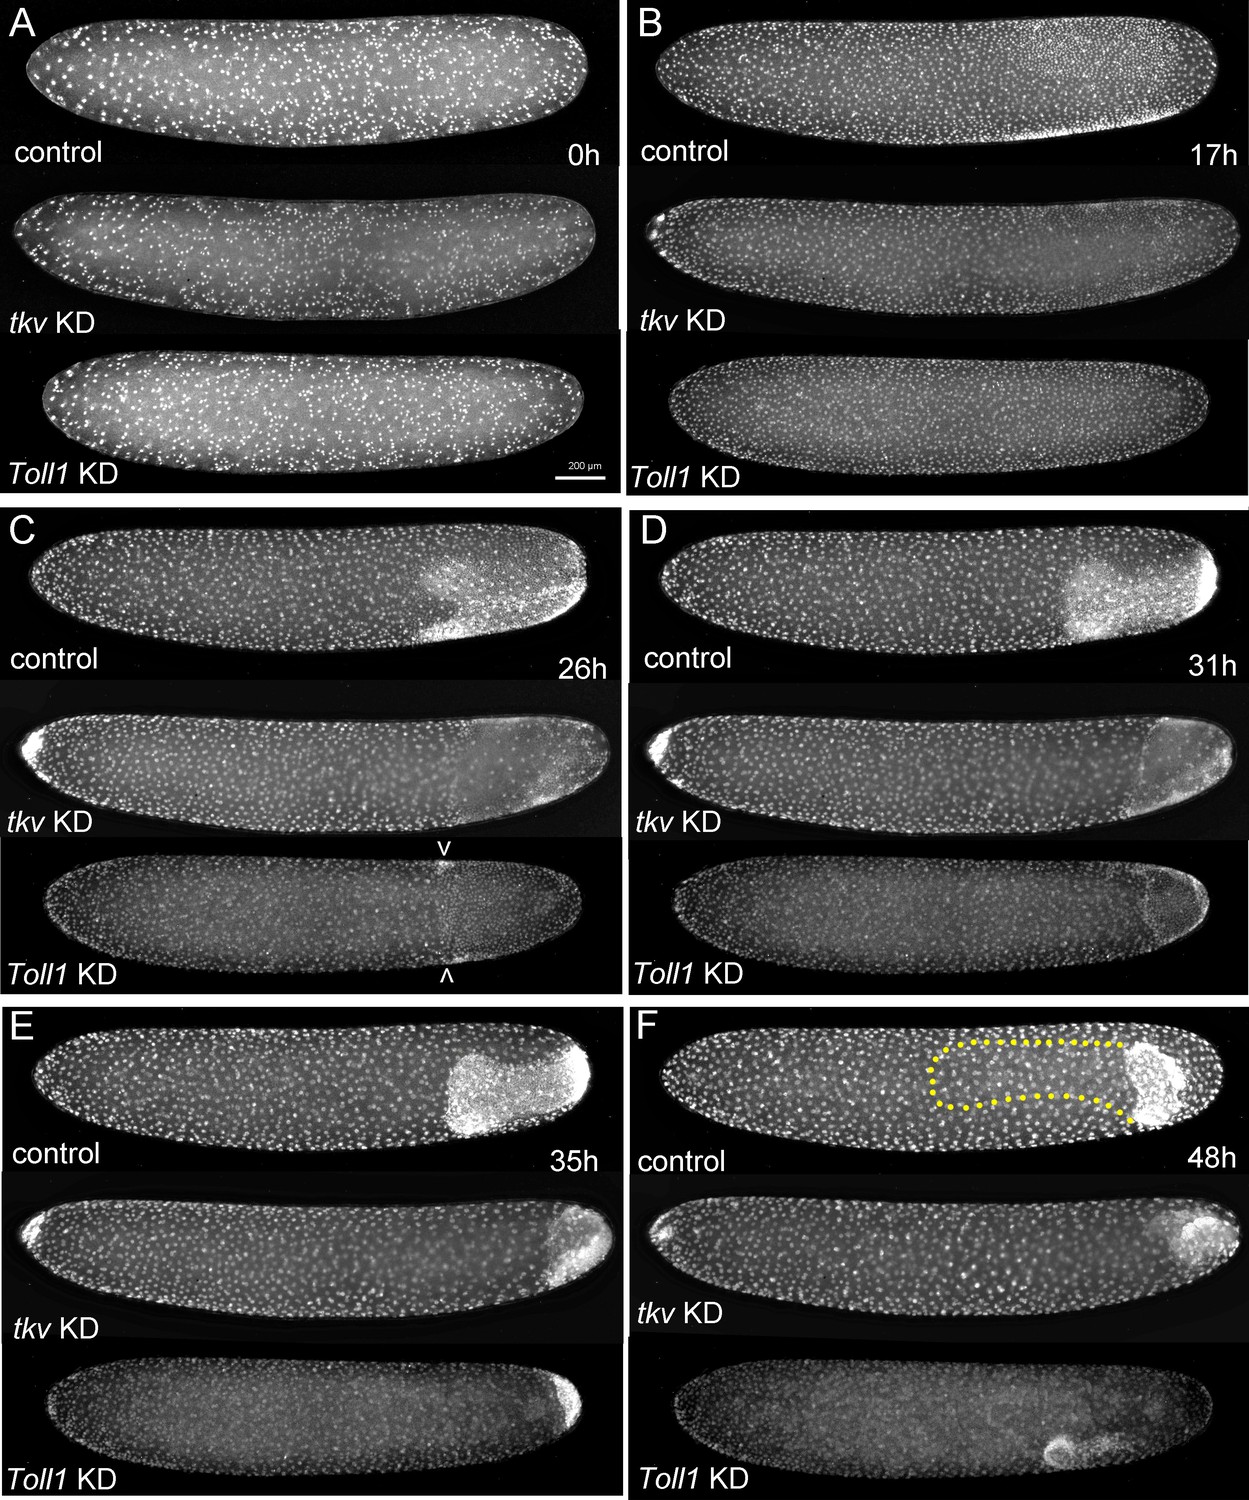
The development of Gryllus embryos lacking Toll or BMP signalling.
Stills from videos of embryos which express Histone2B:eGFP under an ubiquitously active promoter (pXLBGact Histone2B:eGFP) (Nakamura et al., 2010). Control embryos are compared to embryos of corresponding developmental stages resulting from pRNAi knockdown (KD) Gb-tkv or Gb-Toll1. (A) Uniform blastoderm (ES 1.6). (B) Early germ anlagen condensation (ES 2.2–2.3). (C) Late germ anlage condensation (ES 2.6). (D) Early germ band stage (ES 3.0). (E) Early germ band elongation (ES 4.0–4.3). (F) Early anatrepsis (ES 5.0). The position of the germ band of the control embryo is marked by a yellow dotted line. Staging according to Donoughe and Extavour, 2016; Sarashina et al., 2005.
Figure 6—figure supplement 1
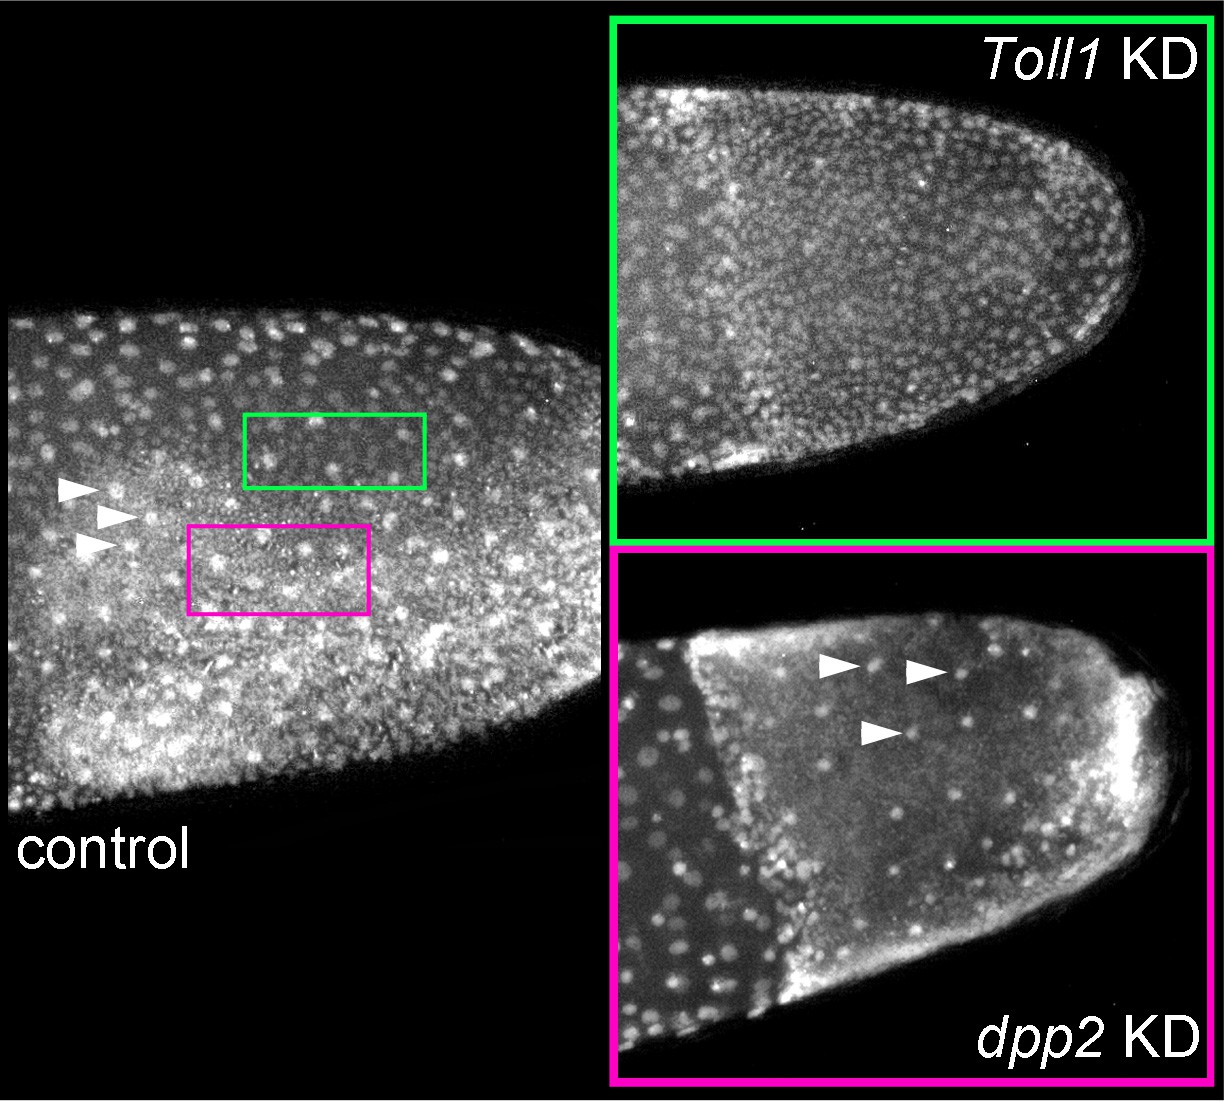
Cell densities in embryos lacking Toll or BMP signalling.
Stills from videos of pXLBGact Histone2B:eGFP embryos. Control and knockdown (KD) embryos are shown at corresponding stages (early germ band stage approximately ES 3.0). Regions of low (green) and high (pink) cell densities are demarcated in the control embryo. Arrowheads indicate yolk nuclei. The cell density of the germ band of Gb-Toll1 KD embryos corresponds to low cell density regions found at the dorsal margin of the germ band in control embryos (green). The cell density of the outer layer of the germ band of Gb-dpp2 KD embryos corresponds to high cell density regions found in ventral parts of germ band in control embryos (pink). Staging according to Donoughe and Extavour, 2016; Sarashina et al., 2005.
Figure 7 with 4 supplements
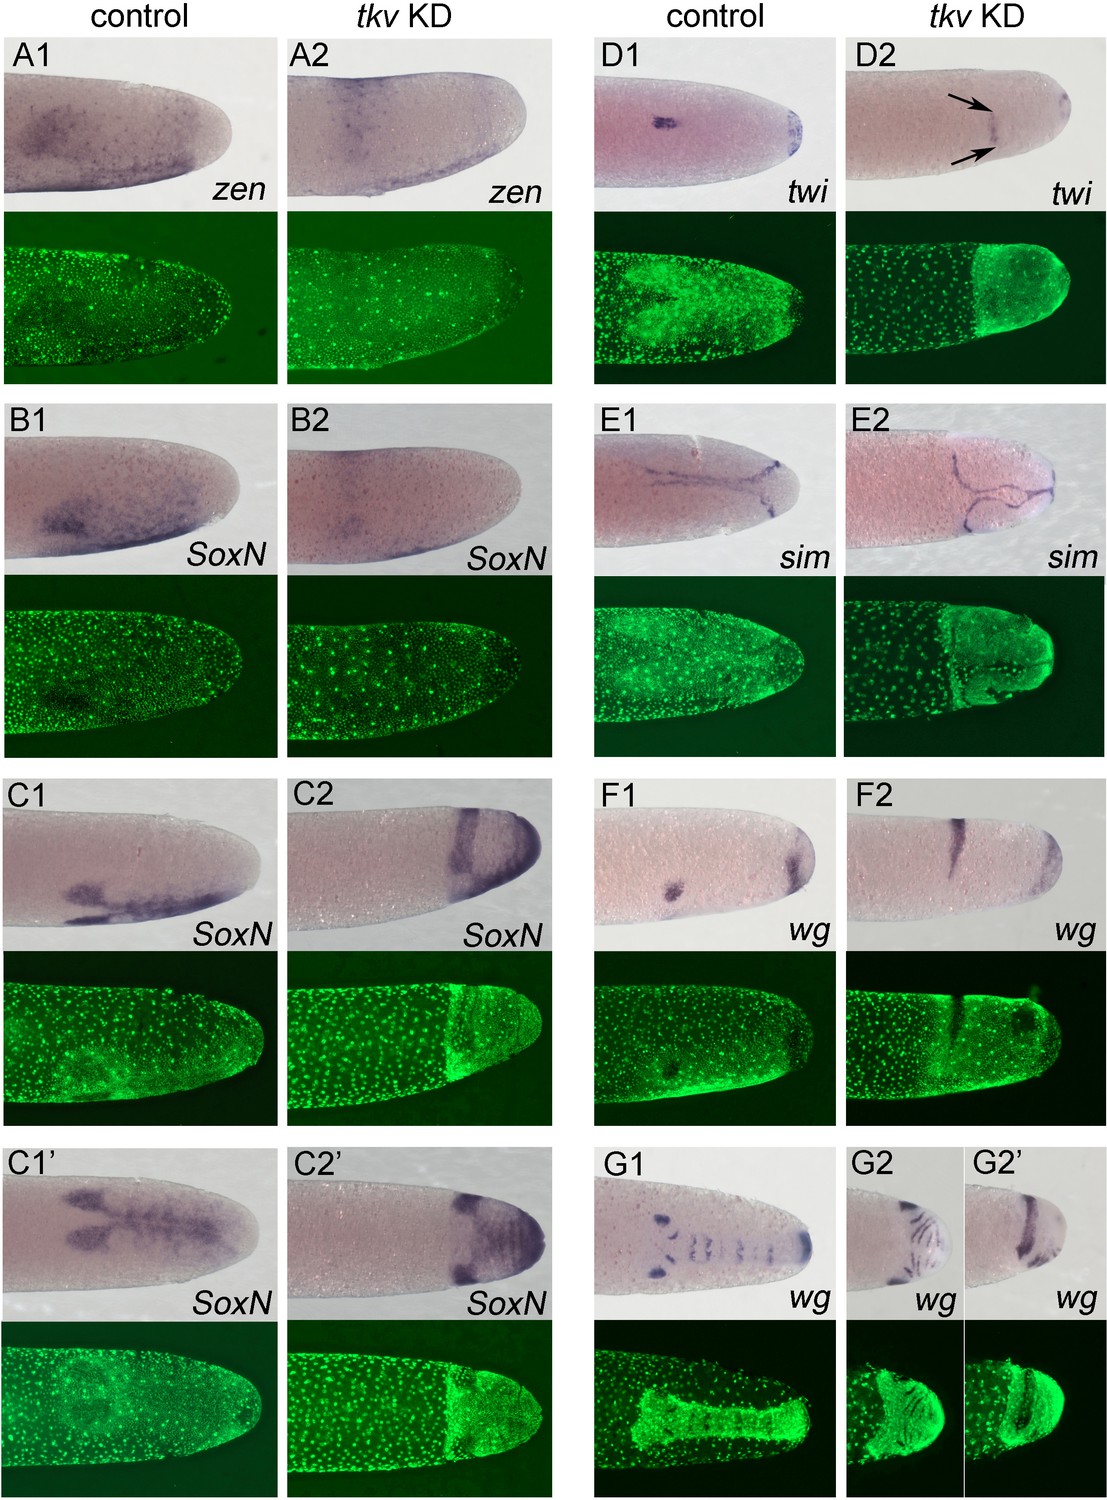
Altered dorsoventral (DV) fate map upon loss of BMP signalling.
Whole-mount ISH (purple) and DNA staining (green). Only the posterior part of each embryo harbouring the germ anlage is shown. (A1–G1) Control embryos. (A2–G2) Gb-tkv knockdown (KD) (pRNAi) embryos. (A1, A2) Lateral surface views of embryos at late germ anlage condensation showing Gb-zen expression (ES 2.4–2.5). (B1, B2) Lateral surface views of embryos at late germ anlage condensation showing Gb-SoxN expression (ES 2.4–2.5). (C1, C2) Lateral and (C1’, C2’) ventral surface views of embryos at early elongating germ band stages (ES 4) showing Gb-SoxN expression. (D1, D2) Ventral surface views of embryos at early germ band stages (ES 3.0) showing Gb-twi expression. Two black arrows mark the extent of Gb-twi expression upon Gb-tkv KD. (E1, E2) Ventral surface views of embryos at early germ band stages (ES 3.0) showing Gb-sim expression. (F1, F2) Lateral surface views of embryos at late germ anlage condensation showing Gb-wg expression (ES 2.4–2.5). (G1, G2) Ventral surface views of embryos after formation of segment T3 (ES 4.3) showing Gb-wg expression. (G2’) Lateral surface view of the Gb-tkv KD embryo shown in (G2). Staging according to Donoughe and Extavour, 2016; Sarashina et al., 2005.
Figure 7—figure supplement 1

Comparison of dorsoventral fate map shifts after Gb-tkv, Gb-dpp2 and Gb-gbb knockdown.
Whole-mount ISH (purple) for Gb-SoxN and DNA staining (Sytox, green). (A–C) Early germ anlage condensation (ES 2.2–2.3). (D–F) Late germ anlage condensation to early germ band (ES 2.4–3.0). Staging according to Donoughe and Extavour, 2016; Sarashina et al., 2005.
Figure 7—figure supplement 2
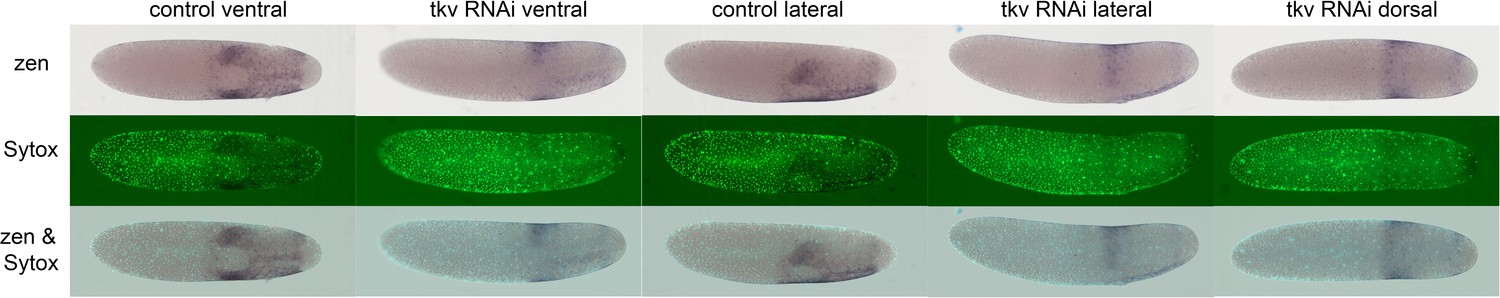
Gb-zen expression upon Gb-tkv knockdown (KD).
Whole-mount ISH (purple) for Gb-zen, DNA staining (Sytox, green) and overlay of control and Gb-tkv KD embryos at late germ anlage condensation (ES 2.4–2.6). Ventral surface views show that the ventral expression domain of Gb-zen is not expanded upon Gb-tkv KD. In contrast, the head expression domain expands evenly to the dorsal side as seen by lateral and dorsal surface views. Staging according to Donoughe and Extavour, 2016; Sarashina et al., 2005.
Figure 7—figure supplement 3
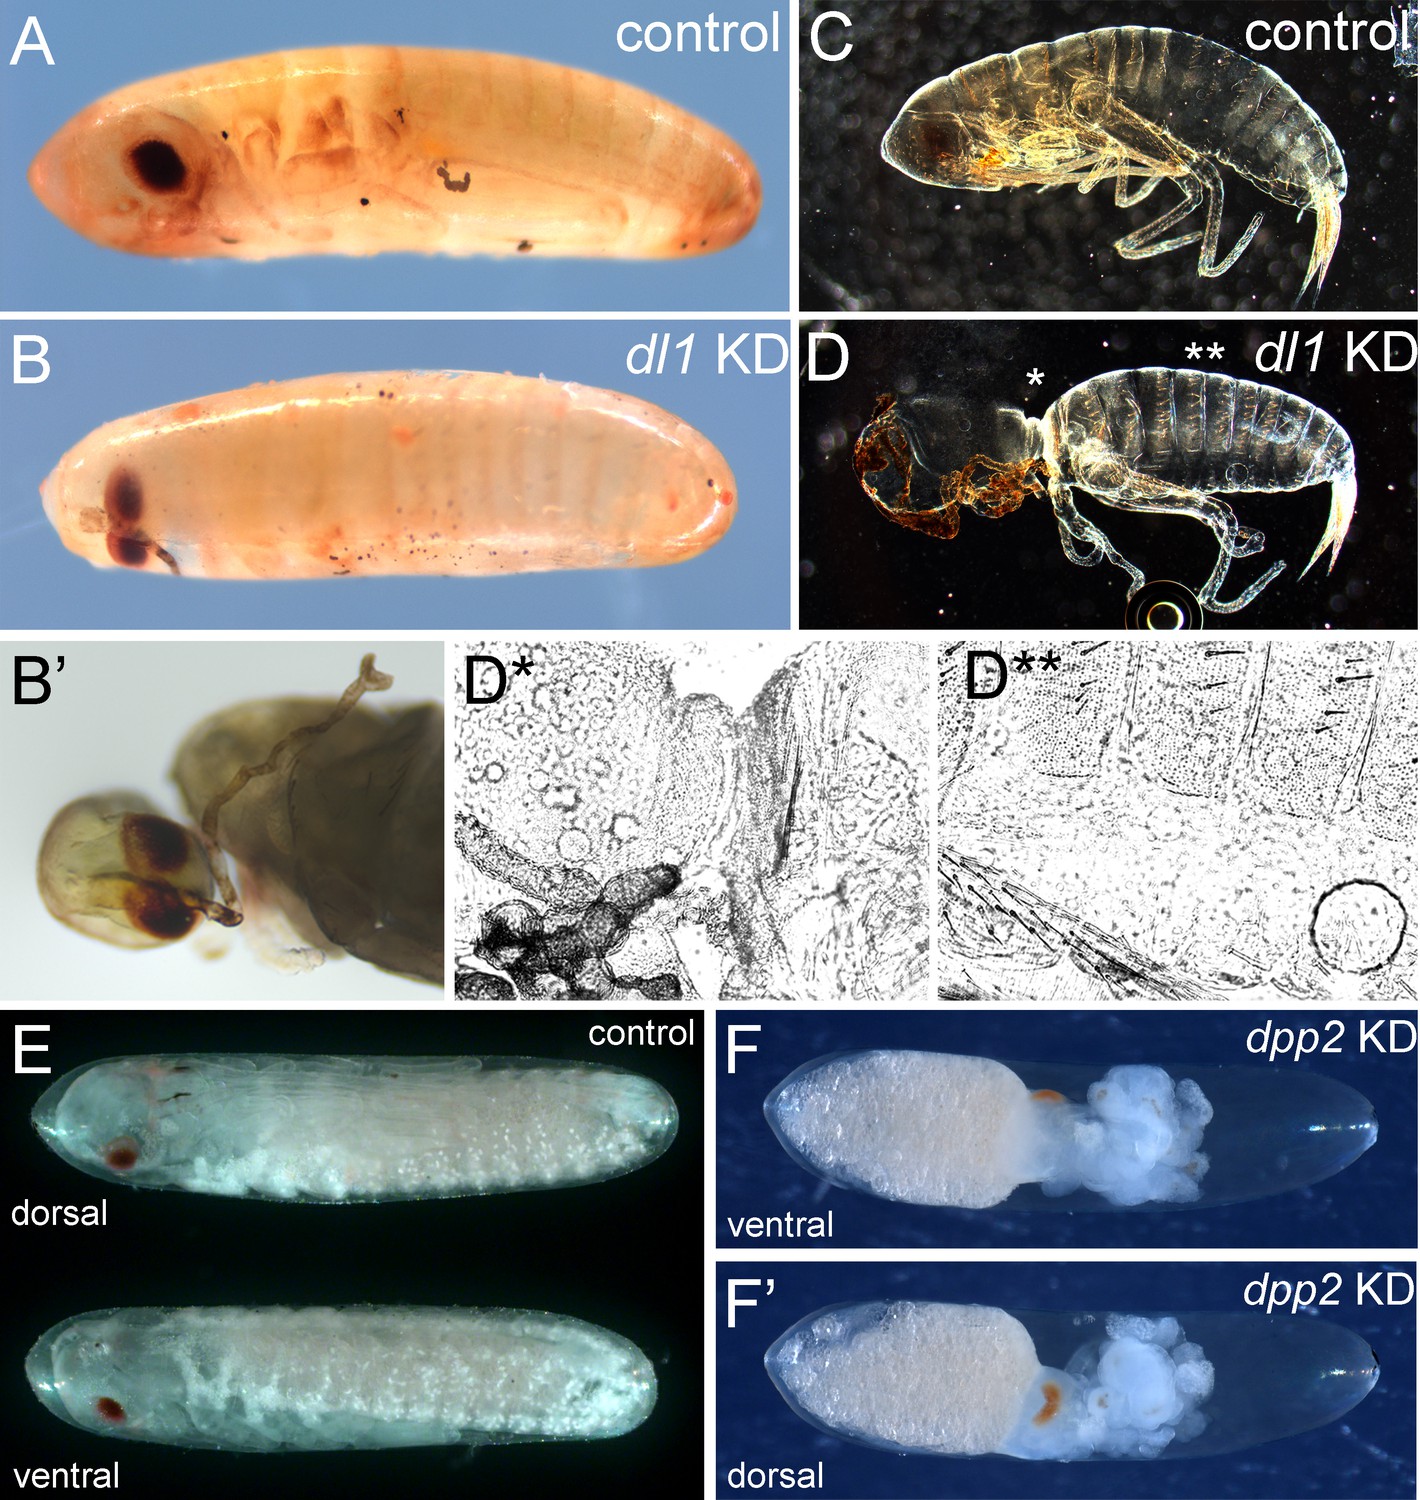
Late phenotypes produced by interfering with Toll and BMP signalling.
(A, B) Bright field micrograph of control (A) and Gb-dl1 knockdown (KD) (B, B’) embryo at egg stage 22. The ventral fusion of eyes and probably also of the antennae indicates a weak dorsalisation (i.e. a loss of ventral tissue compensated by expansion of dorsal tissue). (C, D) Dark field micrograph of control (C) and Gb-dl1 KD (D) larvae after completion of embryonic development. (D*, D**) Phase-contrast micrographs of positions indicated in (D) reveal that the constricted region is composed of cuticle with dorsal identity. (E) Ventral and dorsal views of control embryo at egg stage 20. (F, F’) Ventral and dorsal views of Gb-dpp2 KD. The presence of anterior appendages (Figure S22) demonstrates ventrolateral tissue specification. Therefore, we assume that the eyes are fused at the dorsal side, indicating a ventralisation (i.e. loss of dorsal tissue compensated by expansion of ventral tissue). Staging according to Donoughe and Extavour, 2016.
Figure 7—figure supplement 4
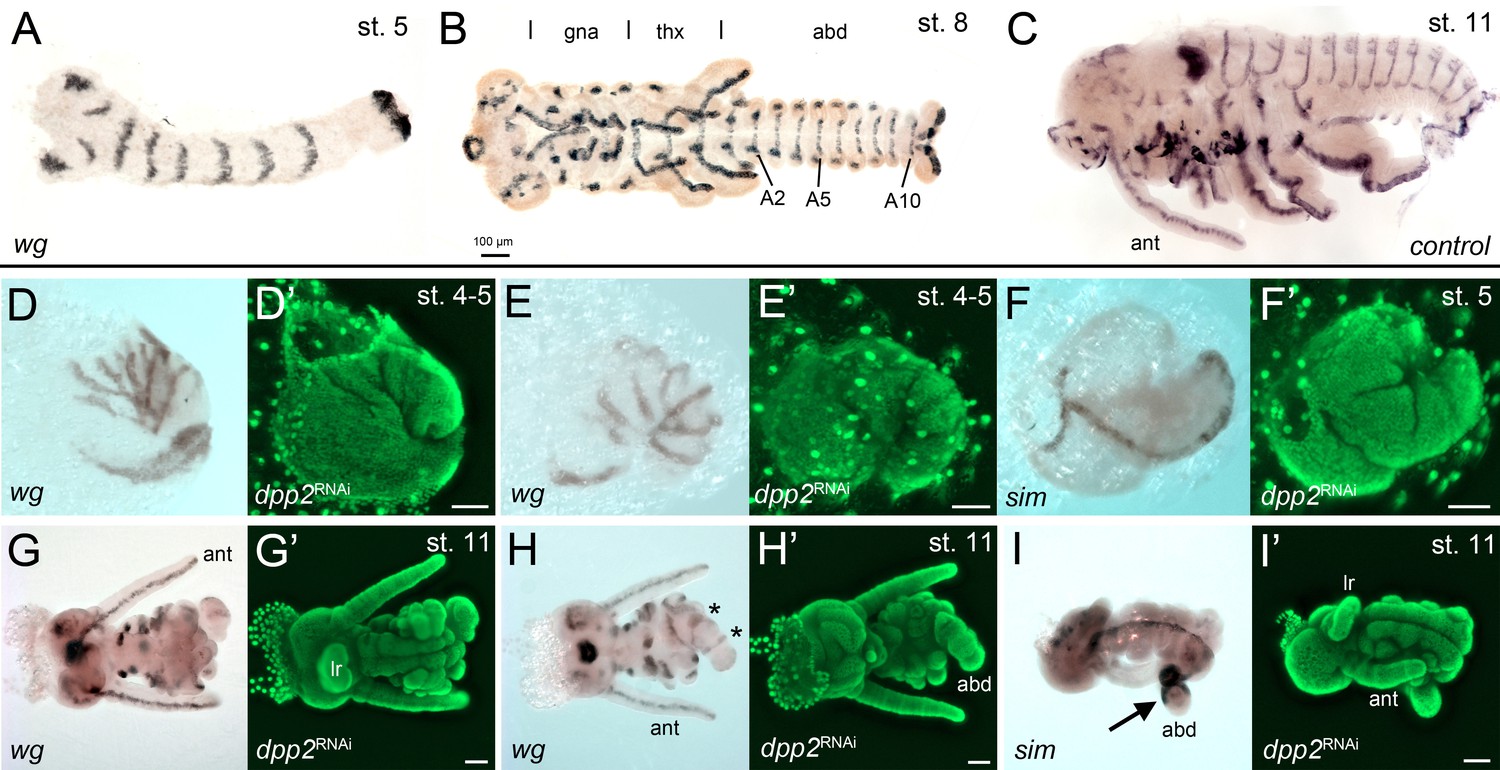
The development of Gb-dpp2 knockdown (KD) embryos.
(A–C) Gb-wingless expression in control embryos at different developmental stages. The different tagmata (gna: gnathal; thx: thorax; abd: abdomen) and abdominal segments 2, 5 and 10 (A2, A5, A10) are indicated in (B). (D, E) Posteriorly condensed Gb-dpp2 KD embryos show irregular Gb-wg stripes (compare to A). However, seven stripes can be distinguished, suggesting that segmentation occurred in the head and thoracic region. (F) Although the morphology of the early embryos was strongly altered, ventral midline expression of Gb-sim was present. (G, H) Ventral (G) and dorsal (H) regions of ES 11 KD embryo. Regular wg expression is visible in the antennae (ant) and the labrum (lr). The asterisk in (H) marks the remaining segments in the tube-like abdomen. Abdominal segment number and gnathal and thoracic appendages were strongly reduced. (I, I’) Gb-sim expression in ES 11 KD embryo. The remaining tube-like abdominal segments are strongly marked by Gb-sim expression (arrow in I). (D'-I') Corresponding DNA staining (Sytox green). Staging according to Donoughe and Extavour, 2016; Sarashina et al., 2005.
Figure 8
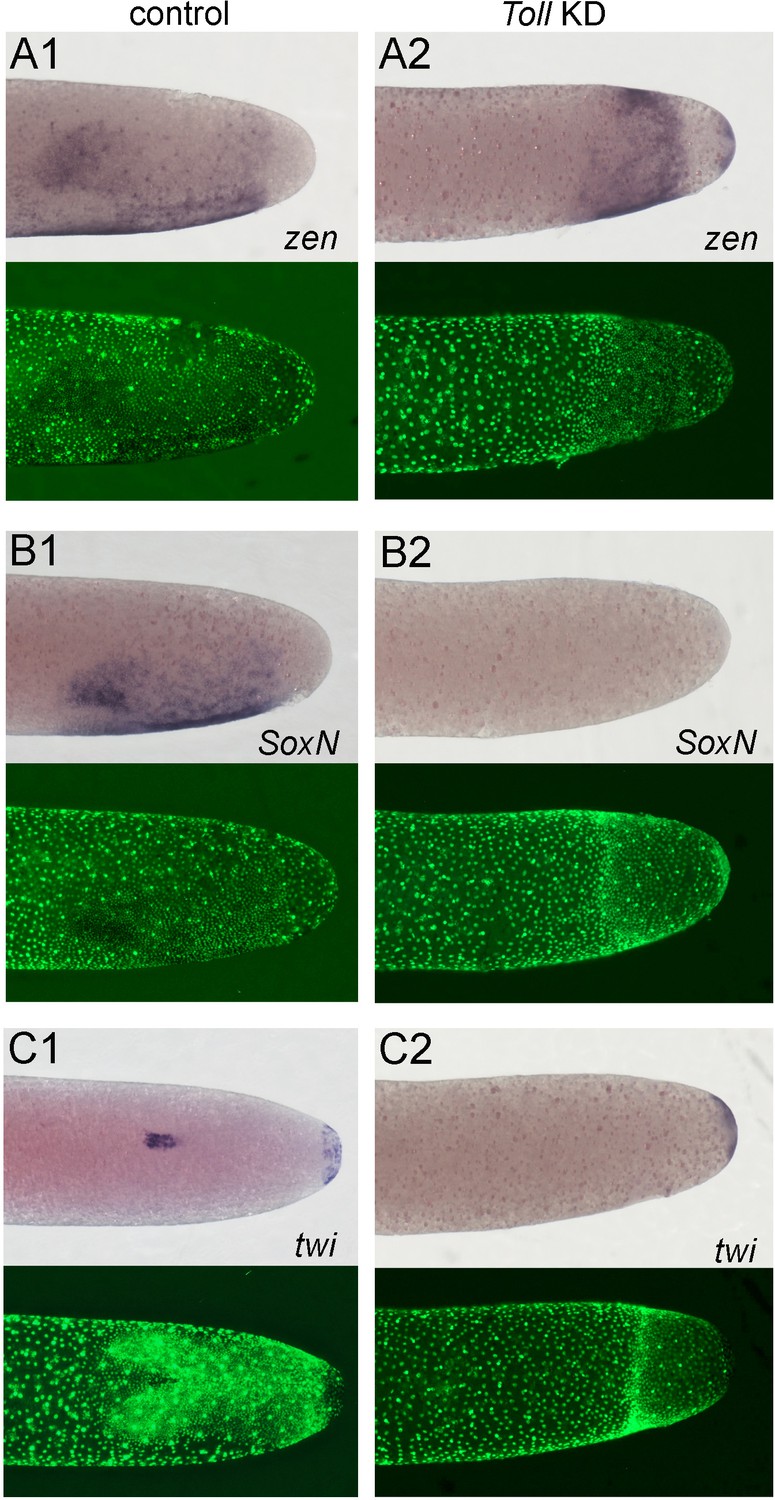
Altered dorsoventral (DV) fate map of early embryos lacking Toll signalling.
Whole-mount ISH (purple) and DNA staining (green). Only the posterior part of each embryo harbouring the germ anlage is shown. (A1–C1) Control embryos. (A2–C2) Gb-Toll1 knockdown (KD) (pRNAi) embryos. (A1, A2) Lateral surface views of embryos at late germ anlage condensation showing Gb-zen expression (ES 2.4–2.5). (B1, B2) Lateral surface views of embryos at late germ anlage condensation showing Gb-SoxN expression (ES 2.4–2.5). (C1, C2) Ventral surface views of embryos at early germ band stages (ES 3.0) showing Gb-twi expression. Staging according to Donoughe and Extavour, 2016; Sarashina et al., 2005.
Figure 9 with 2 supplements
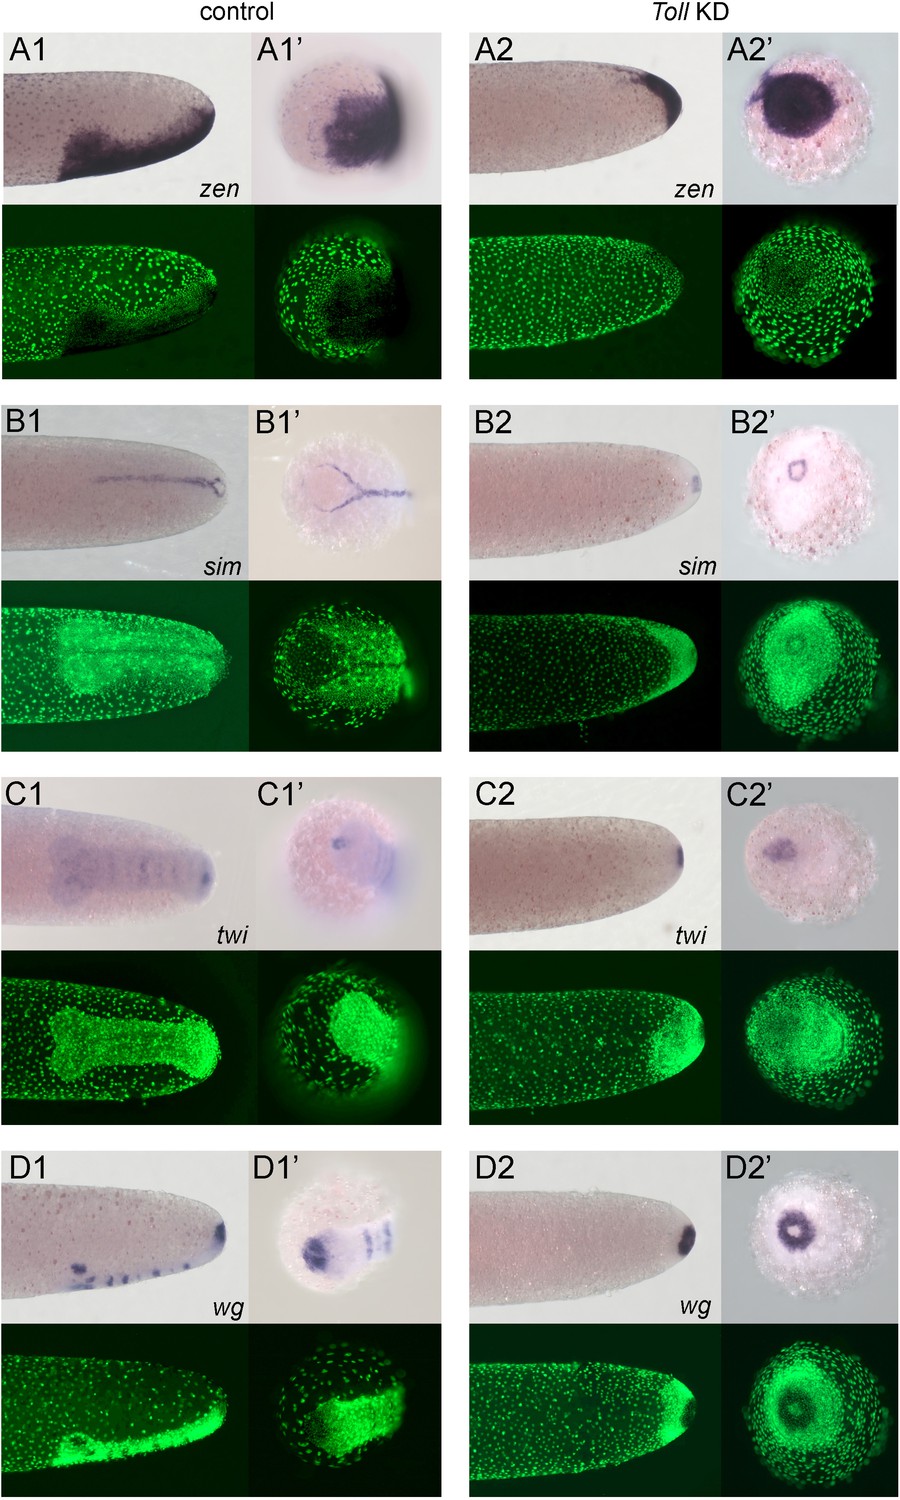
Embryos lacking Toll signalling are rotationally symmetric.
Whole-mount ISH (purple) for indicated genes and DNA staining (green). (A1–D1, A2–D2) Posterior 40% of embryos at early germ band stages (ES 4.0–4.3). (A1’–D1’, A2'–D2') Surface view of the posterior pole of embryos shown in (A1–D1, A2–D2). (A1–D1) Control embryos. (A2–D2) Gb-Toll1 knockdown (pRNAi) embryos. (A1, A2) Lateral surface views of embryos showing Gb-zen expression. (B1, B2) Ventral surface views of embryos showing Gb-sim expression. (C1, C2) Ventral surface views of embryos showing Gb-twi expression. (D1, D2) Lateral surface views of embryos showing Gb-wg expression. Staging according to Donoughe and Extavour, 2016; Sarashina et al., 2005.
Figure 9—figure supplement 1

The strong phenotype of Gb-dl1 knockdown (KD).
(A, B) Stills from videos of pXLBGact Histone2B:eGFP embryos. (A) Control embryo at early germ band elongation. (B) GB-dl1 KD embryo at corresponding stage. The embryo is rotationally symmetric lacking dorsoventral (DV) polarity. (C) The terminally differentiated KD embryo shows the contraction of the serosa from anterior and posterior poles, which is typical for lack of Toll signalling in Gryllus.
Figure 9—figure supplement 2
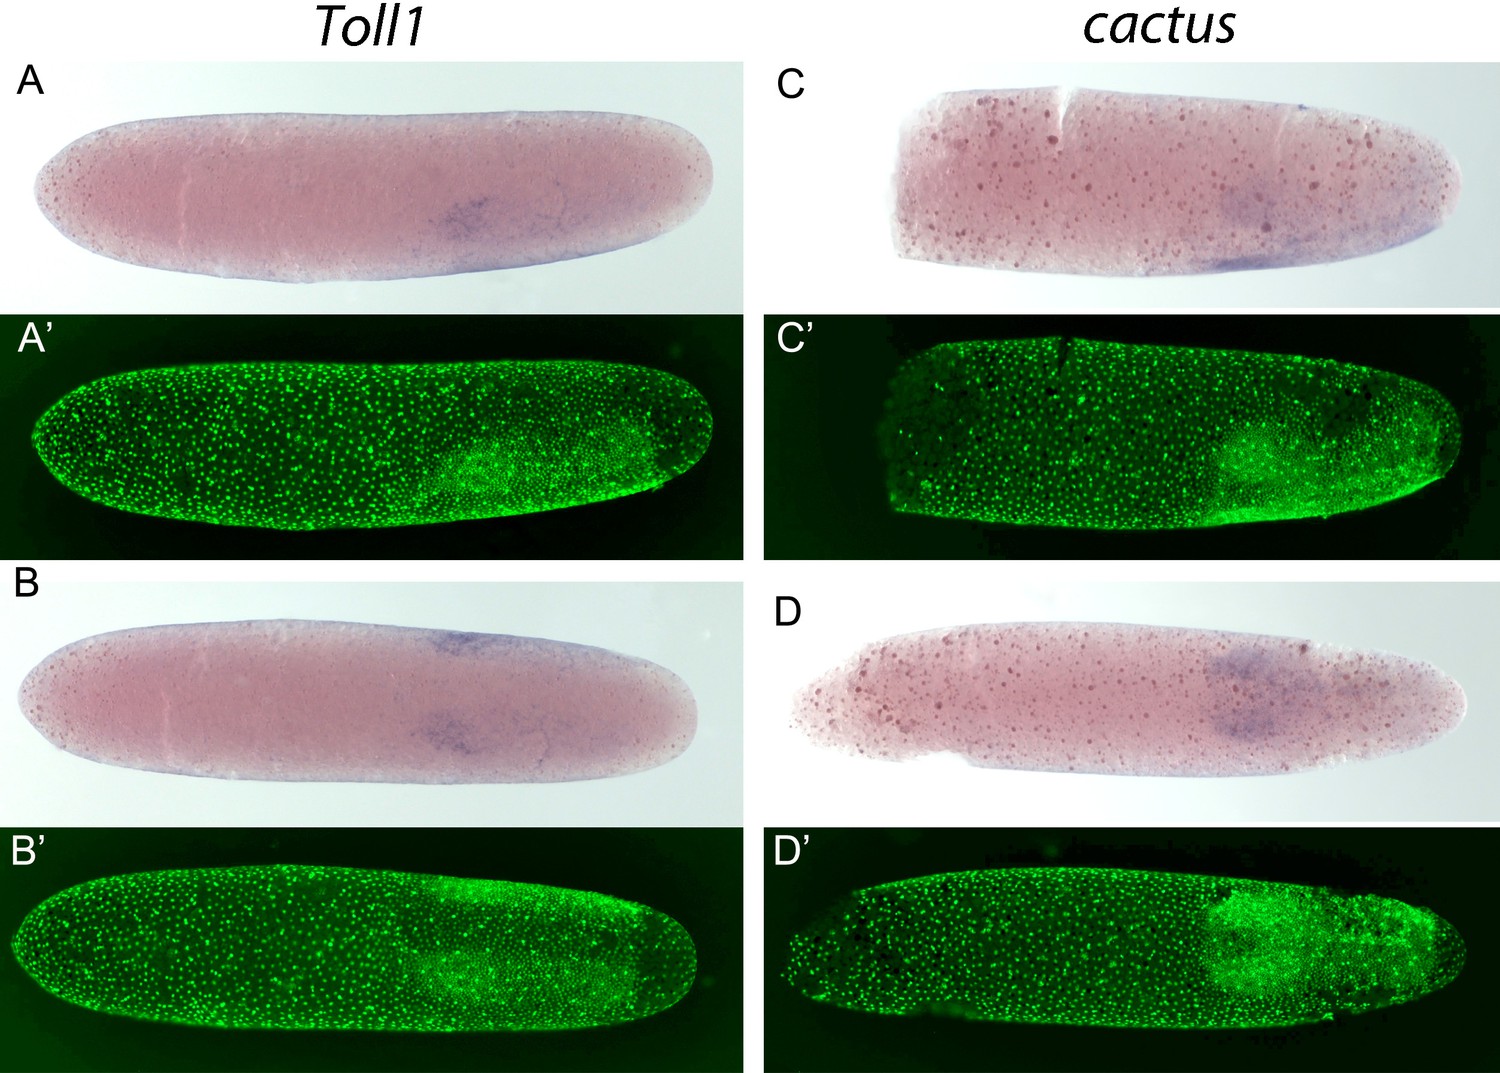
Expression of Gb-Toll1 and Gb-cactus.
(A-D) Gb-Toll1 and Gb-cactus ISH (blue) and (A'-D') corresponding DNA staining (Sytox, green). (A) Lateral view of embryo at late germ anlage condensation. (B) Ventral view of the embryo shown in (A). Gb-Toll1 is upregulated in the ectoderm with stronger expression in the head lobes. No expression in seen in the prospective mesoderm. In Tribolium, Toll1 expression is upregulated in ventral regions including the prospective mesoderm where the nuclear Dorsal/NF-kB protein levels are high, indicating positive feedback regulation between the Toll receptor and its downstream transcription factor. (C) Lateral view of embryo at late germ anlage condensation. (D) Ventral view of embryo after mesoderm internalisation. Gb-cact is expressed evenly in the embryonic anlage. In Tribolium, cactus is upregulated in the prospective mesoderm, indicating negative feedback regulation as Cactus prevents the nuclear transport of Dorsal/NF-kB protein.
Figure 10 with 1 supplement
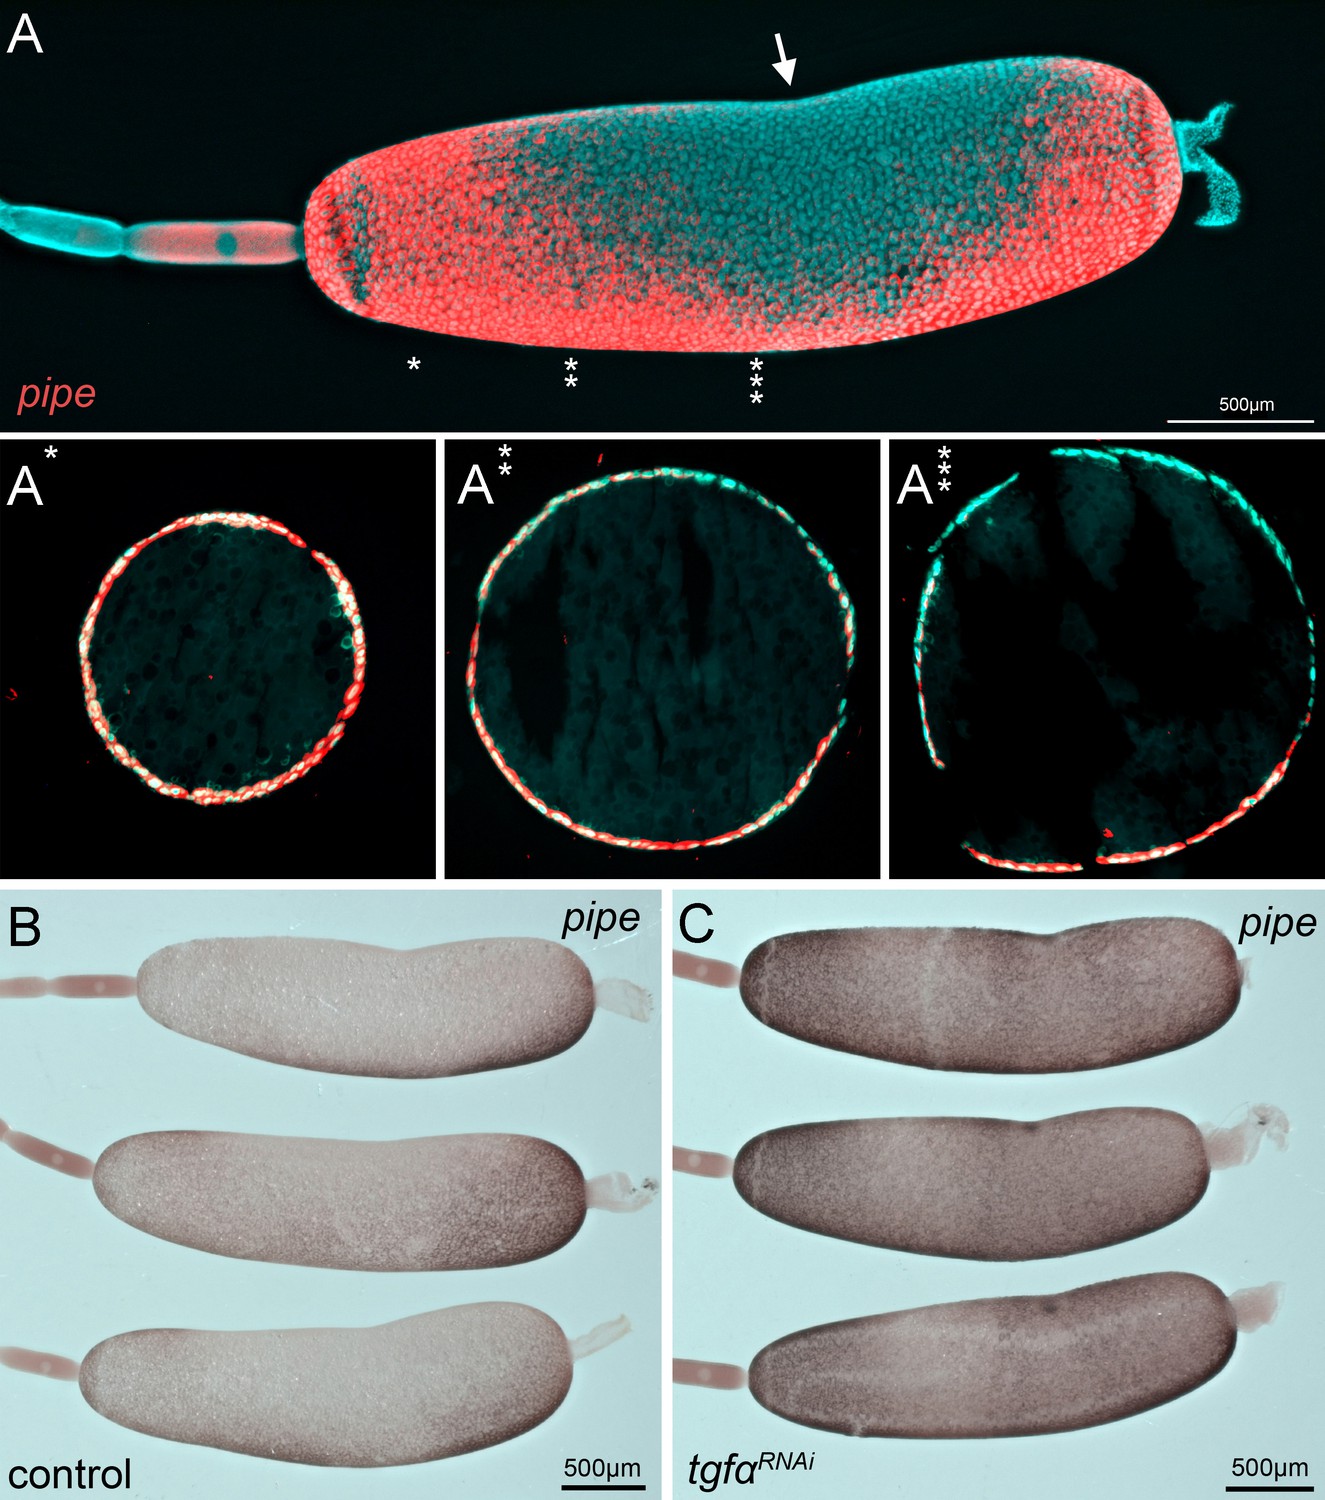
Gb-pipe expression in oocytes.
(A) A part of an ovariole of Gryllus bimaculatus showing the expression of Gb-pipe at the final stages of oogenesis. Gb-pipe is expressed in a ventral-to-dorsal gradient within the follicle cells of the late oocyte. In Gryllus, the kink within the oocyte (arrow in A) is an indicator for the position of the oocyte nucleus. (A*–A***) Transverse sections of the oocyte at the indicated positions (see * in A). Images are false-colour overlays of in situ hybridisation images. (B, C) Gb-pipe expression in control (B) and Gb-Tgfα RNAi (C) oocytes. In Gb-Tgfα RNAi oocytes, Gb-pipe is no longer repressed from dorsal follicle cells.
Figure 10—figure supplement 1
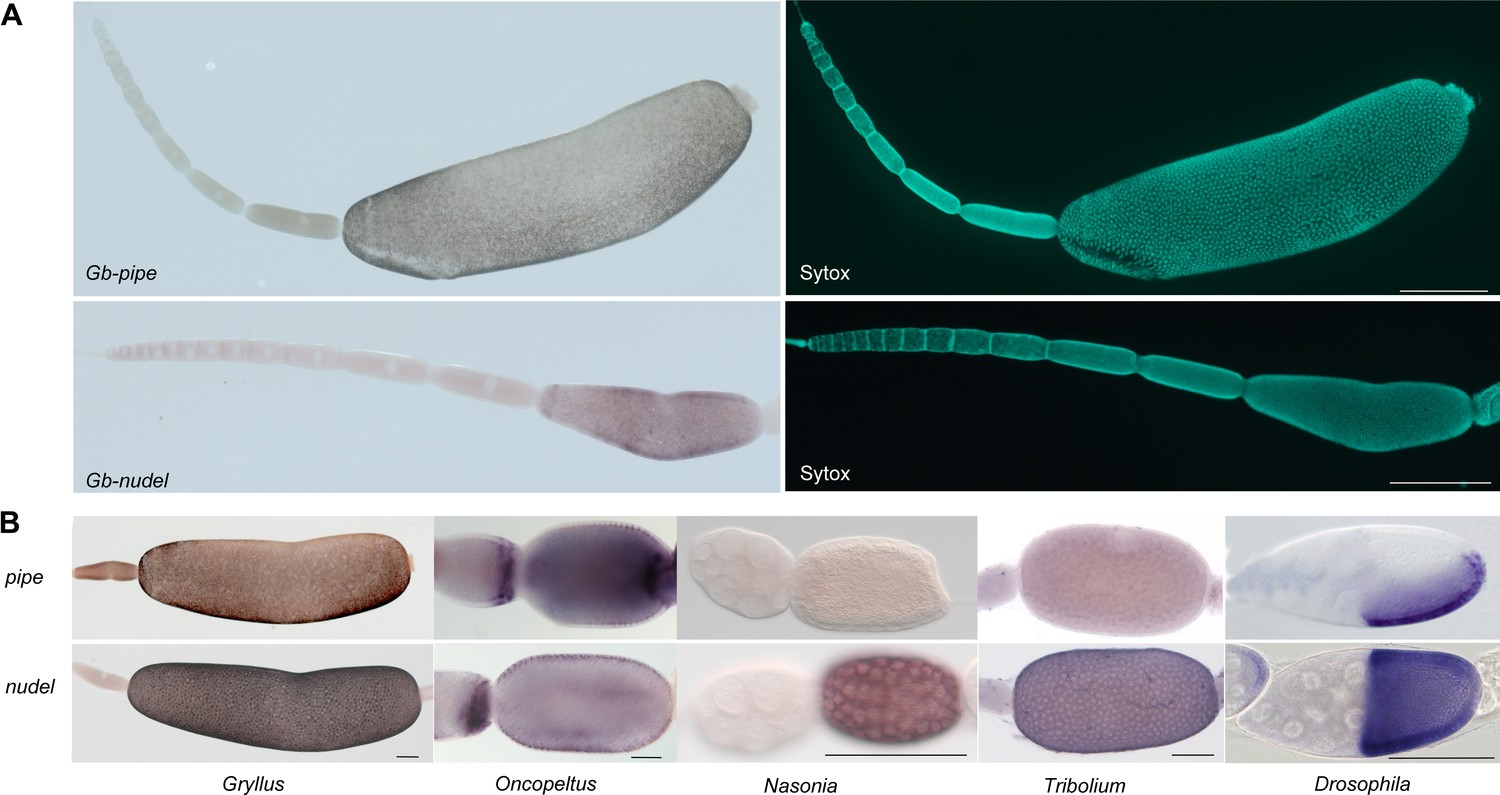
Follicle cell expression of pipe and nudel in different insects.
(A) Gb-pipe and Gb-nudel ISH and DNA staining (Sytox) in Gryllus ovarioles. The anterior tip with the terminal filament and the germarium is pointing to the left side. Gb-nudel and Gb-pipe expression are detected in the follicular epithelium surrounding the oocyte after asymmetric positioning of the oocyte nucleus inducing a shape change in the follicular epithelium (Lynch et al., 2010). The scale bars correspond to 500 μm. (B) pipe and nudel ISH in egg chambers of the indicated insects. While uniform nudel expression was detected for all studied insects (Chen, 2015; Hong and Hashimoto, 1995), pipe was found to be expressed in follicle cells only in Drosophila (Sen et al., 1998), Oncopeltus (Chen, 2015) and Gryllus. A dorsal repression of pipe was only observed in Drosophila and Gryllus. The scale bars correspond to 500 µm in (A) and 100 μm in (B).
Figure 11
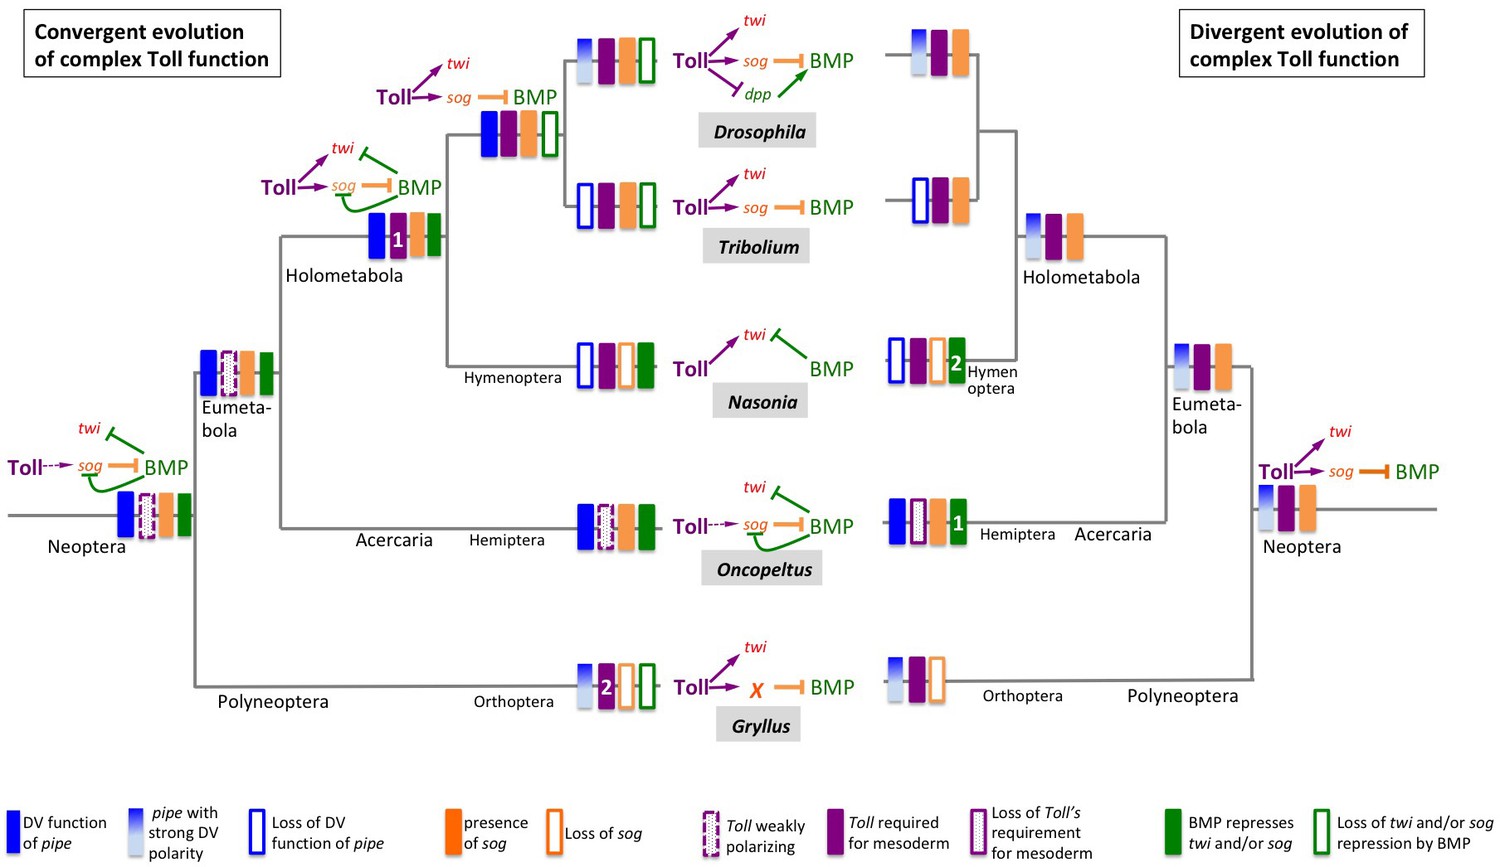
Two evolutionary scenarios for the role of Toll signalling in Gryllus.
Left: Toll gained its role for specifying ventral fates including the mesoderm by convergent evolution. Toll signalling in the Neopteran ancestor was weakly polarised by ovarian pipe expression and served as polarity cue for self-organising BMP signalling. Toll was not directly involved in mesoderm formation. This mode of dorsoventral (DV) patterning was maintained in the lineage leading to the Hemiptera. At the base of the Holometabola, a strict requirement of Toll for mesoderm formation emerged (1) while BMP remained to be involved in patterning ventral cell fates including the mesoderm. This situation was partially maintained in hymenoptera, like Nasonia. In the common ancestor of beetles and flies, the function of BMP signalling became restricted to the dorsal side while Toll patterned the ventral side in a BMP-independent manner. In flies, multiple parallel mechanisms evolved by which Toll restricts BMP signalling to the dorsal side, like the transcriptional repression of decapentaplegic (dpp), the gene coding the fly BMP2/4 homolog. In addition, ovarian pipe expression became spatially refined along the DV axis. In other holometabolan lineages (Tribolium, Nasonia), ovarian expression of pipe was lost and replaced by unknown mechanisms. The polyneopteran lineage leading to Gryllus represents another case (2) where Toll gained essential BMP-independent functions in specifying ventral fates including the mesoderm and in which ovarian pipe expression became spatially refined along the DV axis. However, in this lineage sog was lost and replaced by an unknown gene (or several genes) responsible for Toll-dependent BMP inhibition. Right: Toll possessed an essential role in specifying ventral fates already in the Neopteran ancestor. Expression of pipe was already strongly polarised along the DV egg chamber axis. This situation was maintained in the lineages leading to Drosophila and Gryllus. However, within the Gryllidae, sog was replaced by an unknown BMP inhibitor. In the linage leading to the Hemiptera, pipe expression lost spatial precision and Toll lost both spatial precision and its essential role for ventral cell fate specification. In Hemiptera (1) and Hymenoptera (2), BMP independently gained patterning functions for ventral cell fates. Ovarian expression of pipe was lost and replaced by unknown mechanisms in lineages leading to Nasonia and Tribolium.
Videos
Video 1
Early development of an embryo lacking BMP signalling (Gb-dpp2 knockdown [KD]).
Time-lapse imaging using the pXLBGact Histone2B:eGFP transgenic Gryllus line (Nakamura et al., 2010). The movie shows the development of a control and a Gb-dpp2 RNAi embryo from uniform blastoderm stage (egg stage 2; embryonic stage 1.5) until embryonic stage 5 (staging according to Donoughe and Extavour, 2016). The germ rudiment condenses ventrally in the control embryo (15–30 hr), the serosa closes over the embryo (35–40 hr) and anatrepsis takes place (40 hr onwards). The germ rudiment condenses towards the ventral-posterior in the Gb-dpp2 KD embryos and ectopic tissue folding is taking place (40 hr onwards). The eggs are oriented with the anterior pointing to the left and ventral down.
Video 2
Mesoderm internalisation.
Time-lapse imaging using the pXLBGact Histone2B:eGFP transgenic Gryllus line (Nakamura et al., 2010). Ventral surface views and z-sections from early to late gem anlage condensation (ES 2.2–ES2.6). Staging according to Donoughe and Extavour, 2016; Sarashina et al., 2005. The embryo is oriented with the anterior pointing to the left.
Video 3
Complete development of embryo lacking BMP signalling (Gb-tkv knockdown [KD]).
Six days of constant live imaging using the pXLBGact Histone2B:eGFP transgenic Gryllus line (Nakamura et al., 2010). The movie shows the development of a Gb-tkv RNAi embryo from uniform blastoderm stage (egg stage 2, staging according to Donoughe and Extavour, 2016) until embryonic stage 11. The malformed Gb-tkv RNAi embryo is released from the yolk and the serosa at the end of the movie (132 hr onwards). The egg is oriented with the anterior pointing to the left and ventral down.
Video 4
Early development of embryo lacking BMP signalling (Gb-dpp2 knockdown [KD]).
Time-lapse imaging using the pXLBGact Histone2B:eGFP transgenic Gryllus line (Nakamura et al., 2010). The movie shows the development of a Gb-dpp2 RNAi embryo from early germ anlage condensation (ES 2.2) until ES 5. The border between serosa and germ anlage lacks dorsoventral asymmetry. The germ anlage condenses symmetrically towards the posterior pole. Staging according to Donoughe and Extavour, 2016; Sarashina et al., 2005.
Video 5
Development of embryos lacking Toll signalling (Gb-Toll1 knockdown [KD]).
Time-lapse imaging using the pXLBGact Histone2B:eGFP transgenic Gryllus line (Nakamura et al., 2010). The movie shows the development of a control and three Gb-Toll1 RNAi embryos from uniform blastoderm stage (egg stage 2; embryonic stage 1.5) until embryonic stage 6–7 (staging according to Donoughe and Extavour, 2016). The germ rudiment condenses ventrally in the control embryo (10–30 hr), the serosa closes over the embryo (30–40 hr) and anatrepsis takes place (35 hr onwards). The germ rudiment condenses towards the posterior in the Gb-Toll1 KD embryos (20–35 hr). However, the posterior cap of cells sinks into the yolk during anatrepsis (35 hr onwards). The eggs are oriented with the anterior pointing to the left and ventral down.
Video 6
Complete development of embryos lacking Toll signalling (Gb-Toll1 knockdown [KD]).
Time-lapse imaging of a control and a Gb-Toll1 RNAi embryo from egg stage 8 onwards. The serosa detaches from the posterior pole in both embryos (starting at 20 hr). While the control embryo undergoes katatrepsis (starting at 53 hr), the serosa of the Gb-Toll1 RNAi embryo also detaches from the anterior (starting at 72 hr). This leads to a compaction of the yolk within the centre of the egg. This represents the strong phenotype that is observed after the KD of Gb-Toll1, Gb-dl1 and Gb-spz. Yolk is taken up into the gut in the control embryo (starting at 110 hr), and the movie ends at egg stage 19. Staging according to Donoughe and Extavour, 2016.
Tables
Table 1
Summary statistics: assembly.
| Number of Trinity transcripts | 328,616 |
|---|---|
| Number of Trinity 'genes' | 244,946 |
| Min contig length | 201 |
| Max contig length | 32,386 |
| Mean contig length | 916.01 |
| N50 contig length | 2134 |
| Number of contigs ≥ 1 kb | 69,081 |
| Number of contigs in N50 | 34,565 |
| Number of bases in all contigs | 301,016,284 |
| Number of bases in contigs ≥ 1 kb | 200,921,630 |
| GC content of contigs (%) | 39.72 |
Additional files
-
Supplementary file 1
Data from hidden Markov model search for short gastrulation homologs in Orthoptera.
- https://cdn.elifesciences.org/articles/68287/elife-68287-supp1-v2.xlsx
-
Supplementary file 2
Results from transcriptome annotation based on an automated BLAST approach.
- https://cdn.elifesciences.org/articles/68287/elife-68287-supp2-v2.zip
-
Supplementary file 3
Sequences of genes coding for BMP and Toll pathway components and their alignments used for phylogenetic reconstruction.
- https://cdn.elifesciences.org/articles/68287/elife-68287-supp3-v2.zip
-
Supplementary file 4
Recovery of the TGFβ/BMP pathway of G. bimaculatus, summary.
Where multiple isoforms are present, this is noted in the appropriate column.
- https://cdn.elifesciences.org/articles/68287/elife-68287-supp4-v2.docx
-
Supplementary file 5
Recovery of Toll pathway components of G. bimaculatus.
- https://cdn.elifesciences.org/articles/68287/elife-68287-supp5-v2.docx
-
Transparent reporting form
- https://cdn.elifesciences.org/articles/68287/elife-68287-transrepform-v2.pdf
Download links
A two-part list of links to download the article, or parts of the article, in various formats.
Downloads (link to download the article as PDF)
Open citations (links to open the citations from this article in various online reference manager services)
Cite this article (links to download the citations from this article in formats compatible with various reference manager tools)
Striking parallels between dorsoventral patterning in Drosophila and Gryllus reveal a complex evolutionary history behind a model gene regulatory network
eLife 10:e68287.
https://doi.org/10.7554/eLife.68287


