A plant-like mechanism coupling m6A reading to polyadenylation safeguards transcriptome integrity and developmental gene partitioning in Toxoplasma
- IAB,Team Host-Pathogen Interactions & Immunity to Infection, INSERMU1209, CNRSUMR5309, Grenoble Alpes University, France
- European Molecular Biology Laboratory, France
- Institut Laue-Langevin, France
- Laboratoire Génome et Développement des Plantes (LGDP), UMR5096, Centre National de la Recherche Scientifique (CNRS), Université de Perpignan via Domitia (UPVD), France
- Univ. Grenoble Alpes, INSERM, CEA, UMR BioSanté U1292, CNRS, CEA, France
- Integrated Structural Biology Grenoble (ISBG) CNRS, CEA, Université Grenoble Alpes, EMBL, France
Figures
Figure 1 with 1 supplement
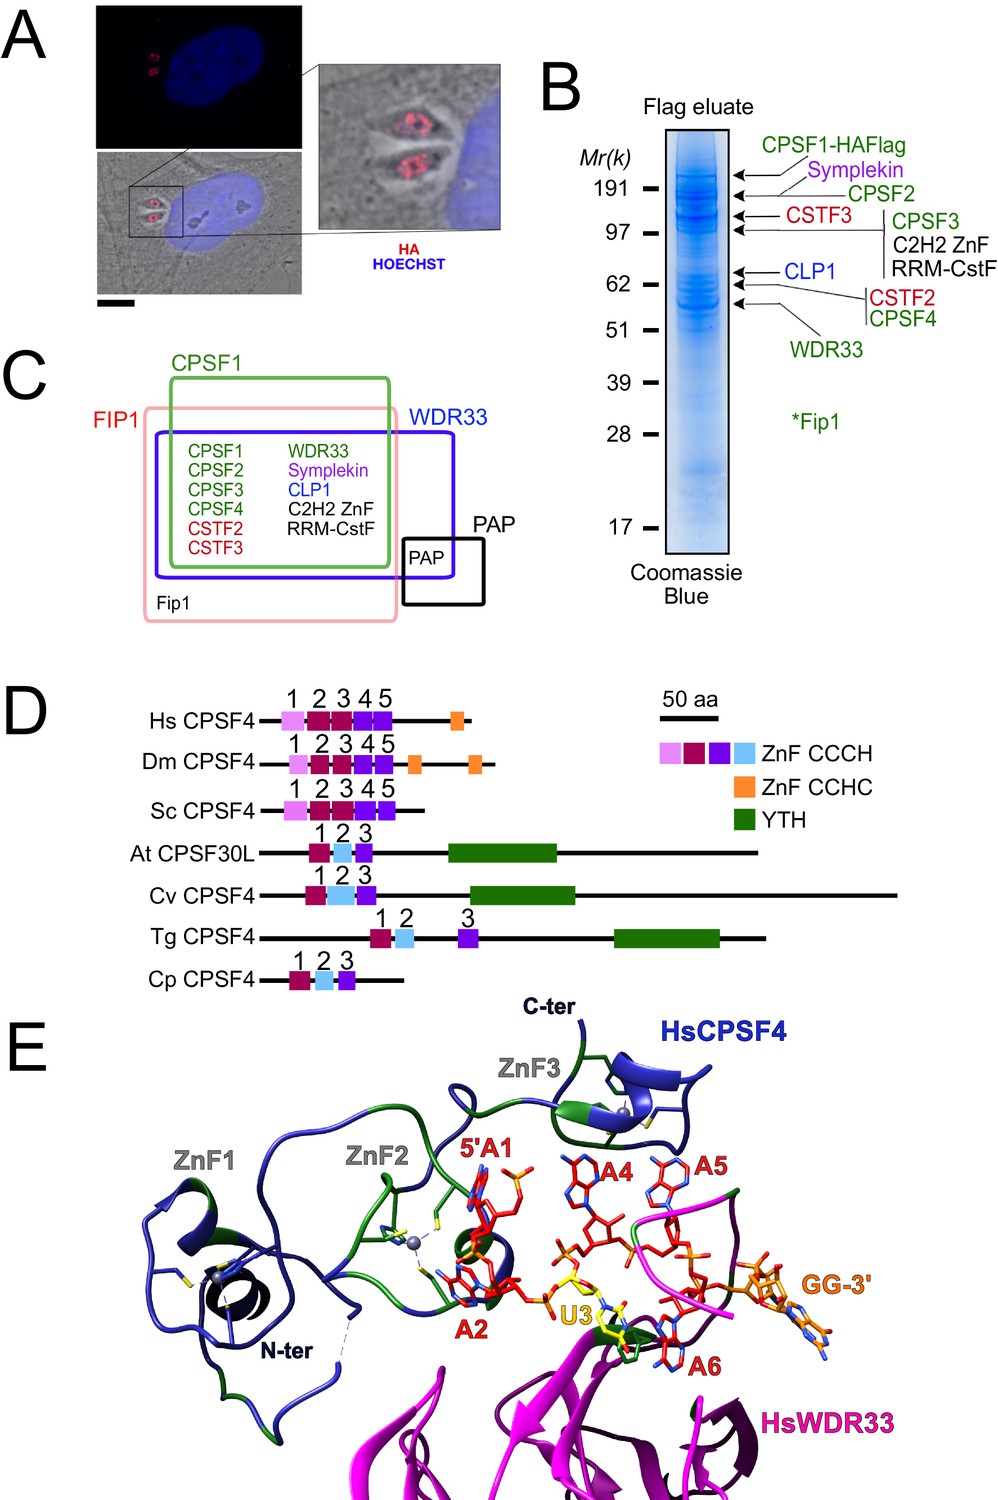
The nuclear-based CPSF subunit TgCPSF4 harbors a cross-phyla functional domain conservation, except for its additional plant-like YTH domain.
(A) A representative image of the nuclear staining CPSF1 (red) in human primary fibroblasts (HFFs) infected with parasites expressing an HA–Flag-tagged copy of CPSF1. Cells were co-stained with Hoechst DNA-specific dye. Scale bar, 10 μm. (B) MS-based proteomic analysis of the CPSF1-Flag elution identified many of the CPSF complex subunits. The identities of the proteins are indicated on the right. Fip1 was detected in sub-stoichiometric quantities in higher molecular weight band extractions but no band at its predicted size was cut-out for analysis. (C) Venn diagram showing the overlap of the proteins identified by mass spectrometry in the CPSF1, WDR33, FIP1, and PAP pulldowns. (D) Domain architectures representation of CPSF4 homologues. Hs Homo sapiens, Dm Drosophila melanogaster, Sc Saccharomyces cerevisiae, At Arabidopsis thaliana, Cv Chromera velia, Tg Toxoplasma gondii, Cp Cryptosporidium parvum. CPSF4 in T. gondii is encoded by TGME49_201200. (E) An adapted representation of the HsCPSF4 recognition of the polyadenylation signals (PAS) consisting of the hexamer motif AAUAAA, showing the ZNF2 binding to A1 and A2. HsWDR33 and HsCPSF4 are shown in cartoon fashion in magenta and blue respectively. The AAUAAA RNA is shown in stick fashion. Strict sequence conservation of RNA binding residues with Toxoplasma gondii homologs is shown in green.
Figure 1—figure supplement 1
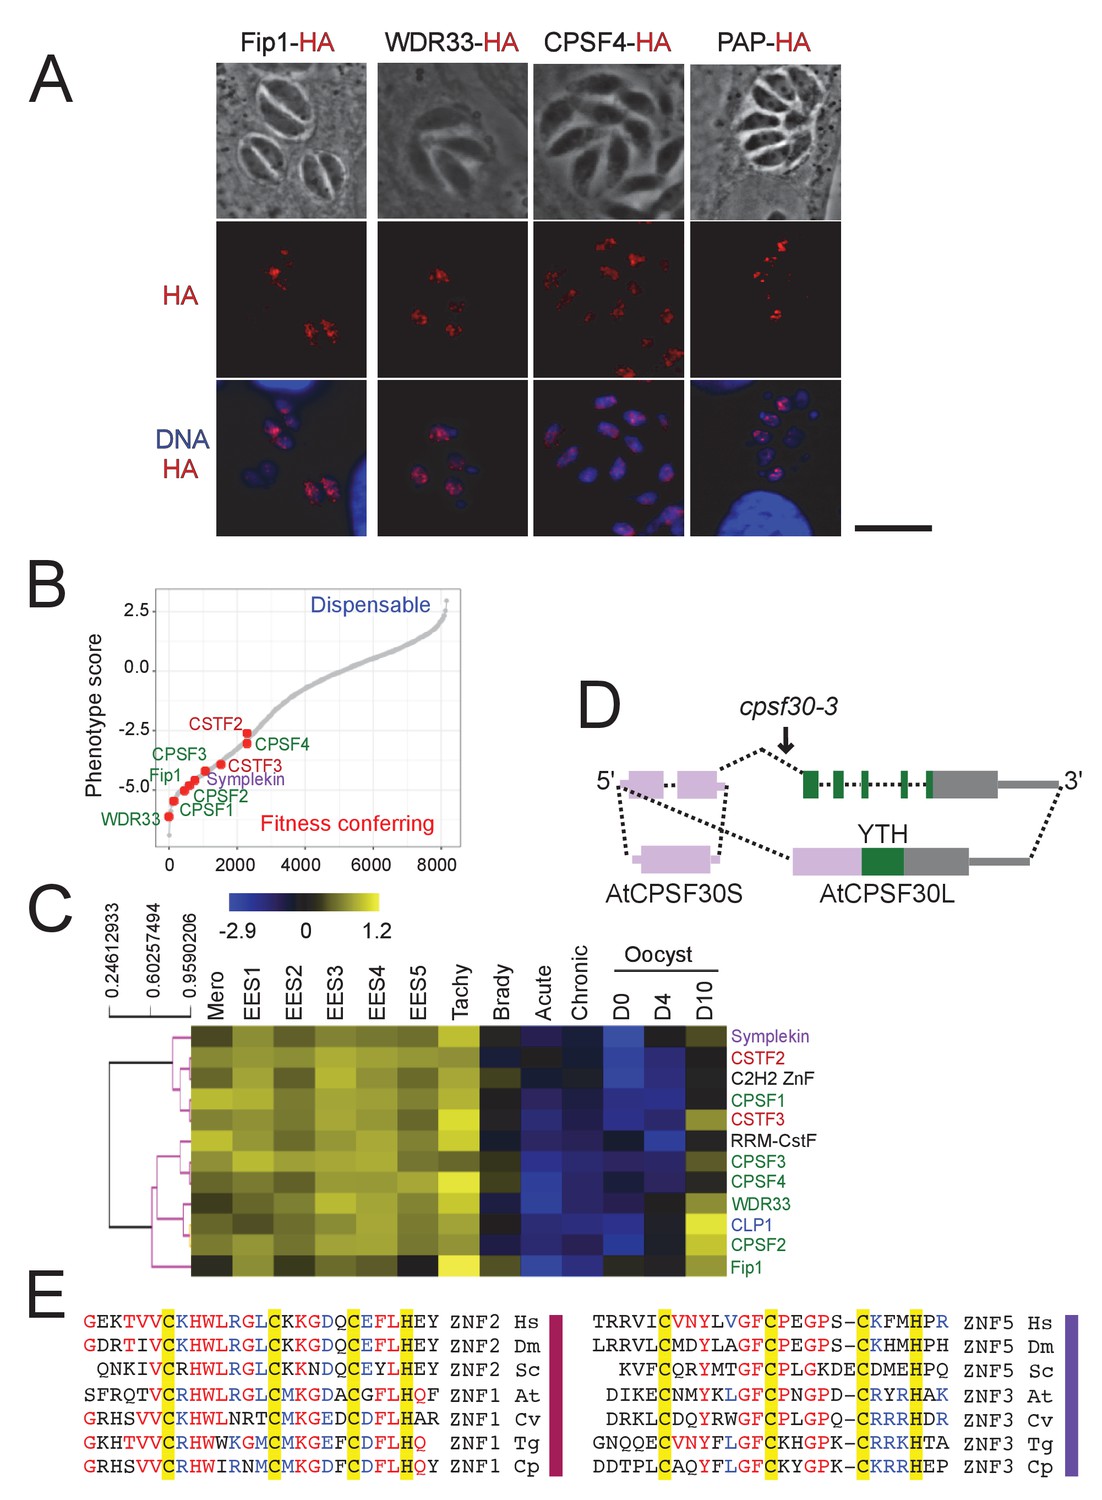
The CPSF subunits are similarly nuclear-based, essential for parasite’s fitness, and expressed mostly outside of the latent parasitic stages.
(A) IFA showing the nuclear localization of Fip1, WDR33, CPSF4, and PAP (in red), using human primary fibroblasts (HFFs) infected with the corresponding parasites harboring endogenously HA-FLAG-tagged proteins. Cells were co-stained with Hoechst DNA-specific dye. Scale bar, 10 μm. (B) A fitness graph displaying the level of essentiality of some of the 3’-end processing factors for the survival of the parasite. This data was taken from a CRISPR screen using parasites expressing Cas9 and transfected with a library of single guide RNAs. The x-axis rank genes based on their phenotype score, with the more negative scores representing a higher contribution of the gene to the fitness of the parasite (source: TOXODB). (C) A heat map representation showing mRNA hierarchical clustering analysis (Pearson correlation) of a set of 3’-end processing factors. Displayed are the abundance of their respective transcripts during the different life cycle stages. This data is collected from ToxoDB published transcriptomes of merozoite, longitudinal studies on enteroepithelial stages (EES1 to EES5), tachyzoites, bradyzoites, and cysts from both acute and chronically infected mice, and finally of immature (day 0), maturing (day 4) and mature (day 10) stages of oocyst development. The color scale indicates log2-transformed fold changes. (D) Structure of the Arabidopsis thaliana CPSF30 gene. Here showing both isoforms of this gene, the shorter form being CSPF30S which is the product of an alternative polyadenylation site at intron 2 (in dashed lines), and the longer isoform CPSF30L being the one harboring the additional YTH domain, generating by an alternative splicing of intron 2 (in dashed lines). The CPSF30-3 mutation that is displayed is one which specifically abrogates the CPSF30L mRNA production thus allowing an assessment of the roles of the YTH domain. Exons and UTRs are shown with thick and thin bars, respectively. (E) Sequence alignment comparing the residues of homologous ZNF domains, namely ZNF2 to ZNF1 (on left), and ZNF5 to ZNF3 (on right), amongst different species. The residues conserved across phyla are highlighted by yellow boxes. Hs: Homo sapiens, Dm: Drosophila melanogaster, Sc: Saccharomyces cerevisiae, At: Arabidopsis thaliana, Cv: Chromera velia, Tg: Toxoplasma gondii, Cp: Cryptosporidium parvum.
Figure 2 with 1 supplement
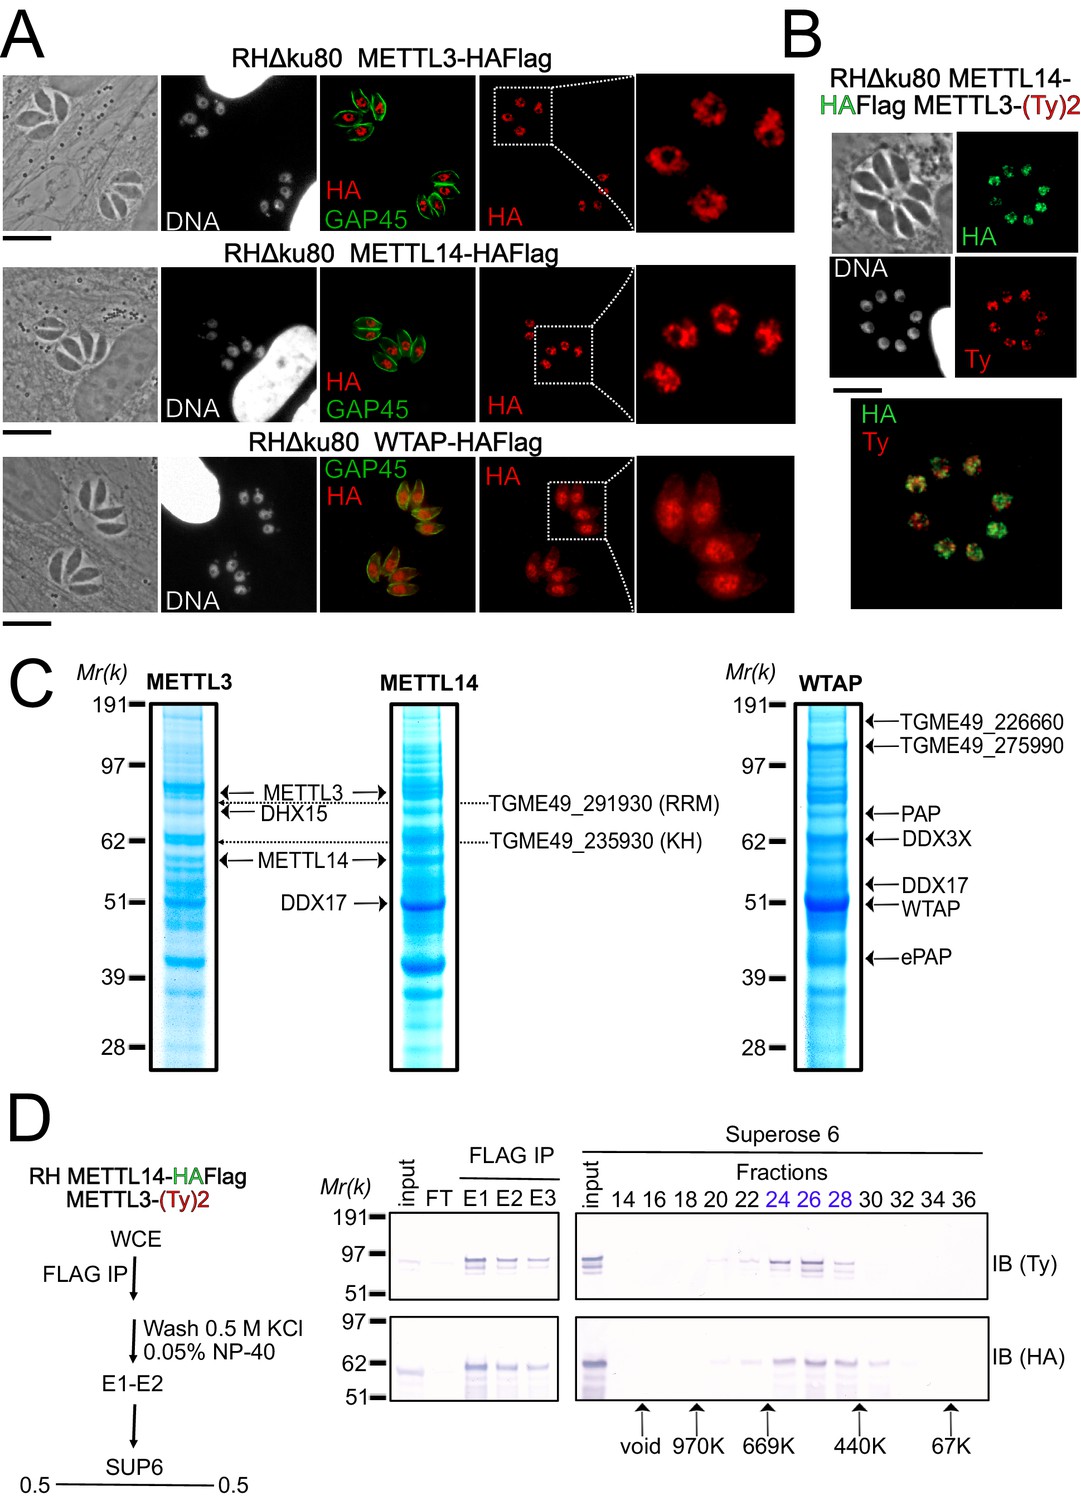
A nuclear-based m6A catalyzing complex in T. gondii incorporates both conventional and specific subunits.
(A) IFA showing the nuclear localization of METTL3, METTL14 and WTAP (red), using human primary fibroblasts (HFFs) infected with the corresponding parasites harboring endogenously HA-FLAG-tagged proteins. The parasitic membrane is probed using anti-GAP45 antibodies (green). Cells were co-stained with Hoechst DNA-specific dye. Scale bar, 10 μm. (B) IFA of HFFs that were infected with parasites harboring METTL3 endogenously tagged with Ty within the RH METTL14–HAFlag lineage. Fixed and permeabilized parasites were probed with antibodies against HA (green) and Ty (red). Scale bar, 10 μm. (C) Coomassie Blue staining of the eluates used for subsequent MS-based proteomic analysis for the identification of the interactomes of METTL3, METTL14, and WTAP. The identities of the proteins are indicated. (D) METTL14 was FLAG-affinity purified from whole cell extract of parasites co-expressing METTL14-HAFlag- and METTL3-(Ty)2-expressing parasite with Flag affinity. Flag-eluted peptides were fractionated on a Superose 6 gel filtration column in the presence of 0.5 M KCl. Flag chromatography and gel filtration fractions were separated through SDS-polyacrylamide gel and analyzed by western blot with anti-HA and anti-Ty antibodies. Fraction numbers are indicated on top of the gel.
-
Figure 2—source data 1
Uncropped immunoblots: uncropped western blots corresponding to Figure 2D.
Size markers (kDa) are indicated.
- https://cdn.elifesciences.org/articles/68312/elife-68312-fig2-data1-v2.pdf
Figure 2—figure supplement 1
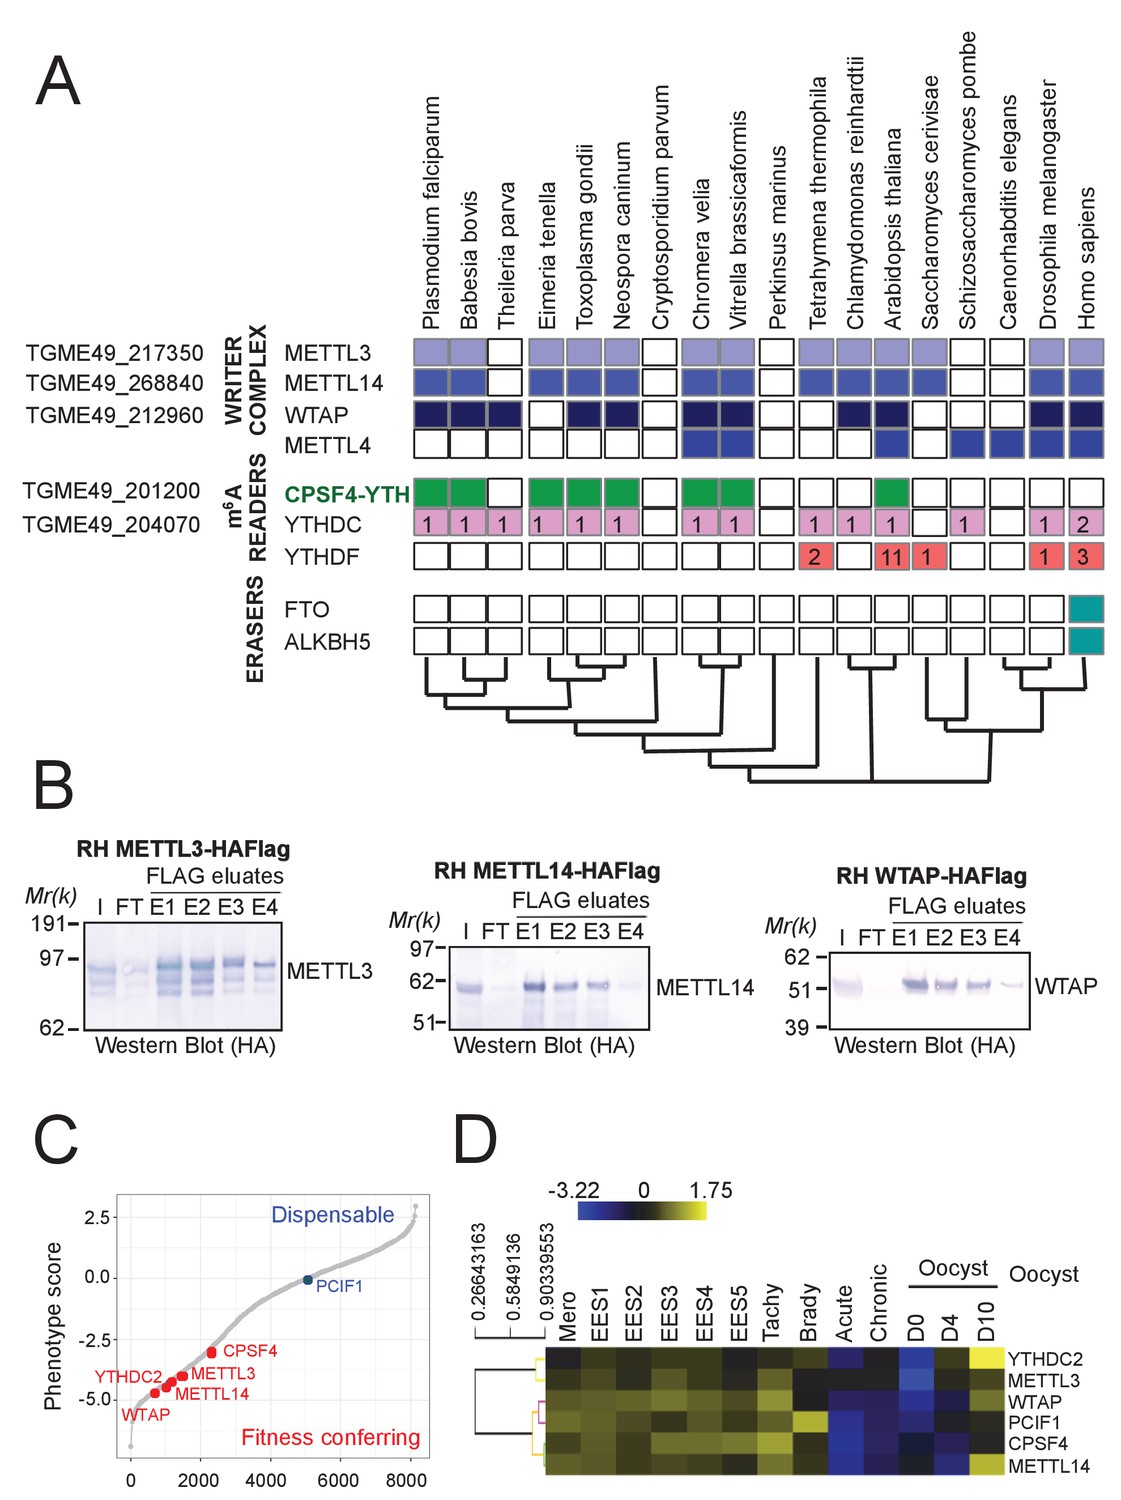
A set of conserved and fitness conferring m6A-related enzymes can be detected in the Apicomplexa phylum.
(A) A phylogeny representation of m6A-related proteins (writers, readers, and erasers) in various organisms. The colored boxes mark the presence of a certain protein and the white ones mark their absence. Also are displayed the copy numbers of genes encoding for the family of putative m6A readers, being YTHDC (proteins containing the YTH domain amongst others) and YTHDF (proteins harboring only YTH domains). The unique architecture of CPSF4 combined with a YTH domain can be seen to be present only in species of apicomplexans, of plants and in one of their common related ancestor Chromera Velia. Corresponding T. gondii genes are represented at the left of the table. (B) The Western Blot analysis of the eluates of each of the FLAG-affinity pulldowns of METTL3, METTL14 and WTAP, corresponding to the biochemical analysis of Figure 2C. Anti-HA antibodies were used to detect the respective proteins, each of which migrated to its predicted molecular weights. (C) A fitness graph displaying the level of essentiality of some of the identified m6A-related proteins for the survival of the parasite. The scores were similarly found as in Figure 1—figure supplement 1B. (D) A heat map representation showing mRNA hierarchical clustering analysis (Pearson correlation) of the m6-A related proteins. Displayed are the abundance of their respective transcripts during the different life cycle stages. This data is collected from ToxoDB published transcriptomes similarly to Figure 1—figure supplement 1C. The color scale indicates log2-transformed fold changes.
-
Figure 2—figure supplement 1—source data 1
Uncropped immunoblots: uncropped western blots corresponding to Figure 2—figure supplement 1B.
Size markers (kDa) are indicated.
- https://cdn.elifesciences.org/articles/68312/elife-68312-fig2-figsupp1-data1-v2.pdf
Figure 3
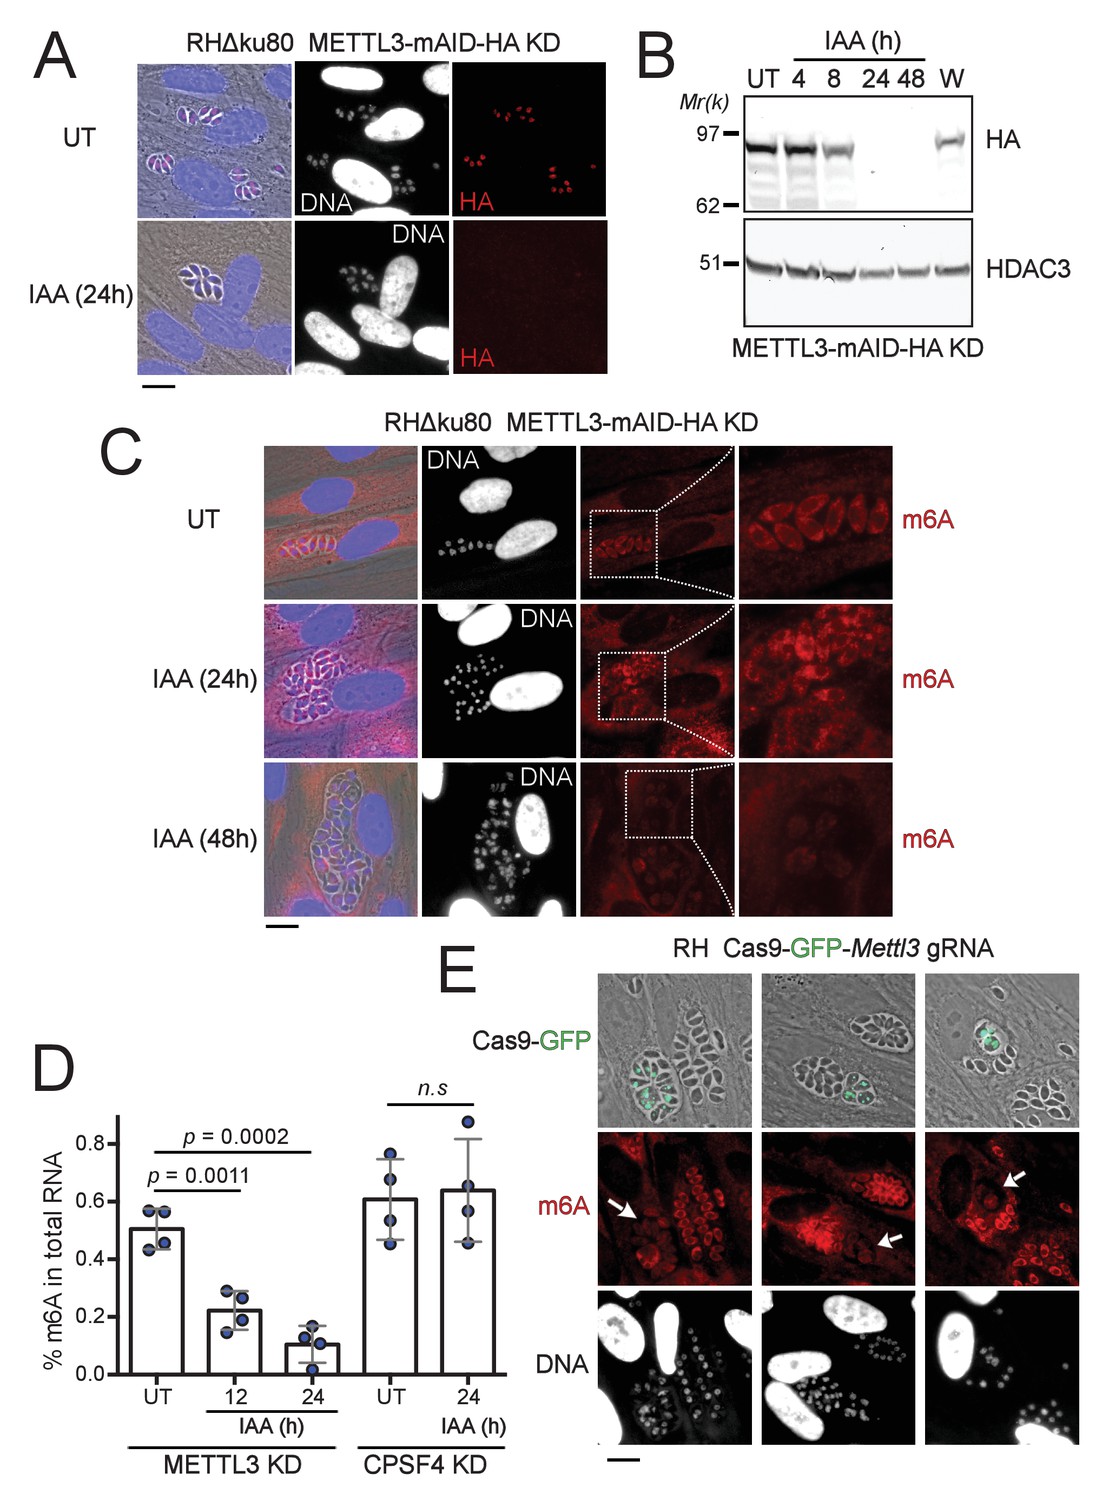
The depletion of METTL3, both post-translationally or genetically, impairs the level of m6A.
(A) METTL3 protein expression levels after 24 hr of adding IAA, displayed by IFA on HFF cells infected with RH parasites engineered to allow the degradation of the endogenously tagged METTL3-mAID-HA. Cells were probed with antibodies against HA (red) and DNA was stained using the Hoechst DNA dye. Scale bar, 10 μm. (B) Time-course analysis of the expression levels of METTL3–mAID–HA. The samples were taken at the indicated time periods after addition of IAA and were probed with antibodies against HA and HDAC3. IAA-treated (24 hr) parasites were also washed (W), incubated with fresh media in the absence of IAA (12 hr) and analyzed using western blot. The same experiment was repeated two times and a representative blot is shown. (C) The effect of METTL3 depletion on the m6A levels, detected upon 24 and 48 hr of IAA-dependent Knock-Down induction. Specific antibodies were used to probe the m6A mark. The DNA staining points at defects at the nuclear level following the METTL3 depletion. (D) Quantitation of m6A levels by ELISA in total RNA from METTL3–mAID–HA and CPSF30-mAID-HA purified tachyzoites untreated (UT) or treated with IAA at the indicated time periods. Data are the mean ± s.d. of three biological replicates. p Values were calculated using two-tailed unpaired Student’s t-test. (E) g-RNA targeted against the METTL3 gene allows the genetic inactivation of this latter, allowing to detect the effects of this disruption on the levels of m6A (in red) within the parasites that were touched by the Cas9 (marked with arrows). The efficiency of genetic disruption in Cas9-expressing parasites was monitored by cas9-GFP expression (in green). Scale bar, 10 μm.
-
Figure 3—source data 1
Uncropped immunoblots: uncropped western blots corresponding to Figure 3B.
Size markers (kDa) are indicated.
- https://cdn.elifesciences.org/articles/68312/elife-68312-fig3-data1-v2.pdf
Figure 4

Binding of m6A-modified RNA to recombinant forms of T. gondii and A. thaliana CPSF4-YTH domains.
(A) Final purification step gel-filtration chromatograms (using a S200 column) and associated NUPAGE gels of T. gondii and A. thaliana CPSF4-YTH domains shown in blue and orange, respectively. (B and C) IsoThermal Calorimetry (ITC) titrations obtained from recombinant TgCPSF4YTH (B) or AtCPSF4YTH (C) against unmodified (left panel) or m6A modified seven mer RNA (right panel). For both conditions, RNA within buffer (red curves) and RNA within protein solutions (black curves) titrations were included. Data is displayed above as µcal/sec peaks at every ligand injection as a function of Molar Ratio while integrated peak values fitted with association curves are shown below.
Figure 5 with 1 supplement

Overall structure of the CPSF4 YTH domain.
(A) General structure architecture. The structure is displayed in a ribbon diagram with only side chains within the m6A-binding site shown. The right representation corresponds to the left representation 180° centrally rotated on itself. Alpha helices are shown in yellow, β-sheets in blue and loops and coils in green. m6A from this model in both A and B panels is shown as red sticks. (B) CPSF4/YTHDC1 structural comparison. Both CPSF4 YTH (colored as in panel A) and YTHDC1 (pdb 6RT4 colored in light blue) structures were chain superposed on their Cα backbones. m6A ligands are shown in stick representation, the one binding to YTHDC1 is colored in magenta. A blow-up panel on the left focuses on the m6A-binding site. (C) Sequence alignment depicting alpha helices in yellow, β-strands in blue displaying RMSD (backbone) per residue as well as the charge variation per residue (blue being positive and red negative). Representations, structure matching and alignments were made using UCSF Chimera.
Figure 5—figure supplement 1
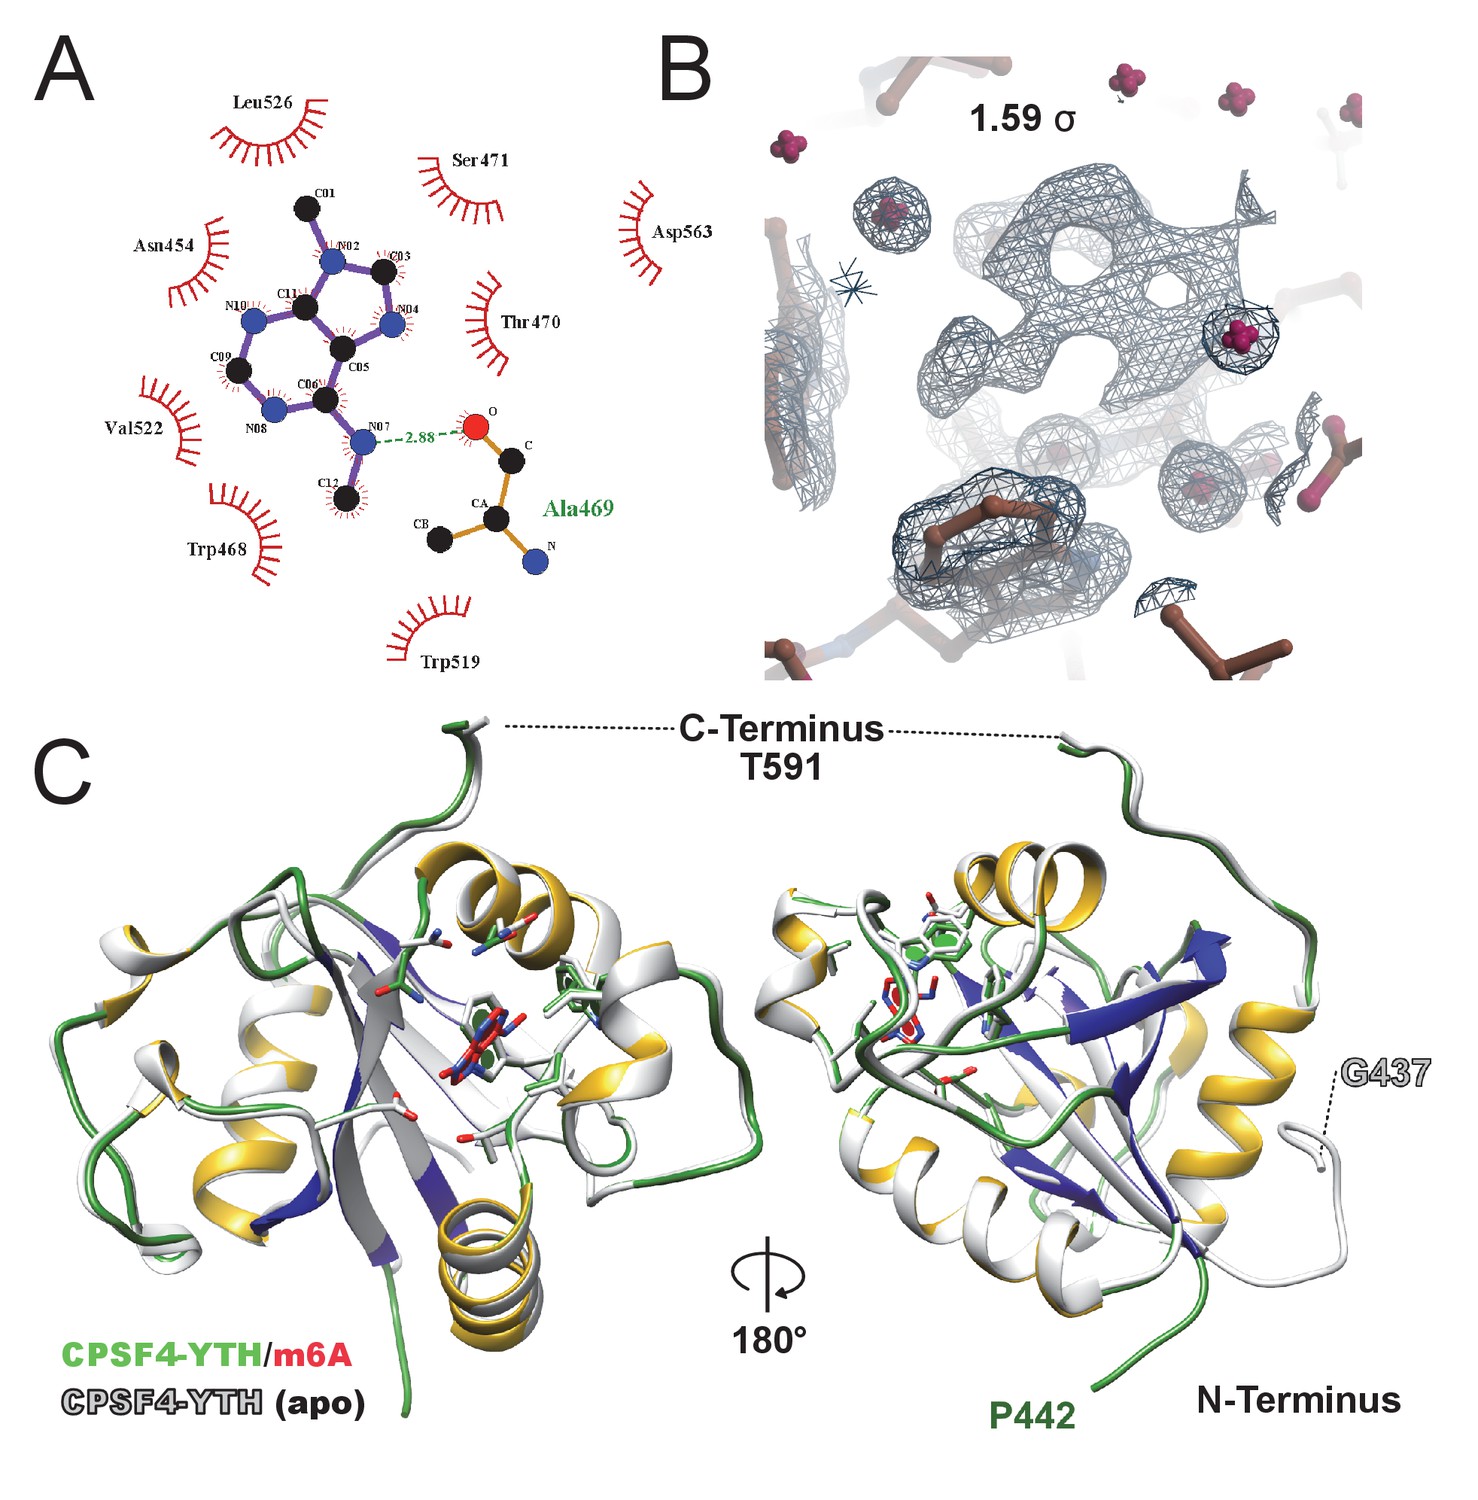
m6A-binding site.
(A) FoFc omit map of m6A at 1.59σ visualized in coot with a 6 Å electron density sphere. Electron density is displayed as black mesh while CPSF-4 YTH as brown sticks, waters are shown in magenta. (B) FoFc omit map of m6A at 1.59σ visualized in coot with a 6 Å electron density sphere. Electron density is displayed as black mesh while CPSF-4 YTH as brown sticks, waters are shown in magenta. (C) Cartoon and stick superposition of the m6A-bound CPSF-4 YTH (green/yellow/blue) against the apo form (white) visualized in UCSF Chimera.
Figure 6 with 1 supplement
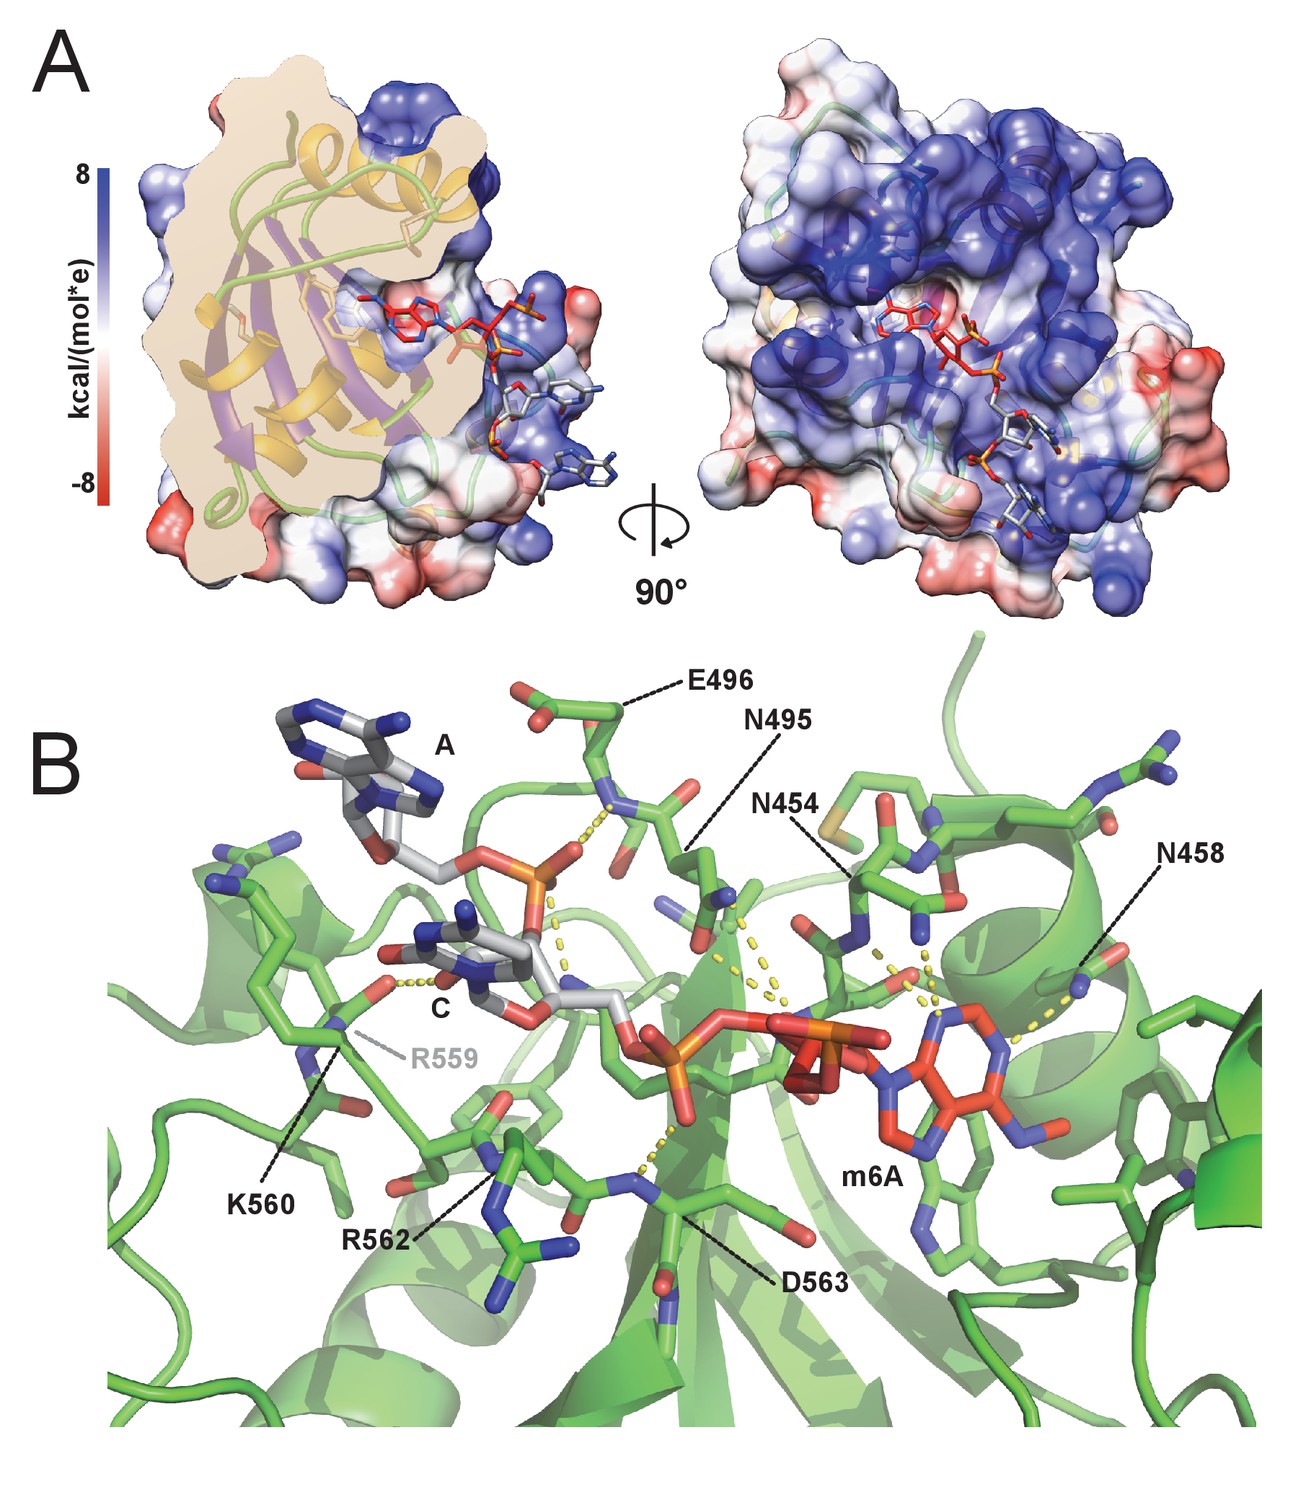
m6A RNA/CPSF-4 YTH co-crystal structure.
(A) Semi-transparent surface representation of CPSF-4 YTH displayed with a coulumbic surface coloring (UCSF chimera), RNA bases are shown in stick representation with the m6A base colored in red. (B) Detailed interactions between RNA backbone and CPSF-4 YTH residues. CPSF-4 YTH is shown in green cartoon or stick representation while the RNA is shown in grey or red stick representation. Dotted yellow lines display predicted direct polar contacts less than 3 Å in distance and were computed using pymol.
Figure 6—figure supplement 1
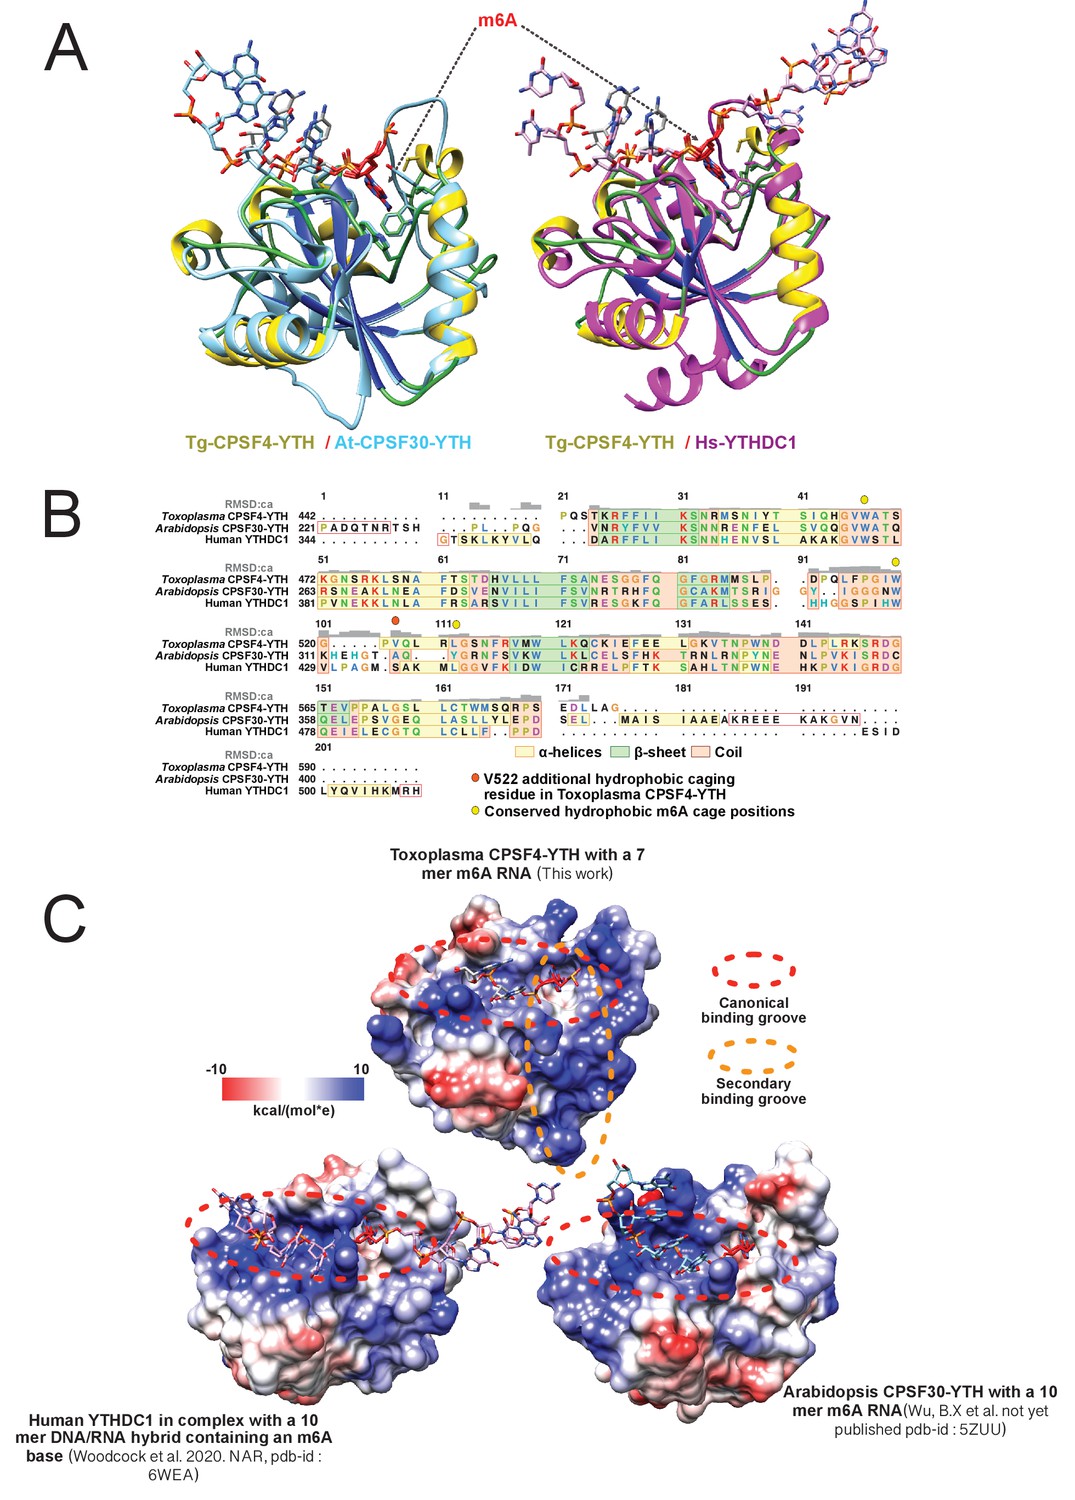
Structural conservation/differences of CPSF4-YTH between Toxoplasma gondii, Arabidopsis thaliana and Human YTHDC1.
(A) Global backbone and hydrophobic cage structural alignment. Tg_CPSF4-YTH/RNA (yellow/green/deep blue protein model, gray sticks RNA) and At-CPSF30-YTH (pdb-id: 5ZUU; cyan protein and RNA) are shown on the left while Tg_CPSF4-YTH/RNA (same coloring) and Hs_YTHDC1/hybridDNA/RNA (pdb-id: 6WEA magenta protein and RNA) are shown on the right. RNA molecules are shown as sticks with the m6A base highlighted in red while proteins are all displayed in a cartoon fashion with hydrophobic pocket residue side-chains shown as sticks. (B) Sequence detail of structural alignment. All three pdb models (from panel A) were structurally matched and aligned, global RMSD deviation per residue (up to an RMSD of 5) is displayed in a gray histogram on structurally aligned segments. Yellow, light green and sandy brown color respectively α-helices, β-sheets and coil secondary structures while critical hydrophobic cage residues are displayed in yellow and orange circles. (C) Electrostatic surface representation RNA interaction. Tg_CPSF4-YTH, At_CPSF4-YTH, and Hs_YTHDC1 are all shown in the same aligned orientation in a surface representation with a Coulombic electrostatic charge coloring, bound nucleic acid molecules are shown as sticks while highly positively charged grooves are highlighted with dashed ellipsoid. All panels were generated using UCSF-chimera.
Figure 7 with 4 supplements
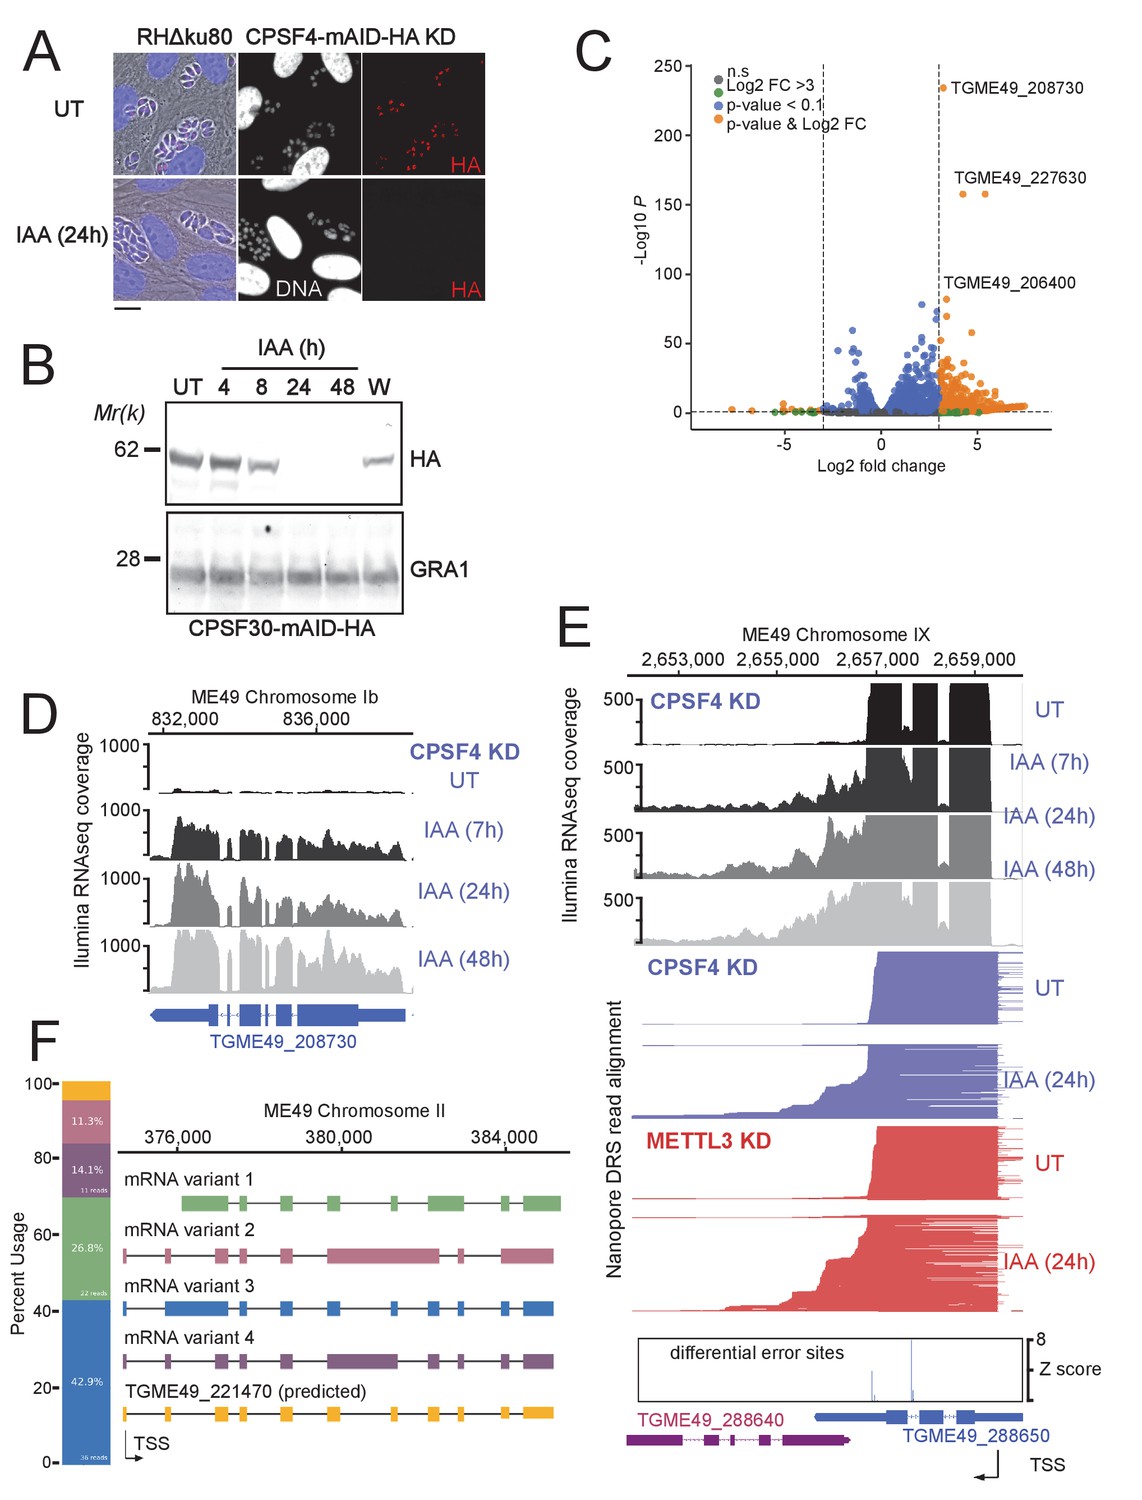
The CPSF4 post-translational Knock-down results in alternatively spliced RNAs readthrough.
(A) CPSF4 protein expression levels after 24 hr of adding IAA, displayed by IFA on HFF cells infected with RH parasites engineered to allow the degradation of the endogenously tagged CPSF4-mAID-HA. Cells were probed with antibodies against HA (red) and DNA was stained using the Hoechst DNA dye. Scale bar, 10 μm. (B) Time-course analysis of the expression levels of CPSF30–mAID–HA. The samples were taken at the indicated time periods after addition of IAA and were probed with antibodies against HA and GRA1 (loading control). IAA-treated (24 hr) parasites were also washed (W), incubated with fresh media in the absence of IAA (12 hr) and analyzed using western blot. The same experiment was repeated two times and a representative blot is shown. (C) Volcano plot illustrating changes in RNA levels before and after the induced Knock-down of CPSF4. The orange dots indicate transcripts that were significantly up and down regulated, using adjusted p < 0.1 (Bonferroni-corrected) and ± 3-fold change as the cut-off corresponding to each comparison. X-axis showing log2 fold change, Y-axis showing -log10(p-value). Vertical dashed lines indicate threefold up- and down-regulation. (D) Density profile from illumina RNA-seq data for a representative gene targeted by the knock-down of CPSF4. RNAs were extracted from untreated cells as well as after 7, 24, and 48 hr of KD-inducing IAA treatment. RPKM values are shown on the y axis, and chromosomal positions are indicated on the x axis. (E) Density profile for a representative gene targeted by the KD of CPSF4, with extracted RNAs being sequenced both through illumina-RNA-seq data (on top) and aligned DRS reads (600 read stack for each condition, no strand coloring and no splicing characteristics displayed). The y-axis represented the read-depth. A read-through from the TGME49_288650 towards the initially repressed TGME49_288640 can be seen by both sequencing methods, following the IAA-dependent knockdown of CPSF4. A similar phenotype can be detected following the KD of METTL3. The TSS are displayed as predicted by the FLAIR isoform analysis. (F) FLAIR analysis was used to detect the different splicing isoforms at the TGME49_221470 locus. The four different variants of this gene’s mRNA transcripts are displayed along with their respective percentages of occurrence, on the left. Exons are shown with colored thick bars and introns with thin lines. This data was obtained from UT parasites mRNAs and was aligned against the T. gondii ME49 genome.
-
Figure 7—source data 1
Uncropped immunoblots: Uncropped western blots corresponding to Figure 7B.
Size markers (kDa) are indicated.
- https://cdn.elifesciences.org/articles/68312/elife-68312-fig7-data1-v2.pdf
Figure 7—figure supplement 1
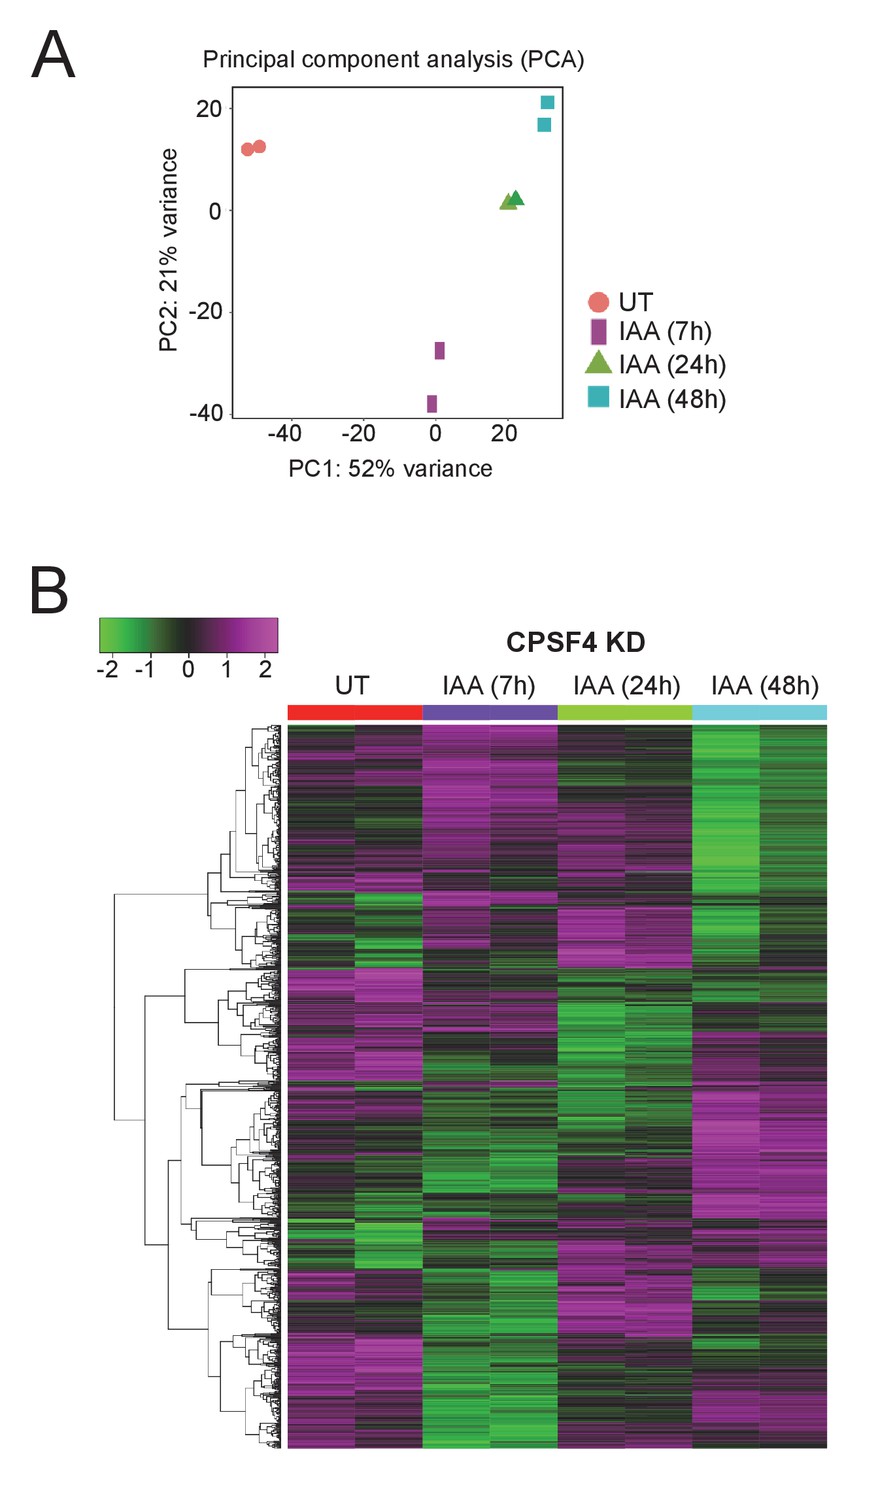
The CPSF4 post-translational knock-down disrupts the expression levels of a multitude of genes.
(A) Principal component analysis (PCA) shows the biological and technical variability between samples after Illumina sequencing of mRNA extracted in duplicate after 7, 24, and 48 hr of CPSF4 KD induction. (B) Heat map showing hierarchical clustering based on Pearson’s correlation of genes that are differentially regulated after the degradation of the CPSF4 protein by IAA induction. RNAs were extracted after 7, 24, and 48 hr of KD induction. The color scale indicates log2-transformed fold changes.
Figure 7—figure supplement 2
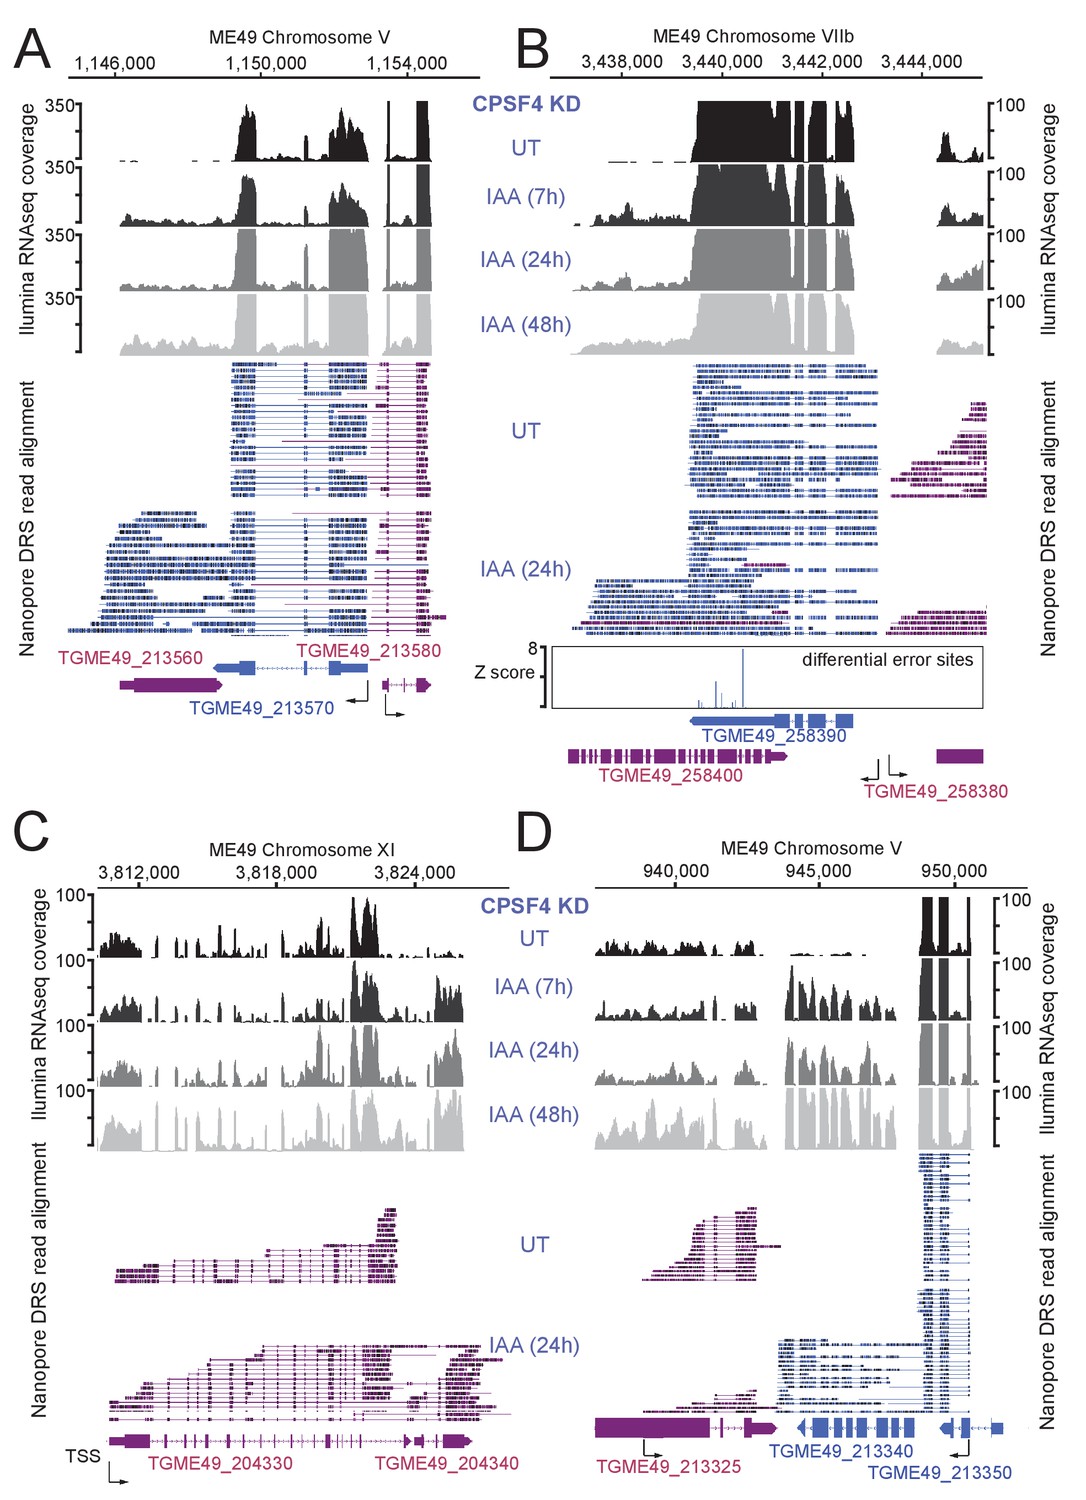
Read-through events and chimeric RNAs detected on T. gondii chromosomes V, VIIb, and XI following CPSF4 post-translational knock-down.
(A), (B), (C), and (D) illustrate representative examples of analysis of read-through events detected at different loci. The chromosomal positions and gene accession numbers are shown for each panel. On top are displayed the illumina-RNA-seq data before and after the IAA-dependent KD of CPSF4, at different times. The y-axis represents the RPKM values. Below is the nanopore-based RNA sequencing of RNAs extracted before and after the IAA-dependent KD of CPSF4 with positive strand reads in magenta and negative strand reads in blue. Exons are shown with colored thick bars and introns with thin lines. In (B), the nanopore differential error sites (Z-score >50) are indicated. Notable observations: in (A) and (B), unlike in (C), the readthrough breach into a downstream gene that is predicted on the opposite strand, and proceeds in the transcriptional direction of the gene upstream. In (D), the readthrough invades TGME49_213340 that is supposed to be repressed.
Figure 7—figure supplement 3
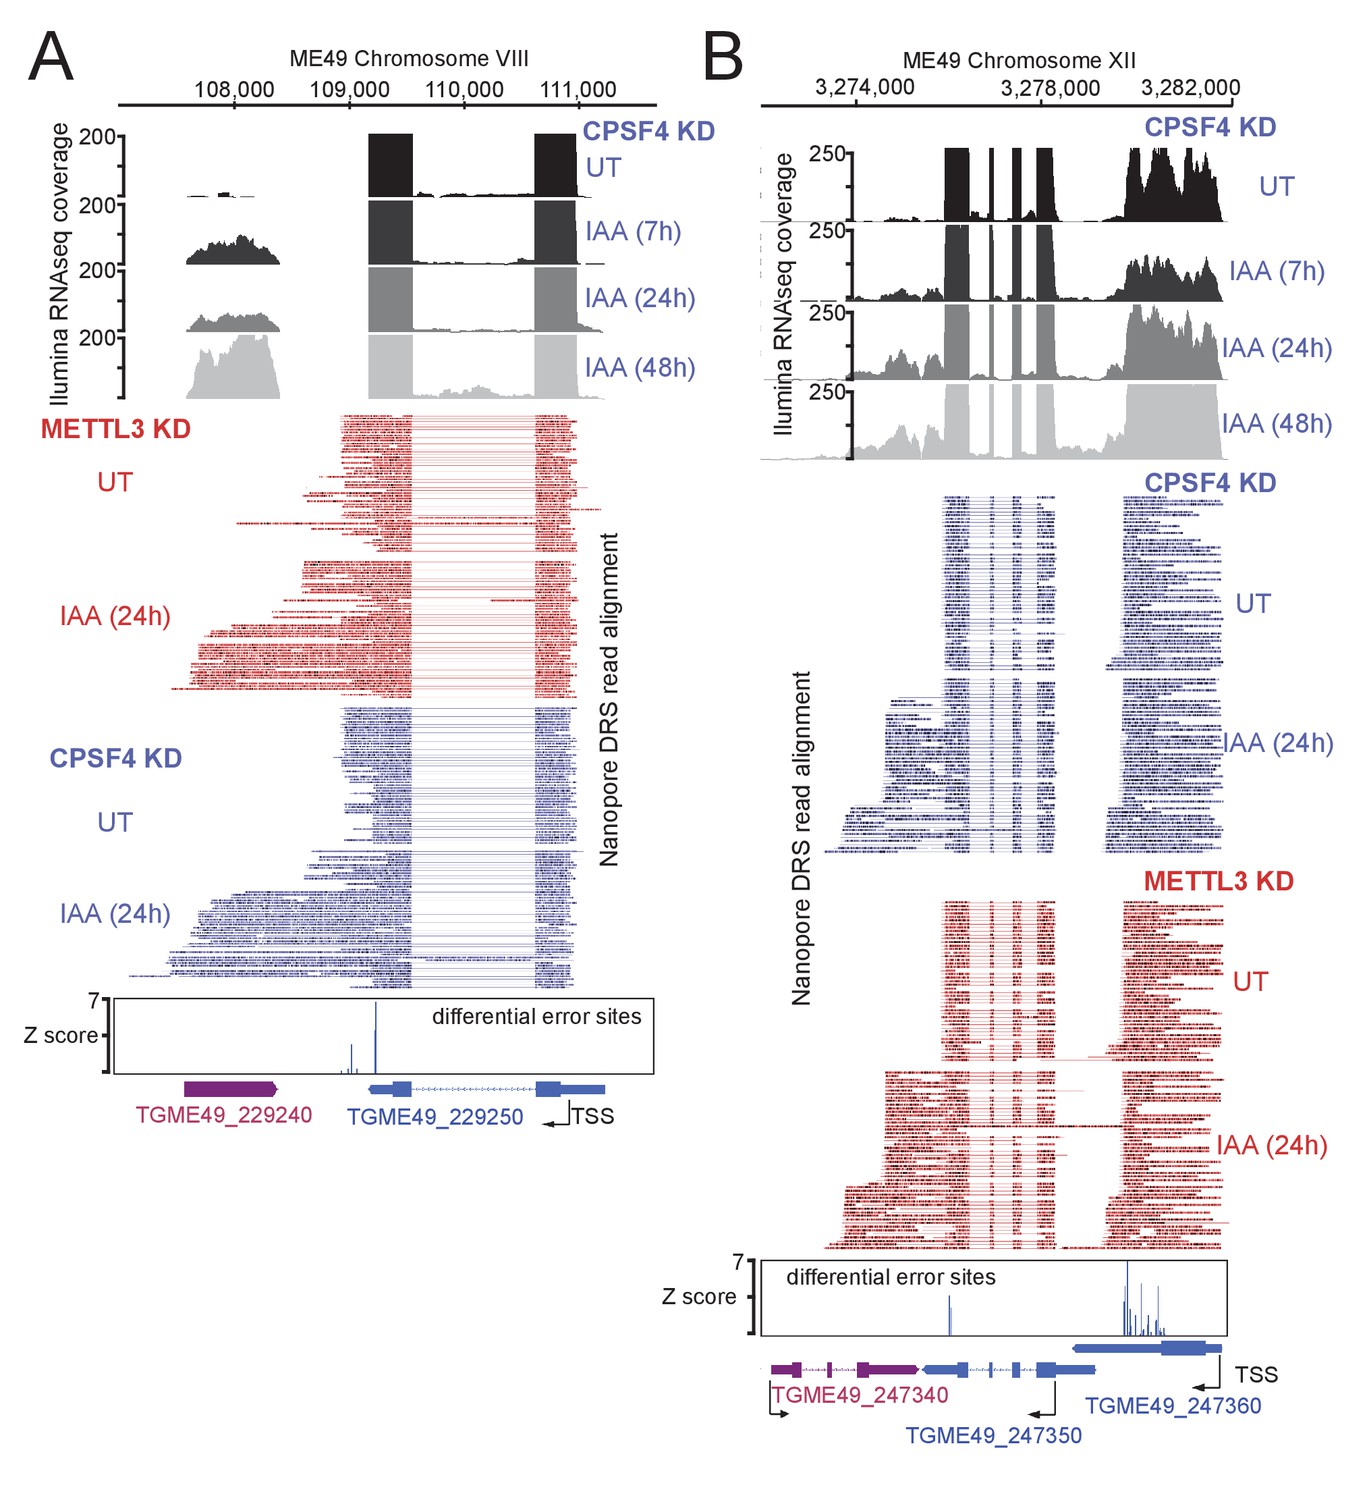
Read-through events and chimeric RNAs detected on T. gondii chromosomes VIII and XII following CPSF4 and METTL3 post-translational knock-down.
(A) and (B) illustrate representative examples of analysis of read-through events detected at different loci. The chromosomal positions and gene accession numbers are shown for each figure. On top are displayed the illumina-RNA-seq data before and after the IAA-dependent KD of CPSF4, at different times. The y-axis represents the RPKM values. Below are aligned single reads from DRS sequencing, all sorted by size within a representative sampling of 50 reads per condition, of RNAs extracted before and after the IAA-dependent KD of CPSF4 and METTL3. Positive sense reads are colored in red while negative sense reads are colored in blue. Exons are shown with colored thick bars and introns or soft clip sequences with thin lines. The nanopore differential error sites (Z-score >5) are indicated. Notable observations: in (A), the 3’UTR of TGME49_229250 is seen to be longer than initially predicted. In (B), the readthrough breach into TGME49_247340 that is predicted on the opposite strand, and supposed to be repressed.
Figure 7—figure supplement 4
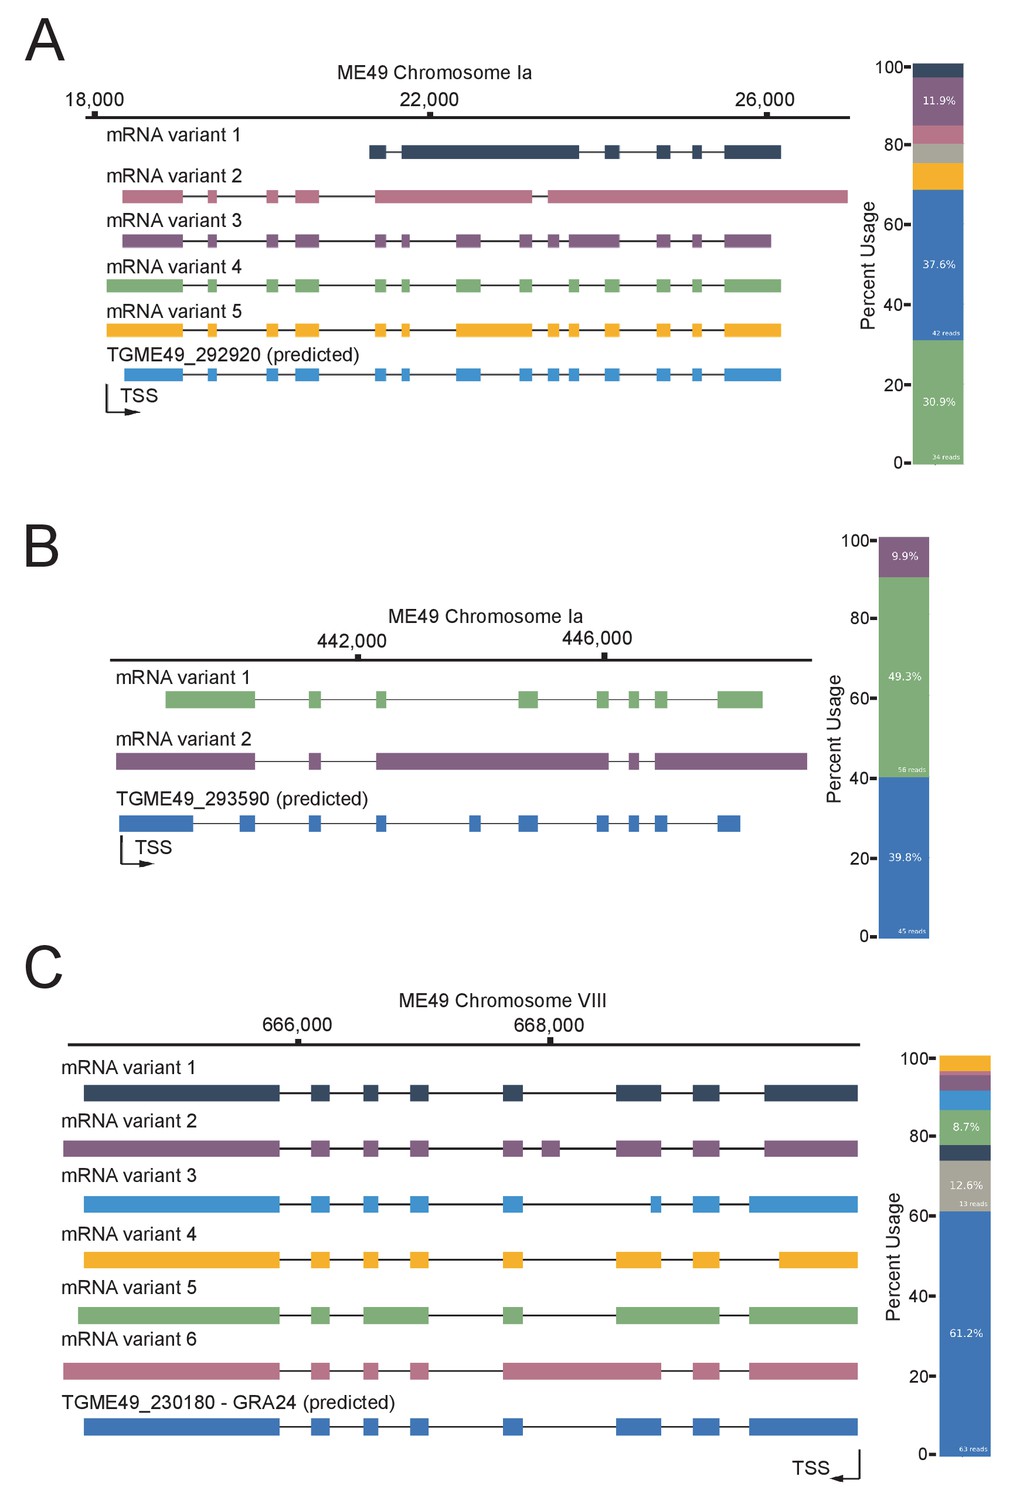
Nanopore-sequencing data reveals splicing complexity in T. gondii.
FLAIR analysis was used to detect the different splicing isoforms at the TGME49_292920 (A) TGME49_293590 (B) and TGME49_230180 (C) loci. On the left, going from 5’ to 3’ the different mRNA variant transcripts are displayed against chromosomal positions. On the right, their respective percentages of occurrence are plotted in a histogram fashion by color correspondence, the gray key representing non consistent isoforms. Exons are shown with colored thick bars and introns with black lines. This data was brought out from nanopore-based RNA-sequencing of mRNAs extracted from UT parasites and aligned against the T. gondii ME49 genome.
Figure 8 with 2 supplements
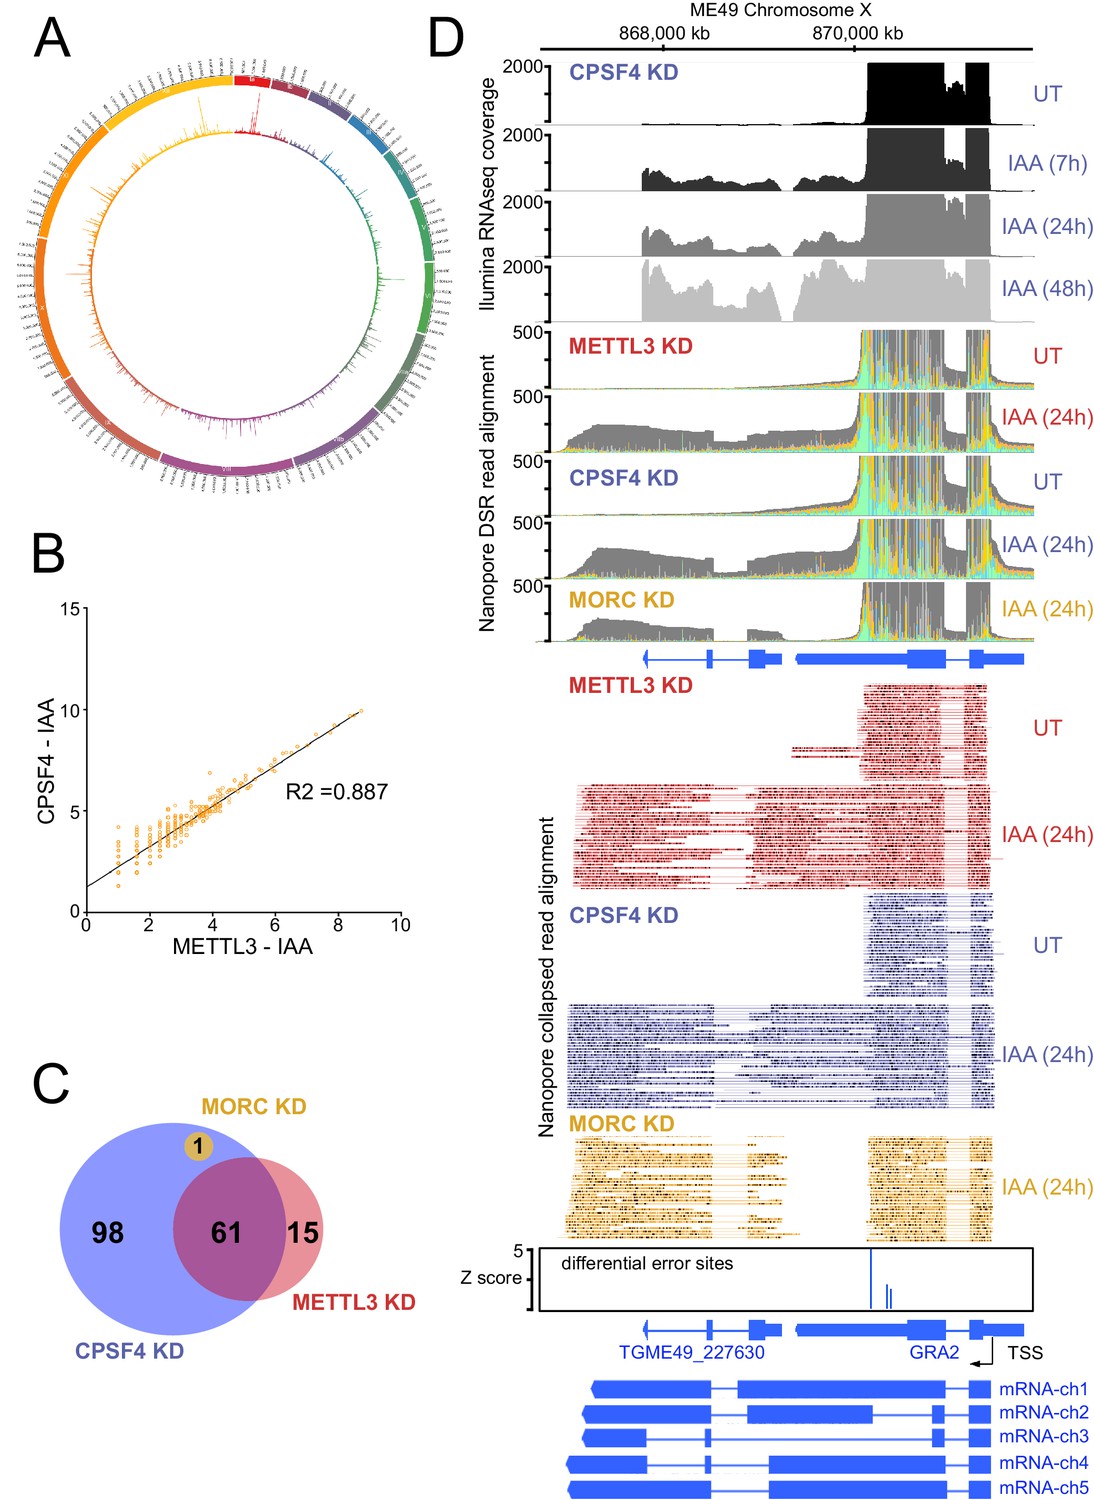
The knock-down of CPSF4, and of METTL3 generates chimeric RNAs resulting from readthrough into neighboring genes.
(A) Circos plot displaying the assessment of average distribution of generated chimeric transcripts across the 13 T. gondii chromosomes, following the depletion of CPSF4 and METTL3. ChimerID scripts were used for this analysis. Histograms represent combined fold enrichment of readthroughs between UT and IAA knockdown conditions. (B) Scatter plot of transformed expression in two samples provided by the EdgeR analysis of chimeric reads detected by chimer ID comparing KD conditions of CPSF4 and METTL3. (C) Venn diagram of genes with an important fold change in relative chimeric read abundance (Log2 Fold change > 1, with at least three counts) within CPSF4, METTL3 or MORC KD conditions when compared to non-induced conditions. (D) A representative analysis of the read-through from the GRA2 into the TGME49_227630 locus. On top are displayed the illumina-RNA-seq data before and after the IAA-dependent KD of CPSF4, at different times. The y-axis represents the RPKM values. Below is the DRS aligned read multi-way pileup of RNAs extracted before and after the IAA-dependent knock-down of METTL3 (in red), of CPSF4 (in blue), and of MORC (in yellow). A more detailed close-up look is represented right below of the respective DRS data allowing a clear assessment of the read-through phenotype that is seen following the KD of both CPSF4 and METTL3. MORC KD DRS is also included to highlight a conventional upregulation of the initially repressed TGME49_227630 gene. At the bottom is a histogram representation of the Epinano differential error Z-score and a schematic representation of the different RNAs expressed (readthrough differentially spliced chimeric RNAs) at these loci, based on the nanopore mapped reads following the KD of CPSF4. Exons are shown with colored thick bars and introns with thin lines.
-
Figure 8—source data 1
Excel spreadsheet containing quantitative data for Figure 8.
- https://cdn.elifesciences.org/articles/68312/elife-68312-fig8-data1-v2.xlsx
Figure 8—figure supplement 1
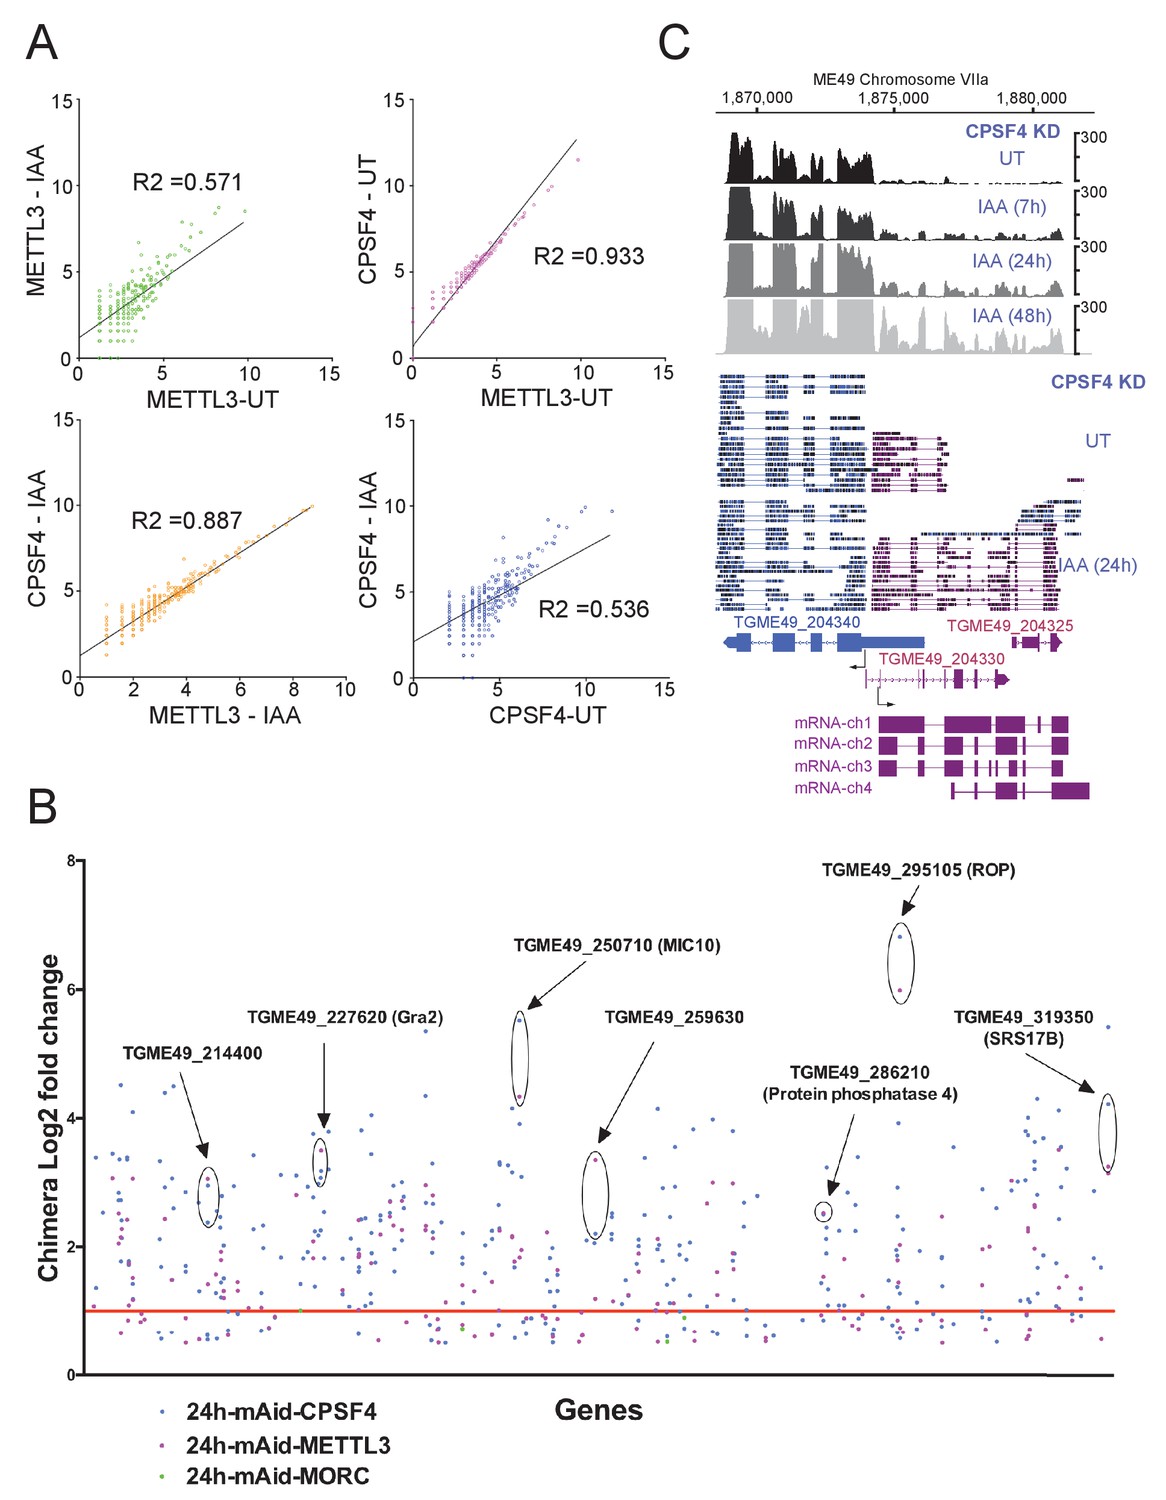
Read-through enrichment in CPSF4 and METTL3 KD.
(A) Scatter plot of transformed expression in two samples from EdgeR analysis between all readthroughs of IAA or UT conditions of CPSF4 and METTL3 with linear regression fitting. (B) Important readthrough loci (with a minimum of 3 readthroughs) for CPSF4 in blue, METTL3 in magenta and MORC in green displayed as log2 fold changes of chimera over normal transcript ratios in IAA versus UT conditions. Specific examples are highlighted and defined if the gene has a known function. The red line indicates the log2 fold changes cutoff of 1. (C) Density profiles from both illumina RNA-seq data (top) and aligned DRS reads (bottom) both before and after the IAA-dependent knockdown of CPSF4, positive strand reads in magenta and negative strand reads in blue. For the illumina RNA-seq, the RNAs were extracted from untreated cells as well as after 7, 24, and 48 hr of KD-inducing IAA treatment. RPKM values are shown on the y axis, and chromosomal positions are indicated on the x axis. For the nanopore the RNAs were extracted from UT versus 24 IAA treatment. Below is a schematic representation of the different RNAs expressed at the TGME49_204330 locus, based on the FLAIR analysis of the CPSF4 KD condition. Exons are shown with colored thick bars and introns with thin lines. The read-through into the TGME49_204325 locus is displayed, as well as the differential splicing outcomes on the respective exons, resulting in chimeric RNAs.
Figure 8—figure supplement 2
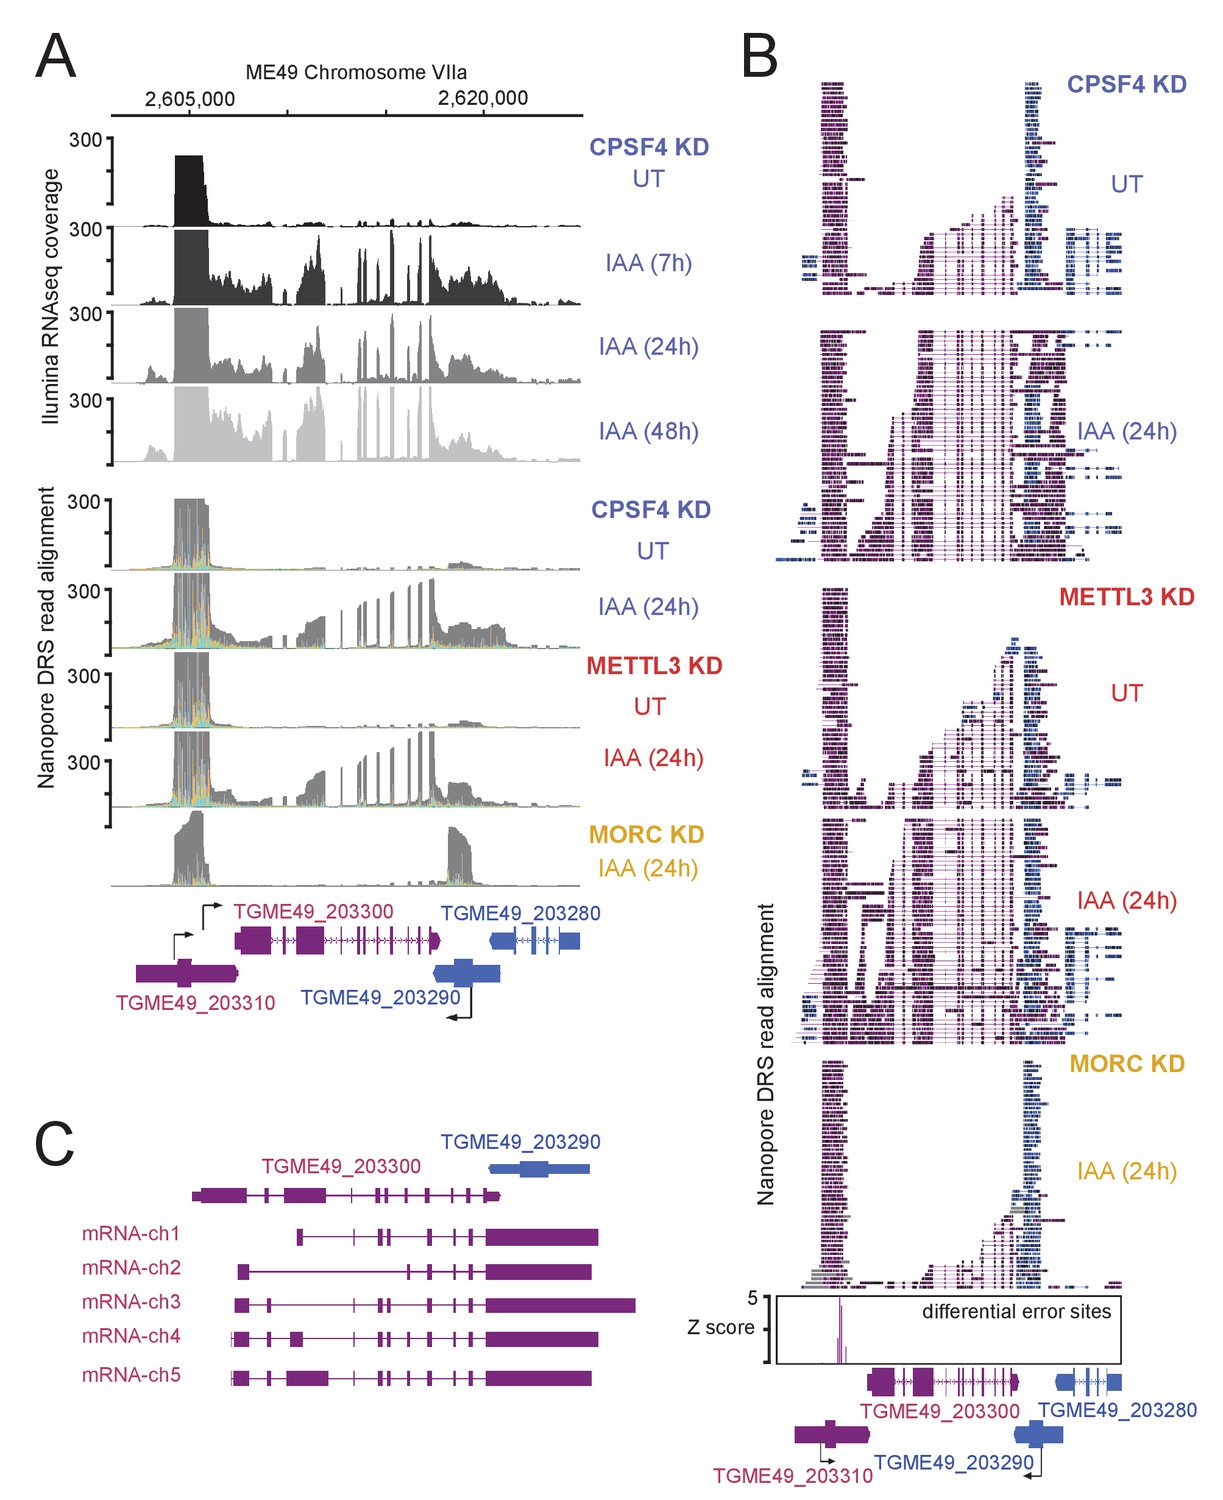
Read-through events and chimeric RNAs detected near TGME49_203300 locus following CPSF4 and METTL3 post-translational knock-down.
(A) and (B) A representative analysis of the read-through from the TGME49_203300 into the TGME49_203290 locus. (A) On top are displayed the illumina-RNA-seq data before and after the IAA-dependent KD of CPSF4, at different times. The y-axis represents the RPKM values. Below are DRS derived multi-way pileup of RNAs extracted before and after the IAA-dependent knock-down of METTL3 (in red), of CPSF4 (in blue) and of MORC (in yellow). (B) Corresponding aligned DRS reads within a sorted 50 representative read pileup with positive strand reads in magenta and negative strand reads in blue. Exons are shown with colored thick bars and introns thin lines. The nanopore differential error sites (Z-score >5) are shown as blue histograms. (C) FLAIR-derived read-through isoforms into the TGME49_203290 locus and beyond are displayed, as well as the differential splicing outcomes on the respective exons, resulting in chimeric RNAs.
Figure 9
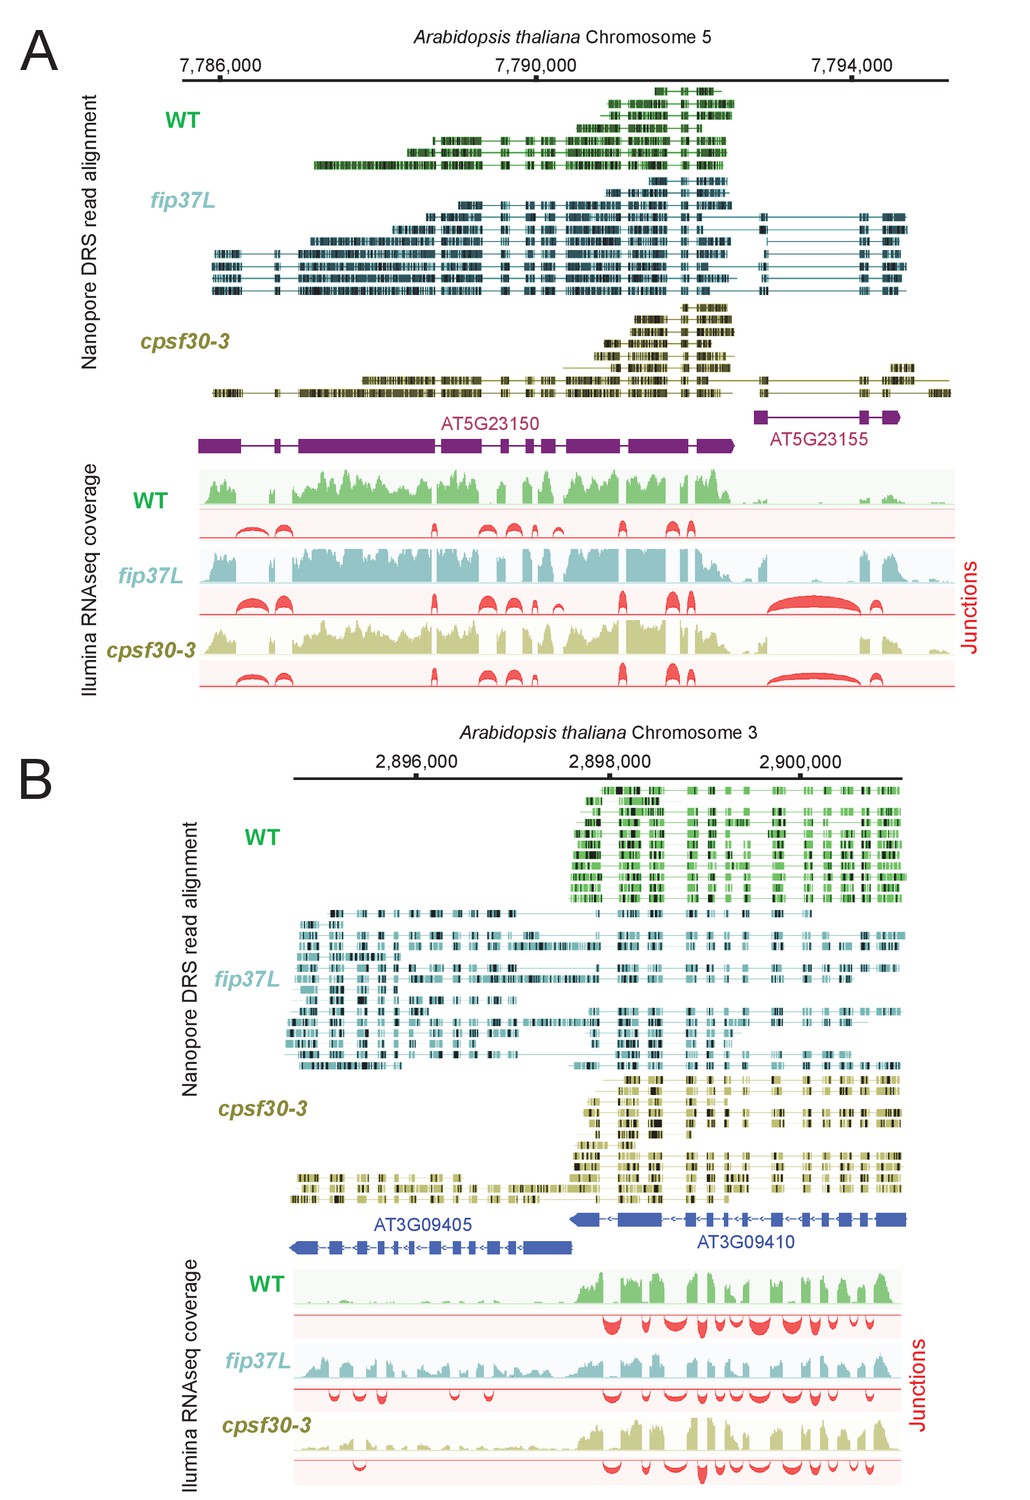
The CPSF4 homologue in plants (CPSF30L), similarly to T. gondii, prevents the formation of RNAs readthrough.
(A) DRS aligned reads (top) and illumina RNA-seq density plots (bottom) of the AT5G23150-AT5G23155 loci displaying a readthrough when the RNAs are extracted from plants harboring either the fip37L mutation (Fip37 is an m6A methyltransferase auxiliary factor), or the CPSF30-3 mutation which specifically abrogates the CPSF30L mRNA production (see Figure 1—figure supplement 1D) thus allowing an assessment of the roles of the YTH domain. The illumina RNA-seq data are represented by sashimi plots showing the differential splicing outcomes on the introns, in the backgrounds of these mutations. (B) Density profiles from both Nanopore RNA-sequencing (top) and illumina RNA-seq data (bottom) of the AT3G09410 - AT3G09405 loci. Similar description as in (A).
Figure 10 with 1 supplement

Differential error rate analysis identifies sites of METTL3-dependent m6A modifications transcriptome-wide in T. gondii.
(A) Circos plot showing the distribution across the 13 T. gondii chromosomes of the m6A sites predicted based on peaks corresponding to differential error rates determined after depletion of METTL3. (B) The motif at error rate sites matches the consensus m6A target sequence. The sequence logo is for the motif enriched at sites with differential error rate in T. gondii METTL3 KD (left logo) and A. thaliana fip37L mutant (right logo) (C) Metagene plot showing average Z-score of differential error sites along a normalized transcript with a clustered Z-score heatmap displaying individual transcripts with a sufficient depth for analysis (>50 reads). The m6A mark is most abundant in annotated 3’-UTRs. (D) Detection by nanopore of a large chimeric mRNA originated from the readthrough of TGME49_222860 into the TGME49_222840 locus and on the opposite strand the impaired termination at TGME49_222850. The nanopore differential error sites and the alignment of sequences containing the m6A motif of T. gondii strains are shown. (E) Schematic representation of the different RNAs expressed at the TGME49_294200 locus upon METTL3 depletion, based on nanopore-mapped reads. Exons are shown with colored thick bars and introns with thin lines. The read-through beyond the locus boundaries is displayed, as well as the differential splicing outcomes on the respective exons, resulting in chimeric RNAs. (F) Schematic representation of the nanopore mapped RNA reads illustrating the readthrough from TGME49_285930 into the TGME49_285920 locus following the KD of METTL3. Exons are shown with colored thick bars and introns with thin lines. The nanopore differential error sites (Z-score >50) are indicated and a zoomed peak-centered view shows the sequence containing m6A consensus motif across the three canonical strains of T. gondii.
Figure 10—figure supplement 1
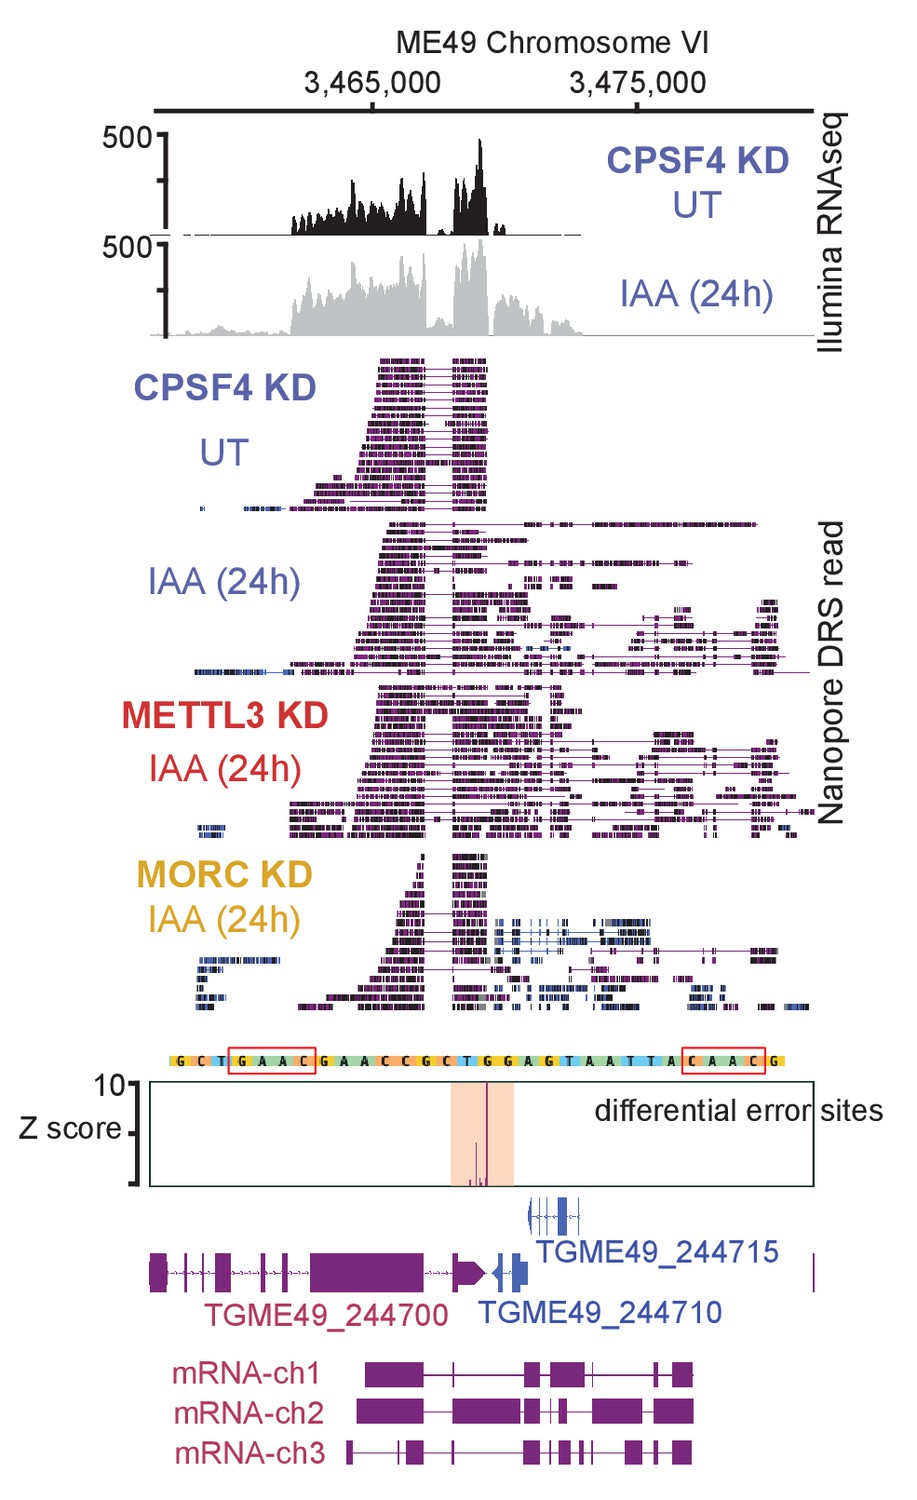
Read-through events and chimeric RNAs detected near TGME49_244700 locus following CPSF4 and METTL3 post-translational knock-down.
A representative analysis of the read-through from the TGME49_244700 into the adjacent genes TGME49_244710 and TGME49_244715. On top are displayed the illumina-RNA-seq data before and after the IAA-dependent KD of CPSF4, at 24 hr. The y-axis represents the RPKM values. Below is the nanopore-based RNA sequencing of RNAs extracted before and after the IAA-dependent knock-down of CPSF4 (in blue), METTL3 (in red), and of MORC (in yellow). A more detailed close-up look is represented right below of the respective nanopore data allowing a clear assessment of the read-through phenotype that is seen following the KD of both CPSF4 and METTL3 but not of MORC which only resulted in a conventional upregulation of the initially repressed TGME49_244710 and TGME49_244715 genes. At the bottom is a schematic representation of the different RNAs expressed (readthrough differentially spliced chimeric RNAs) at these loci, based on the nanopore-mapped reads following the KD of METTL3. Exons are shown with colored thick bars and introns with thin lines. The nanopore differential error sites and the alignment of sequences containing the m6A motif of T. gondii strains are shown.
Figure 11

CPSF4 and METTL3 both acts to prevent the readthrough into developmentally regulated genes.
(A) A heat map representation showing mRNA hierarchical clustering analysis (Pearson correlation) of a set of genes targeted by the readthrough phenotype following the KD of CPSF4 and METTL3, and which have been already established to be upregulated following the KD of MORC. Displayed are the abundance of their respective transcripts before and after the depletion of MORC (Farhat et al., 2020), as well as during the different life cycle stages the data of which are collected from ToxoDB published transcriptomes of merozoite, longitudinal studies on enteroepithelial stages (EES1 to EES5), tachyzoites, bradyzoites, and cysts from both acute and chronically infected mice, and finally of immature (day 0), maturing (day 4) and mature (day 10) stages of oocyst development. The color scale indicates log2-transformed fold changes. (B) A representative analysis of the read-through from the ROP35 transcript into the TGME49_304730 locus. On top are displayed the illumina-RNA-seq data before and after the IAA-dependent KD of CPSF4, at different times. The y-axis represents the RPKM values. Below is the nanopore-based RNA sequencing of RNAs extracted before and after the IAA-dependent knock-down of METTL3 (in red), of CPSF4 (in blue), and of MORC (in yellow). The y-axis represents the read-depth counts. (C) A more detailed close-up look of the respective nanopore data at the same locus allowing a clear assessment of the read-through phenotype that is seen following the KD of both CPSF4 and METTL3 but not of MORC which only resulted in a conventional upregulation of the initially repressed TGME49_304730 gene. The accuracy of the nanopore data is seen here with the relative repression of the ROP35 gene following the KD of MORC, as seen in the illumina RNA-seq data (Farhat et al., 2020). The number of the mapped reads was adjusted between the data from the different experimental conditions. (D) A schematic representation of the nanopore mapped RNA reads illustrating the readthrough from ROP35 into the TGME49_304730 locus following the KD of CPSF4 and of METTL3, but not after the KD of MORC which only resulted in a conventional transcriptional upregulation of the initially repressed TGME49_304730 gene. Exons are shown with colored thick bars and introns with thin lines.
Additional files
-
Supplementary file 1
Table: Mass spectrometry quantitation of proteins from T. gondii CPSF and m6A writer complexes.
Mass spectrometry-based proteomic analysis of Flag elution identified CPSF1, WDR33, Fip1, PAP, METTL3, METTL14, and WTAP and their partners. The identities of the proteins (accession number on ToxoDB, gene name, and description) are indicated. For each protein, MaxQuant reports an intensity-based absolute quantification (iBAQ) value, a measure of protein abundance.
- https://cdn.elifesciences.org/articles/68312/elife-68312-supp1-v2.xlsx
-
Supplementary file 2
Table: Crystallography data statistics.
- https://cdn.elifesciences.org/articles/68312/elife-68312-supp2-v2.pdf
-
Supplementary file 3
Table: Analysis of Illumina high-throughput RNA-Seq data of the CPSF4 KD parasite line of T. gondii, related to Figure 7—figure supplement 1B.
RNA-Seq report, Raw counts of T. gondii transcripts generated by feature Counts (Subread), Normalized T. gondii transcripts (TPM), Differential expression analysis (iDEP.92), data used in volcano plot (48 hr vs UT).
- https://cdn.elifesciences.org/articles/68312/elife-68312-supp3-v2.xlsx
-
Supplementary file 4
Figure – Read-through events and chimeric RNAs detected on T. gondii chromosomes following CPSF4 and METTL3 post-translational knock-down.
- https://cdn.elifesciences.org/articles/68312/elife-68312-supp4-v2.pdf
-
Supplementary file 5
Figure - Read-through events and chimeric RNAs detected on A. thaliana chromosome 1, 2, and 5 in the context of fip37L and cpsf30-3 mutants.
- https://cdn.elifesciences.org/articles/68312/elife-68312-supp5-v2.pdf
-
Supplementary file 6
Table: T. gondii strains, vectors, and primers.
List of T. gondii parasite strains and transgenic lines as well as plasmids used in this work. Primers and DNA construct used in this work are also charted in the table.
- https://cdn.elifesciences.org/articles/68312/elife-68312-supp6-v2.xlsx
-
Supplementary file 7
Full wwPDB X-ray structure validation report of crystal structure of Toxoplasma CPSF4-YTH domain in apo form (PDB ID: 7NG2).
- https://cdn.elifesciences.org/articles/68312/elife-68312-supp7-v2.pdf
-
Supplementary file 8
Full wwPDB X-ray structure validation report of crystal structure of Toxoplasma CPSF4-YTH domain bound to m6A (PDB ID: 7NH2).
- https://cdn.elifesciences.org/articles/68312/elife-68312-supp8-v2.pdf
-
Supplementary file 9
Full wwPDB X-ray structure validation report of crystal structure of the Toxoplasma CPSF4 YTH-domain in complex with a seven mer m6A-modified RNA (PDB ID: 7NJC).
- https://cdn.elifesciences.org/articles/68312/elife-68312-supp9-v2.pdf
-
Transparent reporting form
- https://cdn.elifesciences.org/articles/68312/elife-68312-transrepform-v2.docx
Download links
A two-part list of links to download the article, or parts of the article, in various formats.
Downloads (link to download the article as PDF)
Open citations (links to open the citations from this article in various online reference manager services)
Cite this article (links to download the citations from this article in formats compatible with various reference manager tools)
A plant-like mechanism coupling m6A reading to polyadenylation safeguards transcriptome integrity and developmental gene partitioning in Toxoplasma
eLife 10:e68312.
https://doi.org/10.7554/eLife.68312


