Evaluating distributional regression strategies for modelling self-reported sexual age-mixing
- Department of Mathematics, Imperial College London, United Kingdom
- MRC Centre for Global Infectious Disease Analysis, School of Public Health, Imperial College London, United Kingdom
- London School of Hygiene & Tropical Medicine, United Kingdom
- Manicaland Centre for Public Health Research, Biomedical Research and Training Institute, Zimbabwe
Figures
Figure 1
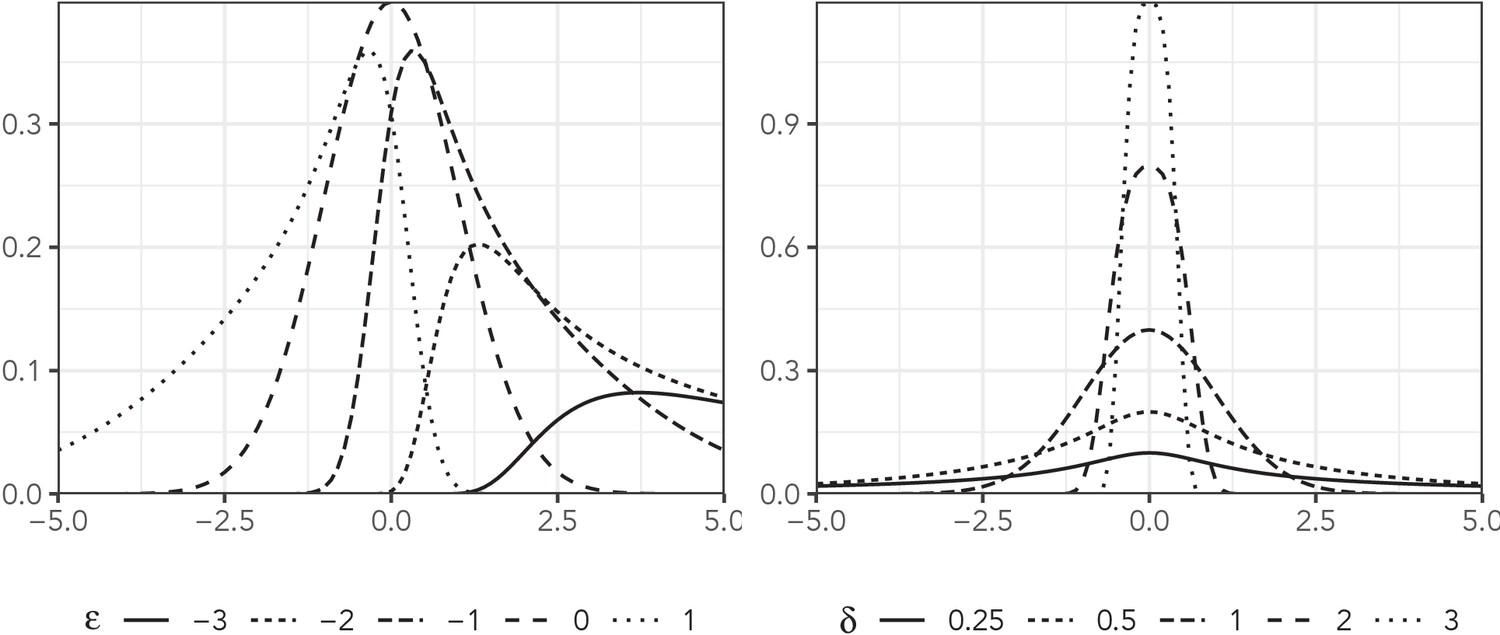
The sinh-arcsinh density with , , and a variety of assumptions about and δ.
Figure 2

Observed partner age distributions among women aged 34 years in all three data sets.
Figure 3

Observed means, variances, skewnesses, and kurtoses of partner age by 5-year age bin and sex in all three data sets.
Figure 4

Observed partner age distributions (grey bars) and posterior predictive partner age distributions (lines) for each probability distribution among women aged 35–39 in the AHRI data set.
Posterior predictive distributions come from fitting each age bin/sex combination independently.
Figure 5
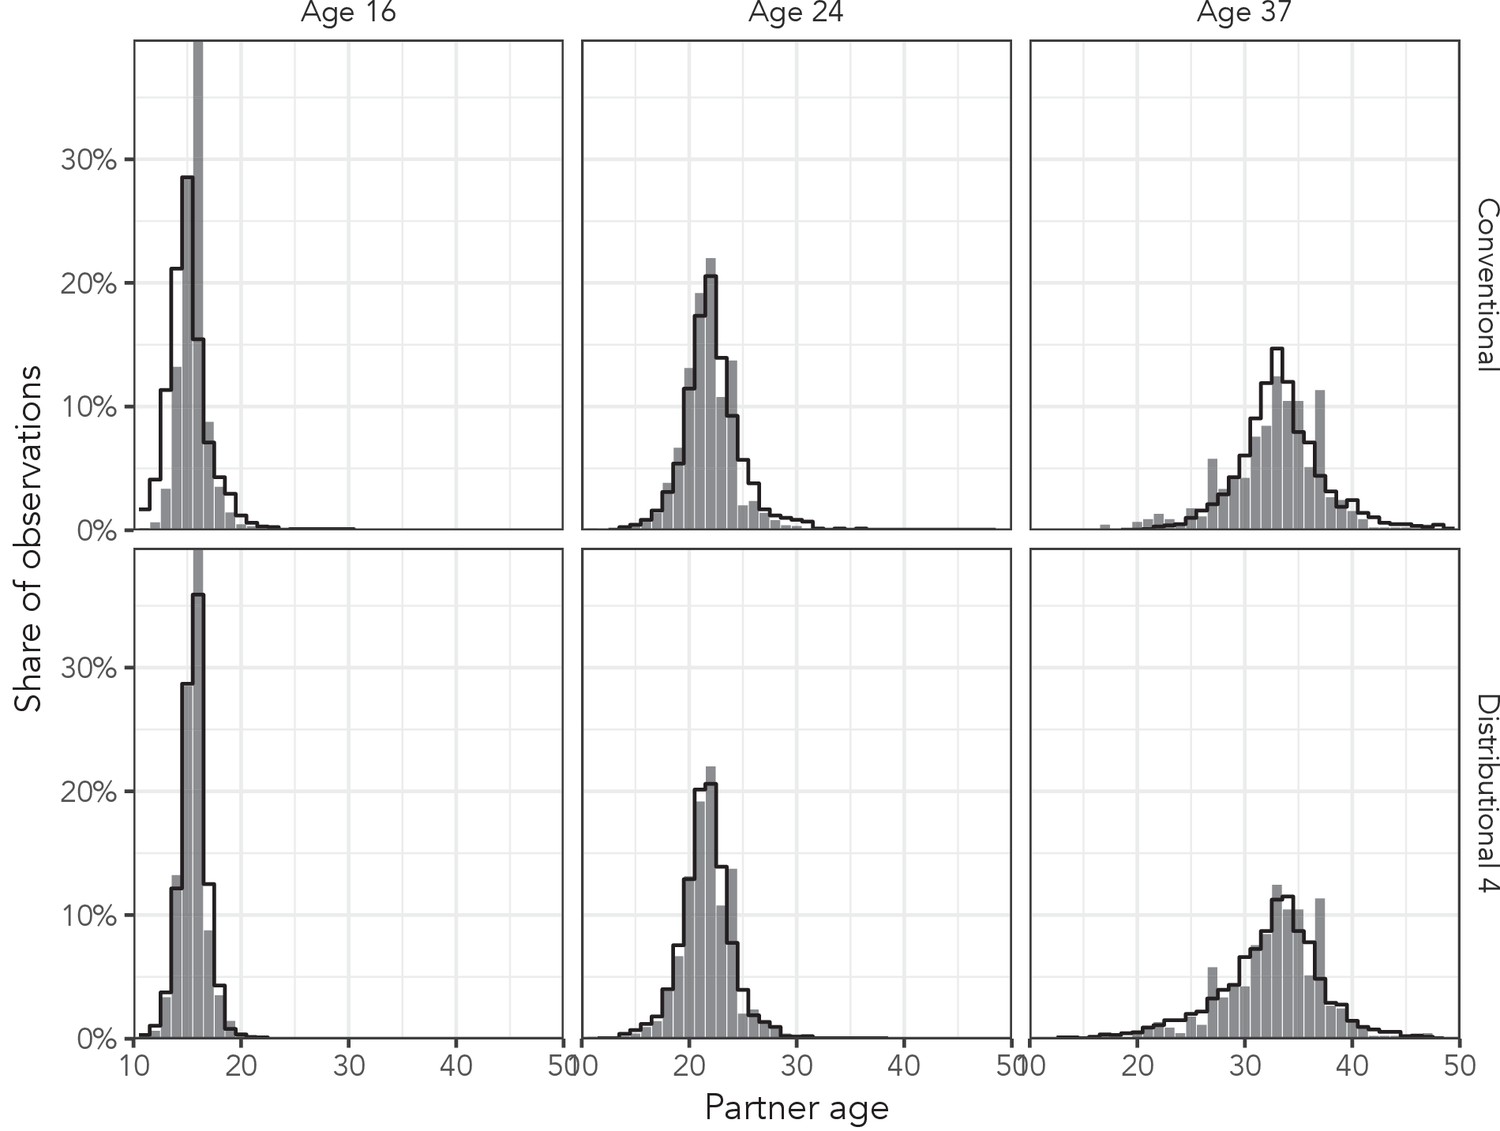
Observed partner age distributions (grey bars) and posterior predictive partner age distributions (lines) for conventional regression and the most complex distributional model among men aged 16, 24, and 37 years in the AHRI data set.
Posterior predictive distributions come from regression models fit to the entire AHRI data set.
Figure 6
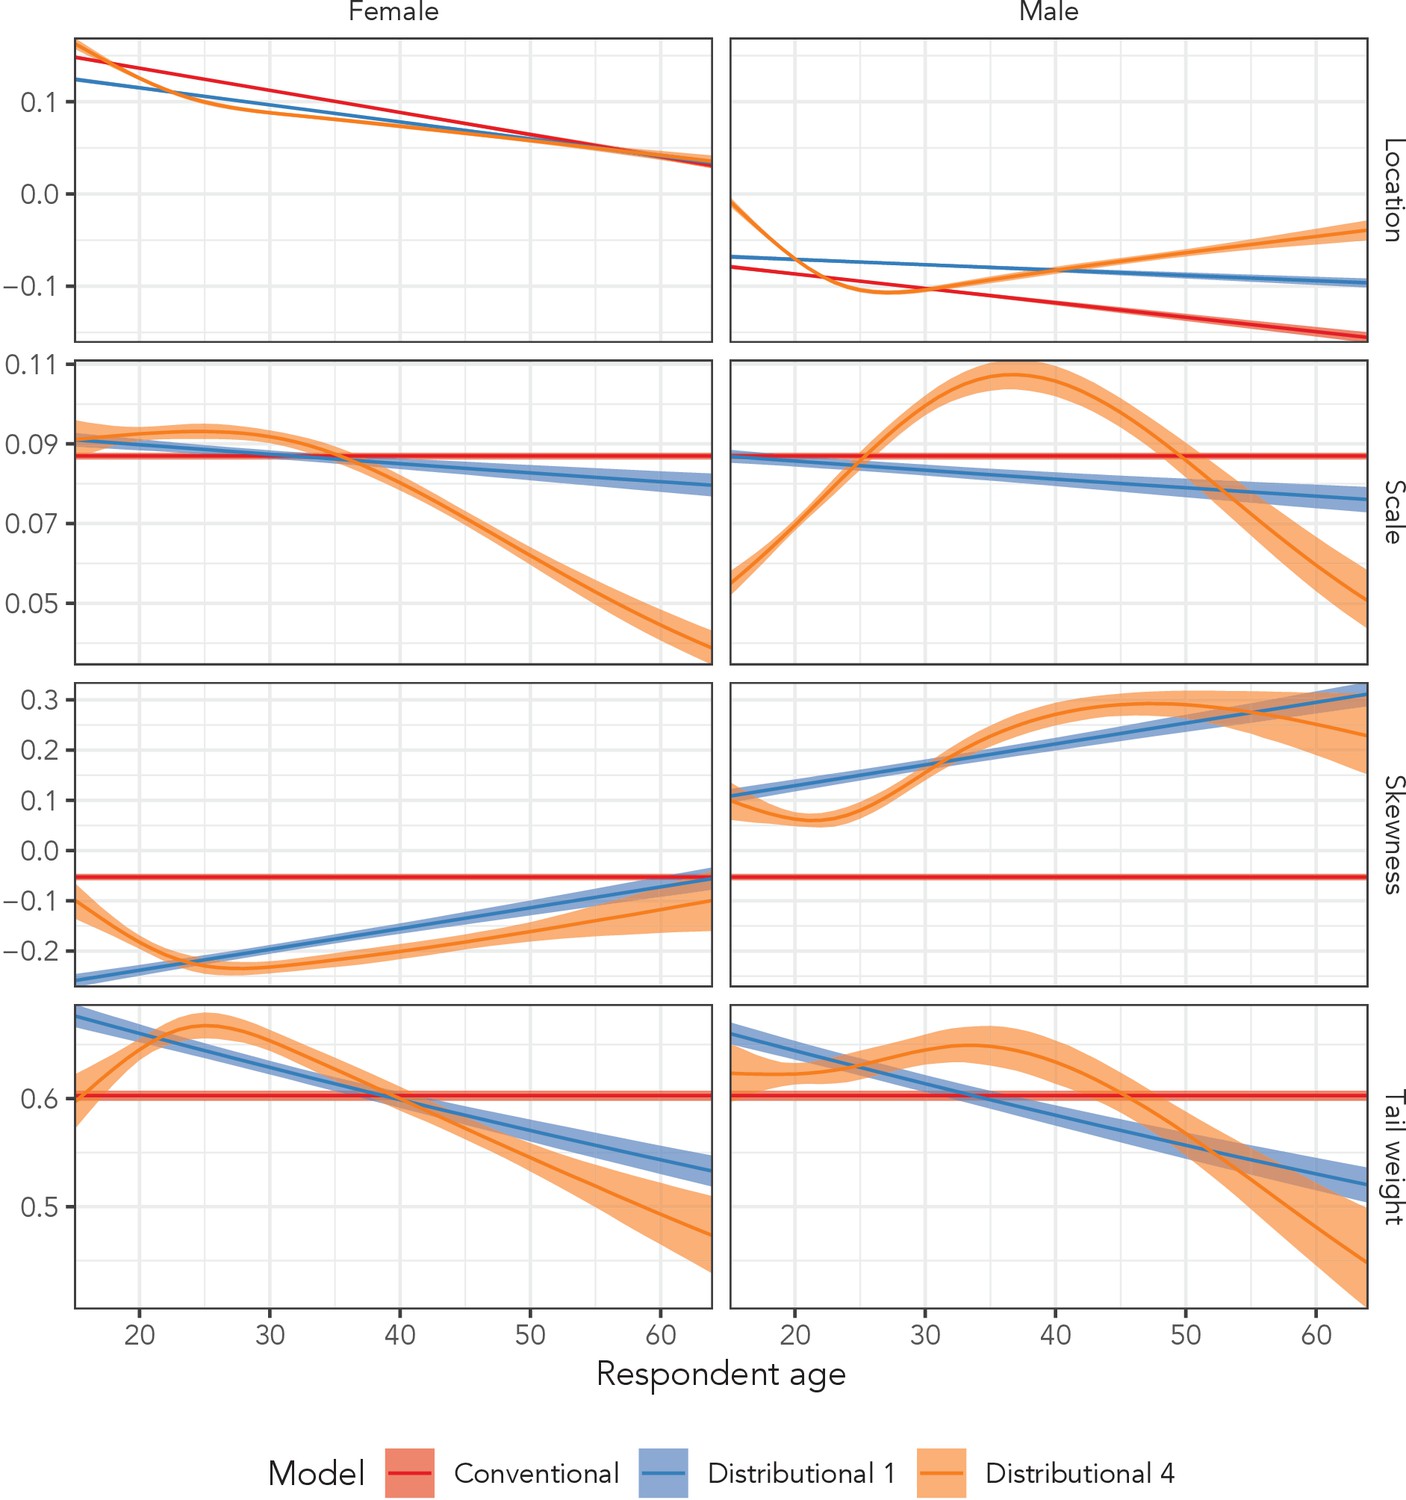
Estimated sinh-arcsinh distributional parameters from the conventional regression model, and distributional models 1 and 4 fit to the AHRI data.
‘Conventional’ assumes no variation across age and sex, ‘Distributional 1’ allows for independent age and sex effects, and ‘Distributional 4’ includes sex-specific splines with respect to age.
Figure 7
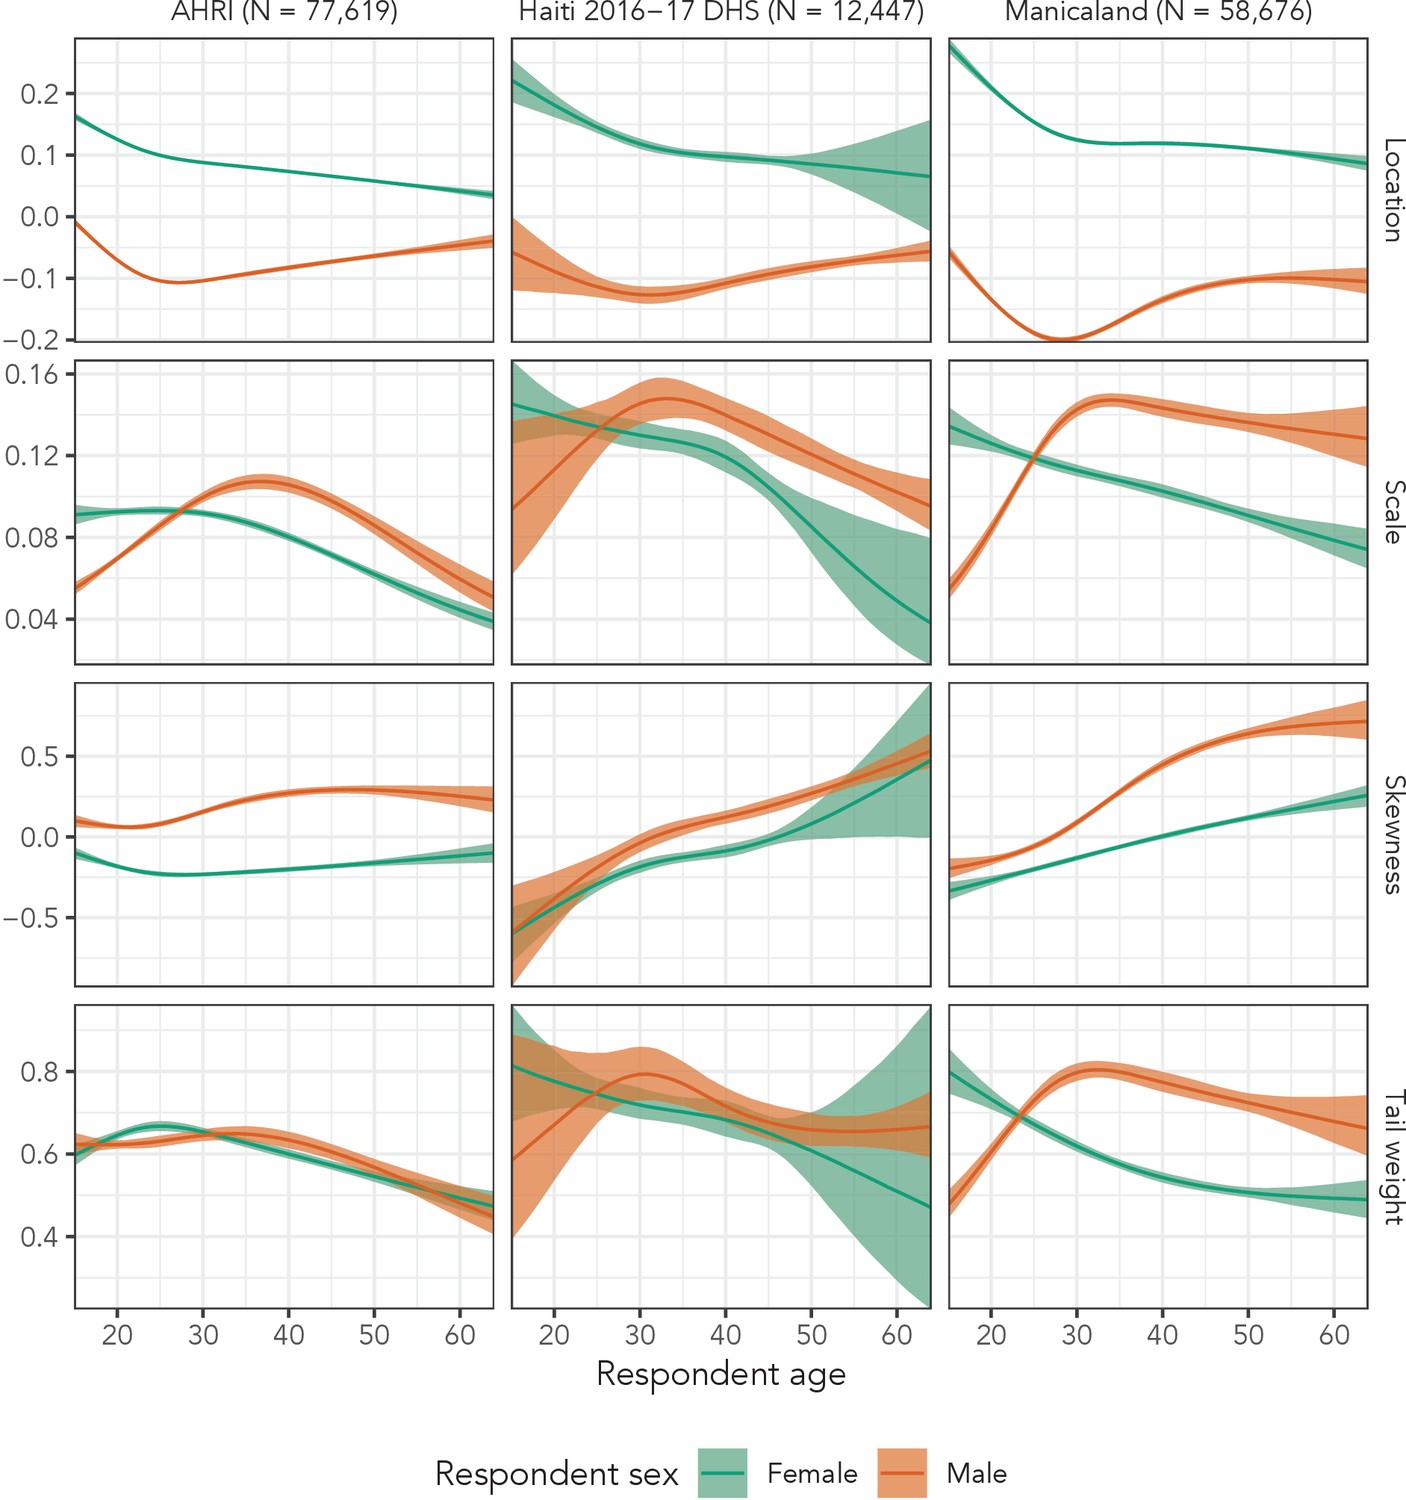
Estimated sinh-arcsinh distributional parameters for Distributional Model 4 fit to the three main data sets.
Appendix 1—figure 1

Illustration of the effect of the deheaping algorithm on women aged exactly 24 years in the AHRI data.
Dark grey bars correspond to ages identified as potentially heaped (multiples of five away from 24). The red line is the expected count of observations estimated by excluding any potentially heaped ages.
Appendix 1—figure 2
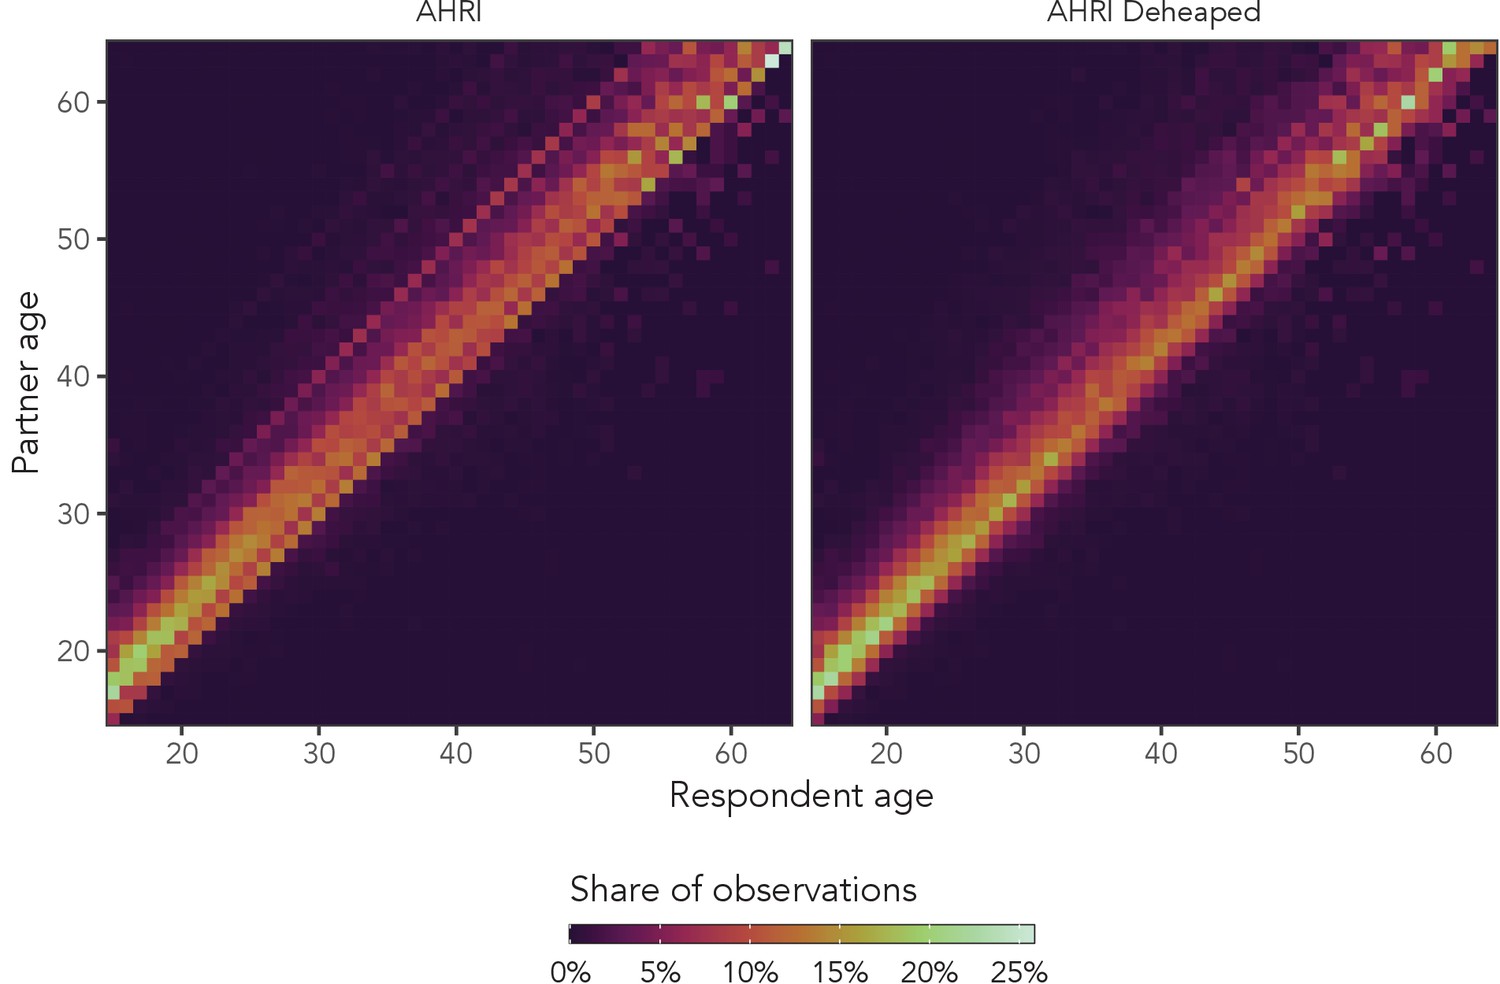
Observed sexual partner age distributions among women in the AHRI data.
The left panel is original data, and the right panel is the same data set after deheaping age differences from multiples of five.
Appendix 1—figure 3
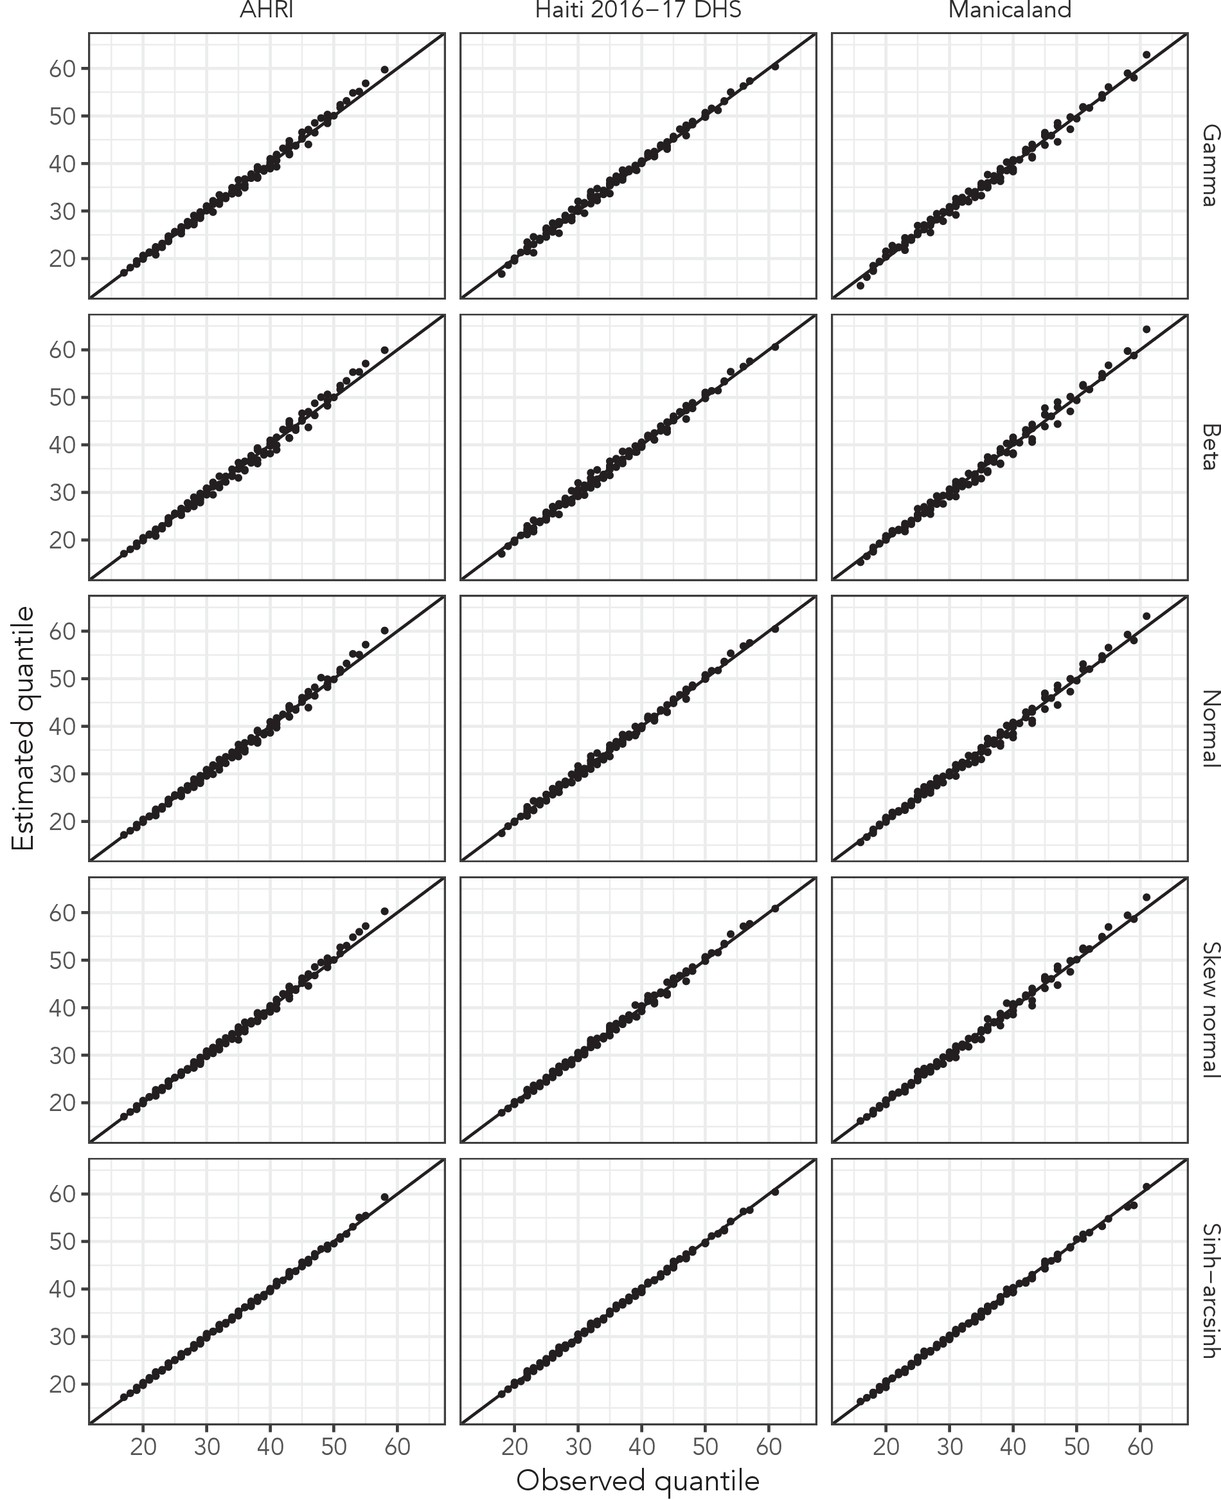
Overlaid quantile-quantile (QQ) plots for each probability distribution’s best fit to data in all three main data sets.
Presented quantiles range from 10th to 90th in increments of 10. Lines closer to the line of equality indicate better fit to empirical quantiles.
Appendix 1—figure 4
Observed partner age distributions (grey bars) and posterior predictive partner age distributions (lines) for each probability distribution among women in the AHRI data set.
Here, we plot the posterior predicitve distribution associated with each distribution’s highest-ELPD dependent variable.
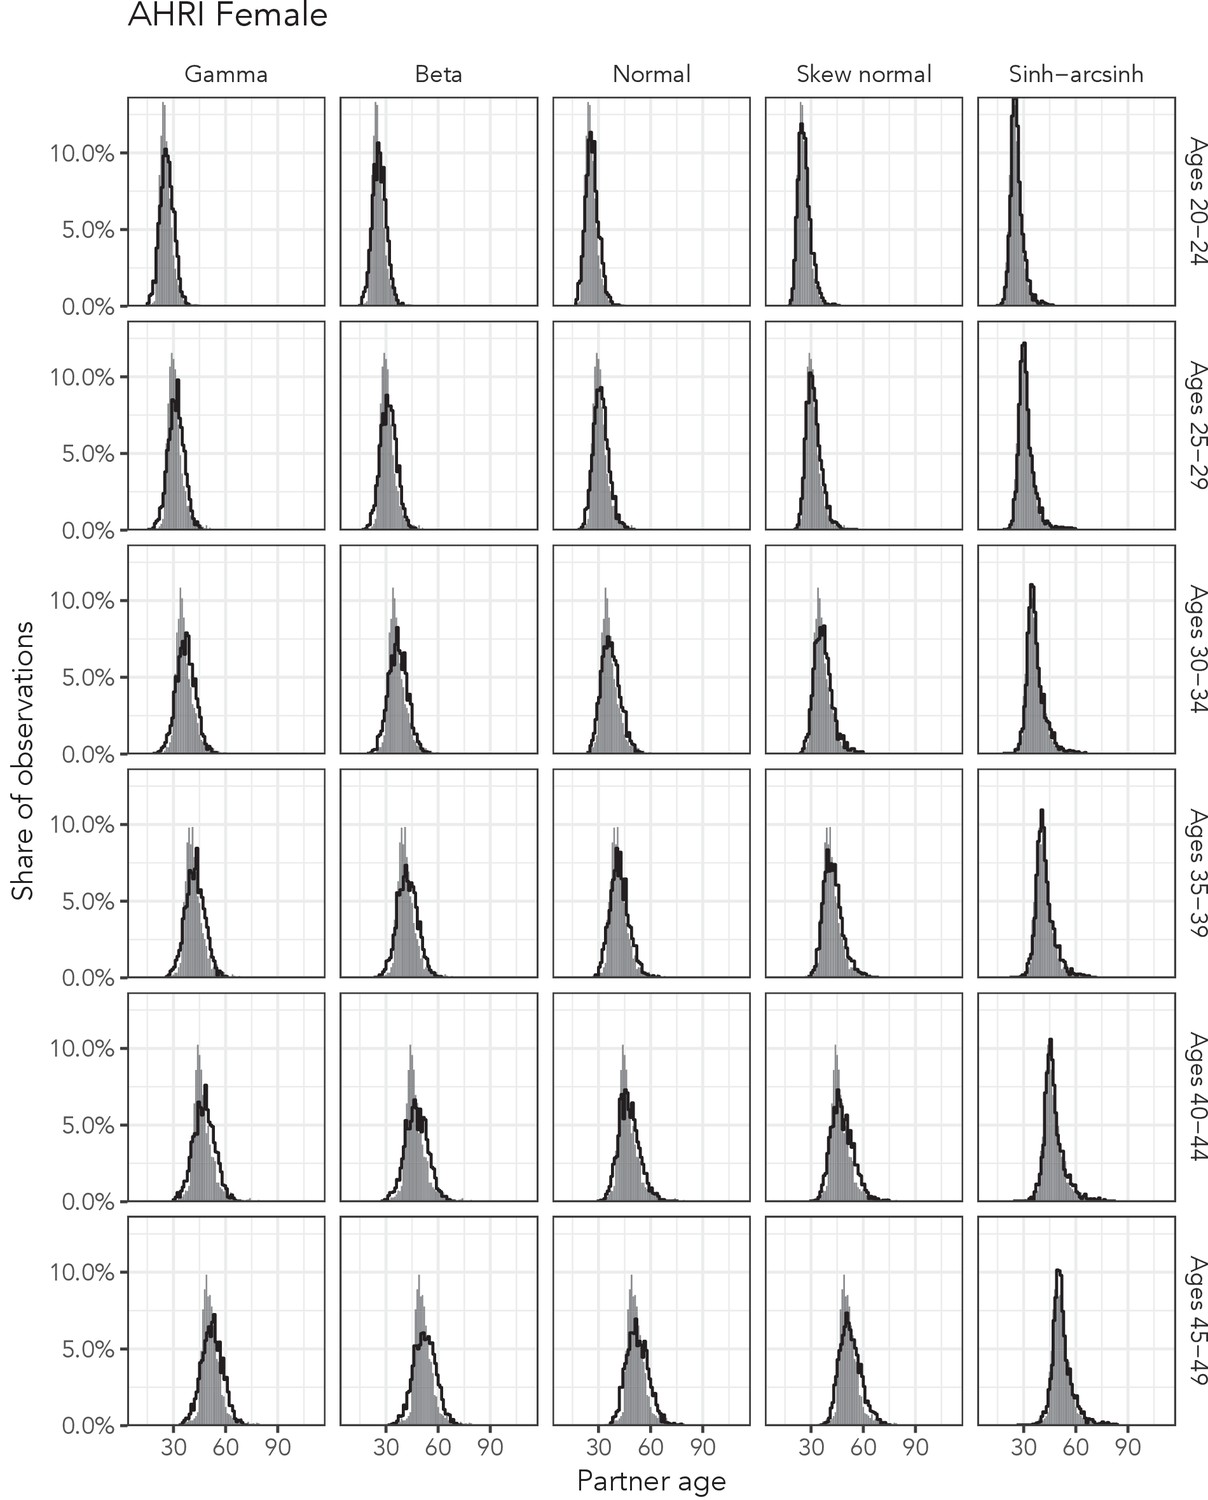
Appendix 1—figure 5
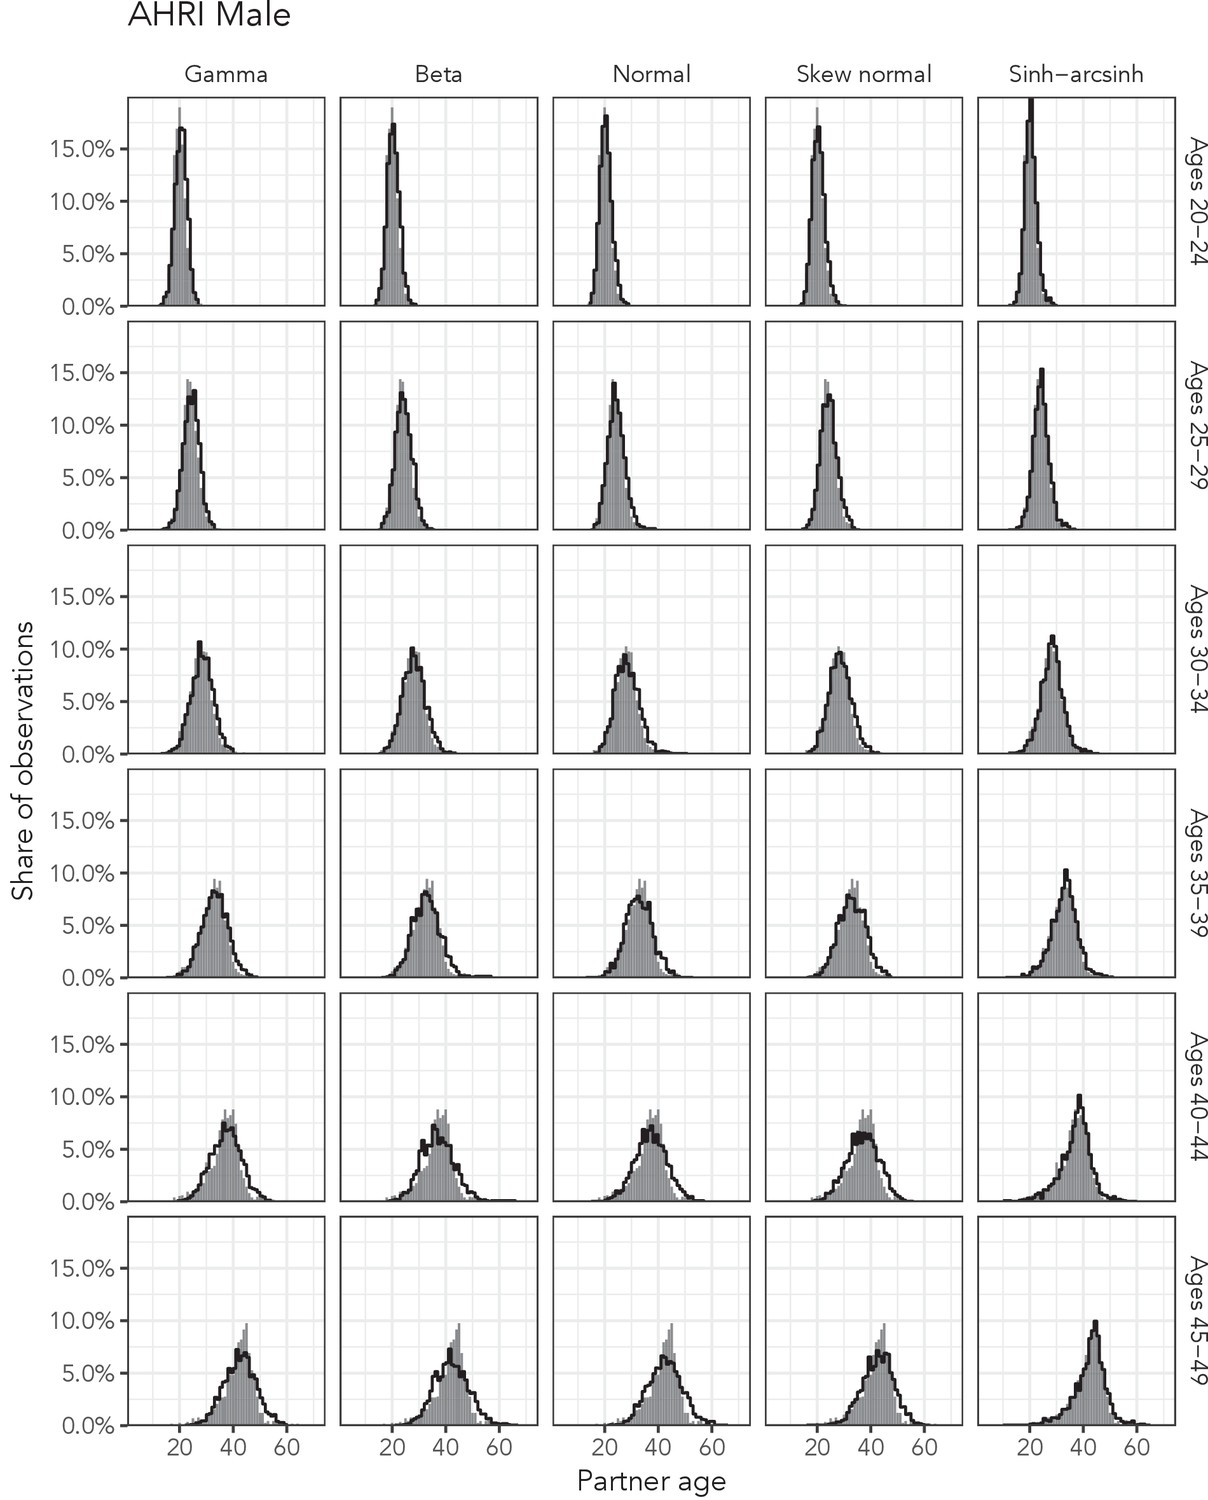
Observed partner age distributions (grey bars) and posterior predictive partner age distributions (lines) for each probability distribution among men in the AHRI data set.
Here, we plot the posterior predicitve distribution associated with each distribution’s highest-ELPD dependent variable.
Appendix 1—figure 6
Observed partner age distributions (grey bars) and posterior predictive partner age distributions (lines) for each probability distribution among women in the AHRI Deheaped data set.
Here, we plot the posterior predicitve distribution associated with each distribution’s highest-ELPD dependent variable.
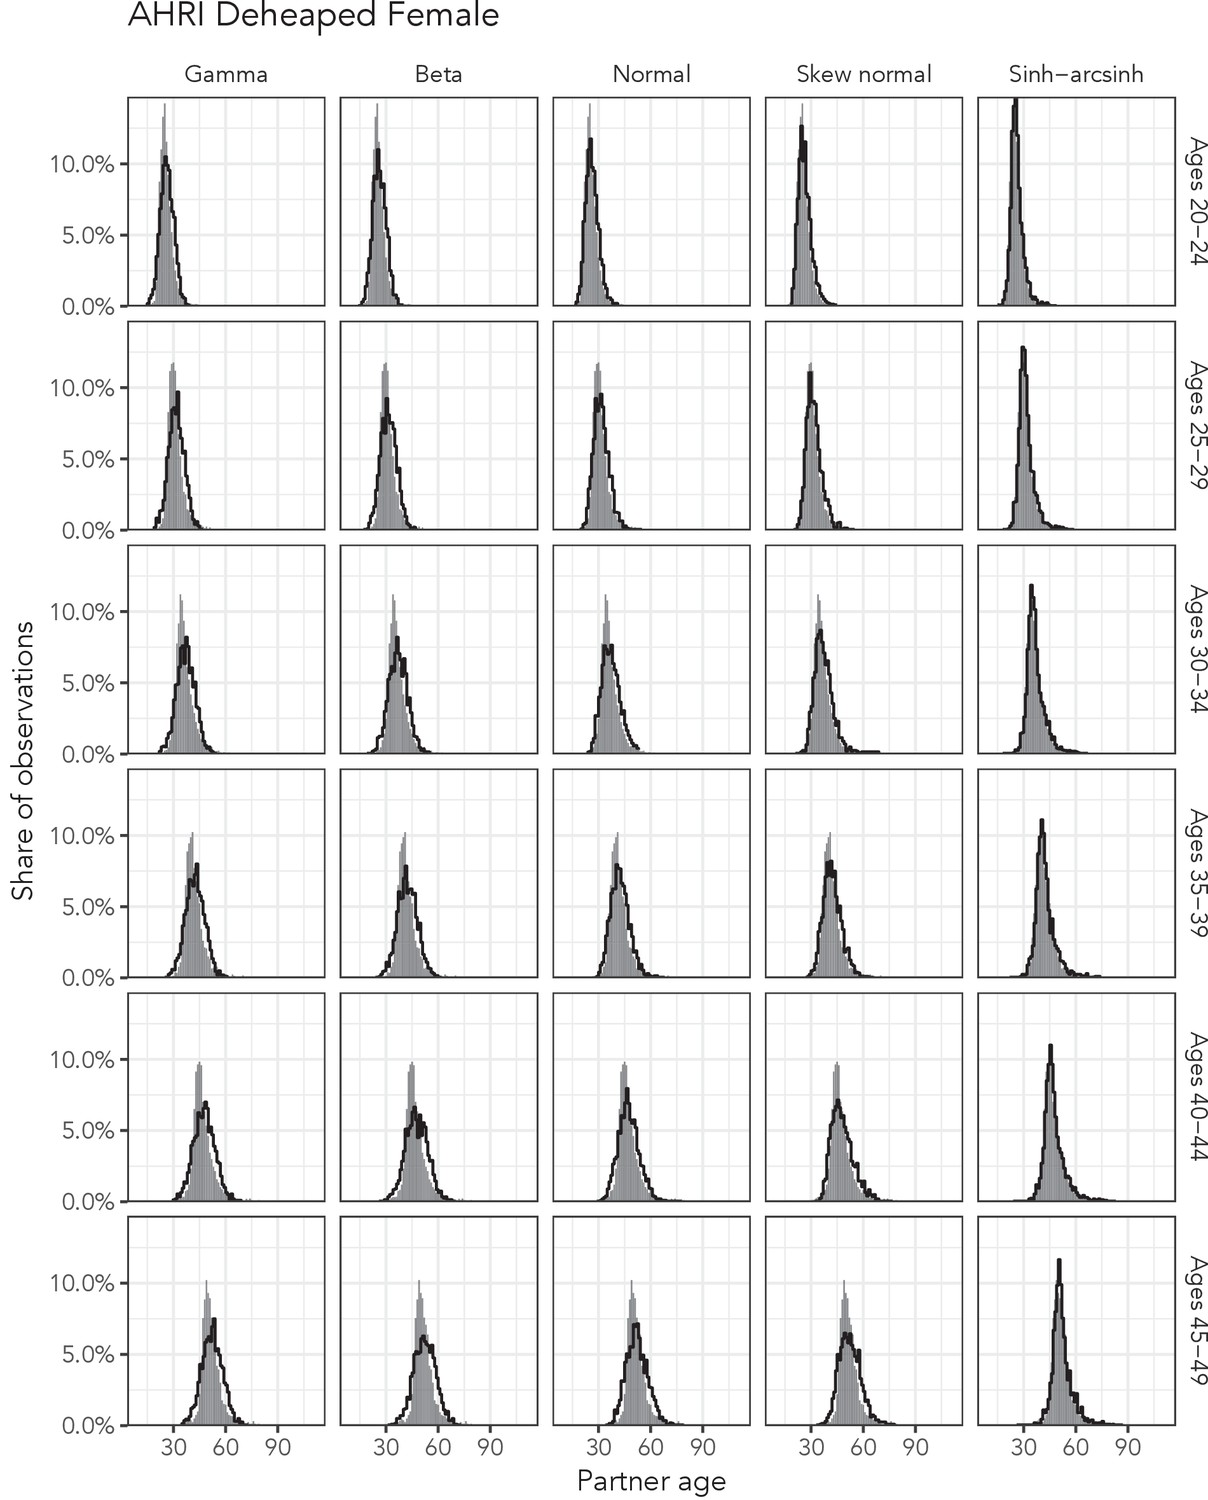
Appendix 1—figure 7
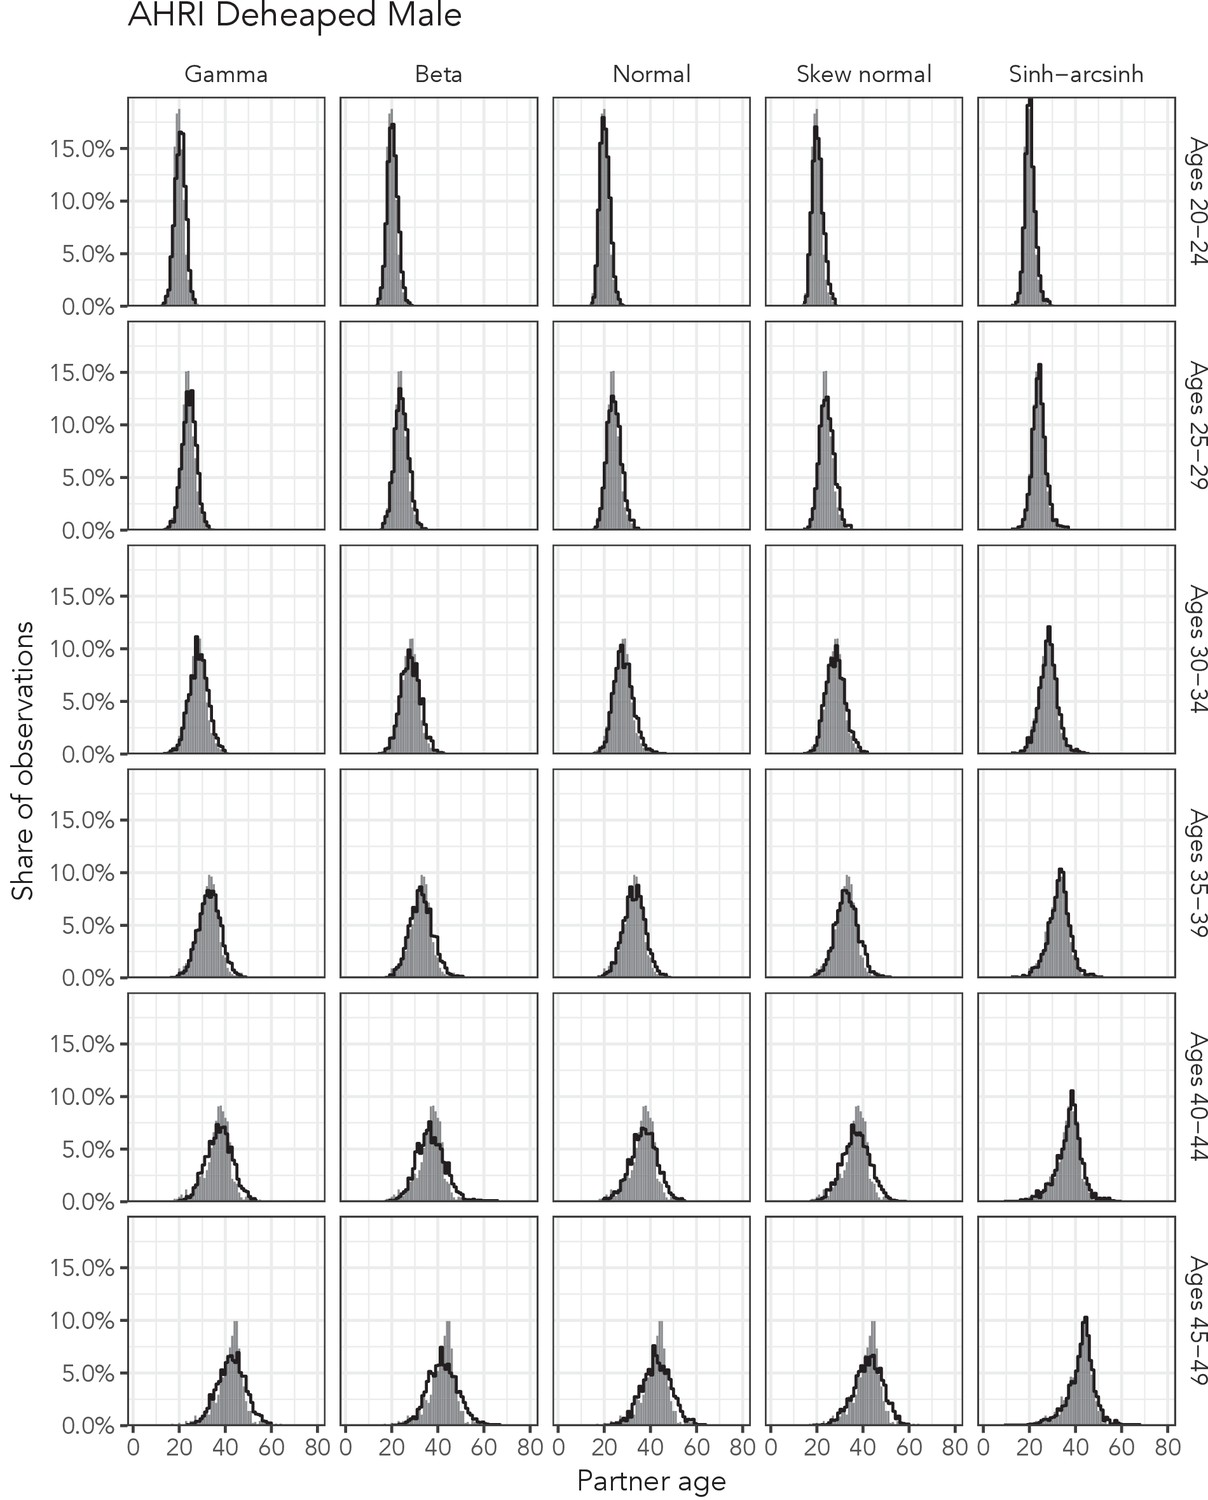
Observed partner age distributions (grey bars) and posterior predictive partner age distributions (lines) for each probability distribution among men in the AHRI Deheaped data set.
Here, we plot the posterior predicitve distribution associated with each distribution’s highest-ELPD dependent variable.
Appendix 1—figure 8

Observed partner age distributions (grey bars) and posterior predictive partner age distributions (lines) for each probability distribution among women in the Haiti 2016–17 DHS data set.
Here, we plot the posterior predicitve distribution associated with each distribution’s highest-ELPD dependent variable.
Appendix 1—figure 9
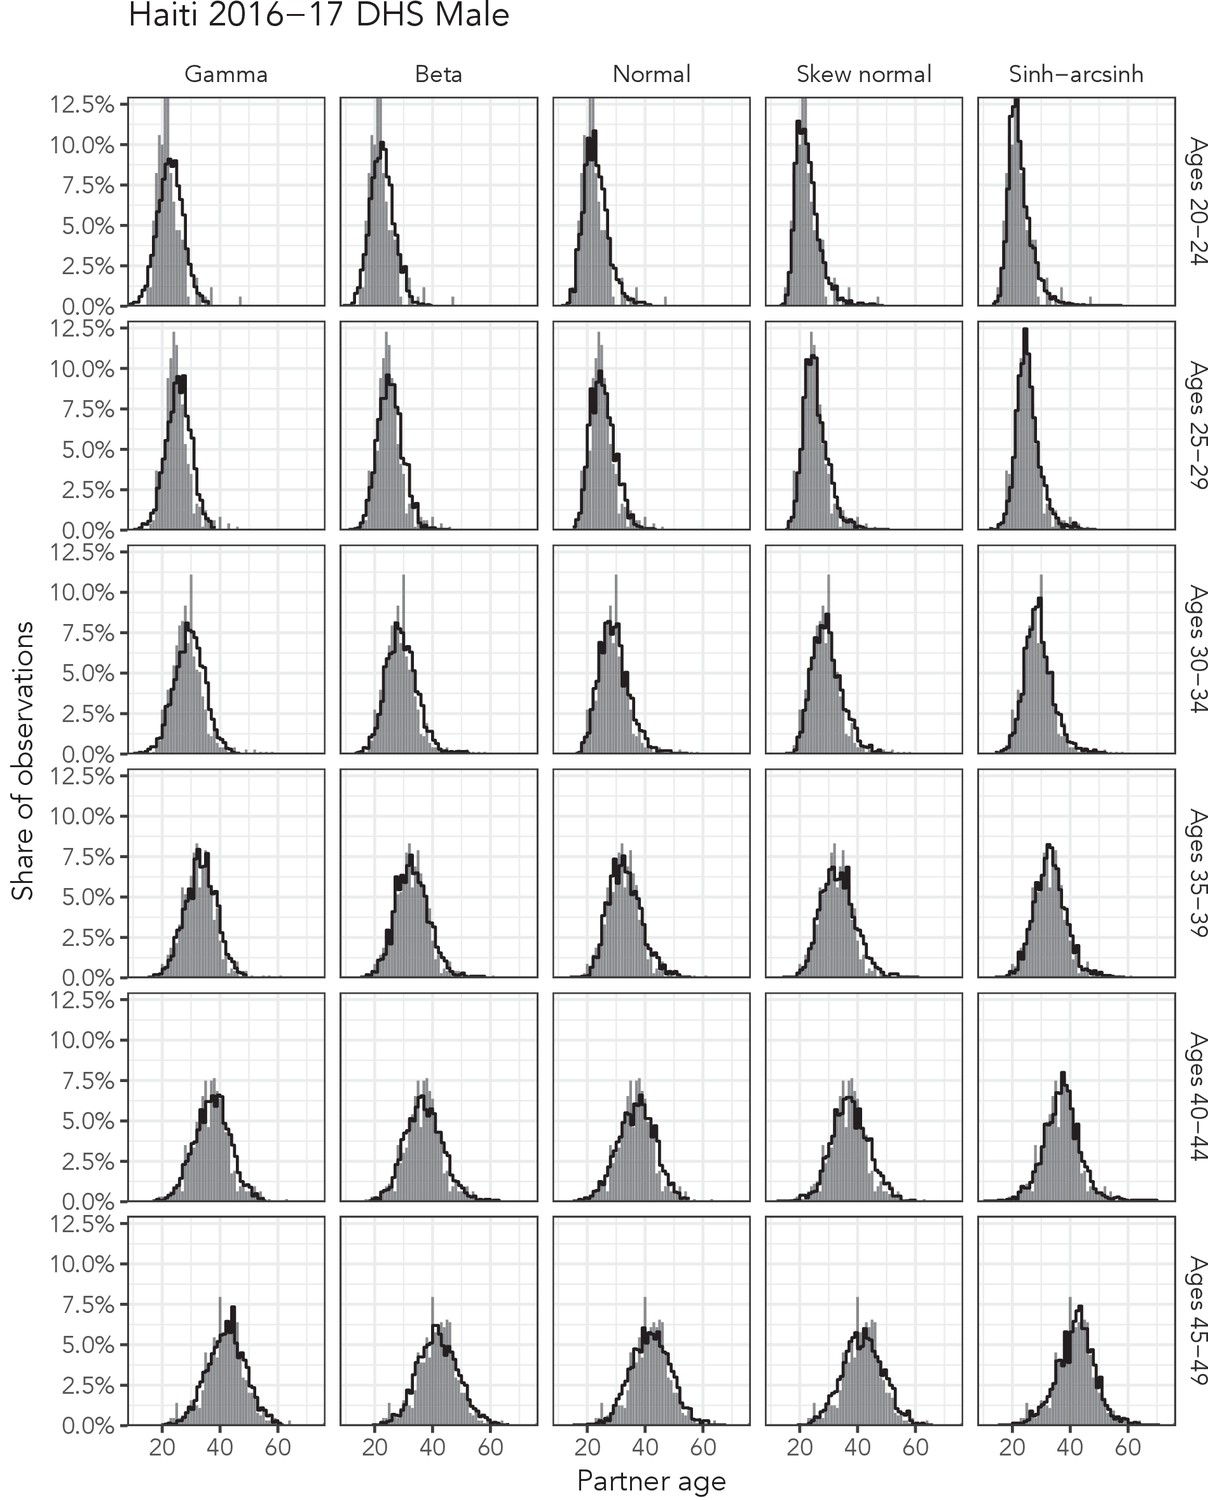
Observed partner age distributions (grey bars) and posterior predictive partner age distributions (lines) for each probability distribution among men in the Haiti 2016–17 DHS data set.
Here, we plot the posterior predicitve distribution associated with each distribution’s highest-ELPD dependent variable.
Appendix 1—figure 10
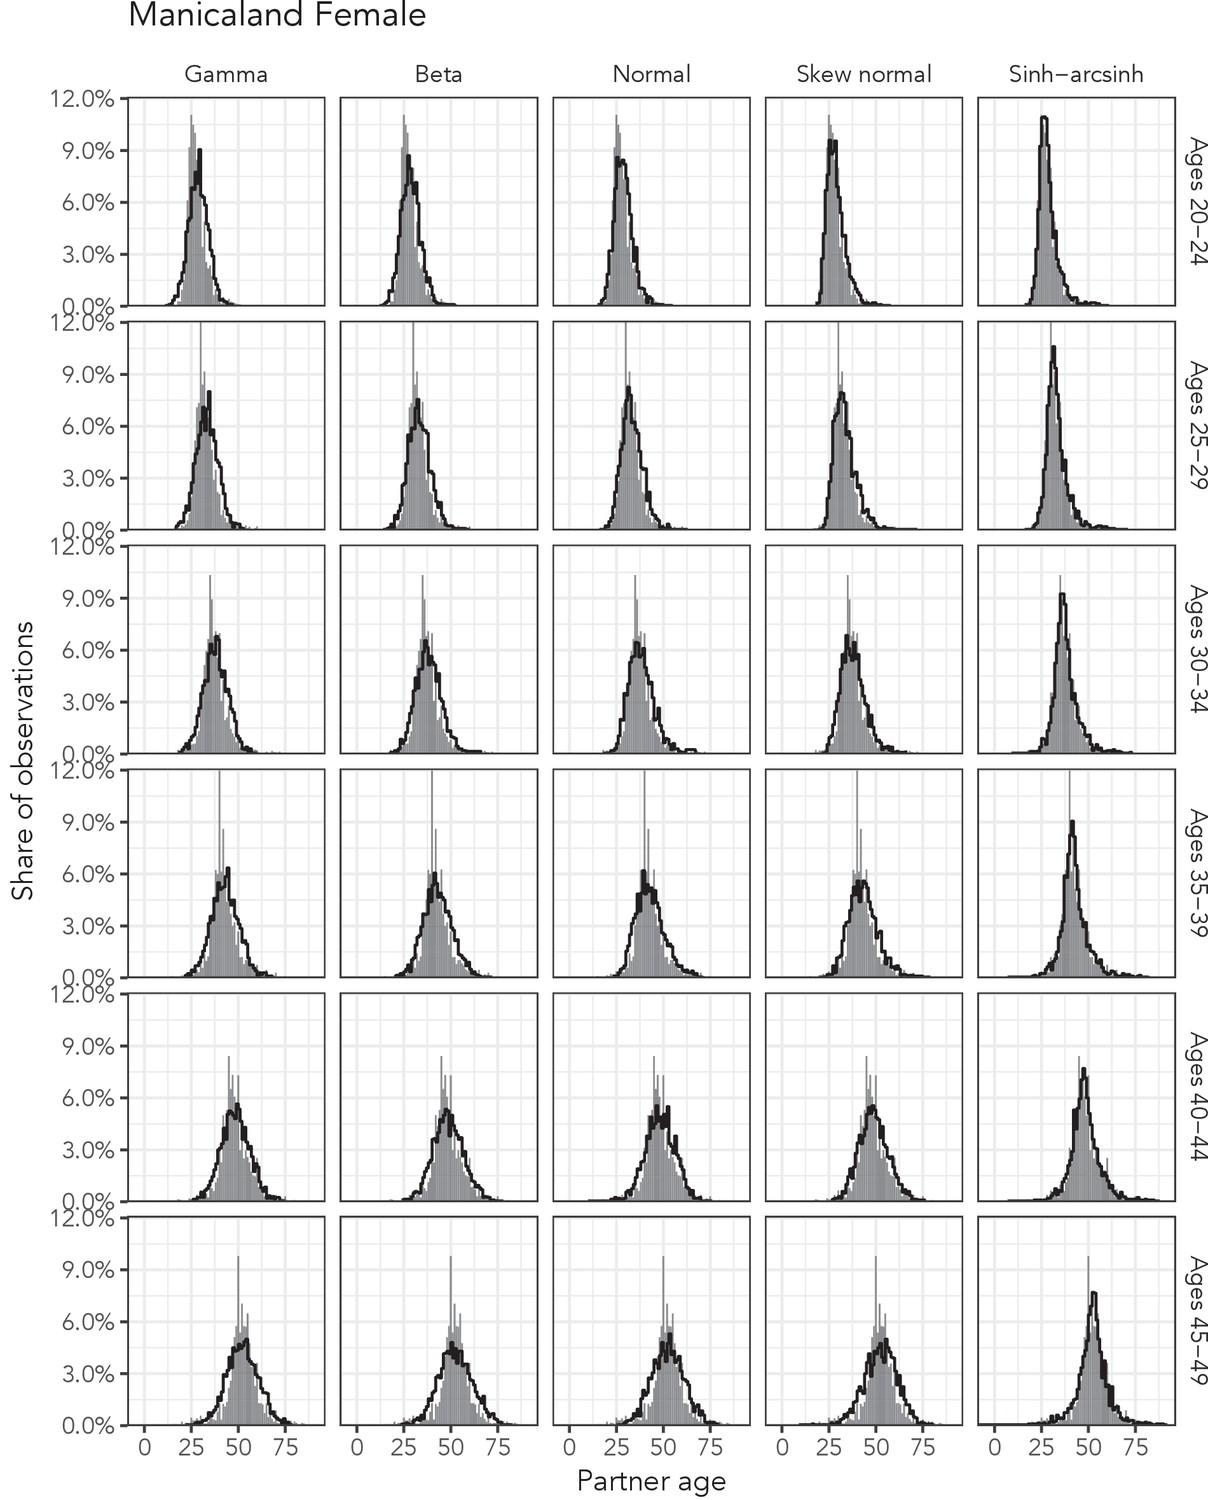
Observed partner age distributions (grey bars) and posterior predictive partner age distributions (lines) for each probability distribution among women in the Manicaland data set.
Here, we plot the posterior predicitve distribution associated with each distribution’s highest-ELPD dependent variable.
Appendix 1—figure 11
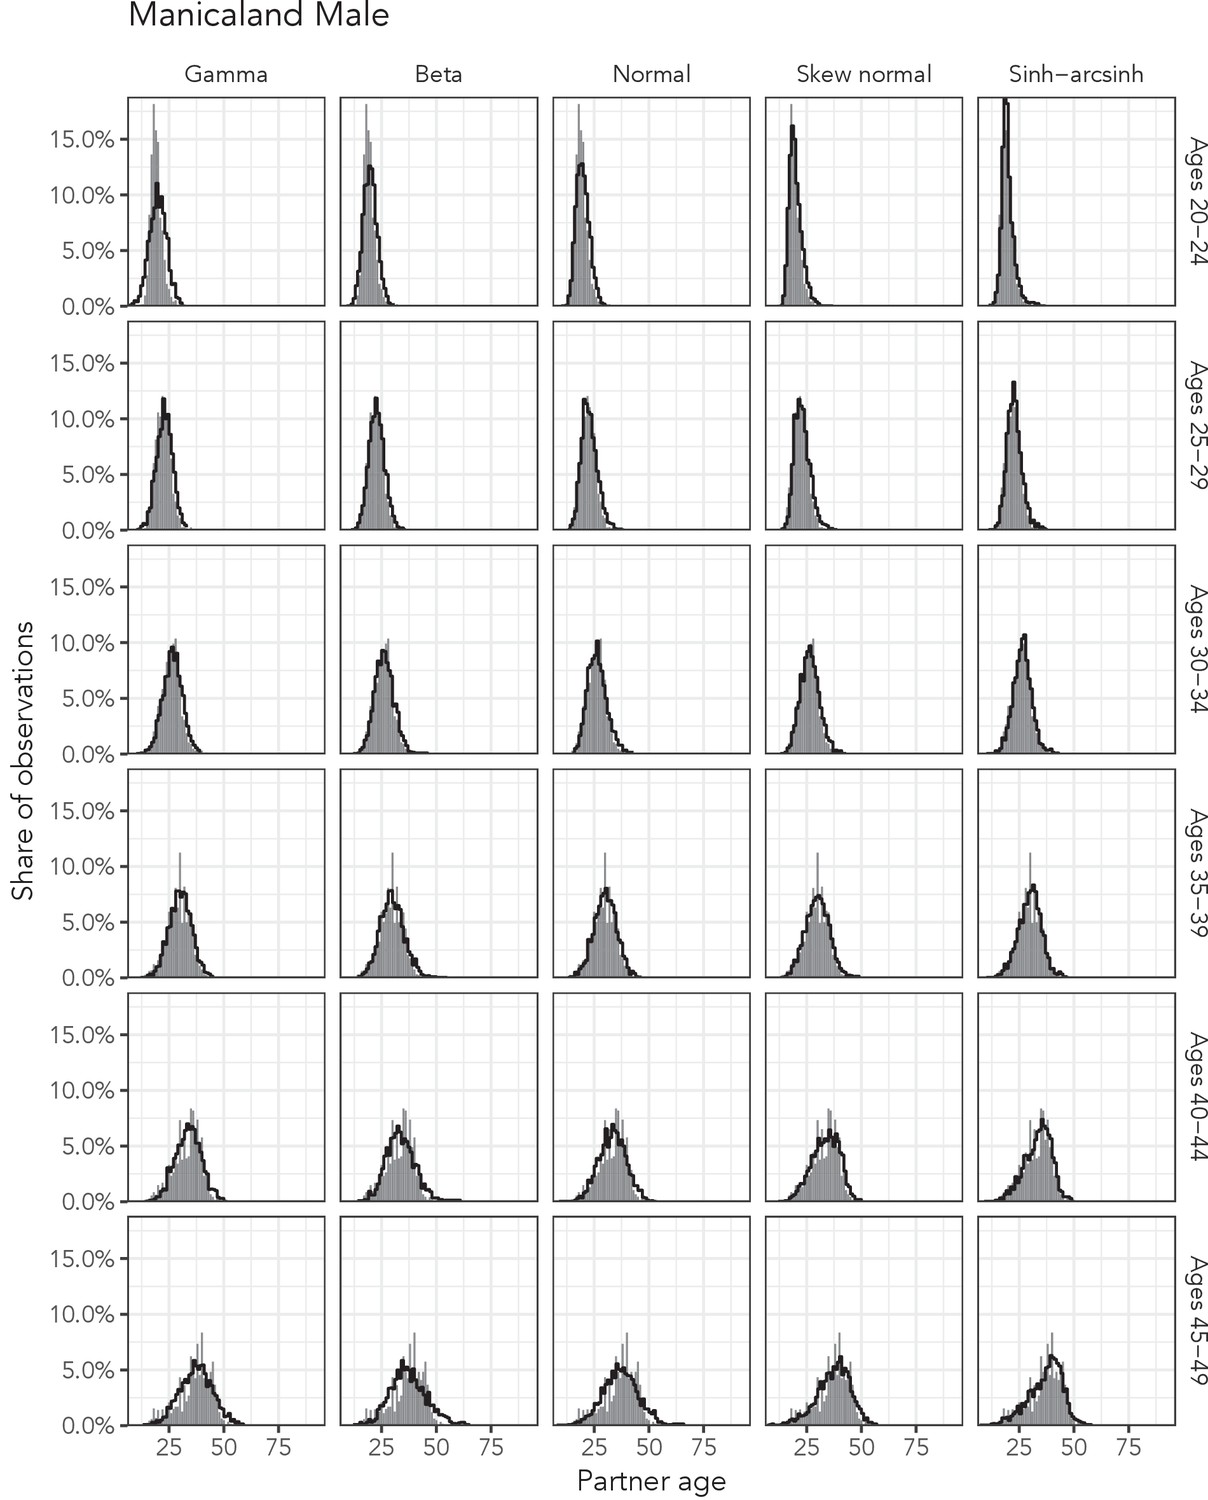
Observed partner age distributions (grey bars) and posterior predictive partner age distributions (lines) for each probability distribution among men in the Manicaland data set.
Here, we plot the posterior predicitve distribution associated with each distribution’s highest-ELPD dependent variable.
Tables
Table 1
Details of the five distributions tested in this analysis.
We define , to be the standard normal PDF, to be the standard normal cumulative density function, , and .
| Distribution | Parameters | Domain | |
|---|---|---|---|
| Normal | |||
| Skew normal | |||
| Gamma | |||
| Beta | |||
| Sinh-arcinh |
Table 2
Summary of five models fit in this analysis.
| Model | Distributional? | Location | Other parameters |
|---|---|---|---|
| Conventional | No | Age-sex interaction | Constant |
| Distributional 1 | Yes | Age-sex interaction | Age and sex effects |
| Distributional 2 | Yes | Age-sex interaction | Age-sex interaction |
| Distributional 3 | Yes | Sex-specific splines | Age-sex interaction |
| Distributional 4 | Yes | Sex-specific splines | Sex-specific splines |
Table 3
Share of subsets in which each dependent variable yields the highest ELPD given each probability distribution (excluding deheaped AHRI data).
| Variable | Normal | Skew normal | Sinh-arcsinh |
|---|---|---|---|
| Age difference | 22.2% | 25.0% | 16.7% |
| Linear age | 8.3% | 5.6% | 16.7% |
| Log-age | 19.4% | 41.7% | 30.6% |
| Log-ratio | 50.0% | 27.8% | 36.1% |
Table 4
Model comparison metrics averaged across all data subsets for all three data sets.
Higher ELPD values indicate better fit. Lower QQ RMSE values indicate more accurate prediction of empirical quantiles. Bolded rows are best across all three data sets.
| Distribution | AHRI | Haiti 2016–17 DHS | Manicaland |
|---|---|---|---|
| ELPD | |||
| Gamma | −14847.2 | −2917.9 | −13152.8 |
| Beta | −14748.0 | −2896.5 | −13003.5 |
| Normal | −14593.7 | −2868.4 | −12856.8 |
| Skew normal | −14505.1 | −2854.0 | −12778.5 |
| Sinh-arcsinh | −14312.5 | −2839.5 | −12625.8 |
| QQ RMSE | |||
| Gamma | 0.83 | 0.82 | 0.95 |
| Beta | 0.99 | 0.82 | 1.11 |
| Normal | 0.82 | 0.68 | 0.97 |
| Skew normal | 0.77 | 0.65 | 0.85 |
| Sinh-arcsinh | 0.36 | 0.37 | 0.44 |
Table 5
ELPD and QQ RMSE values for all five distributional regression models fit to each data set.
The models increase in complexity from Conventional Regression to Distributional Model 4. Bolded ELPD values are more than two standard errors higher than the next best value in the column. Bolded QQ RMSE values are lowest in their column.
| Model | AHRI | Haiti 2016–17 DHS | Manicaland |
|---|---|---|---|
| ELPD | |||
| Conventional | 52689.2 | 4777.8 | 21011.3 |
| Distributional 1 | 54335.2 | 5140.8 | 23192.5 |
| Distributional 2 | 54794.8 | 5138.7 | 23472.1 |
| Distributional 3 | 55534.2 | 5196.7 | 24313.7 |
| Distributional 4 | 55841.9 | 5207.6 | 24516.1 |
| QQ RMSE | |||
| Conventional | 1.30 | 1.33 | 2.05 |
| Distributional 1 | 1.15 | 0.98 | 1.89 |
| Distributional 2 | 1.21 | 0.99 | 1.80 |
| Distributional 3 | 0.93 | 0.91 | 1.34 |
| Distributional 4 | 0.66 | 0.84 | 1.04 |
Appendix 1—table 1
ELPD and QQ RMSE values for all five models fit to deheaped AHRI data The models increase in complexity from Conventional Regression to Distributional Model 4.
Bolded ELPD values are more than two standard errors higher than the next best value in the column. Bolded QQ RMSE values are lowest in their column.
| Model | AHRI deheaped |
|---|---|
| ELPD | |
| Conventional | 55296.2 |
| Distributional 1 | 57097.4 |
| Distributional 2 | 57503.7 |
| Distributional 3 | 58219.2 |
| Distributional 4 | 58504.0 |
| QQ RMSE | |
| Conventional | 1.26 |
| Distributional 1 | 1.06 |
| Distributional 2 | 1.14 |
| Distributional 3 | 0.92 |
| Distributional 4 | 0.62 |
Appendix 1—table 2
Full ELPD and QQ RMSE table for women in the AHRI data set.
Higher ELPD values and lower QQ RMSE values are better.
| Rank | Model | ELPD | ELPD Diff | SE of Diff | QQ RMSE |
|---|---|---|---|---|---|
| AHRI Female 20-24 | |||||
| 1 | Sinh-arcsinh | −31750.94 | 0.00 | 0.00 | 0.32 |
| 2 | Skew normal | −32056.39 | −305.46 | 48.63 | 0.47 |
| 3 | Normal | −32414.54 | −663.61 | 60.54 | 0.62 |
| 4 | Beta | −32953.92 | −1202.98 | 112.08 | 0.77 |
| 5 | Gamma | −33461.85 | −1710.92 | 148.15 | 0.80 |
| AHRI Female 25-29 | |||||
| 1 | Sinh-arcsinh | −24647.65 | 0.00 | 0.00 | 0.28 |
| 2 | Skew normal | −24906.22 | −258.57 | 43.27 | 0.52 |
| 3 | Normal | −25238.71 | −591.06 | 54.82 | 0.68 |
| 4 | Beta | −25701.13 | −1053.48 | 114.84 | 0.89 |
| 5 | Gamma | −25995.81 | −1348.16 | 132.15 | 0.90 |
| AHRI Female 30-34 | |||||
| 1 | Sinh-arcsinh | −19831.53 | 0.00 | 0.00 | 0.44 |
| 2 | Skew normal | −20200.44 | −368.91 | 69.40 | 0.51 |
| 3 | Normal | −20314.79 | −483.26 | 52.24 | 0.80 |
| 4 | Beta | −20575.61 | −744.08 | 67.46 | 0.93 |
| 5 | Gamma | −20708.35 | −876.82 | 73.89 | 0.91 |
| AHRI Female 35-39 | |||||
| 1 | Sinh-arcsinh | −15469.18 | 0.00 | 0.00 | 0.31 |
| 2 | Skew normal | −15749.79 | −280.61 | 53.04 | 0.77 |
| 3 | Normal | −15834.32 | −365.14 | 41.23 | 0.80 |
| 4 | Beta | −16026.51 | −557.33 | 53.99 | 1.18 |
| 5 | Gamma | −16087.40 | −618.22 | 57.06 | 1.04 |
| AHRI Female 40-44 | |||||
| 1 | Sinh-arcsinh | −12556.61 | 0.00 | 0.00 | 0.45 |
| 2 | Skew normal | −12876.71 | −320.10 | 45.85 | 1.27 |
| 3 | Normal | −12935.34 | −378.73 | 52.38 | 0.92 |
| 4 | Beta | −13137.69 | −581.08 | 69.18 | 1.38 |
| 5 | Gamma | −13150.66 | −594.05 | 62.73 | 1.19 |
| AHRI Female 45-49 | |||||
| 1 | Sinh-arcsinh | −10059.21 | 0.00 | 0.00 | 0.59 |
| 2 | Skew normal | −10391.95 | −332.74 | 42.75 | 1.36 |
| 3 | Normal | −10433.64 | −374.43 | 48.91 | 1.53 |
| 4 | Gamma | −10527.00 | −467.79 | 50.72 | 1.35 |
| 5 | Beta | −10545.33 | −486.12 | 56.02 | 1.58 |
Appendix 1—table 3
Full ELPD and QQ RMSE table for men in the AHRI data set.
Higher ELPD values and lower QQ RMSE values are better.
| Rank | Model | ELPD | ELPD Diff | SE of Diff | QQ RMSE |
|---|---|---|---|---|---|
| AHRI Male 20-24 | |||||
| 1 | Sinh-arcsinh | −20428.11 | 0.00 | 0.00 | 0.23 |
| 2 | Skew normal | −20499.86 | −71.75 | 17.12 | 0.25 |
| 3 | Normal | −20503.89 | −75.79 | 16.85 | 0.22 |
| 4 | Beta | −20545.59 | −117.49 | 23.21 | 0.22 |
| 5 | Gamma | −20700.24 | −272.13 | 43.53 | 0.29 |
| AHRI Male 25-29 | |||||
| 1 | Sinh-arcsinh | −12664.21 | 0.00 | 0.00 | 0.26 |
| 2 | Skew normal | −12727.03 | −62.82 | 17.86 | 0.28 |
| 3 | Beta | −12739.03 | −74.82 | 18.65 | 0.31 |
| 4 | Normal | −12753.25 | −89.04 | 19.35 | 0.29 |
| 5 | Gamma | −12788.26 | −124.05 | 35.07 | 0.38 |
| AHRI Male 30-34 | |||||
| 1 | Sinh-arcsinh | −9301.03 | 0.00 | 0.00 | 0.29 |
| 2 | Skew normal | −9357.18 | −56.15 | 14.08 | 0.43 |
| 3 | Beta | −9371.86 | −70.83 | 16.48 | 0.37 |
| 4 | Normal | −9385.63 | −84.60 | 14.67 | 0.46 |
| 5 | Gamma | −9419.34 | −118.31 | 35.11 | 0.27 |
| AHRI Male 35-39 | |||||
| 1 | Sinh-arcsinh | −6746.89 | 0.00 | 0.00 | 0.30 |
| 2 | Skew normal | −6812.77 | −65.88 | 17.73 | 0.64 |
| 3 | Normal | −6817.86 | −70.97 | 23.24 | 0.70 |
| 4 | Beta | −6830.95 | −84.06 | 17.95 | 0.71 |
| 5 | Gamma | −6832.47 | −85.58 | 32.03 | 0.44 |
| AHRI Male 40-44 | |||||
| 1 | Sinh-arcsinh | −4610.95 | 0.00 | 0.00 | 0.35 |
| 2 | Skew normal | −4711.78 | −100.84 | 18.66 | 0.92 |
| 3 | Normal | −4713.78 | −102.83 | 18.82 | 0.78 |
| 4 | Gamma | −4718.28 | −107.33 | 24.83 | 0.63 |
| 5 | Beta | −4742.70 | −131.75 | 17.28 | 1.07 |
| AHRI Male 45-49 | |||||
| 1 | Sinh-arcsinh | −3683.47 | 0.00 | 0.00 | 0.34 |
| 2 | Skew normal | −3770.59 | −87.12 | 16.56 | 0.81 |
| 3 | Gamma | −3776.33 | −92.86 | 15.56 | 0.87 |
| 4 | Normal | −3778.84 | −95.37 | 14.50 | 1.17 |
| 5 | Beta | −3805.78 | −122.31 | 17.40 | 1.36 |
Appendix 1—table 4
Full ELPD and QQ RMSE table for women in the AHRI Deheaped data set.
Higher ELPD values and lower QQ RMSE values are better.
| Rank | Model | ELPD | ELPD Diff | SE of Diff | QQ RMSE |
|---|---|---|---|---|---|
| AHRI Deheaped Female 20-24 | |||||
| 1 | Sinh-arcsinh | −31411.24 | 0.00 | 0.00 | 0.26 |
| 2 | Skew normal | −31797.37 | −386.13 | 53.15 | 0.59 |
| 3 | Normal | −32179.29 | −768.05 | 65.50 | 0.56 |
| 4 | Beta | −32737.57 | −1326.32 | 118.47 | 0.76 |
| 5 | Gamma | −33254.17 | −1842.92 | 155.14 | 0.78 |
| AHRI Deheaped Female 25-29 | |||||
| 1 | Sinh-arcsinh | −24439.47 | 0.00 | 0.00 | 0.27 |
| 2 | Skew normal | −24768.06 | −328.59 | 46.71 | 0.65 |
| 3 | Normal | −25104.46 | −664.99 | 58.32 | 0.82 |
| 4 | Beta | −25574.33 | −1134.86 | 119.65 | 1.03 |
| 5 | Gamma | −25870.30 | −1430.83 | 137.51 | 1.05 |
| AHRI Deheaped Female 30-34 | |||||
| 1 | Sinh-arcsinh | −19680.77 | 0.00 | 0.00 | 0.41 |
| 2 | Skew normal | −20112.70 | −431.94 | 72.95 | 0.55 |
| 3 | Normal | −20228.52 | −547.76 | 56.19 | 0.81 |
| 4 | Beta | −20492.23 | −811.46 | 70.53 | 0.92 |
| 5 | Gamma | −20624.82 | −944.06 | 76.98 | 0.80 |
| AHRI Deheaped Female 35-39 | |||||
| 1 | Sinh-arcsinh | −15381.68 | 0.00 | 0.00 | 0.26 |
| 2 | Skew normal | −15703.77 | −322.09 | 55.30 | 0.68 |
| 3 | Normal | −15788.73 | −407.05 | 43.67 | 0.82 |
| 4 | Beta | −15983.57 | −601.90 | 56.31 | 1.13 |
| 5 | Gamma | −16044.22 | −662.54 | 59.17 | 1.04 |
| AHRI Deheaped Female 40-44 | |||||
| 1 | Sinh-arcsinh | −12491.91 | 0.00 | 0.00 | 0.25 |
| 2 | Skew normal | −12846.63 | −354.72 | 47.38 | 0.99 |
| 3 | Normal | −12905.04 | −413.12 | 54.14 | 0.89 |
| 4 | Beta | −13109.82 | −617.91 | 70.96 | 1.31 |
| 5 | Gamma | −13121.45 | −629.53 | 64.12 | 1.13 |
| AHRI Deheaped Female 45-49 | |||||
| 1 | Sinh-arcsinh | −9981.83 | 0.00 | 0.00 | 0.53 |
| 2 | Skew normal | −10357.85 | −376.01 | 45.08 | 1.43 |
| 3 | Normal | −10401.64 | −419.80 | 51.57 | 1.46 |
| 4 | Gamma | −10493.73 | −511.90 | 52.90 | 1.37 |
| 5 | Beta | −10513.46 | −531.63 | 58.21 | 1.61 |
Appendix 1—table 5
Full ELPD and QQ RMSE table for men in the AHRI Deheaped data set.
Higher ELPD values and lower QQ RMSE values are better.
| Rank | Model | ELPD | ELPD Diff | SE of Diff | QQ RMSE |
|---|---|---|---|---|---|
| AHRI Deheaped Male 20-24 | |||||
| 1 | Sinh-arcsinh | −20310.35 | 0.00 | 0.00 | 0.27 |
| 2 | Skew normal | −20429.90 | −119.55 | 27.09 | 0.22 |
| 3 | Normal | −20459.73 | −149.38 | 35.78 | 0.29 |
| 4 | Beta | −20574.15 | −263.80 | 75.13 | 0.22 |
| 5 | Gamma | −20899.52 | −589.17 | 175.99 | 0.27 |
| AHRI Deheaped Male 25-29 | |||||
| 1 | Sinh-arcsinh | −12585.54 | 0.00 | 0.00 | 0.28 |
| 2 | Skew normal | −12680.59 | −95.05 | 21.53 | 0.44 |
| 3 | Beta | −12697.00 | −111.46 | 23.31 | 0.37 |
| 4 | Normal | −12701.76 | −116.23 | 22.96 | 0.41 |
| 5 | Gamma | −12763.81 | −178.27 | 41.24 | 0.39 |
| AHRI Deheaped Male 30-34 | |||||
| 1 | Sinh-arcsinh | −9227.26 | 0.00 | 0.00 | 0.37 |
| 2 | Skew normal | −9302.42 | −75.16 | 16.15 | 0.41 |
| 3 | Beta | −9318.24 | −90.97 | 19.07 | 0.39 |
| 4 | Normal | −9327.58 | −100.31 | 16.18 | 0.41 |
| 5 | Gamma | −9372.32 | −145.06 | 38.27 | 0.27 |
| AHRI Deheaped Male 35-39 | |||||
| 1 | Sinh-arcsinh | −6694.86 | 0.00 | 0.00 | 0.30 |
| 2 | Skew normal | −6774.11 | −79.26 | 19.32 | 0.61 |
| 3 | Normal | −6780.69 | −85.84 | 25.42 | 0.44 |
| 4 | Beta | −6791.95 | −97.10 | 19.81 | 0.69 |
| 5 | Gamma | −6796.41 | −101.55 | 34.45 | 0.40 |
| AHRI Deheaped Male 40-44 | |||||
| 1 | Sinh-arcsinh | −4591.04 | 0.00 | 0.00 | 0.49 |
| 2 | Skew normal | −4700.54 | −109.51 | 19.38 | 1.16 |
| 3 | Normal | −4703.52 | −112.49 | 19.93 | 1.00 |
| 4 | Gamma | −4708.43 | −117.40 | 25.94 | 0.89 |
| 5 | Beta | −4731.41 | −140.37 | 17.84 | 1.30 |
| AHRI Deheaped Male 45-49 | |||||
| 1 | Sinh-arcsinh | −3680.18 | 0.00 | 0.00 | 0.30 |
| 2 | Normal | −3796.06 | −115.88 | 19.24 | 1.15 |
| 3 | Skew normal | −3797.14 | −116.95 | 23.48 | 1.02 |
| 4 | Gamma | −3801.02 | −120.83 | 24.51 | 0.98 |
| 5 | Beta | −3817.97 | −137.79 | 19.37 | 1.39 |
Appendix 1—table 6
Full ELPD and QQ RMSE table for women in the Haiti 2016–17 DHS data set.
Higher ELPD values and lower QQ RMSE values are better.
| Rank | Model | ELPD | ELPD Diff | SE of Diff | QQ RMSE |
|---|---|---|---|---|---|
| Haiti 2016-17 DHS Female 20-24 | |||||
| 1 | Sinh-arcsinh | −3259.31 | 0.00 | 0.00 | 0.49 |
| 2 | Skew normal | −3263.46 | −4.15 | 4.95 | 0.53 |
| 3 | Normal | −3338.23 | −78.92 | 19.54 | 0.91 |
| 4 | Beta | −3441.91 | −182.60 | 45.77 | 1.24 |
| 5 | Gamma | −3504.85 | −245.54 | 53.90 | 1.29 |
| Haiti 2016-17 DHS Female 25-29 | |||||
| 1 | Sinh-arcsinh | −4447.43 | 0.00 | 0.00 | 0.26 |
| 2 | Skew normal | −4471.22 | −23.78 | 8.41 | 0.57 |
| 3 | Normal | −4527.25 | −79.82 | 18.72 | 0.86 |
| 4 | Beta | −4625.97 | −178.54 | 40.88 | 1.23 |
| 5 | Gamma | −4678.20 | −230.77 | 45.81 | 1.22 |
| Haiti 2016-17 DHS Female 30-34 | |||||
| 1 | Sinh-arcsinh | −4720.12 | 0.00 | 0.00 | 0.44 |
| 2 | Skew normal | −4749.57 | −29.45 | 9.06 | 0.68 |
| 3 | Normal | −4763.78 | −43.66 | 10.51 | 0.62 |
| 4 | Beta | −4809.11 | −88.99 | 17.19 | 0.85 |
| 5 | Gamma | −4836.82 | −116.70 | 20.32 | 0.83 |
| Haiti 2016-17 DHS Female 35-39 | |||||
| 1 | Sinh-arcsinh | −4490.82 | 0.00 | 0.00 | 0.33 |
| 2 | Skew normal | −4518.58 | −27.75 | 8.14 | 0.57 |
| 3 | Normal | −4526.55 | −35.73 | 8.59 | 0.73 |
| 4 | Beta | −4561.27 | −70.45 | 13.60 | 0.94 |
| 5 | Gamma | −4577.84 | −87.01 | 15.27 | 0.86 |
| Haiti 2016-17 DHS Female 40-44 | |||||
| 1 | Sinh-arcsinh | −3601.02 | 0.00 | 0.00 | 0.35 |
| 2 | Skew normal | −3629.45 | −28.43 | 7.51 | 0.83 |
| 3 | Normal | −3633.14 | −32.11 | 7.96 | 0.71 |
| 4 | Beta | −3641.61 | −40.59 | 9.76 | 0.73 |
| 5 | Gamma | −3644.89 | −43.86 | 10.47 | 0.64 |
| Haiti 2016-17 DHS Female 45-49 | |||||
| 1 | Sinh-arcsinh | −3106.27 | 0.00 | 0.00 | 0.39 |
| 2 | Skew normal | −3133.10 | −26.82 | 7.68 | 0.88 |
| 3 | Gamma | −3133.61 | −27.33 | 7.50 | 0.68 |
| 4 | Normal | −3134.62 | −28.35 | 7.46 | 0.81 |
| 5 | Beta | −3136.89 | −30.62 | 8.61 | 0.88 |
Appendix 1—table 7
Full ELPD and QQ RMSE table for men in the Haiti 2016–17 DHS data set.
Higher ELPD values and lower QQ RMSE values are better.
| Rank | Model | ELPD | ELPD Diff | SE of Diff | QQ RMSE |
|---|---|---|---|---|---|
| Haiti 2016-17 DHS Male 20-24 | |||||
| 1 | Skew normal | −468.98 | 0.00 | 0.00 | 0.43 |
| 2 | Sinh-arcsinh | −469.60 | −0.62 | 1.12 | 0.41 |
| 3 | Normal | −475.31 | −6.33 | 4.28 | 0.67 |
| 4 | Beta | −483.53 | −14.55 | 7.33 | 0.65 |
| 5 | Gamma | −500.53 | −31.55 | 13.35 | 0.94 |
| Haiti 2016-17 DHS Male 25-29 | |||||
| 1 | Sinh-arcsinh | −1386.13 | 0.00 | 0.00 | 0.38 |
| 2 | Skew normal | −1390.54 | −4.41 | 3.19 | 0.49 |
| 3 | Normal | −1395.47 | −9.34 | 4.79 | 0.60 |
| 4 | Beta | −1407.46 | −21.32 | 7.31 | 0.62 |
| 5 | Gamma | −1434.18 | −48.04 | 11.75 | 0.79 |
| Haiti 2016-17 DHS Male 30-34 | |||||
| 1 | Sinh-arcsinh | −2217.20 | 0.00 | 0.00 | 0.44 |
| 2 | Skew normal | −2222.10 | −4.89 | 3.42 | 0.69 |
| 3 | Normal | −2223.97 | −6.76 | 4.48 | 0.45 |
| 4 | Beta | −2240.58 | −23.37 | 9.32 | 0.52 |
| 5 | Gamma | −2281.18 | −63.98 | 17.91 | 0.73 |
| Haiti 2016-17 DHS Male 35-39 | |||||
| 1 | Sinh-arcsinh | −2185.96 | 0.00 | 0.00 | 0.28 |
| 2 | Skew normal | −2189.87 | −3.91 | 2.67 | 0.69 |
| 3 | Beta | −2191.05 | −5.10 | 3.68 | 0.48 |
| 4 | Normal | −2191.11 | −5.16 | 3.55 | 0.49 |
| 5 | Gamma | −2205.69 | −19.73 | 9.57 | 0.52 |
| Haiti 2016-17 DHS Male 40-44 | |||||
| 1 | Sinh-arcsinh | −2051.62 | 0.00 | 0.00 | 0.39 |
| 2 | Skew normal | −2060.16 | −8.54 | 4.21 | 0.72 |
| 3 | Normal | −2060.38 | −8.75 | 4.57 | 0.69 |
| 4 | Beta | −2062.00 | −10.37 | 4.87 | 0.70 |
| 5 | Gamma | −2063.79 | −12.17 | 5.73 | 0.47 |
| Haiti 2016-17 DHS Male 45-49 | |||||
| 1 | Sinh-arcsinh | −2138.34 | 0.00 | 0.00 | 0.23 |
| 2 | Normal | −2150.53 | −12.19 | 6.38 | 0.35 |
| 3 | Skew normal | −2151.51 | −13.17 | 5.97 | 0.56 |
| 4 | Gamma | −2152.88 | −14.54 | 8.93 | 0.25 |
| 5 | Beta | −2156.13 | −17.79 | 6.14 | 0.48 |
Appendix 1—table 8
Full ELPD and QQ RMSE table for women in the Manicaland data set.
Higher ELPD values and lower QQ RMSE values are better.
| Rank | Model | ELPD | ELPD Diff | SE of Diff | QQ RMSE |
|---|---|---|---|---|---|
| Manicaland Female 20-24 | |||||
| 1 | Sinh-arcsinh | −16390.77 | 0.00 | 0.00 | 0.31 |
| 2 | Skew normal | −16502.01 | −111.25 | 21.22 | 0.44 |
| 3 | Normal | −16779.93 | −389.16 | 37.05 | 0.67 |
| 4 | Beta | −17111.57 | −720.80 | 62.02 | 0.86 |
| 5 | Gamma | −17387.38 | −996.61 | 76.80 | 1.02 |
| Manicaland Female 25-29 | |||||
| 1 | Sinh-arcsinh | −18702.50 | 0.00 | 0.00 | 0.53 |
| 2 | Skew normal | −18923.04 | −220.53 | 25.27 | 0.94 |
| 3 | Normal | −19080.66 | −378.16 | 36.05 | 0.83 |
| 4 | Beta | −19405.80 | −703.30 | 64.97 | 1.05 |
| 5 | Gamma | −19615.53 | −913.03 | 76.38 | 1.09 |
| Manicaland Female 30-34 | |||||
| 1 | Sinh-arcsinh | −16523.81 | 0.00 | 0.00 | 0.48 |
| 2 | Skew normal | −16877.96 | −354.15 | 40.36 | 0.87 |
| 3 | Normal | −16886.62 | −362.80 | 36.41 | 0.99 |
| 4 | Beta | −17021.26 | −497.44 | 43.60 | 1.12 |
| 5 | Gamma | −17094.58 | −570.76 | 49.53 | 0.93 |
| Manicaland Female 35-39 | |||||
| 1 | Sinh-arcsinh | −14397.76 | 0.00 | 0.00 | 0.48 |
| 2 | Skew normal | −14736.64 | −338.88 | 28.35 | 1.25 |
| 3 | Normal | −14798.55 | −400.79 | 36.87 | 1.39 |
| 4 | Beta | −14824.80 | −427.04 | 33.02 | 1.47 |
| 5 | Gamma | −14835.11 | −437.35 | 34.49 | 1.14 |
| Manicaland Female 40-44 | |||||
| 1 | Sinh-arcsinh | −12293.13 | 0.00 | 0.00 | 0.68 |
| 2 | Skew normal | −12488.28 | −195.15 | 21.36 | 1.03 |
| 3 | Gamma | −12500.93 | −207.80 | 22.18 | 1.03 |
| 4 | Normal | −12508.91 | −215.78 | 23.29 | 1.28 |
| 5 | Beta | −12537.14 | −244.01 | 25.41 | 1.22 |
| Manicaland Female 45-49 | |||||
| 1 | Sinh-arcsinh | −9183.03 | 0.00 | 0.00 | 0.56 |
| 2 | Skew normal | −9455.87 | −272.83 | 23.57 | 1.68 |
| 3 | Normal | −9477.33 | −294.30 | 23.55 | 1.62 |
| 4 | Gamma | −9497.31 | −314.27 | 25.08 | 1.44 |
| 5 | Beta | −9576.44 | −393.40 | 32.07 | 1.94 |
Appendix 1—table 9
Full ELPD and QQ RMSE table for men in the Manicaland data set.
Higher ELPD values and lower QQ RMSE values are better.
| Rank | Model | ELPD | ELPD Diff | SE of Diff | QQ RMSE |
|---|---|---|---|---|---|
| Manicaland Male 20-24 | |||||
| 1 | Sinh-arcsinh | −9770.00 | 0.00 | 0.00 | 0.30 |
| 2 | Skew normal | −9895.82 | −125.83 | 33.35 | 0.40 |
| 3 | Normal | −10139.11 | −369.11 | 79.13 | 0.49 |
| 4 | Beta | −10587.64 | −817.64 | 181.23 | 0.56 |
| 5 | Gamma | −11594.58 | −1824.59 | 388.26 | 1.15 |
| Manicaland Male 25-29 | |||||
| 1 | Sinh-arcsinh | −13978.59 | 0.00 | 0.00 | 0.40 |
| 2 | Skew normal | −13990.39 | −11.80 | 8.51 | 0.48 |
| 3 | Normal | −14018.60 | −40.00 | 17.48 | 0.45 |
| 4 | Beta | −14152.35 | −173.76 | 48.77 | 0.40 |
| 5 | Gamma | −14500.47 | −521.87 | 117.58 | 0.55 |
| Manicaland Male 30-34 | |||||
| 1 | Sinh-arcsinh | −12949.24 | 0.00 | 0.00 | 0.31 |
| 2 | Skew normal | −13016.44 | −67.21 | 25.01 | 0.37 |
| 3 | Normal | −13037.46 | −88.22 | 16.57 | 0.49 |
| 4 | Beta | −13070.31 | −121.07 | 54.74 | 0.41 |
| 5 | Gamma | −13285.47 | −336.23 | 171.92 | 0.42 |
| Manicaland Male 35-39 | |||||
| 1 | Sinh-arcsinh | −11496.14 | 0.00 | 0.00 | 0.27 |
| 2 | Skew normal | −11528.36 | −32.22 | 9.83 | 0.39 |
| 3 | Normal | −11530.43 | −34.29 | 9.72 | 0.26 |
| 4 | Gamma | −11531.75 | −35.61 | 12.47 | 0.24 |
| 5 | Beta | −11582.63 | −86.49 | 12.97 | 0.48 |
| Manicaland Male 40-44 | |||||
| 1 | Sinh-arcsinh | −8714.06 | 0.00 | 0.00 | 0.35 |
| 2 | Skew normal | −8749.78 | −35.72 | 10.11 | 0.51 |
| 3 | Gamma | −8777.08 | −63.02 | 10.38 | 0.55 |
| 4 | Normal | −8791.45 | −77.38 | 12.23 | 0.76 |
| 5 | Beta | −8860.22 | −146.16 | 18.15 | 0.93 |
| Manicaland Male 45-49 | |||||
| 1 | Sinh-arcsinh | −7110.27 | 0.00 | 0.00 | 0.42 |
| 2 | Skew normal | −7177.03 | −66.75 | 25.08 | 0.76 |
| 3 | Gamma | −7213.99 | −103.72 | 13.02 | 1.07 |
| 4 | Normal | −7232.04 | −121.77 | 13.09 | 1.28 |
| 5 | Beta | −7312.35 | −202.08 | 18.61 | 1.61 |
Appendix 1—table 10
LOO-CV estimated ELPD values, differences, and standard errors of differences, as well as QQ RMSE values, for all five regression models fit to all four data sets.
The ‘difference’ value of a row is the difference between that row’s ELPD value and data set-specific best ELPD value. Higher ELPD values and lower QQ RMSE values are better.
| Rank | Model | ELPD | ELPD Diff | SE of Diff | QQ RMSE |
|---|---|---|---|---|---|
| AHRI | |||||
| 1 | Distributional 4 | 55841.91 | 0.00 | 0.00 | 0.66 |
| 2 | Distributional 3 | 55534.16 | −307.75 | 32.36 | 0.93 |
| 3 | Distributional 2 | 54794.79 | −1047.12 | 51.69 | 1.21 |
| 4 | Distributional 1 | 54335.19 | −1506.72 | 72.32 | 1.15 |
| 5 | Conventional | 52689.21 | −3152.70 | 100.59 | 1.30 |
| AHRI Deaheaped | |||||
| 1 | Distributional 4 | 58503.98 | 0.00 | 0.00 | 0.62 |
| 2 | Distributional 3 | 58219.23 | −284.75 | 28.64 | 0.92 |
| 3 | Distributional 2 | 57503.68 | −1000.30 | 47.14 | 1.14 |
| 4 | Distributional 1 | 57097.39 | −1406.59 | 64.48 | 1.06 |
| 5 | Conventional | 55296.25 | −3207.73 | 99.42 | 1.26 |
| Haiti 2016-17 DHS | |||||
| 1 | Distributional 4 | 5207.57 | 0.00 | 0.00 | 0.84 |
| 2 | Distributional 3 | 5196.69 | −10.89 | 6.54 | 0.91 |
| 3 | Distributional 1 | 5140.77 | −66.80 | 12.27 | 0.98 |
| 4 | Distributional 2 | 5138.75 | −68.83 | 12.24 | 0.99 |
| 5 | Conventional | 4777.78 | −429.80 | 30.54 | 1.33 |
| Manicaland | |||||
| 1 | Distributional 4 | 24516.15 | 0.00 | 0.00 | 1.04 |
| 2 | Distributional 3 | 24313.74 | −202.40 | 20.52 | 1.34 |
| 3 | Distributional 2 | 23472.07 | −1044.08 | 47.77 | 1.80 |
| 4 | Distributional 1 | 23192.49 | −1323.66 | 54.97 | 1.89 |
| 5 | Conventional | 21011.29 | −3504.86 | 89.01 | 2.05 |
Additional files
Download links
A two-part list of links to download the article, or parts of the article, in various formats.
Downloads (link to download the article as PDF)
Open citations (links to open the citations from this article in various online reference manager services)
Cite this article (links to download the citations from this article in formats compatible with various reference manager tools)
Evaluating distributional regression strategies for modelling self-reported sexual age-mixing
eLife 10:e68318.
https://doi.org/10.7554/eLife.68318


