PBN-PVT projections modulate negative affective states in mice
- Department of Anesthesiology, Shanghai General Hospital, Shanghai Jiao Tong University School of Medicine, China
- The First Rehabilitation Hospital of Shanghai, Tongji University School of Medicine, China
- Department of Respiratory, The First Affiliated Hospital of Guangzhou Medical University, China
- SUSTech Center for Pain Medicine, School of Medicine, Southern University of Science and Technology, China
Figures
Figure 1 with 3 supplements
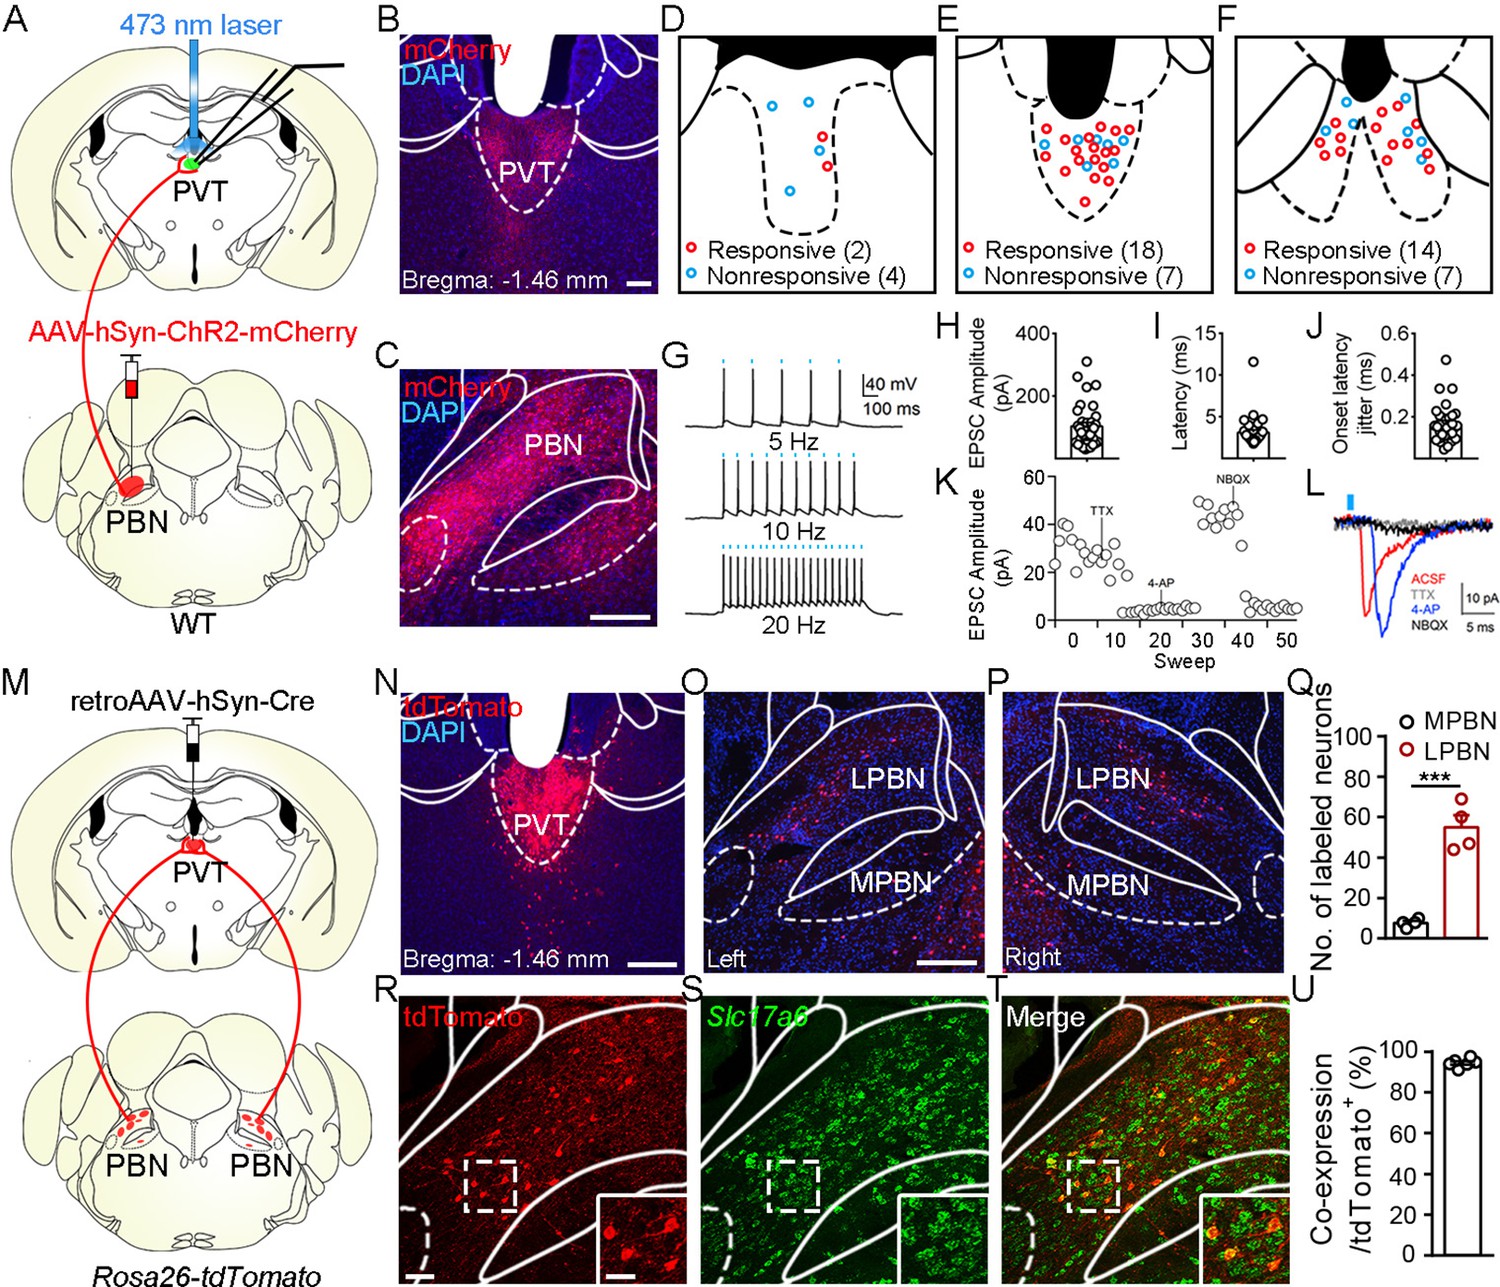
Functional connectivity pattern of parabrachial nucleus-paraventricular nucleus (PBN-PVT) projections.
(A) The schematic for virus injection of AAV2/8-hSyn-ChR2-mCherry into the PBN nucleus and the slice recording with 473 nm laser stimulation. (B) The projection fibers in the PVT nucleus. Scale bar: 100 μm. (C) The AAV2/8-hSyn-ChR2-mCherry virus expression in the PBN nucleus. Scale bar: 200 μm. (D−F) The locations of the recorded cells in the anterior PVT (D), the middle PVT (E), and the posterior PVT (F). Red circles indicate neurons with excitatory postsynaptic currents (EPSCs), and blue circles indicate neurons without EPSCs. (G) The 473 nm laser-induced time-locked action potential firing at 5 Hz (top), 10 Hz (middle), and 20 Hz (bottom) in the ChR2-expressing neuron in the PBN. Scale bars: 100 ms, 40 mV. (H−J) The amplitude of light-evoked EPSCs (H), the latency of EPSCs (I), and the latency jitter of EPSCs (J) from all 34 responsive neurons in the PVT. (K) Amplitudes of light-evoked EPSCs recorded from a PVT neuron (right panel). (L) The light-evoked EPSC was completely blocked by 1 μM tetrodotoxin (TTX), rescued by 100 μM 4-aminopyridine (4-AP), and blocked by 10 μM NBQX (AMPA/kainate receptor antagonist). Scale bars: 5 ms, 10 pA. (M) Schematic shows retroAAV2/2-hSyn-Cre injection into the PVT nucleus on Rosa26-tdTomato mice. (N) The injection site in the PVT nucleus. Scale bar: 200 μm. (O, P) The distribution of the tdTomato-positive neurons in the left PBN (O) and the right PBN (P). (Q) The quantification of the tdTomato-positive neurons in the lateral PBN (LPBN) and the media PBN (MPBN). n = 4 mice. Scale bar: 200 μm. (R−T) Double staining of tdTomato with Slc17a6 mRNA by in situ hybridization. Scale bar: 50 μm, the scale bar in the quadrangle was 25 μm. (U) Quantification of the double-positive neurons over the total number of tdTomato-positive neurons, n = 6 sections from three mice. ***p<0.001, data are represented as mean ± SEM. Paired Student’s t-test for (Q).
Figure 1—figure supplement 1

Characterization of parabrachial nucleus-paraventricular nucleus (PBN-PVT) neurons.
(A−O) Double staining of tdTomato signals (red) with Tacr1 mRNA (A−C), Tac1 mRNA (E−G), Pdyn mRNA (I−K), and CGRP protein (M−O). Scale bar: 100 μm. (D, H, L) The proportions of co-expressing neurons of tdTomato-positive neurons, n = 6 sections from three mice. Tacr1, tachykinin 1 receptor; Tac1, tachykinin 1; Pdyn, prodynorphin; CGRP, calcitonin gene-related peptide.
Figure 1—figure supplement 2
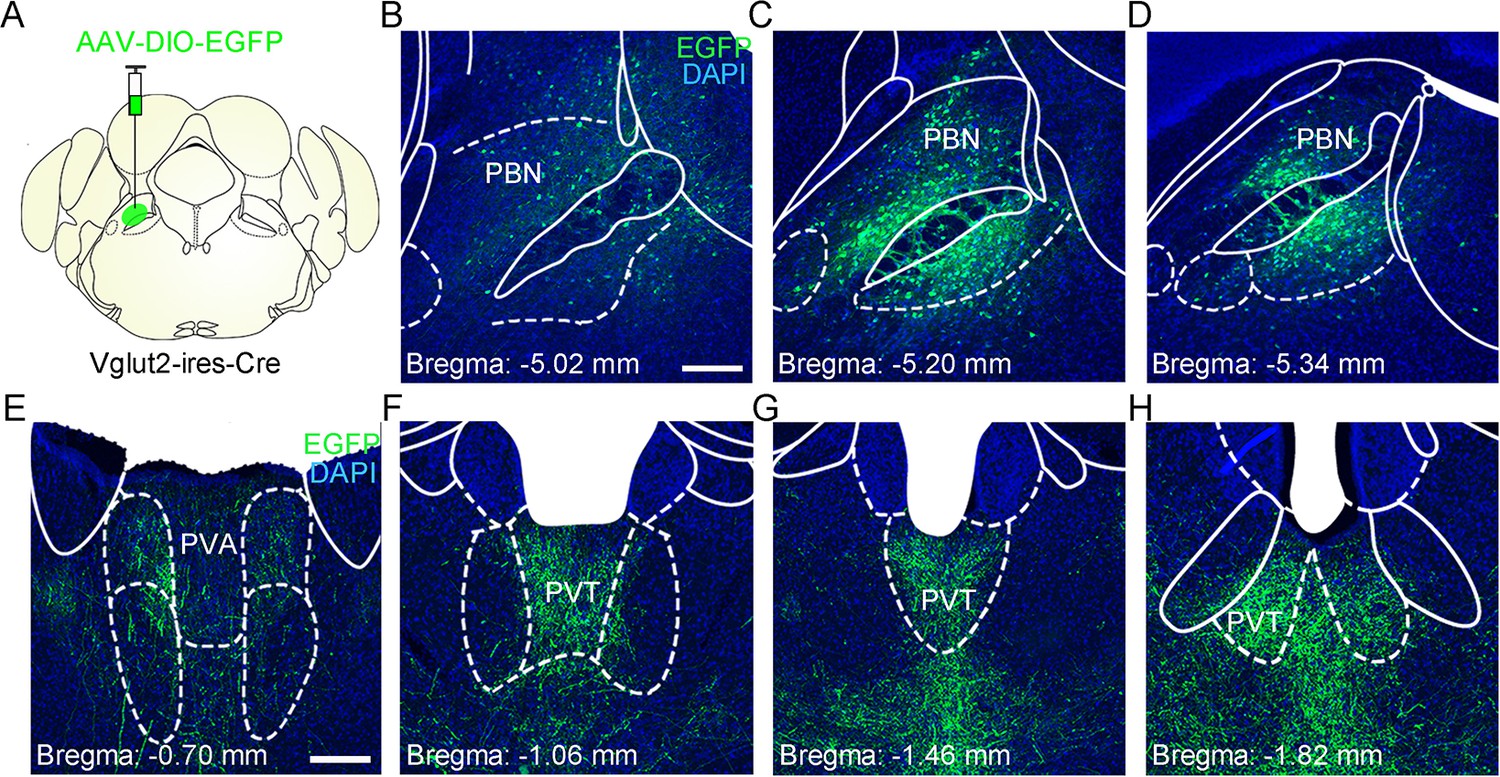
The distribution pattern of the parabrachial nucleus-paraventricular nucleus (PBN-PVT) glutamatergic projection.
(A) The illustration for virus injection of AAV2/8-EF1α-DIO-EGFP into the PBN nucleus on Vglut2-ires-Cre mice. (B−D) The virus expression in the anterior (B), the middle (C), and the posterior PBN (D). Scale bar: 200 μm. (E−H) The distribution pattern of PBN glutamatergic projection fibers in the anterior (E, F), the middle (G), and the posterior PVT (H). PVA, anterior paraventricular thalamus. Scale bar: 200 μm.
Figure 1—figure supplement 3

The distribution pattern of collateral projection fibers from parabrachial nucleus-paraventricular nucleus (PBN-PVT) neurons.
(A) The illustration shows the injection of retroAAV2/2-hSyn-Cre into the PVT and AAV2/8-EF1α-DIO-EGFP into the PBN to label the PBN-PVT neurons. (B) Examples of AAV2/8-EF1α-DIO-EGFP expression in the PBN. Scale bar: 200 μm. (C−N) The efferents from the PBN-PVT neurons could be found in the MnPo (C), BNST (D), LH (E), PVN (F), PVT (G), ILN (H), DM (I), PSTh (J), VTA (K), and PAG (L) but not in the CeA (M) and VMH (N). (O) Schematic showing summary of the distribution pattern of fibers from PBN-PVT neurons. MnPo, median preoptic nucleus; BNST, bed nucleus of the stria terminalis; LH, lateral hypothalamic area; PVN, paraventricular nucleus of the hypothalamus; ILN, intralaminar thalamic nucleus; DM, dorsomedial hypothalamic nucleus; PSTh, parasubthalamic nucleus; VTA, ventral tegmental areas; PAG, periaqueductal gray; CeA, central nucleus of the amygdala; VMH, ventromedial hypothalamic nucleus.
Figure 2 with 4 supplements

Optogenetic activation of parabrachial nucleus-paraventricular nucleus (PBN-PVT) projections induced negative affective states.
(A) The illustration shows the injection of AAV2/9-EF1α-DIO-ChR2-mCherry virus into the PBN nucleus and the optic fiber above the PVT on the Vglut2-ires-Cre mice. (B, C) The virus injection sites of the left PBN (B) and the right PBN (C). Scale bar: 200 μm. (D) The projection axons from the PBN and the location of the optic fiber (rectangle) in the PVT. Scale bar: 200 μm. (E) The schematic of the open field test (OFT) with optogenetic activation via a 473 nm laser (20 Hz, 5 mW, 5 ms). (F, G) The example traces of the 15 min optogenetic manipulation OFT from an AAV2/9-EF1α-DIO-mCherry virus-injected mouse (F) or an AAV2/9-EF1α-DIO-ChR2-mCherry virus-injected mouse (G). (H, I) Quantification of the velocity (H) and the center time (I) in the OFT, mCherry group: n = 7 mice; ChR2 group: n = 8 mice. (J) The illustration of the real-time place aversion (RTPA) test with optogenetic activation via a 473 nm laser. The right side was paired with the laser. (K, L) The example traces of the RTPA and post-test from the mice injected with AAV2/9-EF1α-DIO-mCherry (K) or AAV2/9-EF1α-DIO-ChR2-mCherry (L). (M) Quantification of the time spent in the laser-paired chamber in the pre-test (Pre), RTPA, and post-test (Post), mCherry group: n = 7 mice; ChR2 group: n = 8 mice. (N) Schematic timeline of cue-dependent optogenetic conditioning. (O) Conditioned-freezing responses to sound cue paired with optogenetic activation of the PBN-PVT projection during training, mCherry group: n = 4 mice; ChR2 group: n = 5 mice. (P, Q) Optogenetic activation of the projection fibers from the PBN in the PVT did not induce context-dependent fear (P) and cue-dependent fear (Q), mCherry group: n = 4 mice; ChR2 group: n = 5 mice. *p<0.05, **p<0.01, ***p<0.001, all data are represented as mean ± SEM. Two-way ANOVA followed by Bonferroni test for (H), (I), (M), and (O). Unpaired Student’s t-test for (P) and (Q).
Figure 2—figure supplement 1
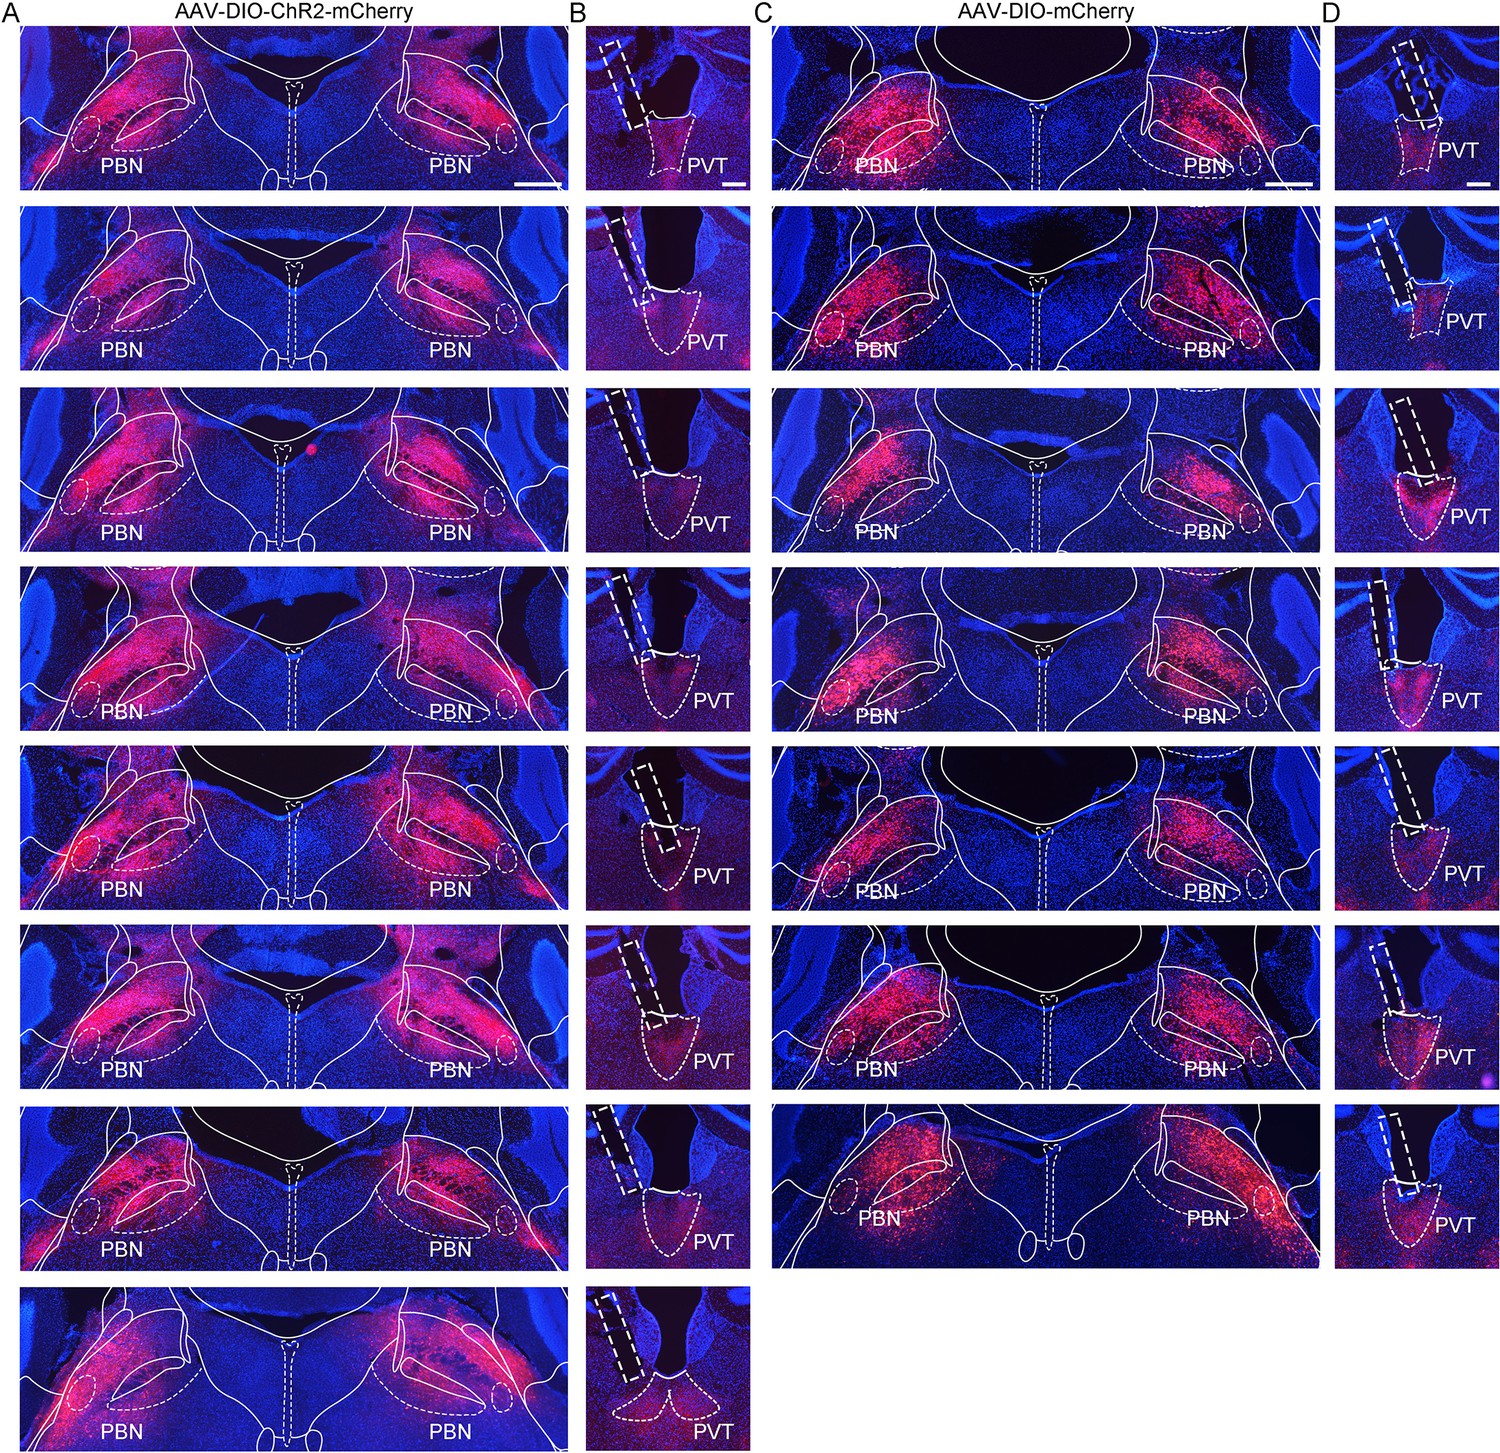
Virus expression in the parabrachial nucleus (PBN) and the optic fiber position in the paraventricular nucleus (PVT) of Vglut2-ires-Cre mice injected with AAV2/9-EF1α-DIO-ChR2-mCherry virus or AAV2/9-EF1α-DIO-mCherry virus.
(A) Histological map showing area of ChR2 expression in the PBN at bregma −5.20 mm in eight mice. Scale bar: 400 μm. (B) The position of optic fiber (rectangle) in the PVT in the AAV2/9-EF1α-DIO-ChR2-mCherry-injected mice. Scale bar: 200 μm. (C) The area of AAV2/9-EF1α-DIO-mCherry virus expression in the PBN at bregma −5.20 mm in seven mice. Scale bar: 400 μm. (D) Position of the optic fiber tip from seven mice injected with AAV2/9-EF1α-DIO-mCherry. Scale bar: 200 μm.
Figure 2—figure supplement 2

Effects of optogenetic activation of parabrachial nucleus-paraventricular nucleus (PBN-PVT) projections in the open field test (OFT) and the conditioned place aversion (CPA).
(A, B) Quantification of the immobility time (A) and the distance (B) in the OFT (mCherry group: n = 7 mice; ChR2 group: n = 8 mice). (C−F) Quantification of the velocity (C), the immobility time (D), the center time (E), the distance (F), and the number of jumps (G) during the 5–10 min laser on period in the OFT (mCherry group: n = 7 mice; ChR2 group: n = 8 mice). (H) Protocol for the prolonged CPA. (I) Photostimulation of PBN-PVT projection did not induce CPA (n = 7 mice per group). *p<0.05, **p<0.01, ***p<0.001, all data are represented as mean ± SEM. Two-way ANOVA followed by Bonferroni test for (A), (B), and (I). Two-way ANOVA with interaction factors for (C–G).
Figure 2—video 1
Optogenetic activation of parabrachial nucleus-paraventricular nucleus (PBN-PVT) projections in open field test (OFT).
The 473 nm laser (20 Hz, 5 mW, 5 ms) was delivered from 00:10 to 05:10 in the video.
Figure 2—video 2
Optogenetic activation of parabrachial nucleus-paraventricular nucleus (PBN-PVT) projections in real-time place aversion (RTPA).
The 473 nm laser (20 Hz, 5 mW, 5 ms) was delivered when the mouse entered the laser-paired chamber and withdrew when the mouse exited the laser-paired chamber during the 10 min. The video was played with 4× speed.
Figure 3 with 2 supplements

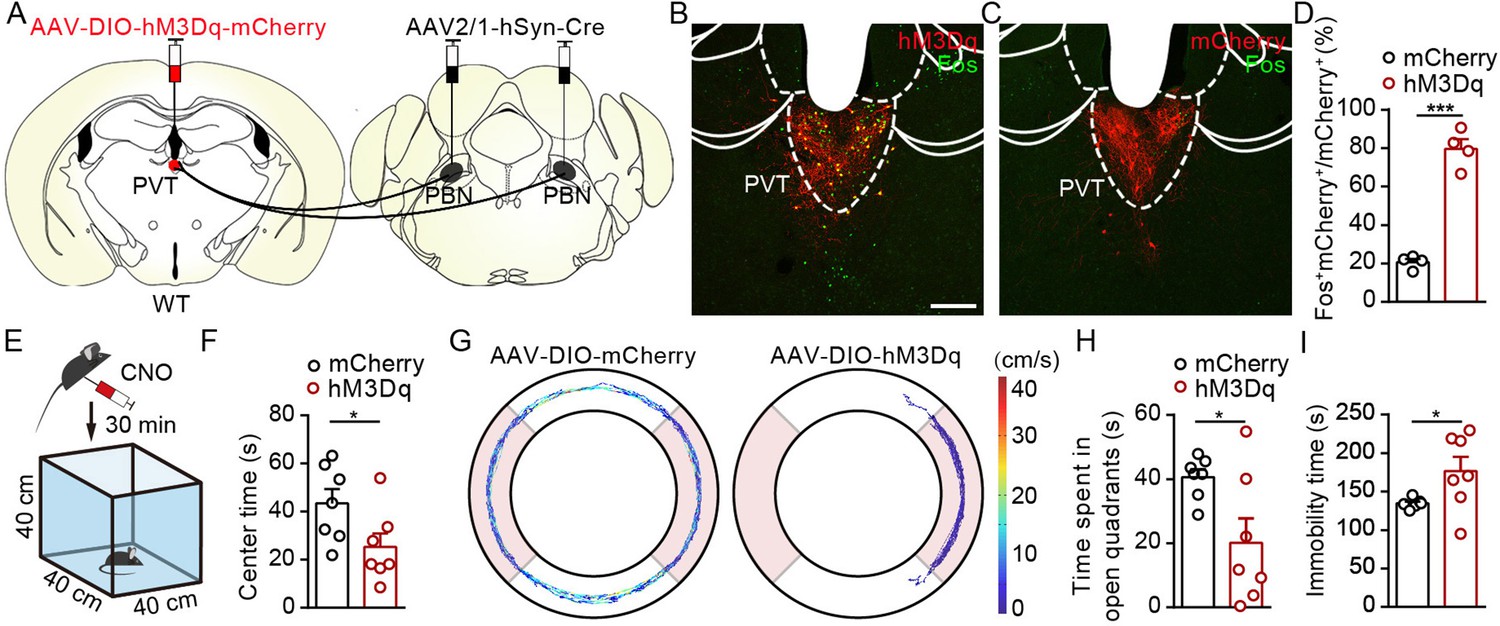
Pharmacogenetic activation of parabrachial nucleus-paraventricular nucleus (PBN-PVT) neurons induced anxiety-like behaviors and fear-like behaviors.
(A) The illustration shows virus injection of retroAAV2/2-hSyn-Cre into the PVT nucleus and bilateral injection of AAV2/9-hSyn-DIO-hM3Dq-mCherry into the PBN nucleus. (B, C) Clozapine N-oxide dihydrochloride (CNO) administration evokes Fos expression in AAV2/9-hSyn-DIO-hM3Dq-mCherry-injected mice (B) but not in AAV2/9-EF1α-DIO-mCherry-injected mice (C). Scale bar: 200 μm. (D) Percentage of co-labeled neurons in the PBN, mCherry group: n = 3 mice; hM3Dq group: n = 4 mice. (E) The illustration of the open field test (OFT) with pharmacogenetic activation. (F) Example of the OFT traces from the mice infected with AAV2/9-EF1α-DIO-mCherry or AAV2/9-hSyn-DIO-hM3Dq-mCherry. (G−I) Quantification of the center time (G), the immobility time (H), and the total distance (I) in the OFT, mCherry group: n = 7 mice; hM3Dq group: n = 8 mice. (J) Quantification of the velocity in the OFT, mCherry group: n = 7 mice; hM3Dq group: n = 5 mice. (K) Example elevated zero maze (EZM) traces from the mice infected with AAV2/9-EF1α-DIO-mCherry and AAV2/9-hSyn-DIO-hM3Dq-mCherry. (L) Quantification of the time spent in open quadrants in the EZM test, n = 8 mice per group. (M) The illustration of pharmacogenetic activation-induced fear-like freezing behavior. (N) Pharmacogenetic activation of PBN-PVT neurons induced fear-like freezing behaviors, mCherry group: n = 8 mice; hM3Dq group: n = 7 mice. *p<0.05, ***p<0.001, all data are represented as mean ± SEM. Unpaired Student’s t-test for (D), (G), (H), (I), and (J). Two-way ANOVA followed by Bonferroni test for (L) and (N).
Figure 3—figure supplement 1

Virus expression in the parabrachial nucleus (PBN) of mice injected with AAV2/9-hSyn-DIO-hM3Dq-mCherry or AAV2/9-EF1α-DIO-mCherry in the pharmacogenetic manipulation experiment.
(A) Representative histological images of hM3Dq expression in an AAV2/9-hSyn-DIO-hM3Dq-mCherry-injected mouse at brain level from bregma −5.02 mm to bregma −5.34 mm. Scale bar: 1 mm. (B) Depiction of virus infection area according to the histological images in (A). (C) Superimposed depiction of virus transduction from eight mice. (D) Representative histological images of mCherry expression in an AAV2/9-EF1α-DIO-mCherry-injected mice at brain level from bregma −5.02 mm to bregma −5.34 mm. Scale bar: 1 mm. (E) Depiction of virus infection area according to the histological images in (D). (F) Superimposed depiction of virus transduction from eight mice.
Figure 3—figure supplement 2

Pharmacogenetic activation of parabrachial nucleus-paraventricular nucleus (PBN-PVT) neurons did not affect depressive-like behaviors, basal nociceptive thresholds, formalin-induced licking behavior, or motor function.
(A) Immobility time in the tail suspension test (TST), n = 7 mice per group. (B) Immobility time in the forced swimming test (FST), mCherry group: n = 7 mice; hM3Dq group: n = 8 mice. (C, D) Effects of pharmacogenetic activation of PBN-PVT neurons on the nociceptive response tested by von Frey (C) and Hargreaves (D), n = 8 mice per group. (E, F) Duration of licking behaviors in the formalin-induced inflammatory pain test, mCherry group: n = 7 mice; hM3Dq group: n = 8 mice. Phase I: 0–10 min; phase II: 10–60 min. (G) The latency to fall in the rotarod test, n = 8 mice per group. Data are represented as mean ± SEM. Unpaired Student’s t-test for (A), (B), and (G). Two-way ANOVA followed by Bonferroni test for (C–F).
Figure 4 with 3 supplements
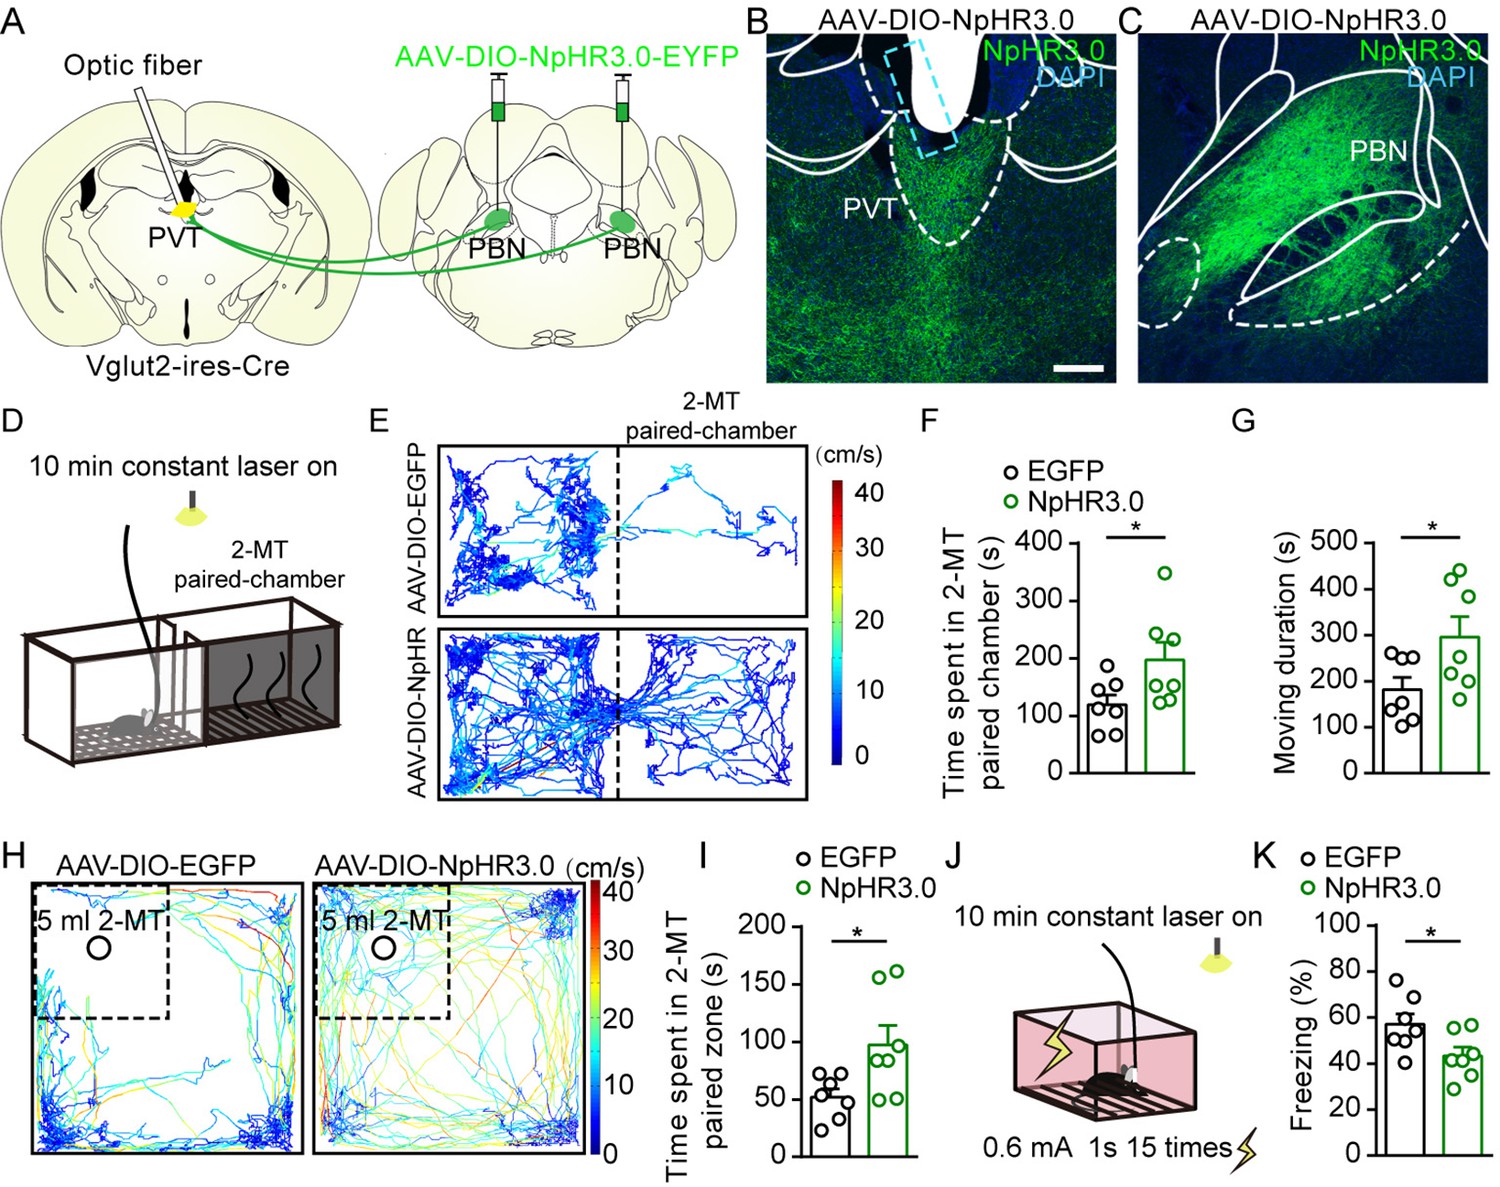
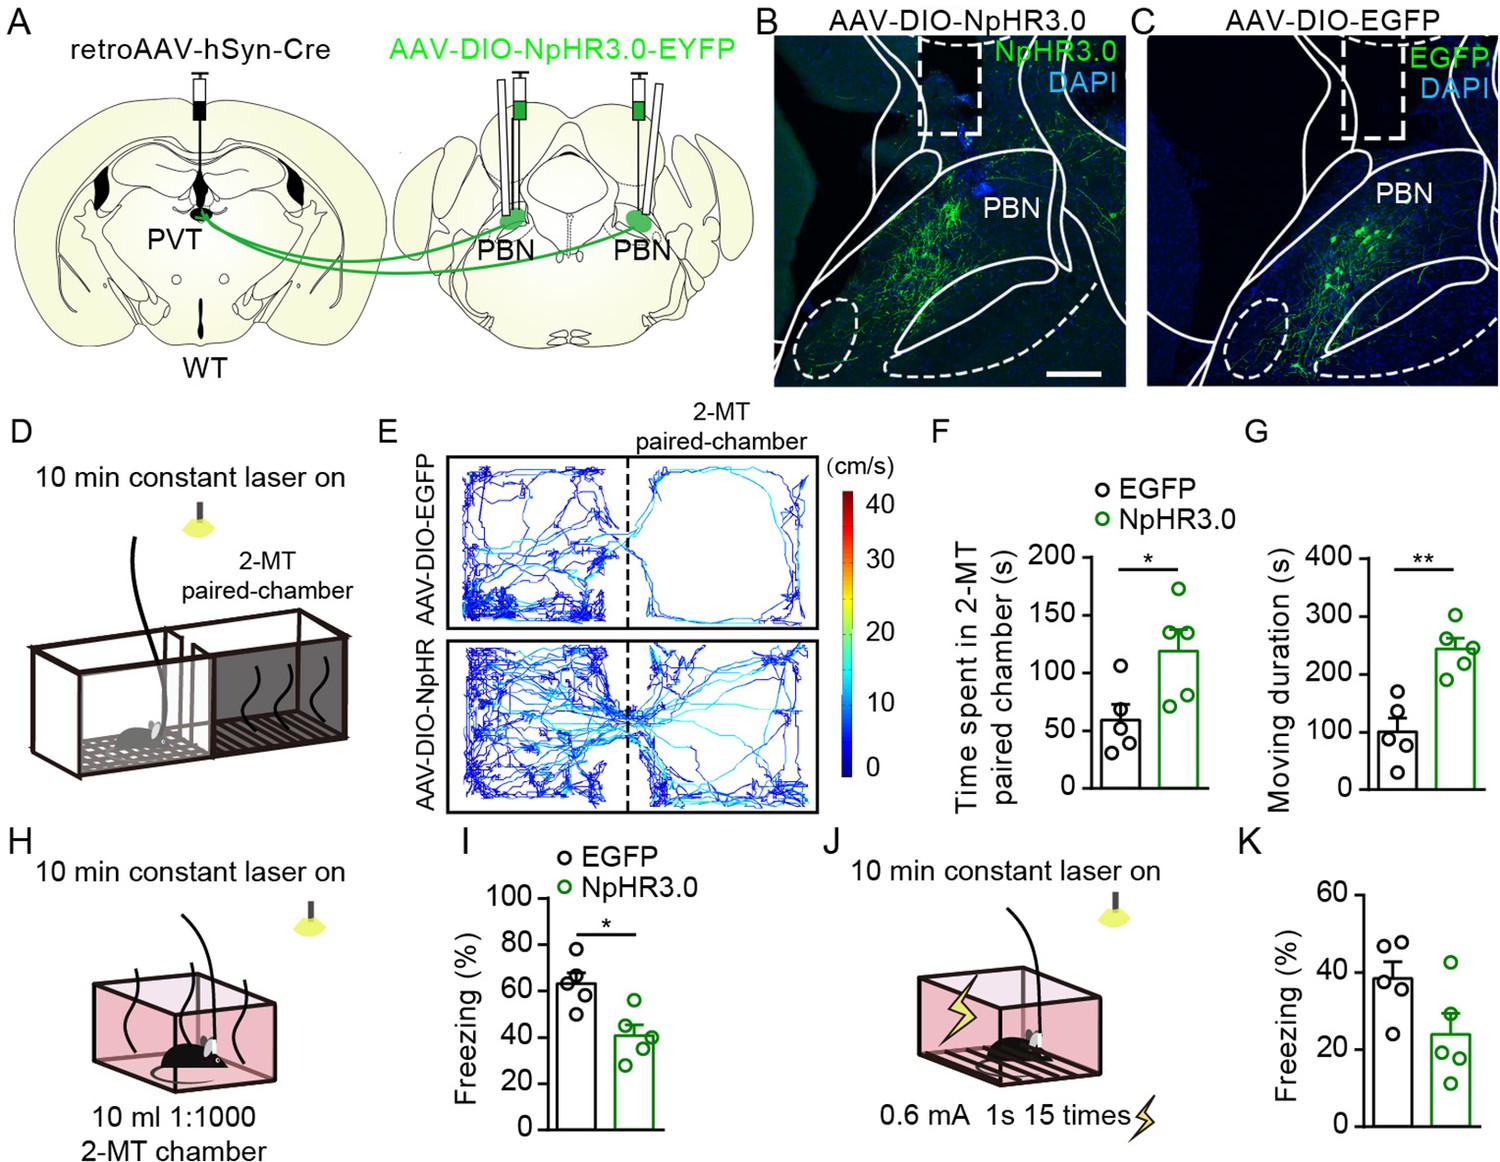
Optogenetic inhibition of parabrachial nucleus-paraventricular nucleus (PBN-PVT) projections reduced aversion-like behavior and fear-like behaviors.
(A) The illustration shows the bilateral injection of AAV2/9-EF1α-DIO-NpHR3.0-EYFP virus into the PBN and placement of optic fiber above the PVT on Vglut2-ires-Cre mice. (B, C) Examples of AAV2/9-EF1α-DIO-NpHR3.0-EYFP expression in the PVT (B) and PBN (C). The cyan rectangle represents the position of the optic fiber. Scale bar: 200 μm. (D) Schematic of 2-methyl-2-thiazoline (2-MT)-induced aversion test with optogenetic inhibition via the 589 nm laser. (E) Representative traces of the mice infected with AAV2/8-EF1α-DIO-EGFP or AAV2/9-EF1α-DIO-NpHR3.0-EYFP in two chambers. (F, G) Quantification of the time spent in the 2-MT paired chamber (F) and the total moving duration (G), n = 7 mice per group. *p<0.05, **p<0.01, (H) Representative traces of the mice infected with AAV2/8-EF1α-DIO-EGFP or AAV2/9-EF1α-DIO-NpHR3.0-EYFP in the open field test (OFT) chamber. (I) Quantification of the time spent in the 2-MT zone, n = 7 mice per group. (J) Illustration of footshock-induced freezing behavior with optogenetic inhibition via a 589 nm laser. (K) Quantification of the freezing behavior, n = 7 mice per group. *p<0.05, all data are represented as mean ± SEM. Unpaired Student’s t-test for (F), (G), (I), and (K).
Figure 4—figure supplement 1
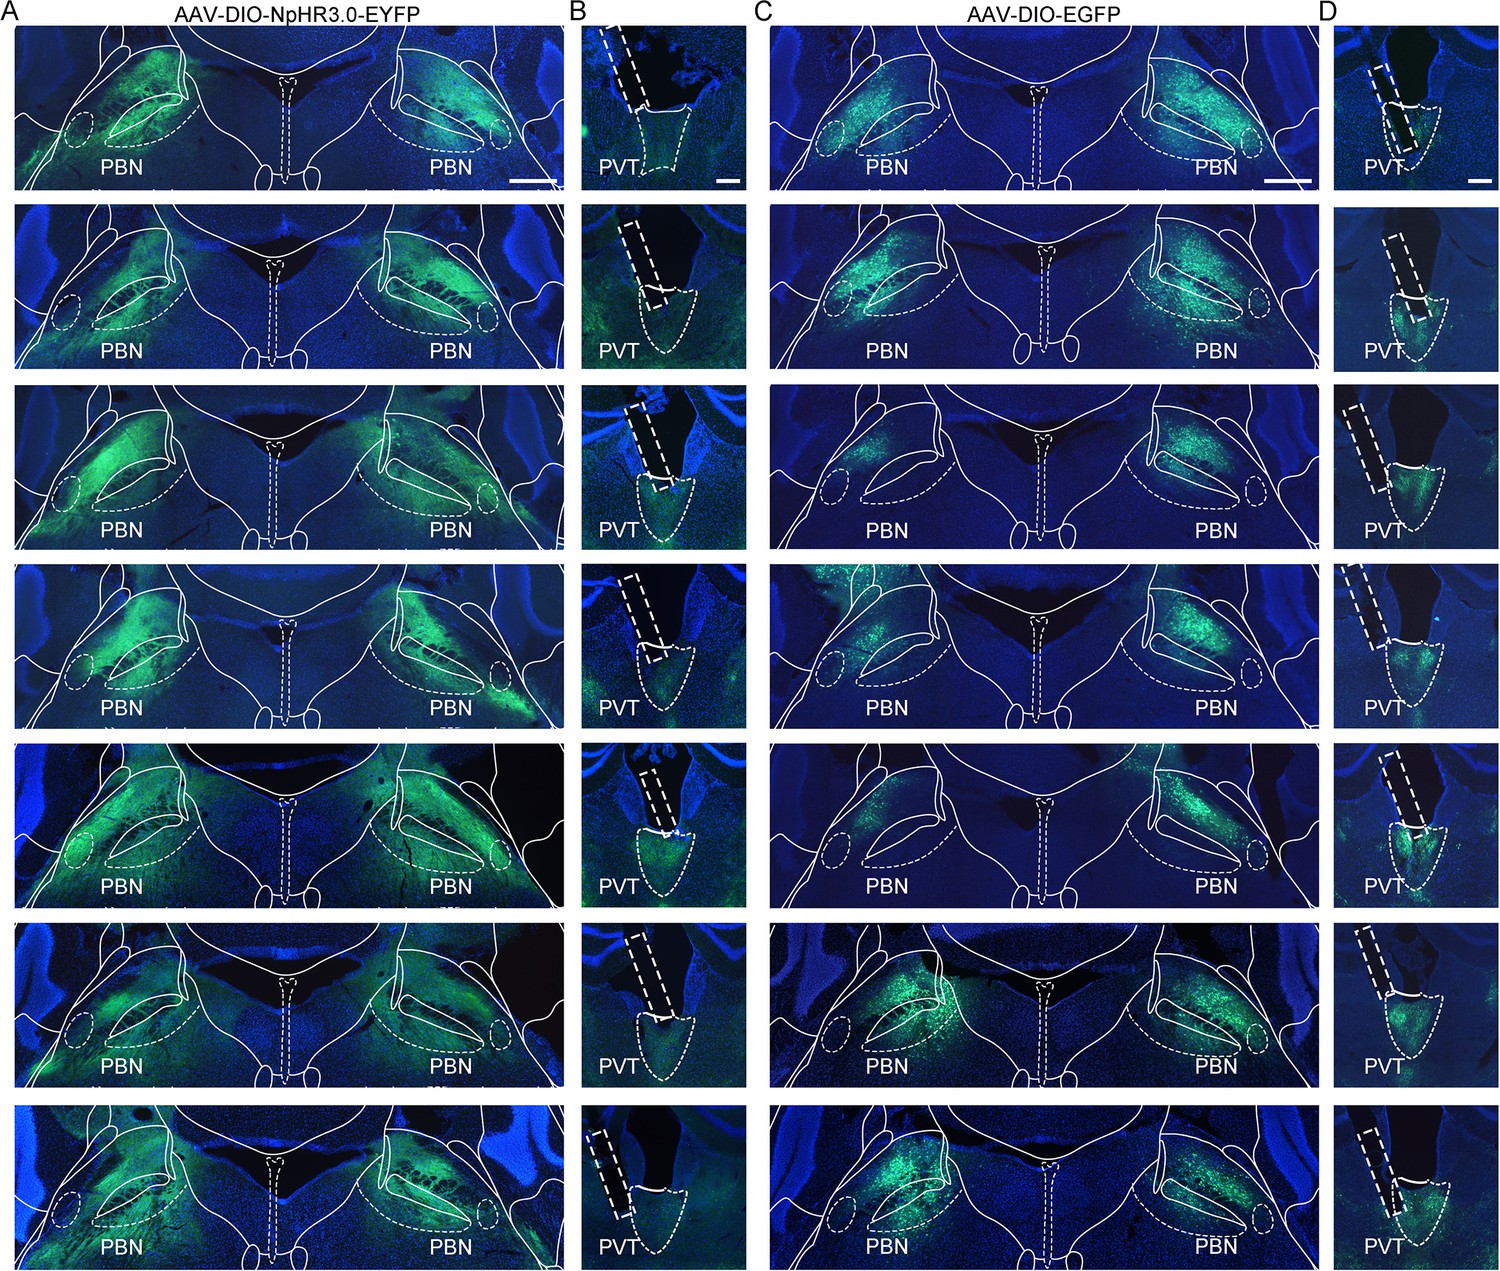
Virus expression in the parabrachial nucleus (PBN) and the optic fiber position in the paraventricular nucleus (PVT) of Vglut2-ires-Cre mice injected with AAV2/9-EF1α-DIO-NpHR3.0-EYFP or AAV2/8-EF1α-DIO-EGFP.
(A) Histological map showing area of NpHR3.0 expression in the PBN at bregma −5.20 mm in seven mice. Scale bar: 400 μm. (B) The position of optic fiber (rectangle) in the PVT in the AAV2/9-EF1α-DIO-NpHR3.0-EYFP-injected mice. Scale bar: 200 μm. (C) The area of AAV2/8-EF1α-DIO-EGFP expression in the PBN at bregma −5.20 mm in seven mice. Scale bar: 400 μm. (D) Position of the optic fiber tip from seven mice injected with AAV2/9-EF1α-DIO-mCherry. Scale bar: 200 μm.
Figure 4—figure supplement 2

Optogenetic inhibition of parabrachial nucleus-paraventricular nucleus (PBN-PVT) projections did not affect associative fear memory acquisition and retrieval.
(A) The protocol of auditory fear conditioning experiments with optogenetic inhibition of the PBN-PVT projection. (B−D) Quantification of freezing levels during condition trials (B), contextual test (C), and cue test (D), n = 7 mice per group. The yellow box indicates optogenetic inhibition. All data are represented as mean ± SEM, two-way ANOVA followed by Bonferroni test for (B–D).
Figure 4—figure supplement 3
Optogenetic inhibition of the parabrachial nucleus-paraventricular nucleus (PBN-PVT) neurons reduced aversion-like behavior and fear-like freezing behavior.
(A) The illustration shows virus injection of retroAAV2/2-hSyn-Cre into the PVT, bilateral injection of AAV2/9-EF1α-DIO-NpHR3.0-EYFP into the PBN, and bilateral placement of optic fiber above the PBN on WT mice. (B, C) Examples of AAV2/9-EF1α-DIO-NpHR3.0-EYFP (B) and AAV2/8-EF1α-DIO-EGFP (C) expression in the PBN, the rectangle represents the position of the optic fiber. Scale bar: 200 μm. (D) Schematic of 2-methyl-2-thiazoline (2-MT)-induced aversion test with optogenetic inhibition via a 589 nm laser. (E) Representative traces of the mice infected with AAV2/8-EF1α-DIO-EGFP or AAV2/9-EF1α-DIO-NpHR3.0-EYFP in the chamber. (F, G) Quantification of the time spent in the 2-MT paired chamber (F) and the moving duration (G), n = 5 mice per group. (H) Schematic of 2-MT-induced fear-like freezing behavior with optogenetic inhibition via a 589 nm laser. (I) Quantification of the freezing behavior, n = 5 mice per group. (J) Illustration of footshock-induced freezing behavior with optogenetic inhibition via a 589 nm laser. (K) Quantification of the freezing behavior, n = 5 mice per group.*p<0.05, **p<0.01, all data are represented as mean ± SEM. Unpaired Student’s t-test for (F), (G), (I), and (K).
Figure 5 with 1 supplement
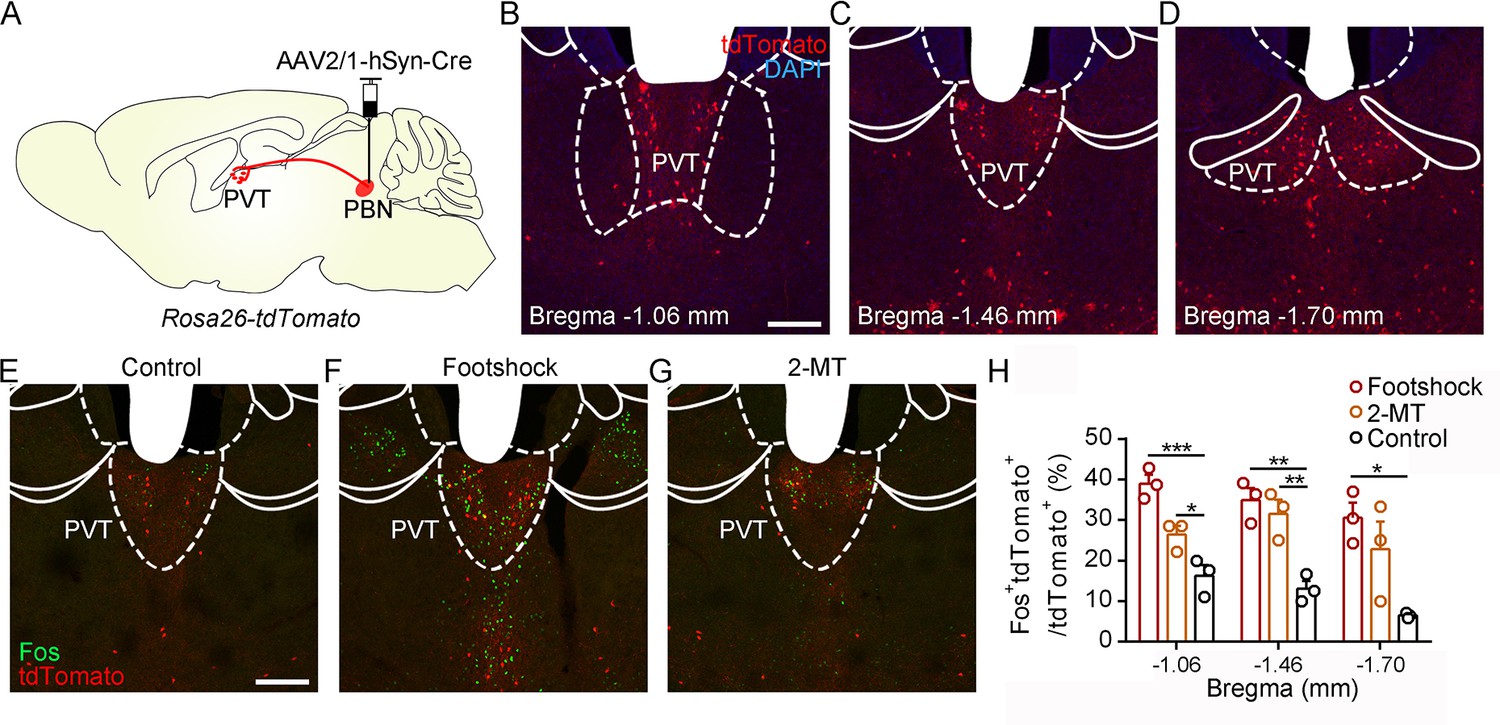
Activation of PVTPBN neurons by diverse aversive stimuli.
(A) The illustration shows the injection of AAV2/1-hSyn-Cre into the parabrachial nucleus (PBN) of Rosa26-tdTomato mice. (B−D) The distribution of the neurons in the paraventricular nucleus (PVT) at bregma –1.06 mm (B), bregma –1.46 mm (C), and bregma –1.70 mm (D). Scale bar: 200 μm. (E−G) Fos induced by habituation control (E), footshock (F), or 2-methyl-2-thiazoline (2-MT) (G) co-labeled with the tdTomato-positive neurons in the PVT. Scale bar: 200 μm. (H) Quantification of the co-labeled neurons, n = 3 mice per group. *p<0.05, **p<0.01, ***p<0.001, all data are represented as mean ± SEM, one-way ANOVA followed by Bonferroni test for (H).
Figure 5—figure supplement 1

Calcium signals of paraventricular nucleus (PVT) neurons in response to aversive stimuli.
(A) Schematic shows injection of AAV2/8-hSyn-GCaMP6s into the PVT and placement of the optic fiber above the PVT. (B) Representative of GCaMP6s expression and the position of optic fiber in the PVT. Scale bar: 400 μm. (C, D) The calcium signal of the PVT neurons (C) and the quantification of the average Ca2+ signal before and after footshock (D). The black bar represents the baseline period (B.s, –1 to –0.5 s), and the red bar represents the post-stimulus period (Post, 0.5–1 s), n = 5 mice. (E, F) The calcium signal of the PVT neurons (E) and the quantification of average Ca2+ signal before and after air puff (F), n = 5 mice. **p<0.01, all data are represented as mean ± SEM. Paired Student’s t-test for (D) and (F).
Figure 6 with 2 supplements
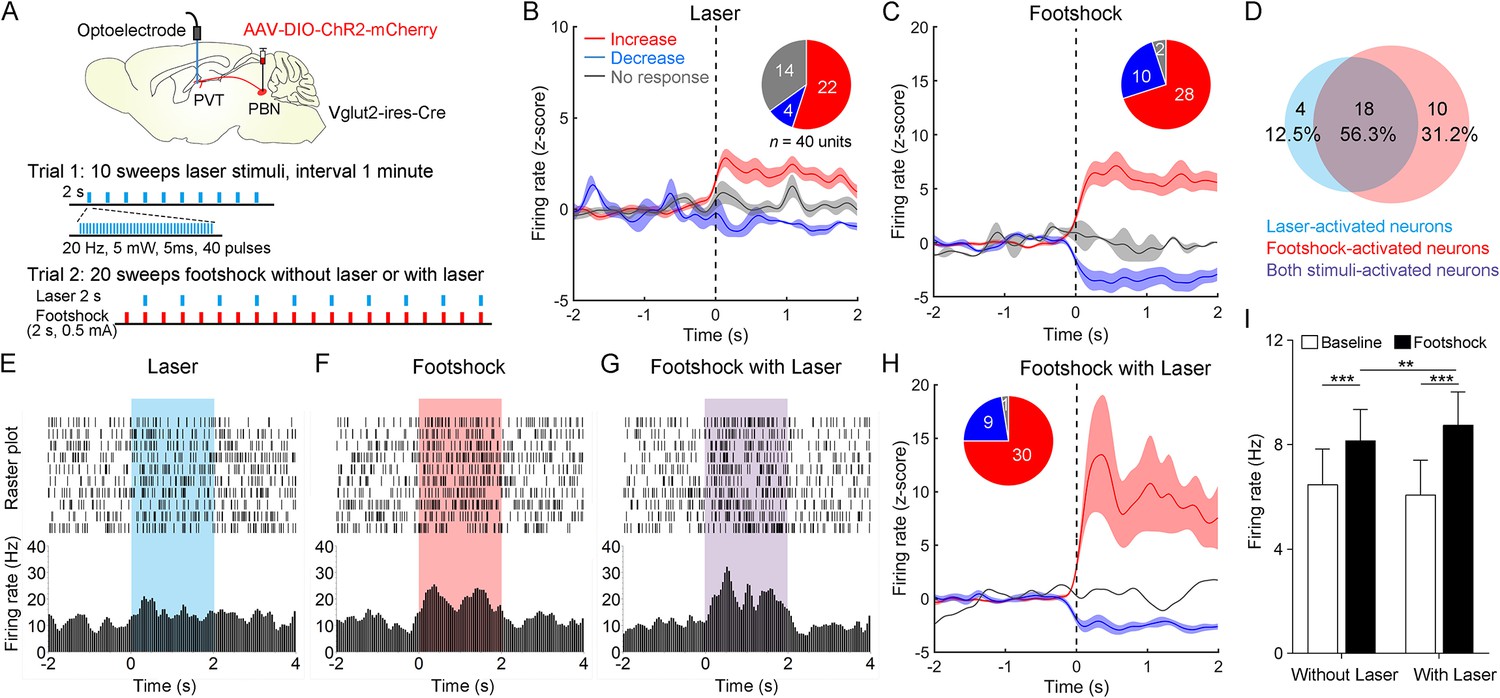
Neuronal activity of paraventricular nucleus (PVT) neurons in response to the footshock was modulated by parabrachial nucleus (PBN)-PVT projections.
(A) Top: schematic shows injection of AAV2/9-EF1α-DIO-ChR2-mCherry into the PBN and placement of the optoelectrode above the PVT of Vglut2-ires-Cre mice. Bottom: the protocol of 10 sweeps of laser stimuli (Trial 1) and 20 sweeps of footshock stimuli without or with laser (Trial 2). (B) Firing rates (z-score) of 40 neurons during laser stimuli (20 Hz, 5 mW, 5 ms, 2 s). Inset: percentages of different groups of neurons according to z-score. (C) Firing rates (z-score) of 40 neurons during footshock (0.5 mA, 2 s) without laser stimuli. (D) Percentage of laser-activated, footshock-activated, and both stimuli-activated neurons. (E–G) Rastergrams and firing rates show the spiking activity of one PVT neuron during laser stimulus (E), footshock without laser stimulus (F), and footshock with laser stimulus (G). (H) Firing rates (z-score) of 40 neurons during footshock (0.5 mA, 2 s) with laser stimuli (20 Hz, 5 mW, 5 ms, 2 s). (I) Quantification of the firing rates of 40 neurons before and during footshock without and with laser, n = 40 neurons. **p<0.01, ***p<0.001, all data are represented as mean ± SEM, two-way ANOVA followed by Bonferroni test for (I).
Figure 6—figure supplement 1
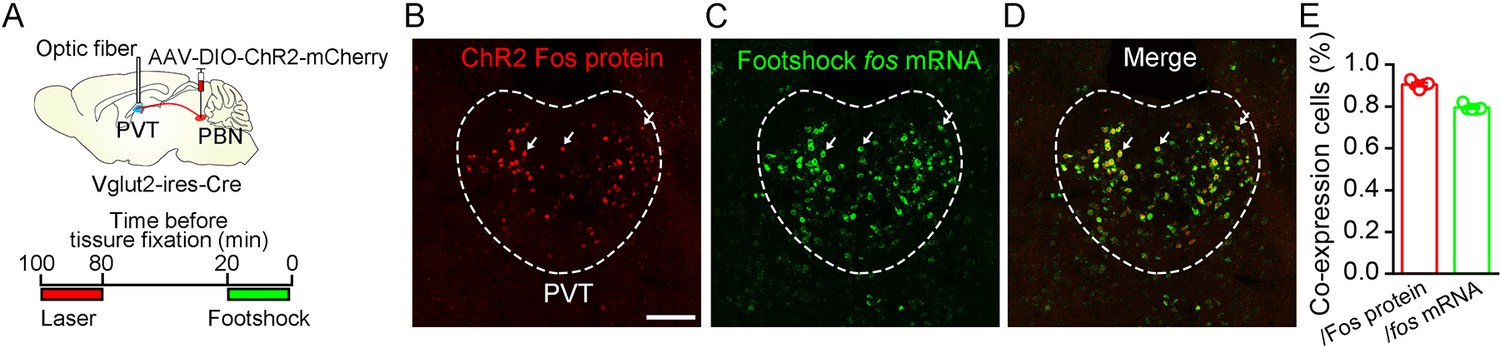
Dual Fos staining detecting Fos protein and fos mRNA induced by laser stimulation and footshock.
(A) Top: schematic shows injection of AAV2/9-EF1α-DIO-ChR2-mCherry into the parabrachial nucleus (PBN) and placement of the optic fiber above the paraventricular nucleus (PVT) of Vglut2-ires-Cre mice. Bottom: time windows containing laser (20 Hz, 5 mW, 5 ms) and shock stimuli (0.5 mA, 1 s, 30 times), separated by 60 min of the rest period. (B−D) Example of Fos protein and fos mRNA expression in the PVT. Red fluorescence represents Fos protein induced by laser stimulus, and green fluorescence represents fos mRNA detected by in situ hybridizations. Arrows indicate double-positive neurons, Scale bar: 100 μm. (E) The proportion of co-expression neurons over Fos protein-expressing cells and fos mRNA-expressing cells, n = 5 mice.
Figure 6—figure supplement 2

The response latency of paraventricular nucleus (PVT) neurons to laser activation and footshock activation.
(A) Response latency of laser-activated PVT neurons (n = 23 neurons). (B) The histogram of response latency of laser-activated PVT neurons (less than 14 ms, n = 12 neurons). (C) Response latency of footshock-activated PVT neurons (n = 28 neurons). (D) The histogram of response latency of footshock-activated PVT neurons (less than 14 ms, n = 13 neurons).
Figure 7 with 1 supplement
Activation of PVTPBN neurons induced anxiety-like behaviors.
(A) The illustration shows injection of AAV2/1-hSyn-Cre into the parabrachial nucleus (PBN) and AAV2/9-hSyn-DIO-hM3Dq-mCherry into the paraventricular nucleus (PVT). (B, C) Clozapine N-oxide dihydrochloride (CNO) administration evoked Fos expression in AAV2/9-hSyn-DIO-hM3Dq-mCherry-injected mice (B) but not in AAV2/9-EF1α-DIO-mCherry-injected mice (C). Scale bar: 200 μm. (D) Percentage of co-labeled neurons in the PVT, n = 4 mice per group. (E) The illustration of the open field test (OFT) with pharmacogenetic activation. (F) Quantification of center time in the OFT, n = 7 mice per group. (G) Example of elevated zero maze (EZM) traces from the mice injected with AAV2/9-EF1α-DIO-mCherry or AAV2/9-hSyn-DIO-hM3Dq-mCherry. (H, I) Quantification of the time spent in open quadrants (H) and the immobility time in the EZM test (I), n = 7 mice per group. *p<0.05, ***p<0.001, all data are presented as mean ± SEM. Unpaired Student’s t-test for (D), (F), (H), and (I).
Figure 7—figure supplement 1

Distribution pattern of projection fibers of PVTPBN neurons.
(A) The illustration shows injection of AAV2/1-hSyn-Cre into the parabrachial nucleus (PBN) and AAV2/8-EF1α-DIO-EGFP into the paraventricular nucleus (PVT) of Rosa26-tdTomato mice. (B) The representative image of EGFP and tdTomato-transduced neurons in the PVT. Scale bar: 200 μm. (C−G) Distribution patterns of EGFP fibers in the PFC (C), CI (D), NAc (E), BNST (F), and CeA (G). PFC, prefrontal cortex; IC, insular cortex; CI, claustrum; NAc, nucleus accumbens core; BNST, bed nucleus of the stria terminalis; CeA, central nucleus of the amygdala; BLA, basolateral amygdala; ZI, zona incerta, Scale bar: 200 μm. (H) Quantification of the fiber intensity in these brain regions, n = 3 mice.
Tables
Key resources table
| Reagent type (species) or resource | Designation | Source or reference | Identifiers | Additional information |
|---|---|---|---|---|
| Genetic reagent (Mus musculus) | B6.Cg-Gt(ROSA)26Sortm9(CAG-tdTomato)Hze/J (Ai9) | Jackson Laboratory | Stock# 007909;RRID:MGI:3813511 | Dr. Hua-Tai Xu (Institutes of Neuroscience, Chinese Academic of Sciences) |
| Genetic reagent (M. musculus) | STOCK Slc17a6tm2(cre)Lowl/J (Vglut2-ires-Cre) | Jackson Laboratory | Stock# 016963;RRID:MGI:5300532 | Dr. Yan-Gang Sun (Institutes of Neuroscience, Chinese Academic of Sciences) |
| Genetic reagent (Dependoparvovirus) | AAV2/8-hSyn-ChR2-mCherry | Obio Technology | Cat# AG26976 | 4 × 10¹² v.g./mL |
| Genetic reagent (Dependoparvovirus) | AAV2/8-EF1α-DIO-EGFP | Taitool Bioscience | Cat# S0270 | 4 × 10¹² v.g./mL |
| Genetic reagent (Dependoparvovirus) | retroAAV2/2-hSyn-Cre | Taitool Bioscience | Cat# S0278-2RP-H20 | 4 × 10¹² v.g./mL |
| Genetic reagent (Dependoparvovirus) | AAV2/9-EF1α-DIO-ChR2-mCherry | Taitool Bioscience | Cat# S0170-9-L20 | 4 × 10¹² v.g./mL |
| Genetic reagent (Dependoparvovirus) | AAV2/9-EF1α-DIO-mCherry | Obio Technology | Cat# AG20299 | 4 × 10¹² v.g./mL |
| Genetic reagent (Dependoparvovirus) | AAV2/9-hSyn-DIO-hM3Dq-mCherry | BrainVTA | Cat# PT-0019 | 4 × 10¹² v.g./mL |
| Genetic reagent (Dependoparvovirus) | AAV2/9-EF1α-DIO-NpHR3.0-EYFP | Obio Technology | Cat# AG26966 | 4 × 10¹² v.g./mL |
| Genetic reagent (Dependoparvovirus) | AAV2/8-hSyn-GCaMP6s | Taitool Bioscience | Cat# S0225-8 | 4 × 10¹² v.g./mL |
| Genetic reagent (Dependoparvovirus) | AAV2/1-hSyn-Cre | Taitool Bioscience | Cat# S0278-1-H50 | 1.5 × 10¹³ v.g./mL |
| Sequence-based reagent | RNAscope Probe-fos-C2 | Advanced Cell Diagnostics | Cat# 316921-C2 | |
| Sequence-based reagent | RNAscope Probe-Tac1-C2 | Advanced Cell Diagnostics | Cat# 410351-C2 | |
| Sequence-based reagent | RNAscope Probe-Tacr1-C2 | Advanced Cell Diagnostics | Cat# 428781-C2 | |
| Sequence-based reagent | RNAscope Probe-Pdyn | Advanced Cell Diagnostics | Cat# 318771 | |
| Sequence-based reagent | RNAscope Probe- Slc17a6-C2 | Advanced Cell Diagnostics | Cat# 319171-C2 | |
| Antibody | Anti-Fos (rabbit polyclonal) | Abcam | Cat# ab190289; RRID:AB_2737414 | IF (1:4000) |
| Antibody | Anti-CGRP (goat polyclonal) | Abcam | Cat# ab36001; RRID:AB_725807 | IF (1:1000) |
| Antibody | Anti-DsRed (goat polyclonal) | Takara Bio | Cat# 632496; RRID:AB_10013483 | IF (1:500) |
| Antibody | Alexa Fluor 488 AffiniPure Donkey Anti-Rabbit IgG (H+L) | Jackson ImmunoResearch Labs | Cat# 711-545-152; RRID:AB_2313584 | IF (1:400) |
| Antibody | Cy3 AffiniPure Donkey Anti-Rabbit IgG (H+L) | Jackson ImmunoResearch Labs | Cat# 711-165-152; RRID:AB_2307443 | IF (1:400) |
| Antibody | Alexa Fluor 488 AffiniPure F(ab’)2 Fragment Donkey Anti-Goat IgG (H+L) | Jackson ImmunoResearch Labs | Cat# 705-546-147; RRID:AB_2340430 | IF (1:400) |
| Commercial assay or kit | RNAscope Multiplex Fluorescent Reagent Kit v2 | Advanced Cell Diagnostics | Cat# 320293 | |
| Software, algorithm | ImageJ | NIH | ||
| Software, algorithm | LabState | AniLab |
Additional files
Download links
A two-part list of links to download the article, or parts of the article, in various formats.
Downloads (link to download the article as PDF)
Open citations (links to open the citations from this article in various online reference manager services)
Cite this article (links to download the citations from this article in formats compatible with various reference manager tools)
PBN-PVT projections modulate negative affective states in mice
eLife 11:e68372.
https://doi.org/10.7554/eLife.68372


