Similar neural and perceptual masking effects of low-power optogenetic stimulation in primate V1
- Department of Neurosurgery, Rutgers University, United States
- Center for Perceptual Systems, The University of Texas at Austin, United States
- Department of Psychology, University of Texas, United States
- Department of Neuroscience, University of Texas, United States
- CNC Program, Stanford University, United States
- Department of Bioengineering, Stanford University, United States
- Neurosciences Program, Stanford University, United States
- Department of Psychiatry and Behavioral Sciences, Stanford University, United States
- Howard Hughes Medical Institute, Stanford University, United States
- Neurosciences Program, University of Texas, United States
Figures
Figure 1
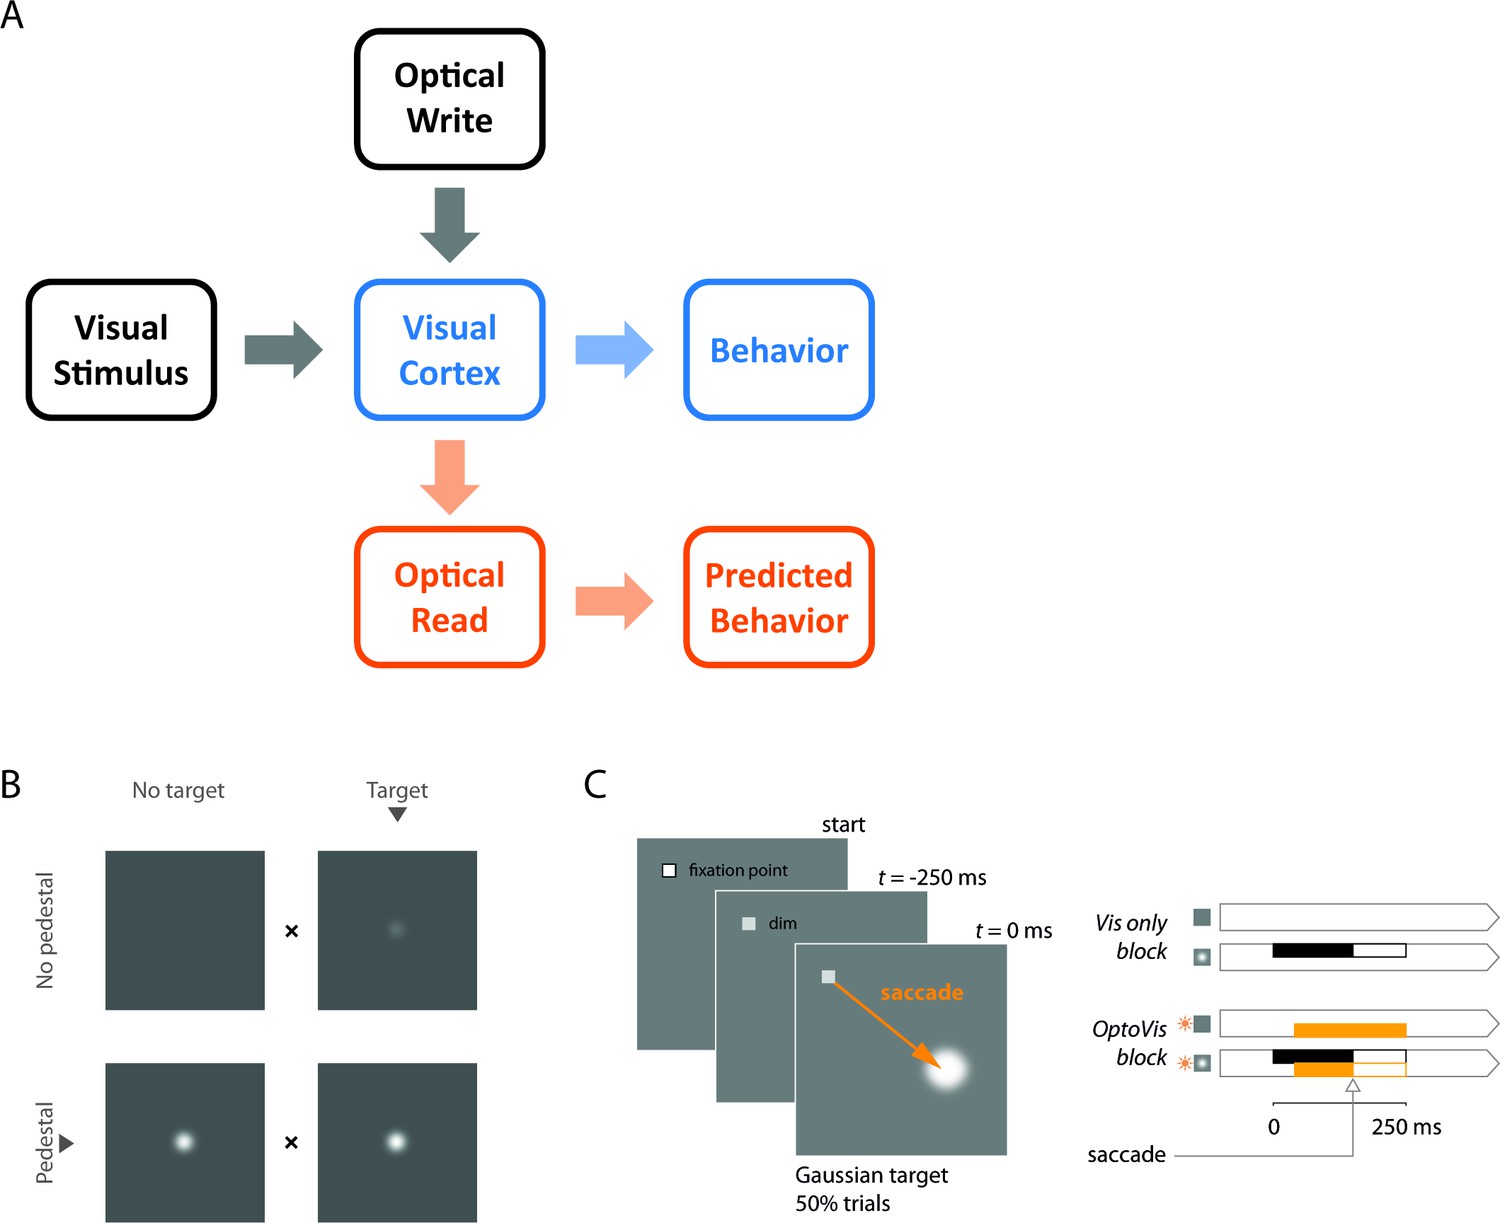
A general framework for bi-directional optical-genetic probing of the visual cortex in behaving monkeys, a demonstration of visual masking, and a detection task for probing the masking effect of V1 optostimulation.
(A) General framework. Our optical-genetic toolkit allows us to provide the subject with two types of inputs either separately or in combination: (i) visual (‘visual stimulus’) and (ii) direct optostimulation (‘optical write’). At the same time, we have access to two outputs: (i) neural responses measured by widefield optical imaging (‘optical read’) and (ii) behavioral responses (‘behavior’). Imaging allows us to measure the neural impact of the inserted signals, calibrate the evoked neural population responses, and compare them to those evoked by sensory stimuli. Finally, the neural and perceptual consequences of these inserted signals can be assessed and compared with theoretical predictions. Here, we use this toolkit to measure the interactions between visual and direct optostimulation in macaque V1. (B) Demonstration of visual masking. When fixating on the ‘x’ between the pair of panels, a visual target (a dim white Gaussian) can be easily detected when added to a uniform gray background (top), but is much harder to detect when added to a Gaussian pedestal mask (bottom), a phenomenon known as luminance masking (Cornsweet and Pinsker, 1965; Whittle and Swanston, 1974). The goal of the current study was to determine whether direct optogenetic stimulation of V1 can substitute for a visual mask and elevate detection threshold of a visual target. Note that in the actual behavioral task, only a single stimulus was presented in one hemifield. The animal had to distinguish between ‘target’ and ‘no-target’ and conditions with ‘pedestal’ and with ‘no pedestal’ were run in separate blocks (see panel C). (C) The behavioral task adopted to quantify the masking effects of optostimulation. Two monkeys were trained to detect a small white Gaussian target that appeared at a known location 250 ms after a temporal cue (dimming of the fixation point) in half of the trials. The monkeys indicated target absence by maintaining fixation at the fixation point and target presence by shifting gaze to the target location as soon as it was detected. The visual target was present for a maximum of 250 ms and was terminated as soon as the monkey initiated a saccade. The optostim was initiated 40 ms after the expected time of target onset (to account for the latency of V1 responses) and was terminated together with the visual stimulus. Blocks of trials without optostim (right top) and with optostim (right bottom) were run separately. In optostim blocks, optostim (orange) was applied on every trial, acting as a substitute for the visual mask ('pedestal') in B. The monkeys were always rewarded based on the presence or absence of the visual target only (right panels, black), irrespective of the optostim condition (orange).
Figure 2 with 3 supplements
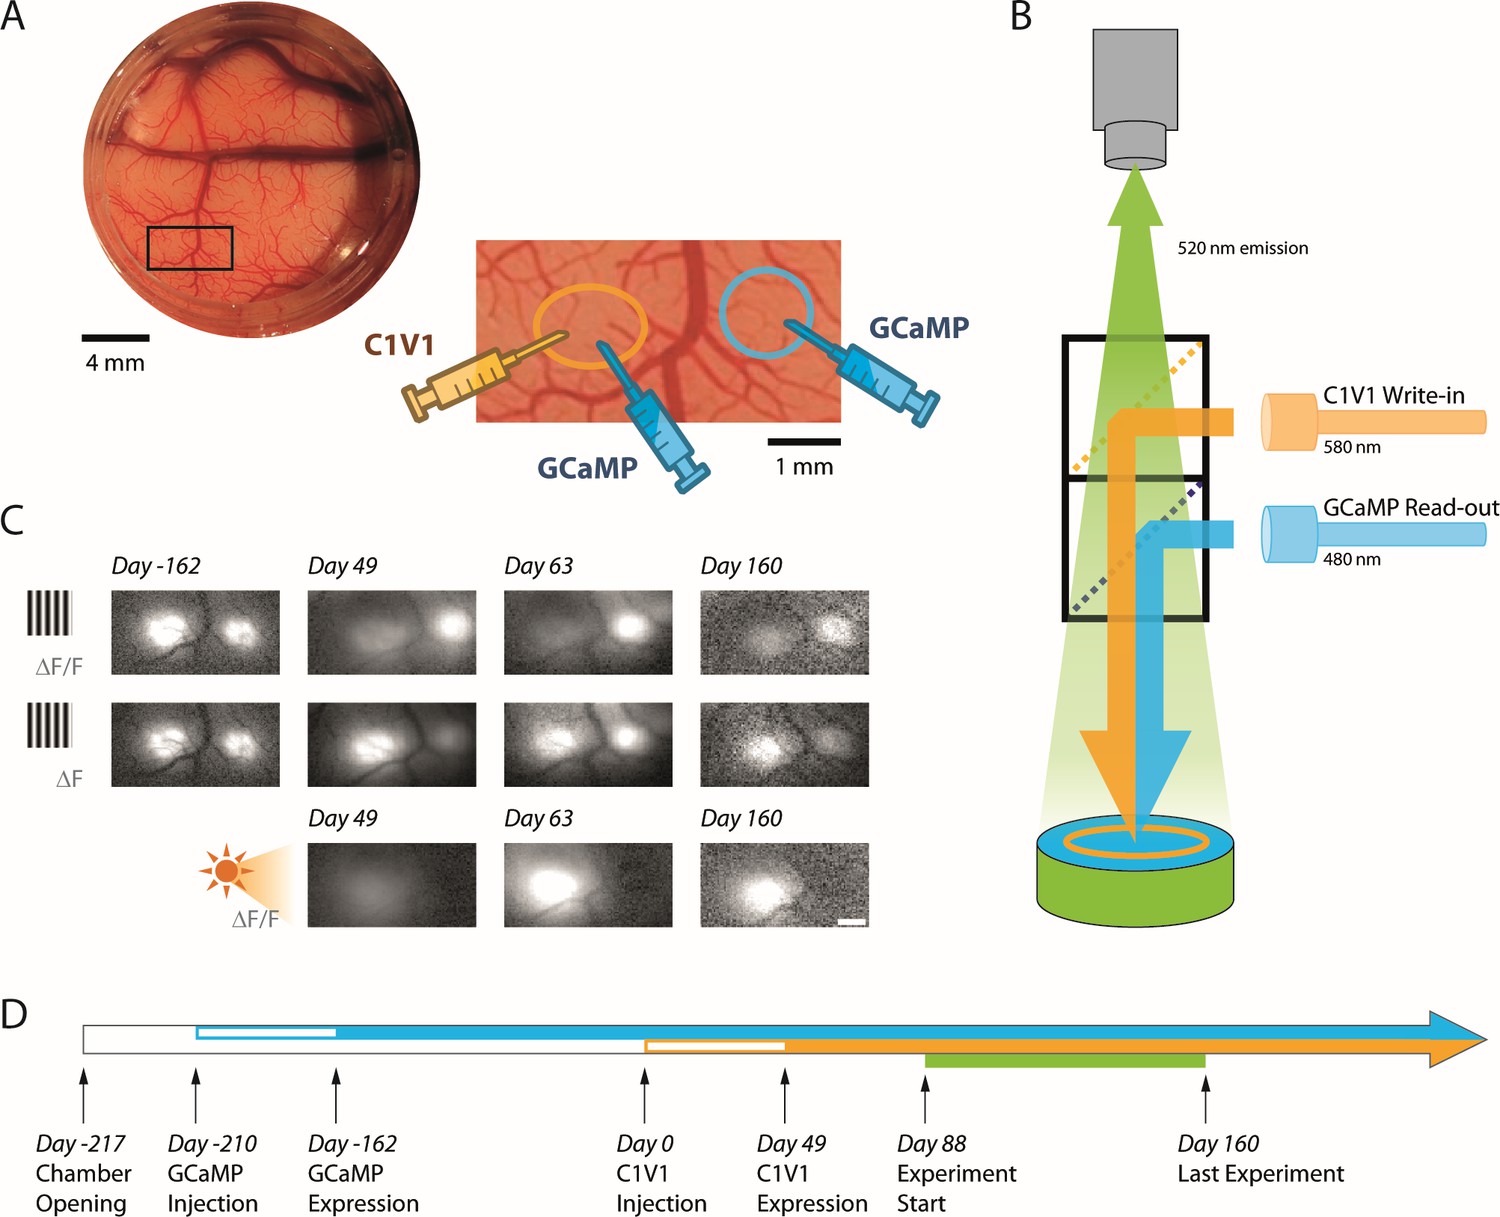
Simultaneous calcium imaging and optostim in V1 of monkeys performing a visual detection task.
(A) Top left: Picture of cranial window over macaque V1 in Monkey L seen through the artificial dura, with a region of interest indicated by the black rectangle. Bottom right: The zoomed in region encompasses two nearby injection sites of viral vectors that are about 3 mm apart (~0.6° separation between the corresponding receptive fields). The vector carrying the transgene for the calcium indicator GCaMP6f was injected at both sites. The vector carrying the transgene for the opsin C1V1 was only injected at the site on the left after GCaMP expression was verified (panel C, top). We refer to the site with GCaMP and C1V1 as the ‘C1V1-site’ and the site with GCaMP only as the ‘GCaMP-only’ site. The centers of the receptive fields of the V1 neurons were 1.5° eccentricity (–35° from the right-hand horizontal meridian) at the C1V1 site and 2.0° eccentricity (–45° from the horizontal meridian) at the GCaMP-only site. (B) Schematic diagram of our combined imaging and optostim setup. To image the calcium indicator GCaMP6f signals, the cortex is illuminated through a dichroic mirror with blue light (480 nm). Green fluorescent signals reflecting increase in intracellular calcium concentration due to neural activity are collected by a sensitive sCMOS camera. To stimulate the red-shifted opsin C1V1, orange light (580 nm) is reflected to the cortex through a second dichroic mirror. The blue and orange lights are blocked from the camera by the dichroic mirrors and an emission filter so that the camera only collects the green fluorescent signals. Note that imaging was performed simultaneously at both sites and that light stimulation covered both sites. (C) Response maps for visual and optostim in Monkey L at different time points. A large visual grating evoked a GCaMP response at both sites (top and middle rows). When expressed as ∆F/F (top row), visual-evoked response at the C1V1 site was weaker following C1V1 expression due to increase baseline fluorescence from the eYFP that is attached to the C1V1 (see Materials and methods). When considering ∆F (middle row), the response evoked by the visual stimulus is comparable at the two sites. Optostim with stimulation light covering both locations elicits a strong GCaMP response at the C1V1 site and little or no response at the GCaMP-only site (bottom row). Scale bar 1 mm. (D) Timeline of GCaMP and C1V1 viral injections, first detection of expression, and behavioral experiments in Monkey L.
Figure 2—figure supplement 1

Stable expression of GCaMP and C1V1 in Monkey T.
(A) Timeline of GCaMP and C1V1 viral injections, first detection of expression, and behavioral experiments in Monkey T. (B) Cortical chamber with a region of interest (ROI) encompassing the GCaMP-only and C1V1 viral injections sites. For Monkey T, these sites are about 4 mm apart (corresponding to ~ 0.7° separation in the visual field). The centers of the receptive fields of the V1 neurons were 2.7° eccentricity (–46° from the right-hand horizontal meridian) at the C1V1 site and 2.0° eccentricity (–40° from the horizontal meridian) at the GCaMP-only site. (C) Visual response to a large grating evokes a GCaMP response at both sites before and after C1V1 injection (first and second rows). Optostim with light stimulation at both locations elicits a strong GCaMP response at the site with C1V1 and little or no response at the site with only GCaMP (third row). The photo of the cortex at day 0 (C1V1 injection) shows the blue dye that we co-inject with the viral vector to visualize the injection site. Scale bar 1 mm.
Figure 2—figure supplement 2
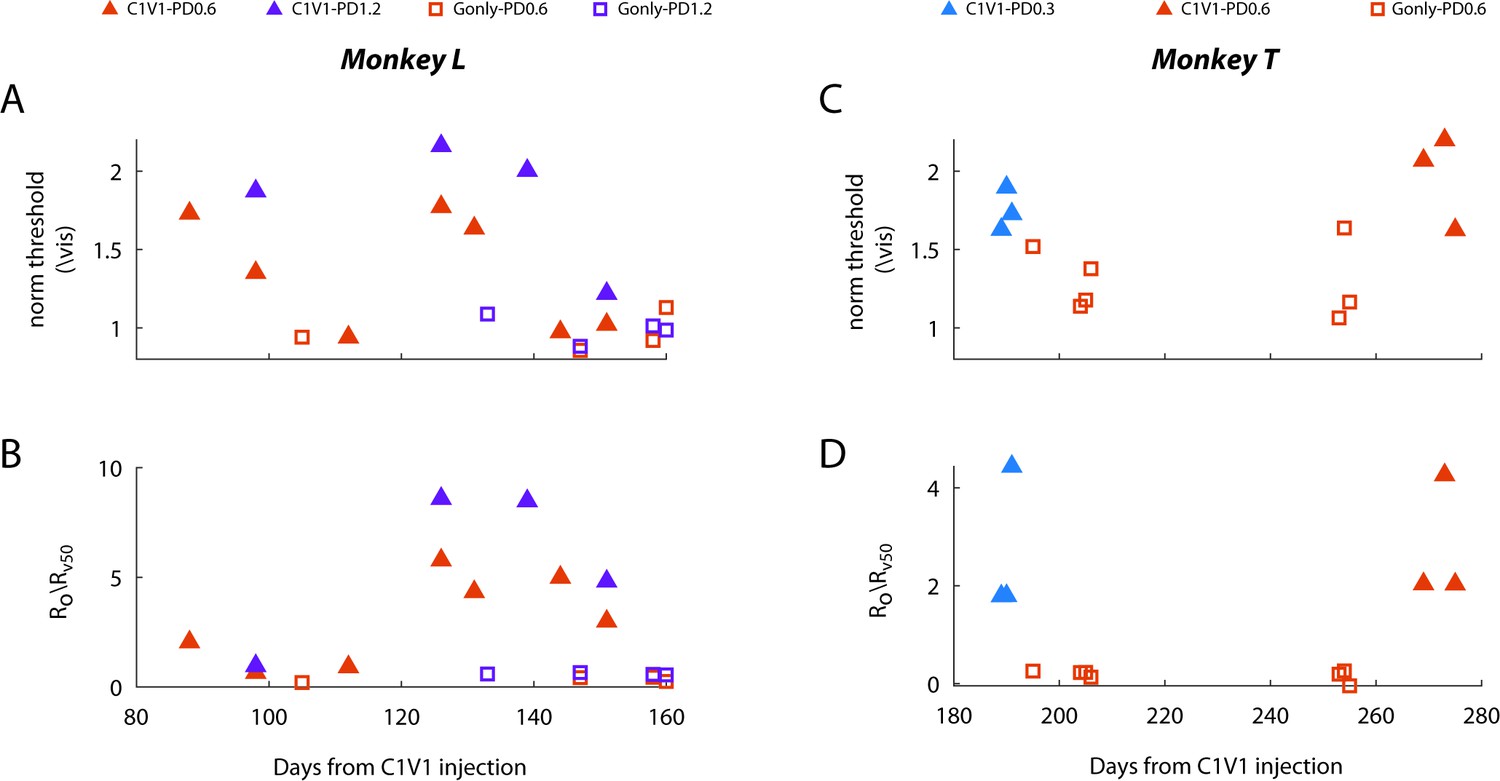
Timeline of neural and behavioral effects of optostimulation.
Top row: Optostimulation induced change in behavior threshold for each experiment plotted in the C1V1 site (triangles) and in the GCaMP-only site (square) as a function of days from C1V1 injection for Monkey L (left) and Monkey T (right). Threshold increase is expressed as a proportion of the visual-only threshold from the same experiment day as in Figures 3 and 4 (norm threshold). Bottom row: Response ratio between the optostim-evoked GCaMP response and the visual response evoked by a 50% contrast Gaussian target, plotted against days from C1V1 injection date, for Monkey L (left) and Monkey T (right).
Figure 2—figure supplement 3

Excessive blue GCaMP excitation light can affect behavioral performance.
(A) A preliminary experiment in Monkey L showing an increased behavioral threshold by a strong GCaMP excitation light (blue, 0.1 mW/mm2), compared to the monkey’s behavior on the same day without the GCaMP read-out light (black). Subsequently, 0.05 mW/mm2 GCaMP excitation intensity was adopted in Monkey L and 0.01 mW/mm2 for Monkey T. (B) Pooled %correct of the three data points highlighted in (A). Error bars indicate binomial standard error.
Figure 3 with 3 supplements
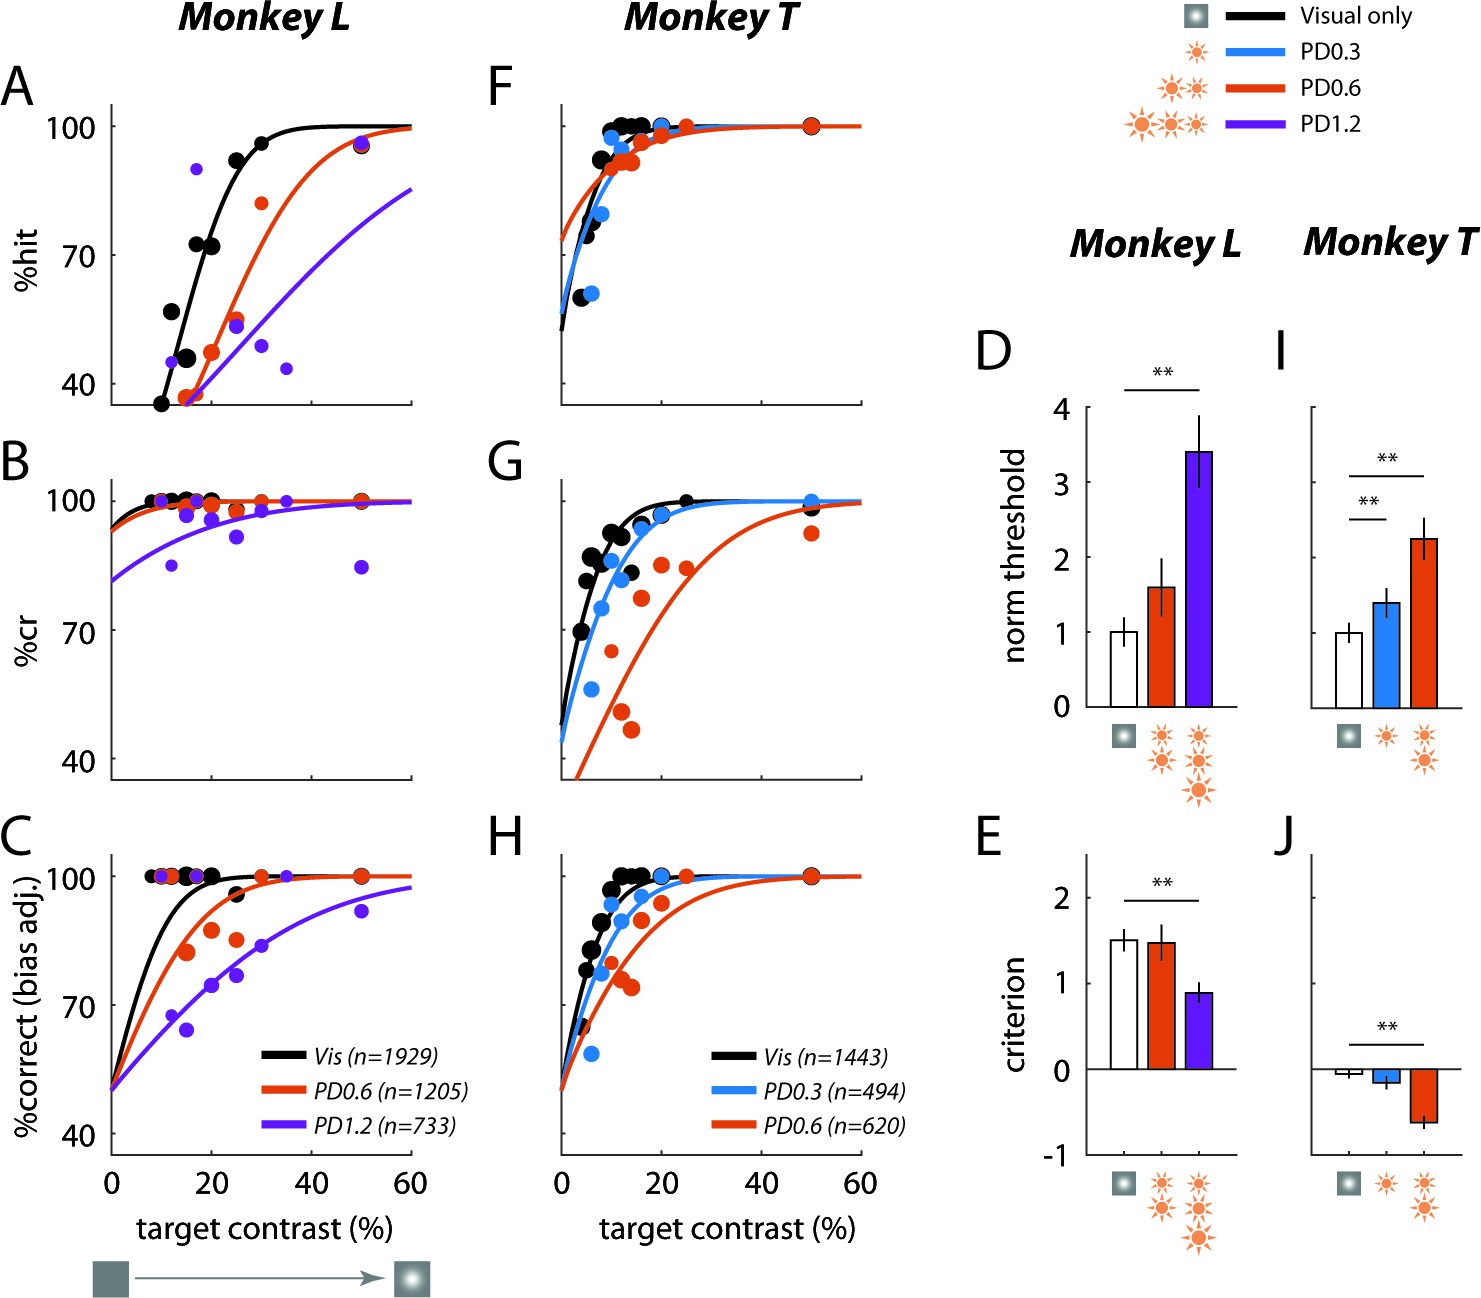
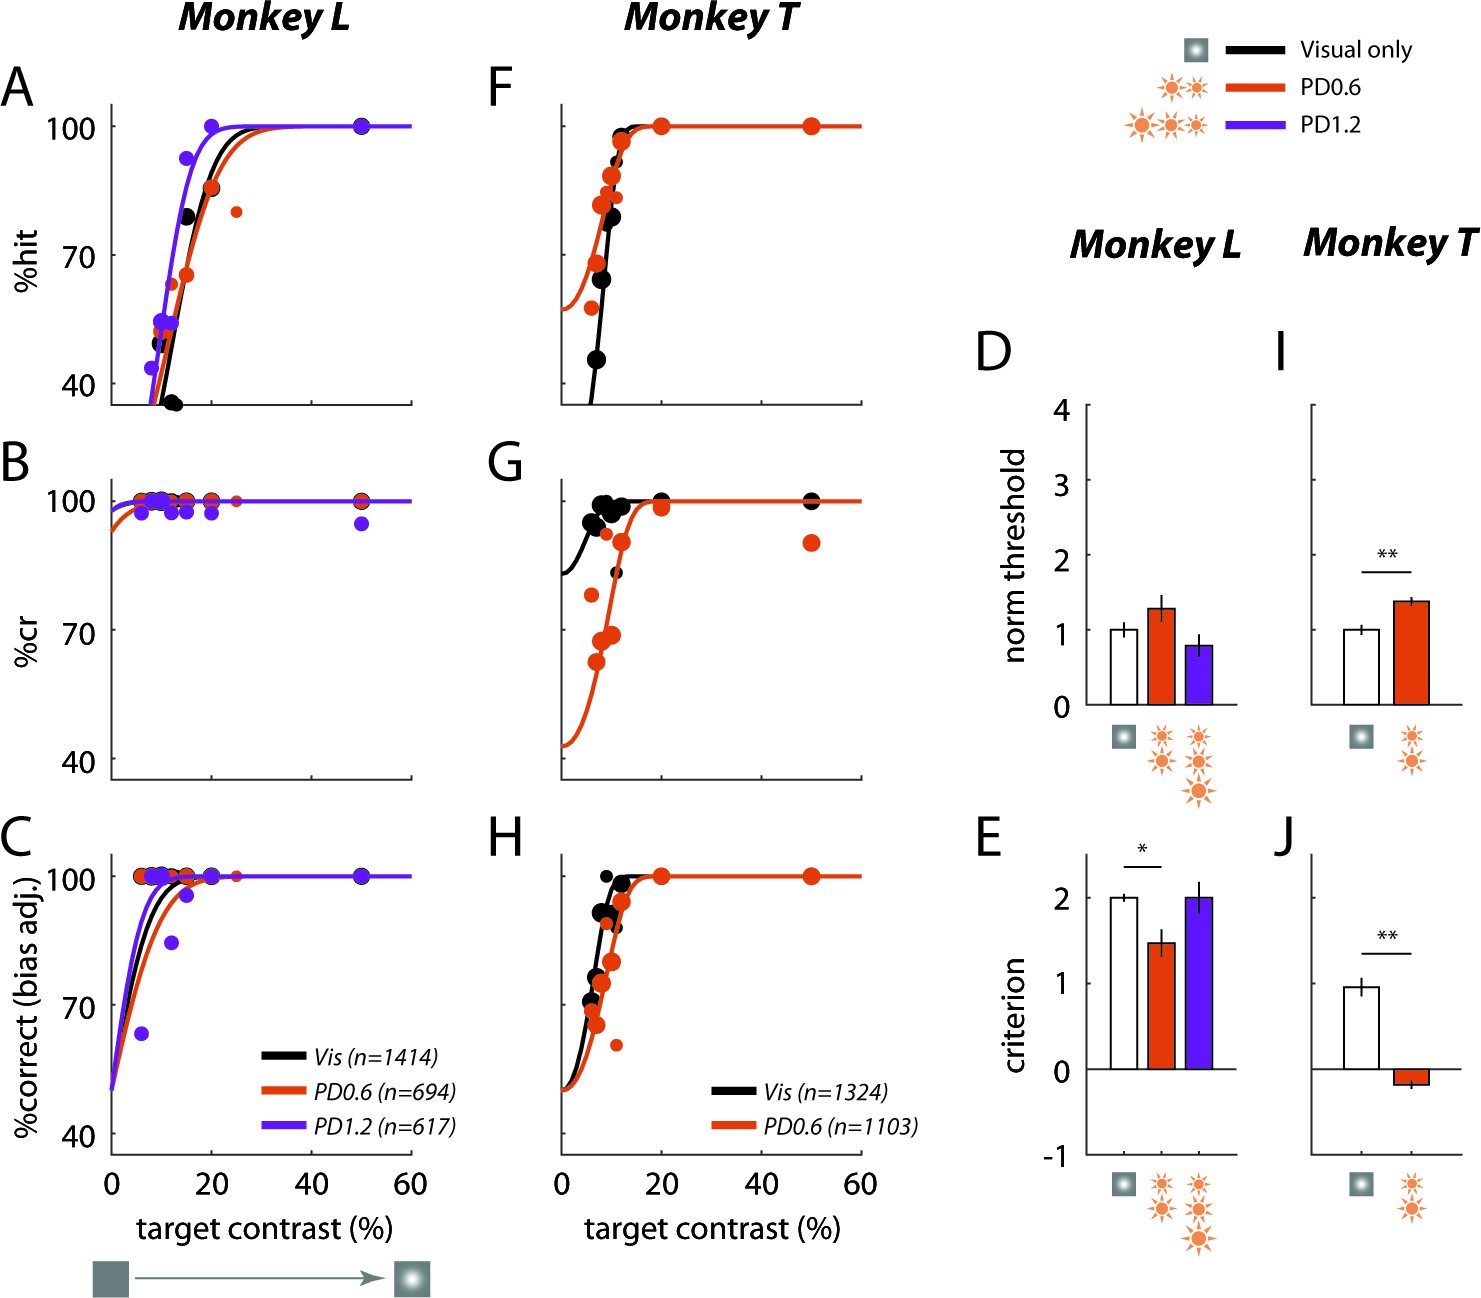
Low-power optogenetic stimulation leads to a large behavioral masking effect in a visual detection task.
Summary of behavioral performance as a function of target Weber contrast at the C1V1 site for Monkey L (A–E) and Monkey T (F–J). Performance is broken down into: (A) '“hits’ – target-present trials correctly identified, and (B) ‘correct rejections’ or ‘cr’ – target-absent trials correctly identified. (C) Detection performance corrected for the animal’s decision bias (imbalance between hits and correct rejections; see Materials and methods for correction approach, and Figure 3—figure supplement 1 for raw %correct data). The solid lines plot the fitted psychometric curves (see Materials and methods for fitting details). Data were pooled across all visual-only experiments and across all experiments of the same optostim peak power density (PD) level (in mW/mm2). The total number of trials pooled for each group is indicated in the legend, and the size of the plotted markers represents the relative number of trials executed at each target contrast. (D) Detection threshold with optostim (at 69% correct) plotted relative to the visual-target-only threshold. Mean thresholds and error bars were normalized by the mean visual threshold. (E) Criterion bias by each optostim power level. Criterion is reported in d’ units from the optimal criterion (criterion = 0), with positive values representing bias toward choosing target absent. Error bars in (D) and (E) indicate bootstrapped standard deviation (number of bootstrap runs = 1000) of the detection threshold and criterion, respectively. (F)–(J) are same as (A)–(E) for Monkey T’s C1V1 site. Asterisks mark statistically significant changes from visual-only behavior (*p < 0.05; **p < 0.01; bootstrapped paired difference with Bonferroni correction for multiple comparisons).
Figure 3—figure supplement 1

Pre-bias-adjusted psychometric curves.
Top row: The raw %correct scores and the fitted psychometric curves without the bias parameter. Otherwise, these plots were generated using the same data and plotting conventions as described in Figure 3. Bottom row: Psychometric fits and shifted data points taking into account each monkey’s criterion bias (reproduction of Figure 3C and H). Large shifts in Monkey L’s data points and psychometric curve reflect the heavy (miss) bias in this animal’s decision.
Figure 3—figure supplement 2
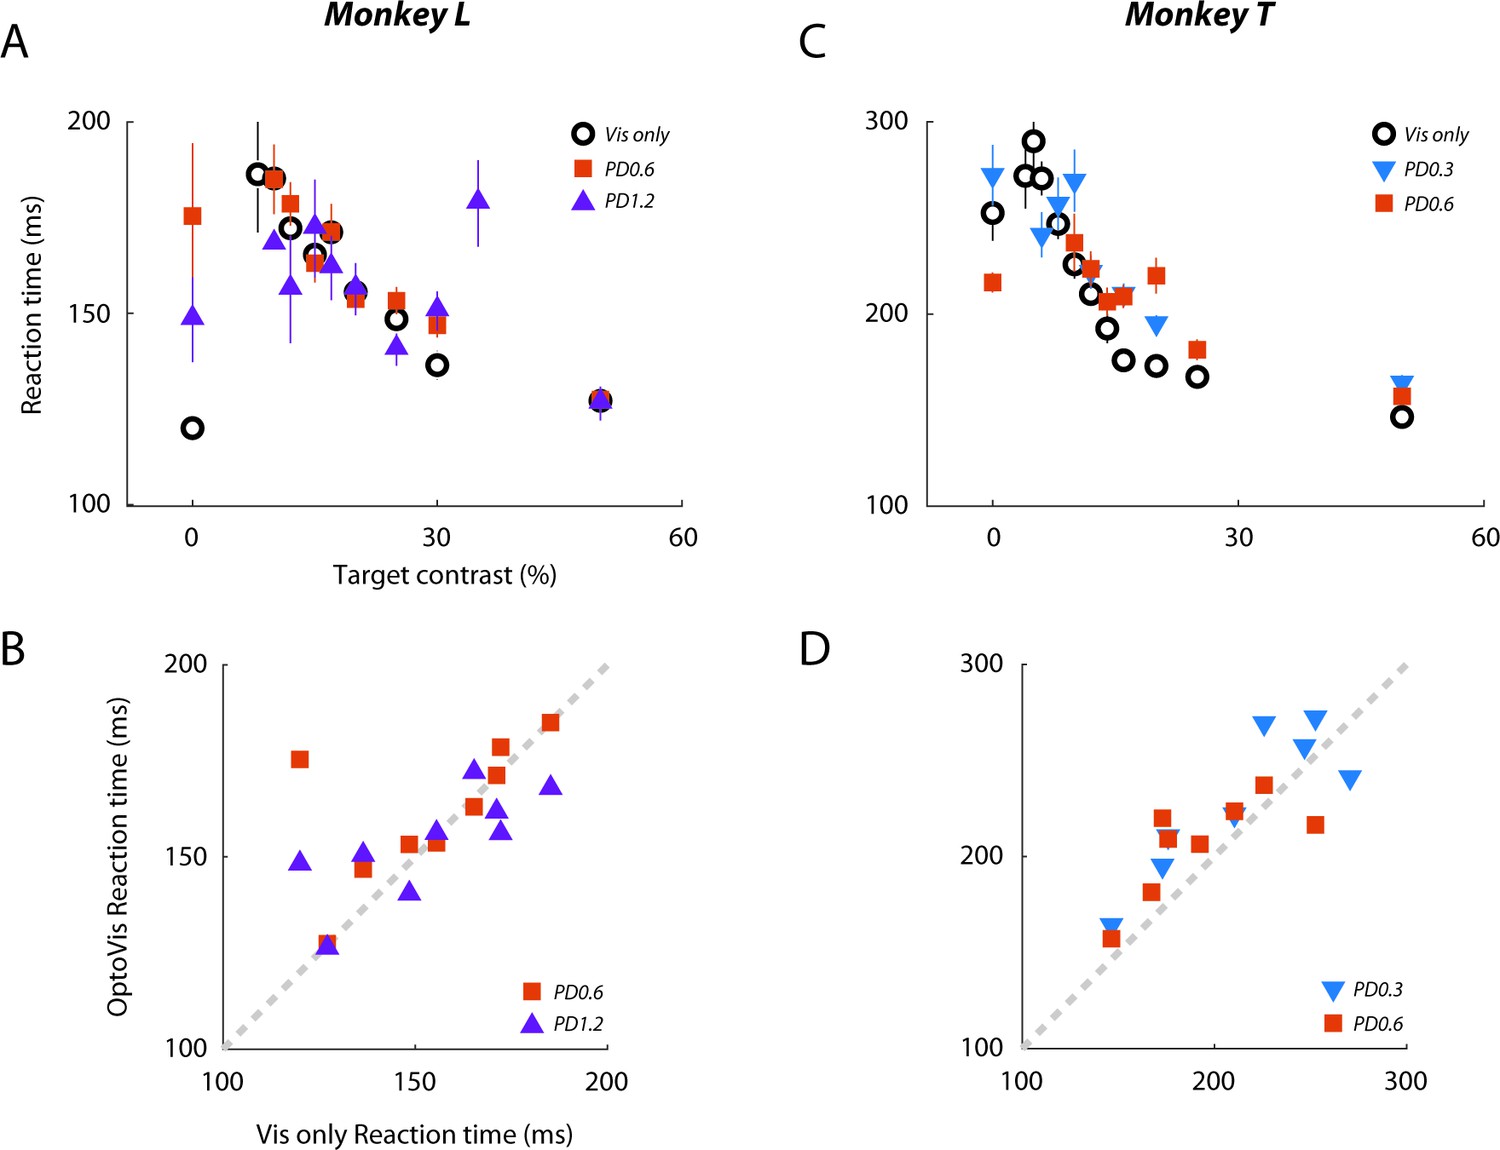
Effect of optostim on reaction time.
Top row: Average reaction time plotted against target contrast for Monkey L and Monkey T (combined across all experiments).
0% contrast illustrates the average reaction time of false alarms. Error bars indicate s.e.m. Bottom row: Reaction time from the optostim block for each target contrast plotted against the reaction time to the corresponding visual-only target.
Figure 3—figure supplement 3

Effect of optostim on saccade end points.
Data points from Monkey T for trials where the visual target was correctly detected (hits) are pooled across all target contrasts, with individual trials from the visual-only block in light blue and from the optostim+ visual block in light red, and the average illustrated in the darker corresponding shade. Fixation point is at (0,0), illustrated by a black square. The center of the flashed Gaussian (the intended saccade target) is the white disk for experiments targeting the C1V1 injection site (Cols 1 and 2), and is the gray disk for experiments targeting the GCaMP-only site (Cols 3 and 4).
Figure 4
Behavioral effect of optostim is spatially selective.
Same as Figure 3 but visual target at location corresponding to the GCaMP-only site.
Figure 5
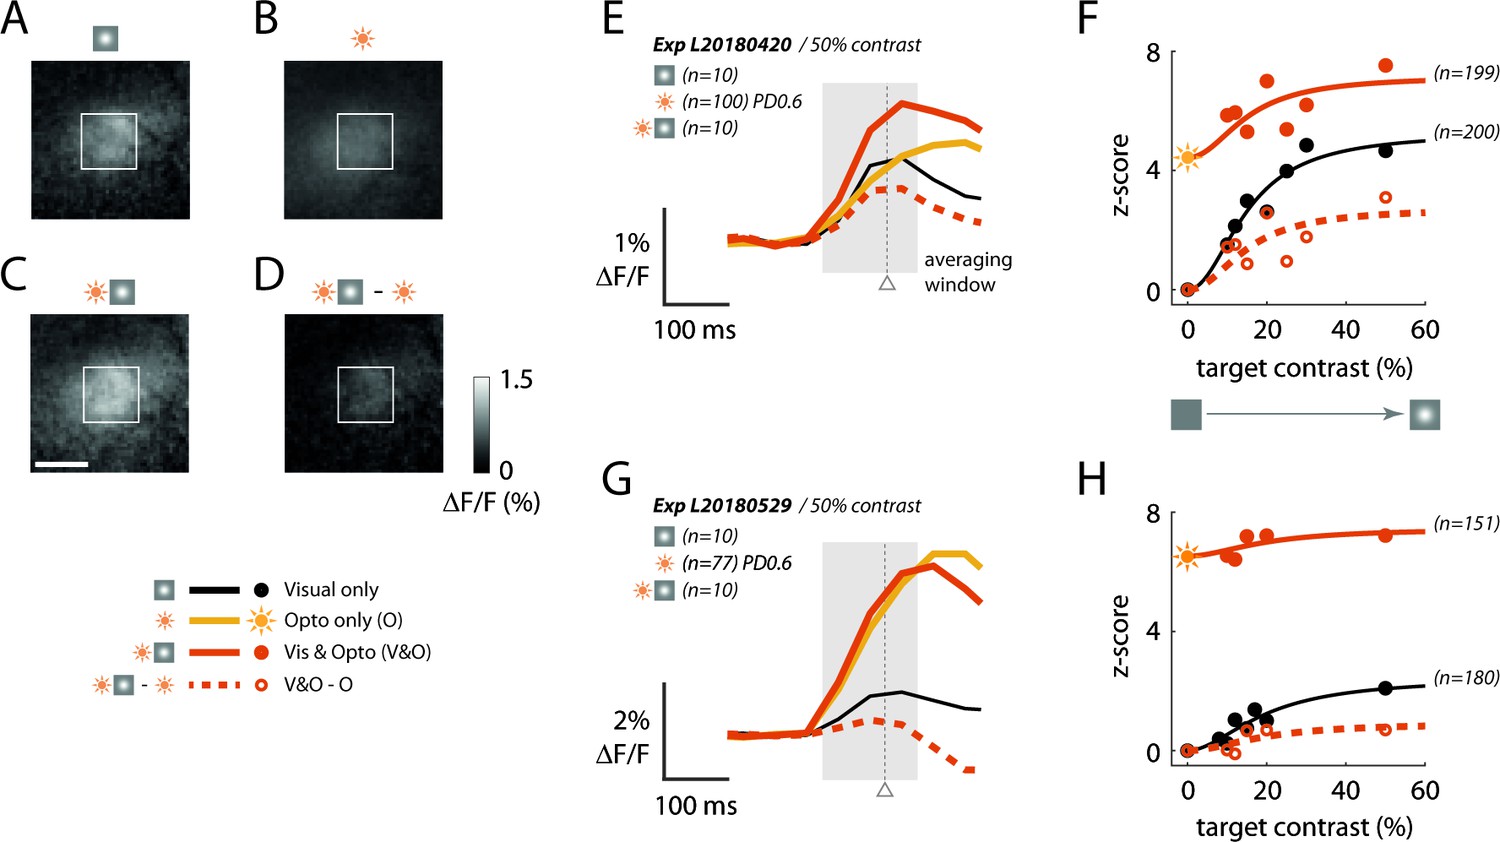
Sublinear neural interactions between visual and optogenetic stimulation in macaque V1 consistent with the behavioral masking effect.
(A–D) GCaMP imaging response maps from an example experiment in Monkey L’s C1V1 site to (A) the visual target alone at 50% Weber contrast, (B) optostim alone at power density (PD) of 0.6 mW/mm2, and (C) simultaneous visual and optostim. (D) Visual-evoked response in the presence of optostim (the simultaneous response in (C) with the optostim baseline response (B) subtracted). The white rectangle marks the 1 × 1 mm2 region of interest (ROI) of cortex selected by maximizing the encompassed visual-only response. The white scale bar marks 1 mm. For (A–D), response was averaged over the interval 50–200 ms (shaded area in (E)). (E) Time course of the GCaMP response averaged within the 1 × 1 mm2 window as marked in (A–D). The gray triangle indicates the median (saccade) reaction time across all optostim and visual-only trials in this experiment. (F) Contrast response functions with and without optostim. Each data point is the time-averaged response expressed as a z-score obtained by normalizing with the standard deviation of the blank (no visual and no optostim) trials. Traces indicate the Naka-Rushton curves fitted to the data (see Materials and methods for details). Sun symbol represents response to optostim when target contrast is zero – that is, response to optostim alone. (G–H) are the same as (E–F) for a second experiment from Monkey L taken about 6 weeks after the experiment in (A–D). In this experiment, the optostim-evoked response was much larger than the visually evoked response. See Figure 2—figure supplement 2 for time course of Ropto/Rvis50 as a function of the day from C1V1 injection in both monkeys.
Figure 6 with 2 supplements
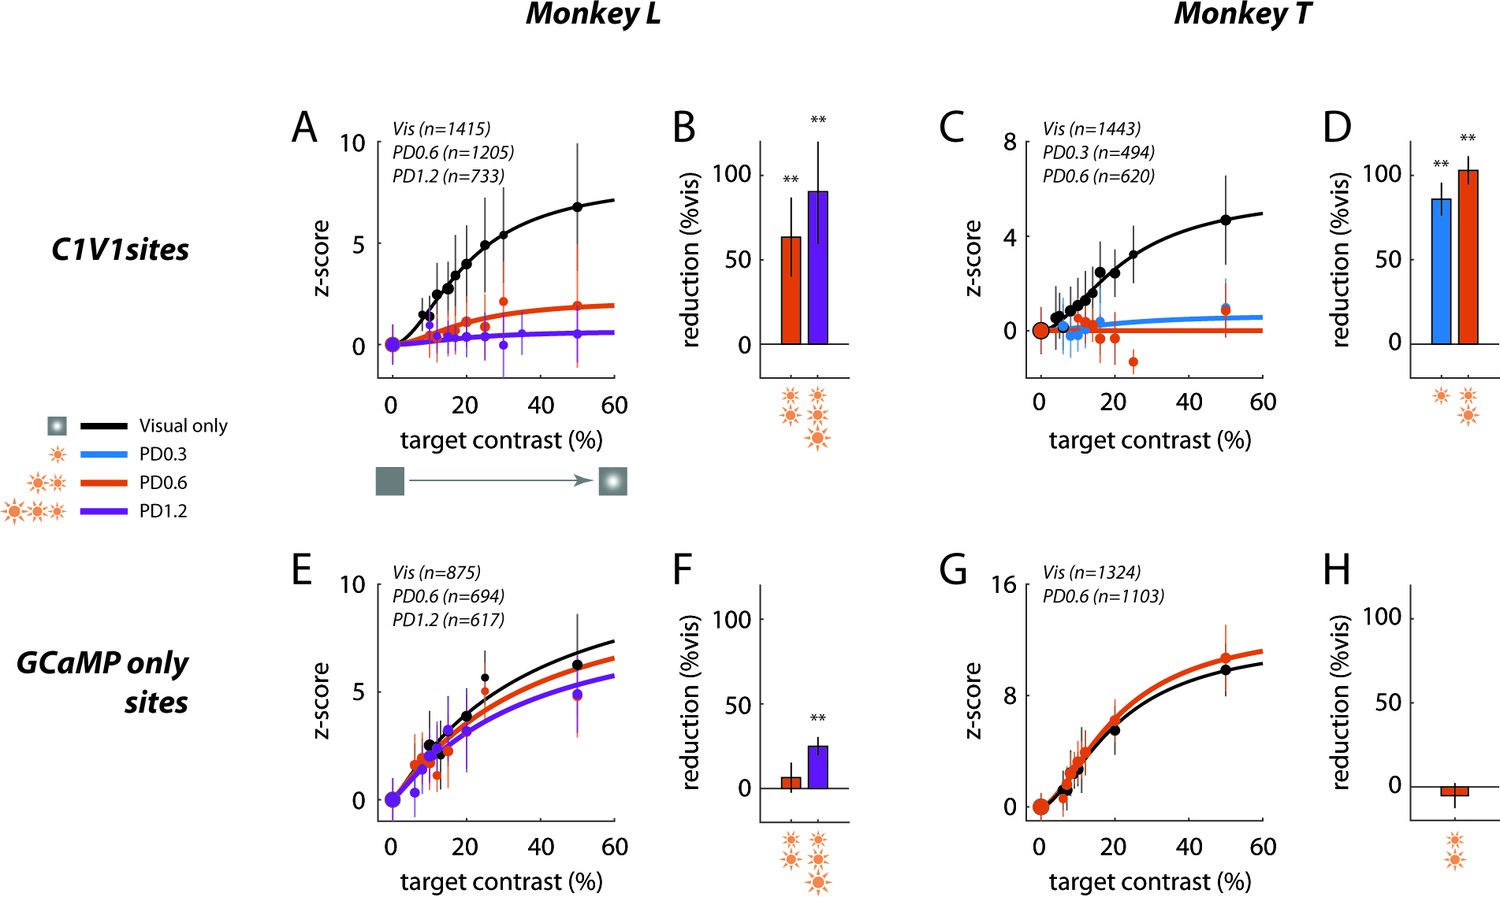
Summary of sublinear interaction between visual and optogenetic stimulation in macaque V1.
(A) Contrast response functions for the visual target alone and for the visual target in the presence of optostim (i.e., visual and optostim minus optostim alone) for Monkey L at the C1V1 site. Response in z-score (as in Figure 5F and H) was pooled across all visual-only experiments and across all optostim experiments for each power density (PD) level (in mW/mm2), matching the plotted data in Figure 3. The total number of trials pooled for each group is indicated in the legend, and the size of the plotted markers represents the relative number of trials at each target contrast. Error bars represent the standard deviation across trials. Smooth curves indicate the Naka-Rushton function fitted to the data (see Materials and methods for details). (B) Percent reduction in overall contrast response with optostim relative to the overall contrast response without optostim (visual stimulation alone), at Monkey L’s C1V1 site (see Materials and methods for details). Error bars plot the bootstrapped standard deviation (number of bootstrap runs = 1000). (C–D) Same as (A–B) for Monkey T’s C1V1 site. (E–H) are the same as (A–D) for respective monkeys at the GCaMP-only sites. Asterisks marks statistical significance of signal reductions using bootstrap analysis. Subtracted optostim baseline in z-score units are (mean ± s.d.): (A) 17.4 ± 9.1 [PD0.6] and 37.4 ± 23.4 [PD1.2]; (C) 9.9 ± 3.2 [PD0.3] and 12.3 ± 2.1 [PD0.6]; (E) 1.9 ± 1.2 [PD0.6] and 3.6 ± 1.2 [PD1.2]; and (G) 1.7 ± 1.4 [PD0.3].
Figure 6—figure supplement 1

Effect of optostim on neural variability.
Standard deviation across trials in the optostim block for each target contrast, plotted against that from the corresponding visual-only target.
Figure 6—figure supplement 2

Comparison of evoked GCaMP responses to pulsed and continuous optostim.
Comparison of evoked responses to pulsed (pulsed-width modulation, PWM) and continuous optostim suggests that the evoked response is relatively independent of the optostim temporal modulation (i.e., the response mainly depends on the time average of the optostim power). (A) A GCaMP and C1V1 site in Monkey T (different from the one used in the rest of the study) where we compared the response to continuous optostim and to the pulsed optostim (PWM, 5 ms every 22.5 ms cycle) as in the main study. (B) At the same peak power density, the pulsed optostim response was ~ 30% of the continuous optostim response, closely matching the expectations given the pulsed optostim duty cycle (5/22.5 = 22.2%). (C) The GCaMP response to the pulsed optostim (solid circles) and to the continuous optostim (solid triangles) plotted against peak optostim power density. The open triangles plot the continuous optostim response (solid triangles) scaled down by 0.222. Similarly, the open circles replot pulse optostim responses to pulsed optostim (solid circles) as a function of the effective optostim power (peak power density × 0.222); the result closely matches the continuous optostim response (solid triangles).
Additional files
Download links
A two-part list of links to download the article, or parts of the article, in various formats.
Downloads (link to download the article as PDF)
Open citations (links to open the citations from this article in various online reference manager services)
Cite this article (links to download the citations from this article in formats compatible with various reference manager tools)
Similar neural and perceptual masking effects of low-power optogenetic stimulation in primate V1
eLife 11:e68393.
https://doi.org/10.7554/eLife.68393


