Characterizing human mobility patterns in rural settings of sub-Saharan Africa
- Department of Epidemiology, Johns Hopkins Bloomberg School of Public Health, United States
- Bureau d'Etudes Scientifiques et Techniques - Eau, Energie, Environnement (BEST-3E), Burkina Faso
- Dipartimento di Ingegneria Civile Edile ed Ambientale, Università di Padova, Italy
- Laboratory of Ecohydrology, School of Architecture, Civil and Environmental Engineering, École Polytechnique Fédérale de Lausanne, Switzerland
- Department of International Health, International Vaccine Access Center, Johns Hopkins Bloomberg School of Public Health, United States
- Macha Research Trust, Zambia
- Zambia Information and Communications Technology Authority, Zambia
- Zamtel, Zambia
- Department of Epidemiology and the Center for Communicable Disease Dynamics, Harvard TH Chan School of Public Health, United States
- WorldPop, School of Geography and Environmental Science, University of Southampton, United Kingdom
- Department of Ecology and Evolutionary Biology and the Princeton School of Public and International Affairs, Princeton University, United States
Figures
Figure 1 with 9 supplements
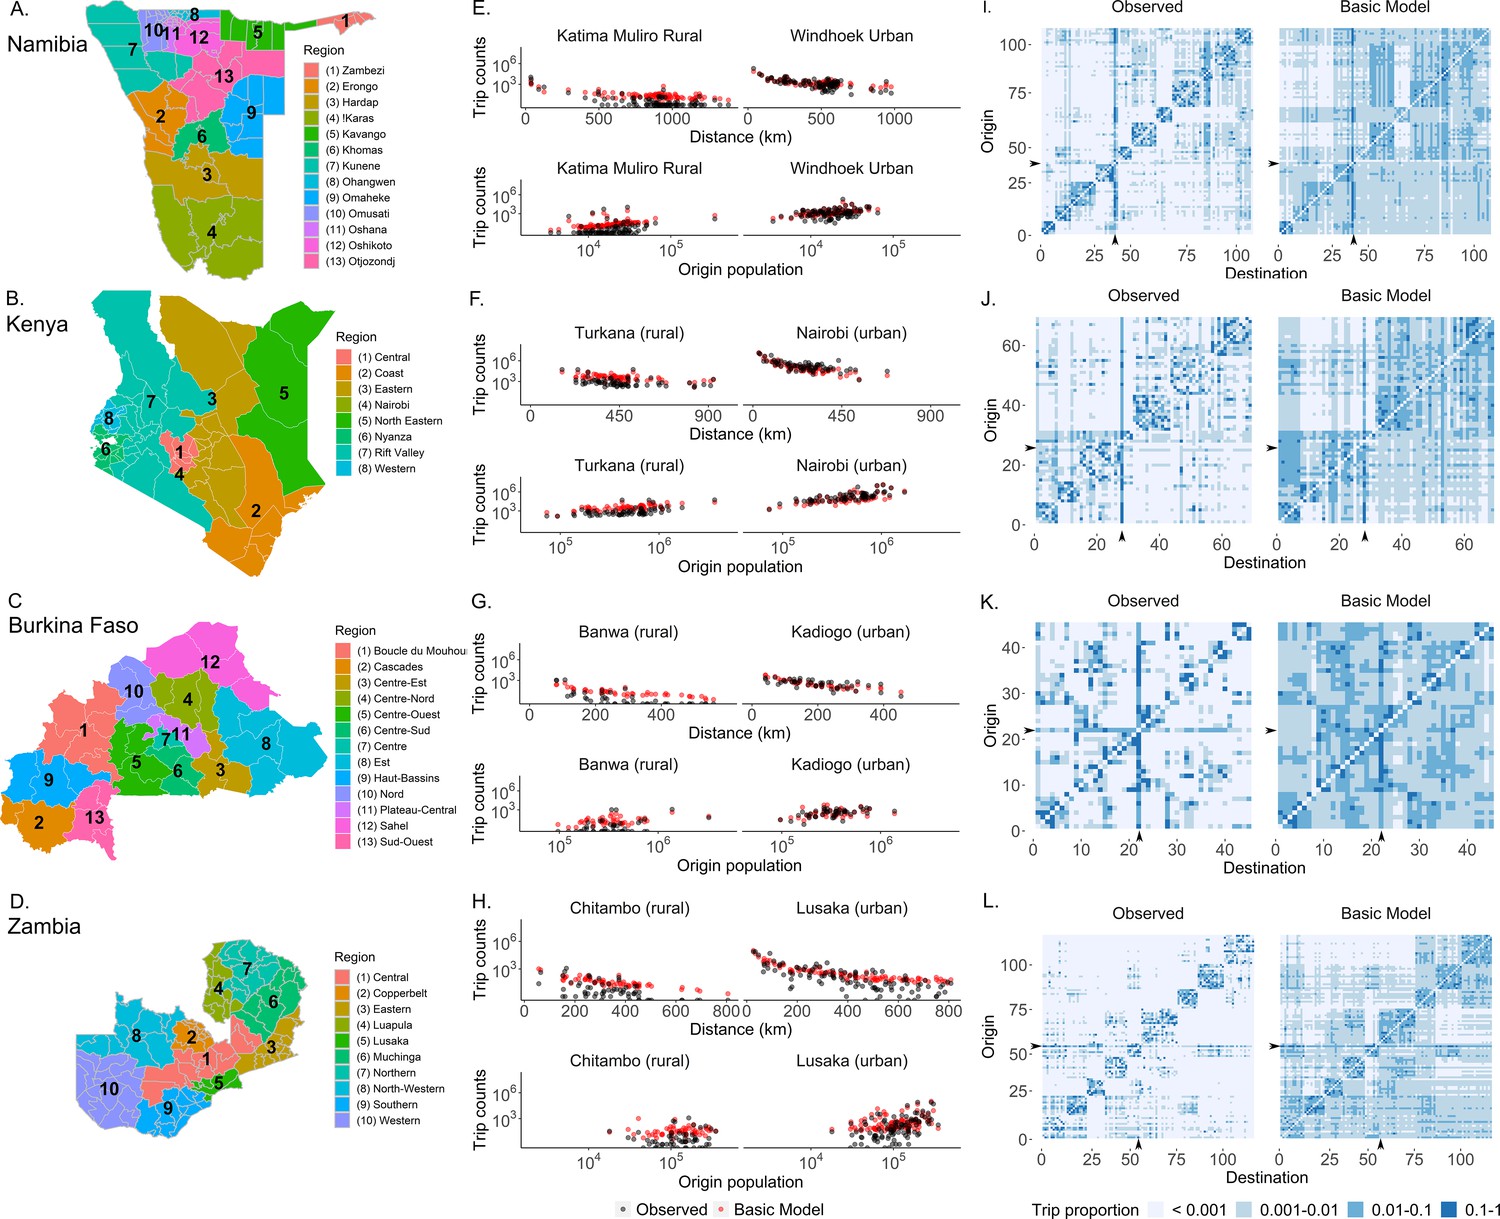
The mobility patterns extracted from mobile phone data from four countries in Sub-Saharan Africa.
(A–D) Data from four Sub-Saharan African countries were selected to characterize human mobility patterns: Namibia, Kenya, Burkina Faso, and Zambia. Travel between districts (administrative level 2) was estimated via mobile phone data from each country. A basic gravity model was fit to trip data from each country which assumes that the number of trips decreases with distance and increases with population size (E–H). Here, one rural (left panel) and one urban (right panel) destination were selected from each country to show that, while the observed trips (black) from different origins do generally follow the assumptions of the gravity model (red), the gravity model is not fully capturing the observed trip patterns. See Figure 1—figure supplements 1–8 for this comparison made for all districts in each country. (I–L) Comparisons of origin-destination matrices colored by trip proportions estimated by the basic gravity model and the mobile phone data (observed) highlight how the basic gravity model tends to overestimate many trips, particularly those that are off-diagonal (e.g., inter-regional trips). The columns and rows of the OD matrix are ordered by district ID, which were assigned such that districts within the same region (adminstrative level 1) were clustered together. The capital district is indicated by the black arrow on the x- and y-axes. The colors indicate the proportion of an origin’s trips made to each destination (with light blue representing destinations visited infrequently and dark blue representing destinations visited most frequently). (See Supplementary file 1B for the key to the origin and destination numbers and Figure 1—figure supplement 9 for district level maps).
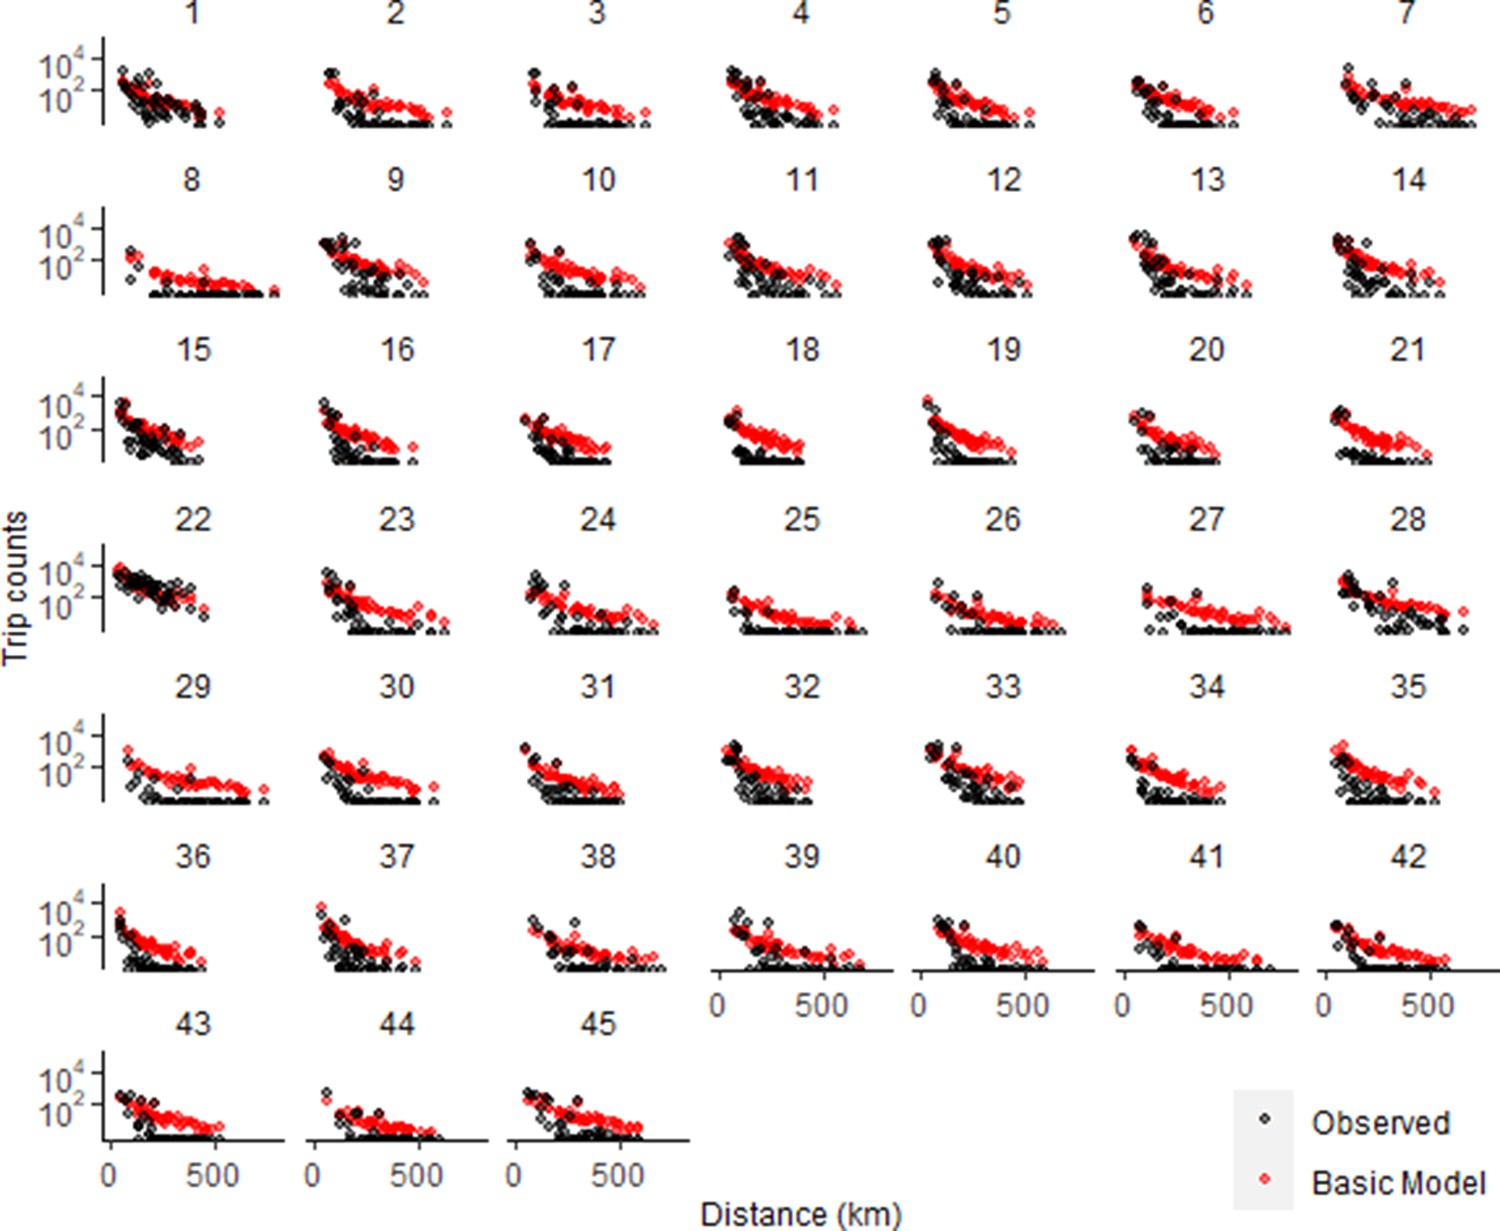
Figure 1—figure supplement 1
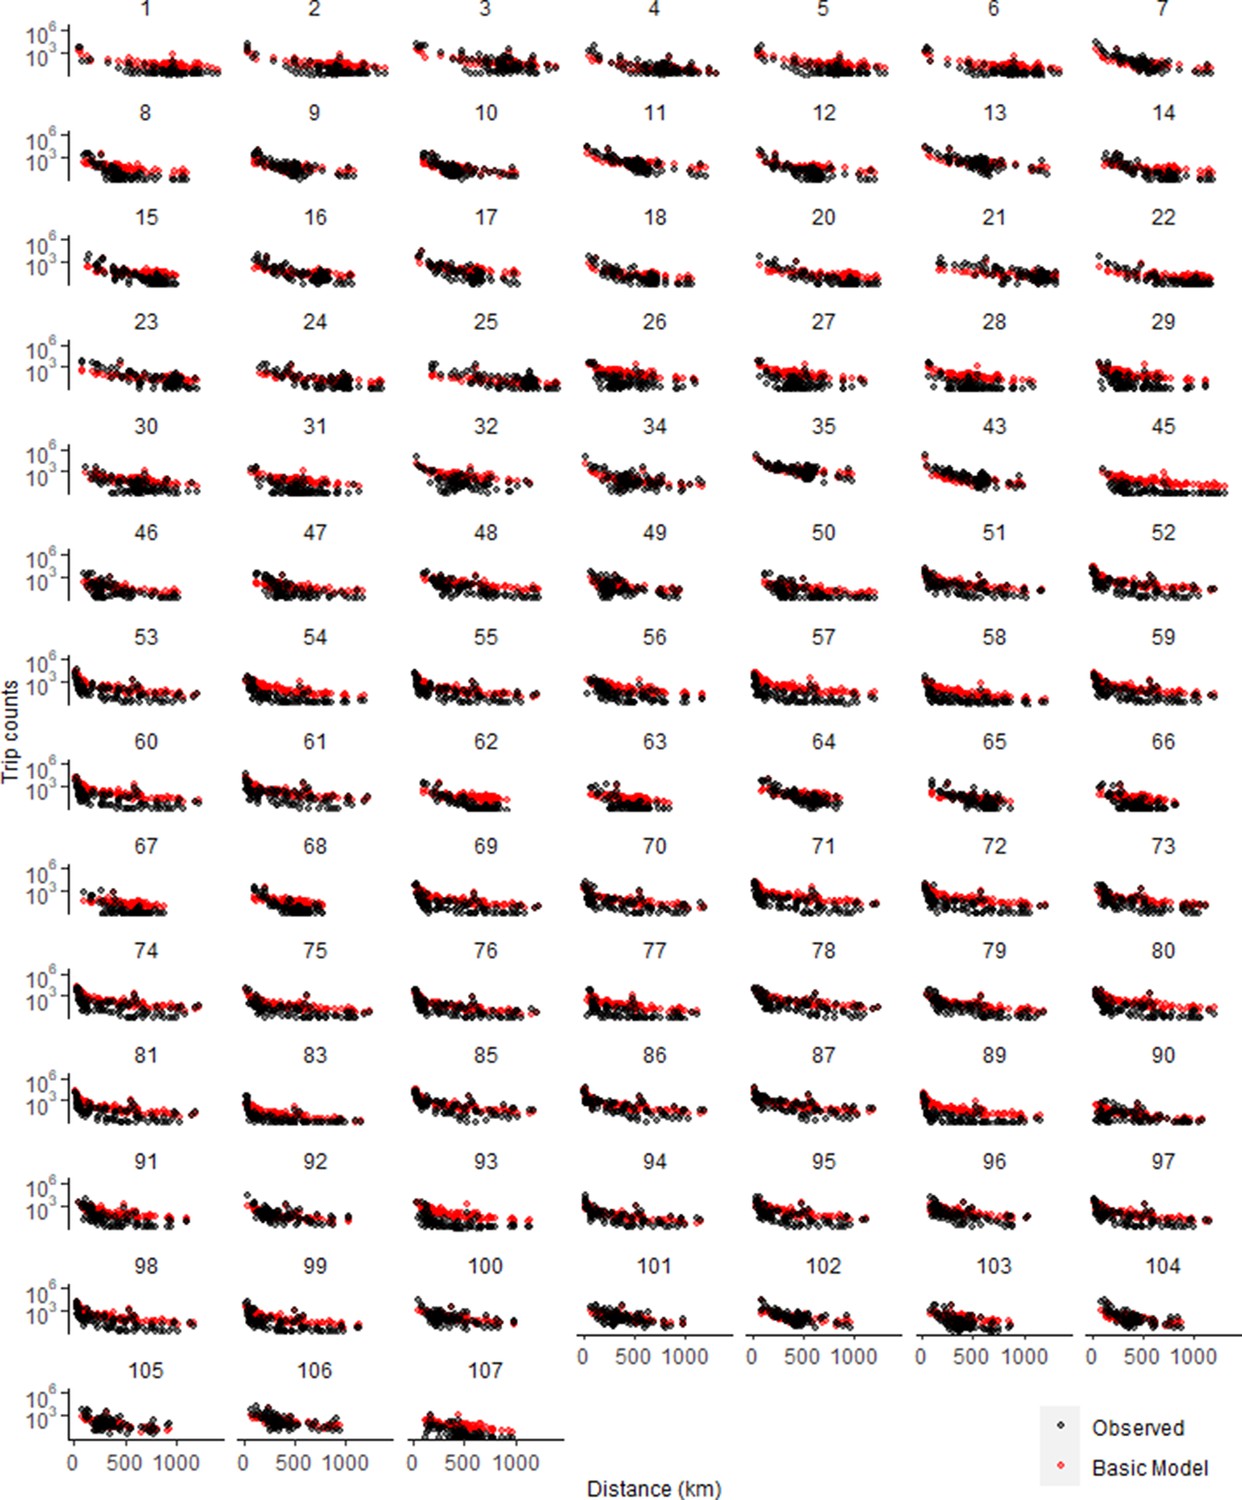
Trip estimates as a function of trip distance for all districts in Namibia.
. Basic model used power distance kernel. See Supplementary file 1B for key to district numbers and Figure 1—figure supplement 9 for a map.
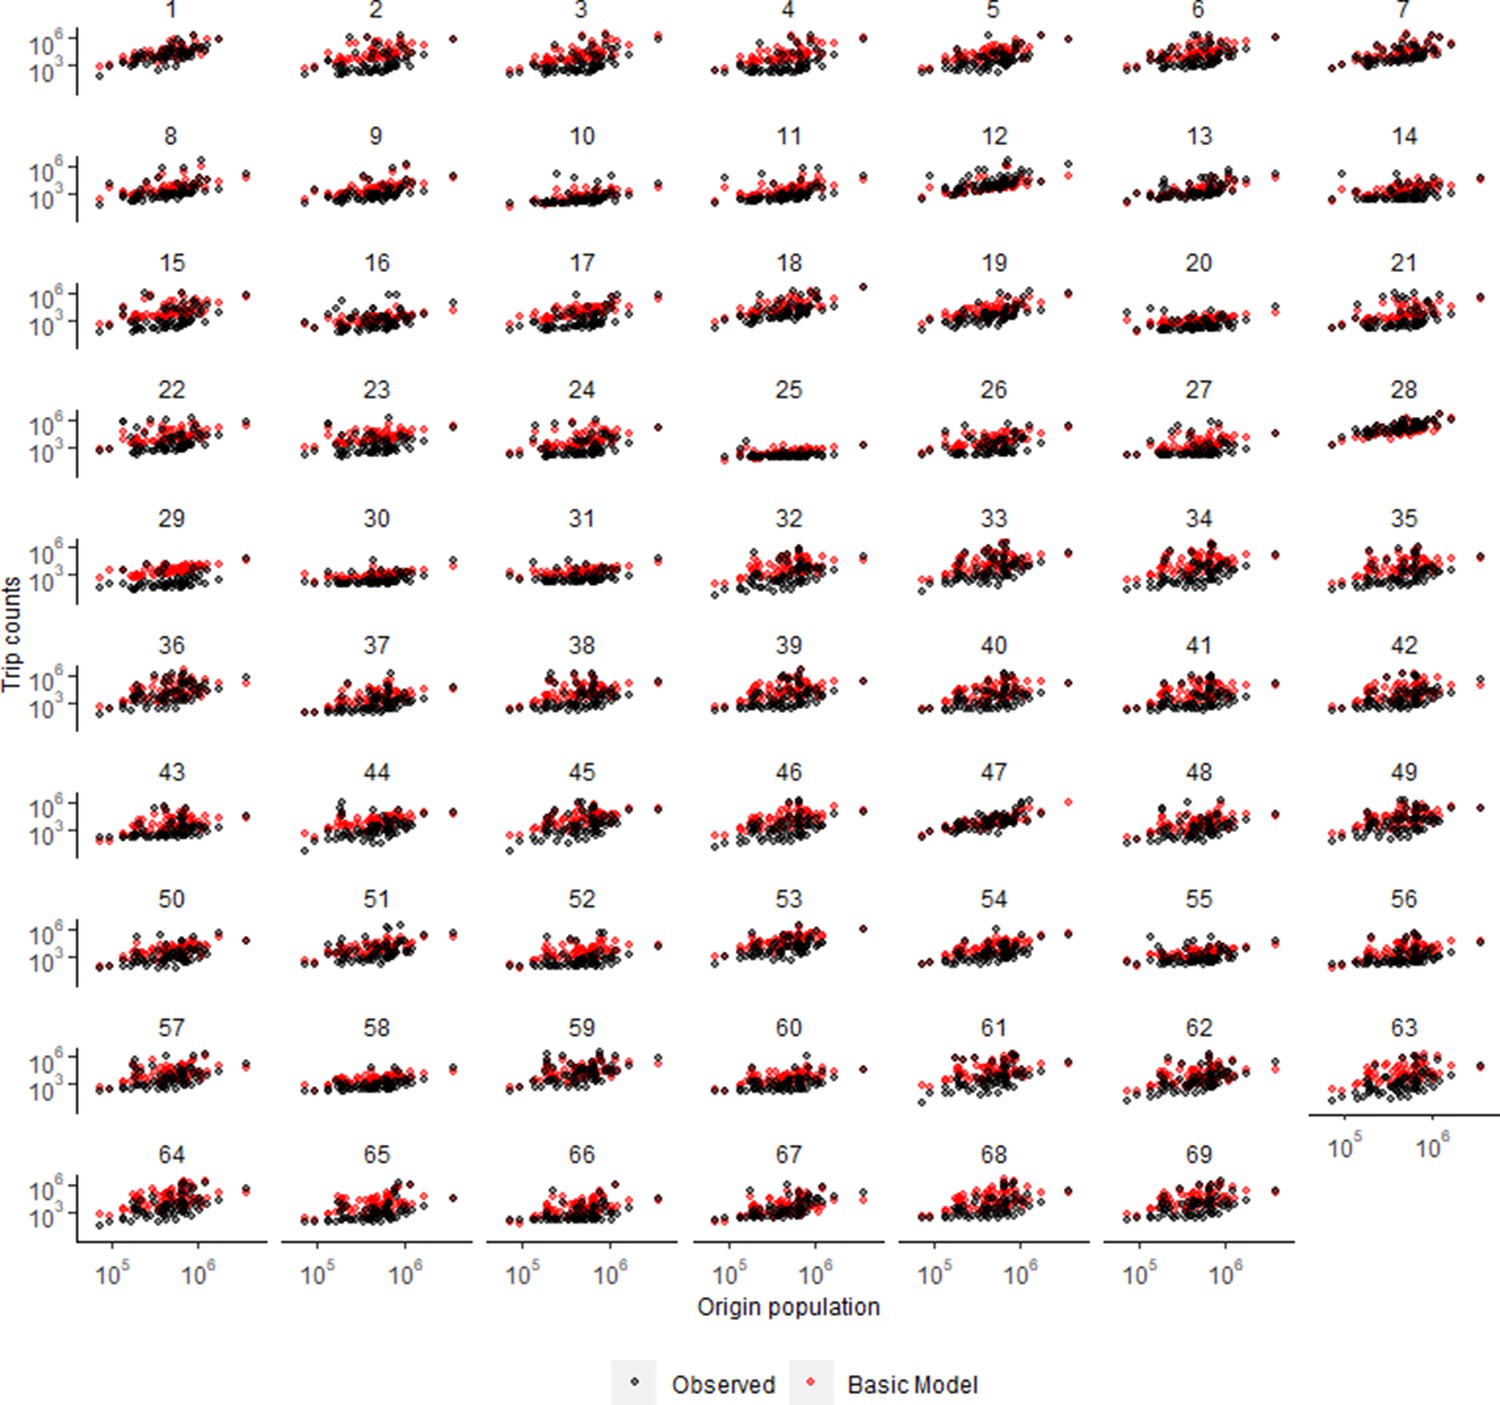
Figure 1—figure supplement 2
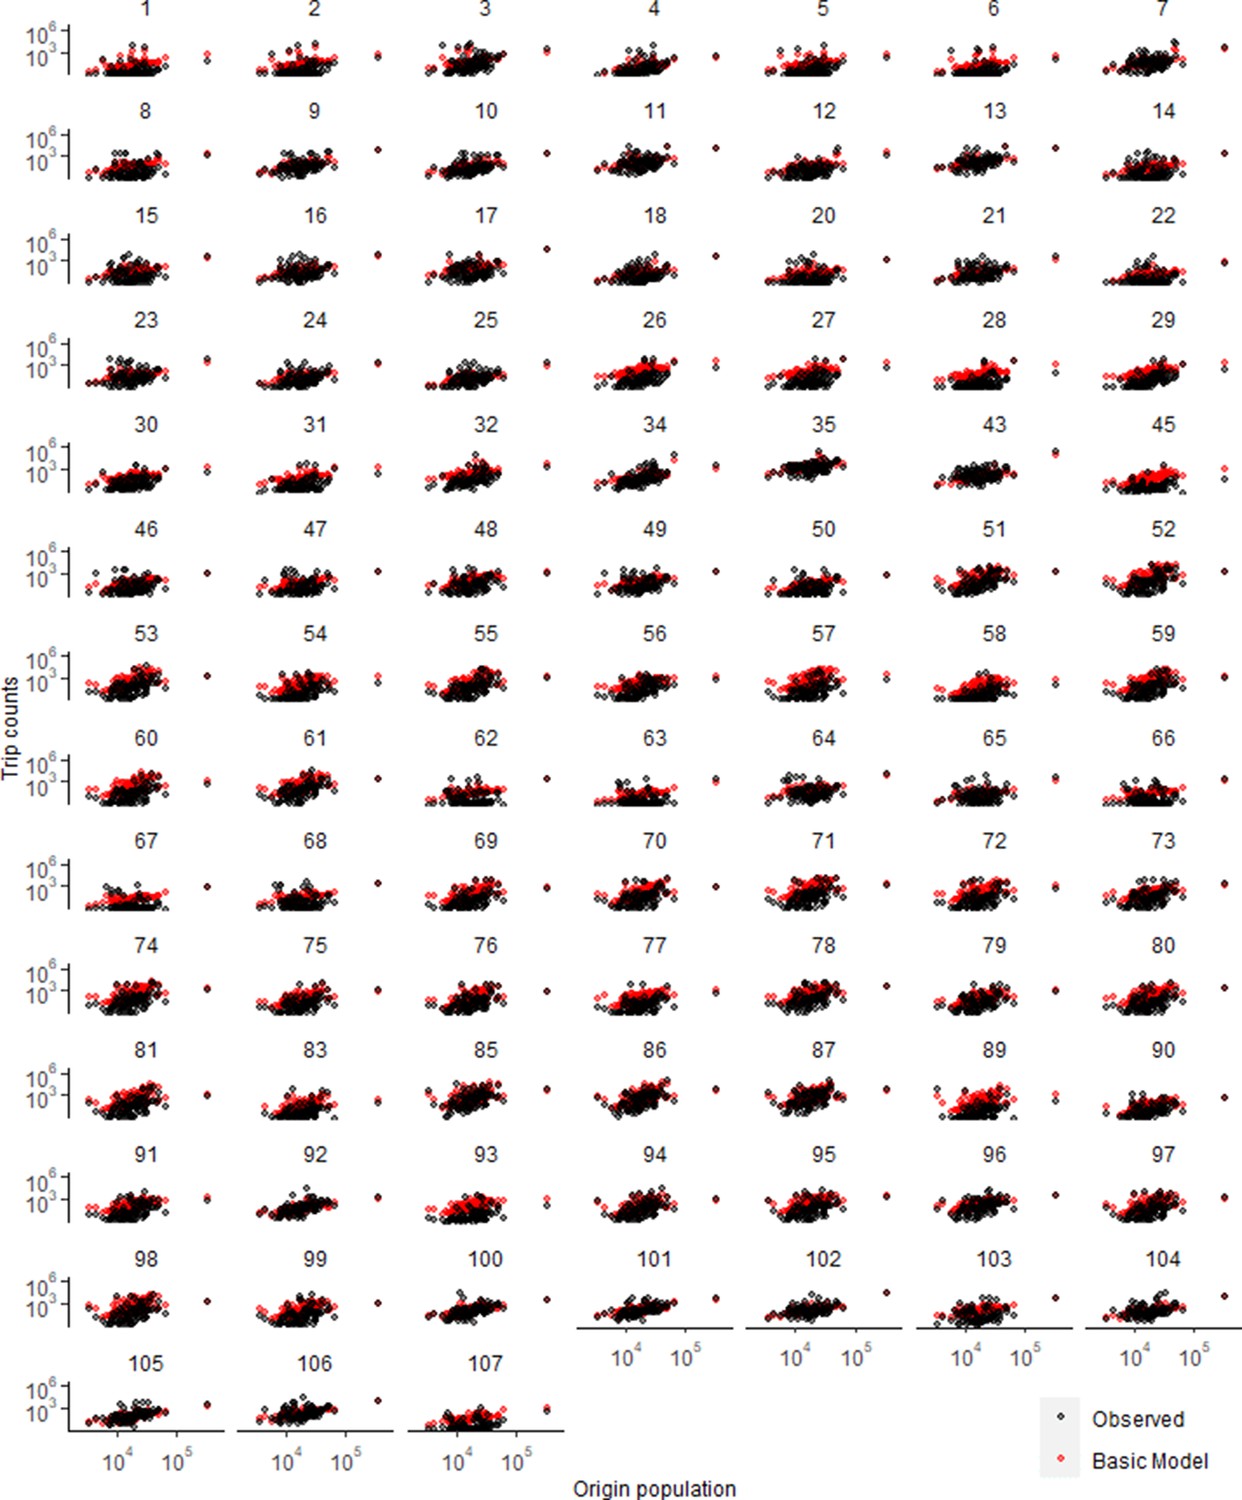
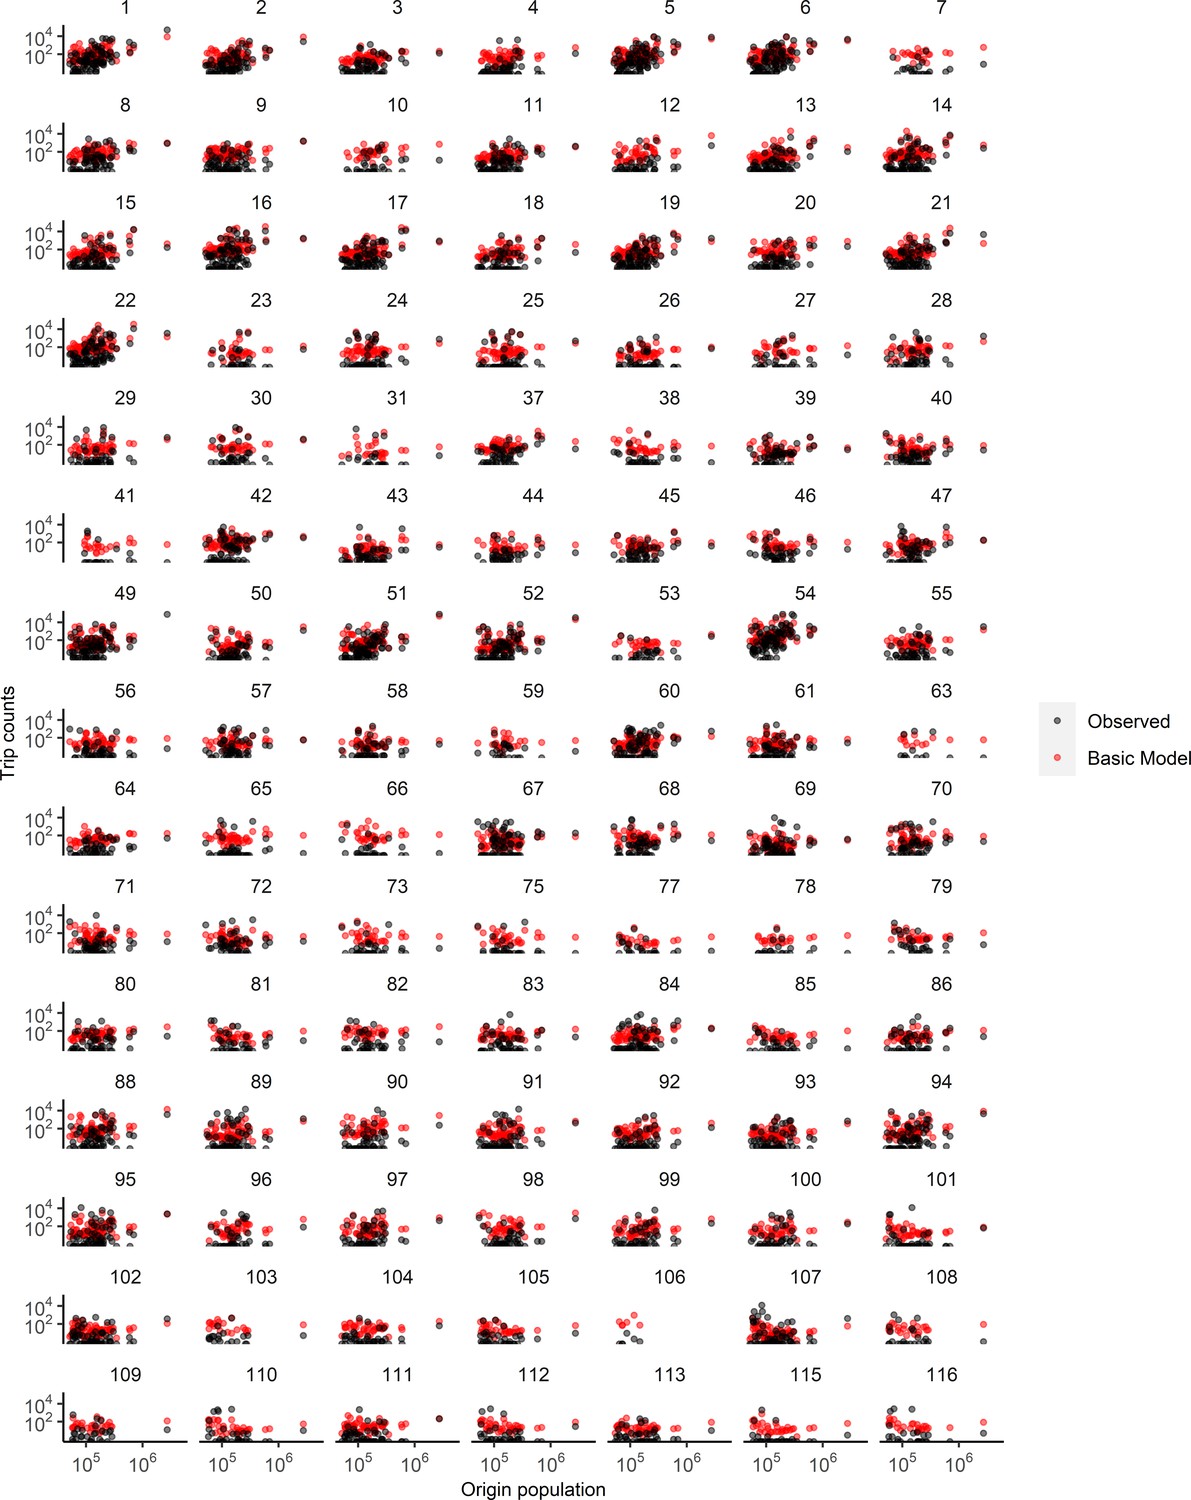
Trip estimates as a function of origin population for all districts in Namibia.
Basic model used power distance kernel. See Supplementary file 1B for key to district numbers and Figure 1—figure supplement 9 for a map.
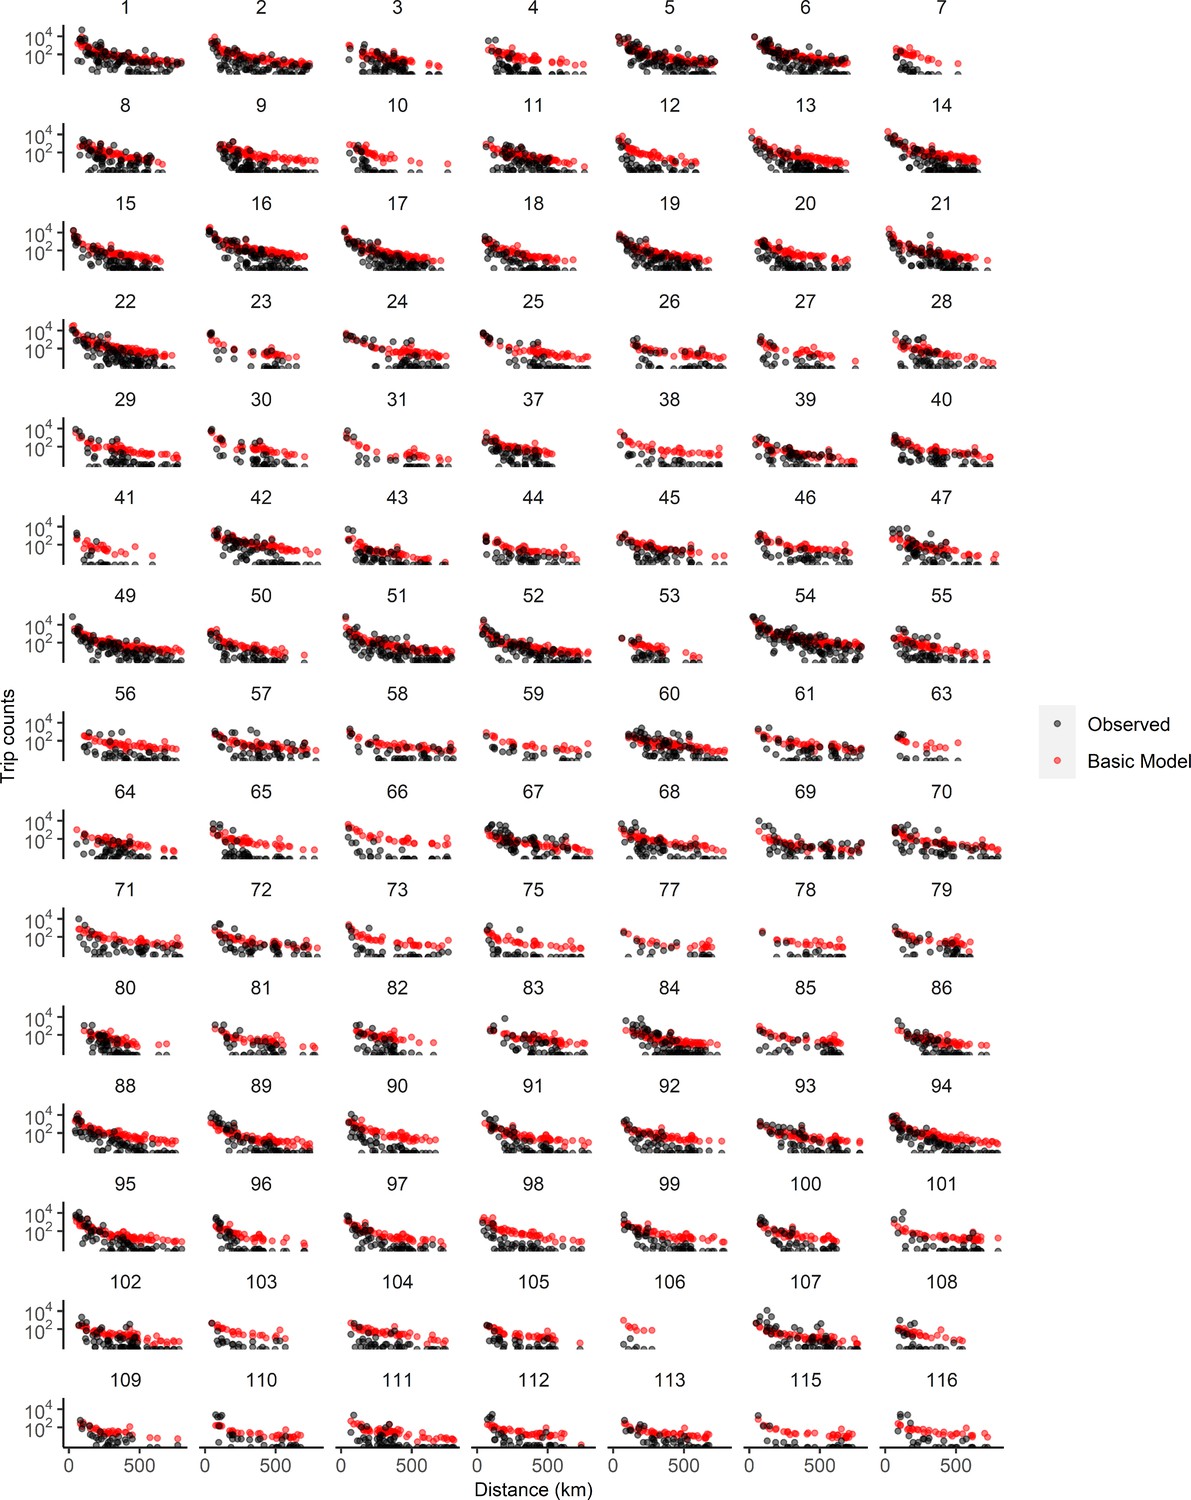
Figure 1—figure supplement 3
Trip estimates as a function of trip distance for all districts in Kenya.
Basic model used power distance kernel. See Supplementary file 1B for key to district numbers and Figure 1—figure supplement 9 for a map.
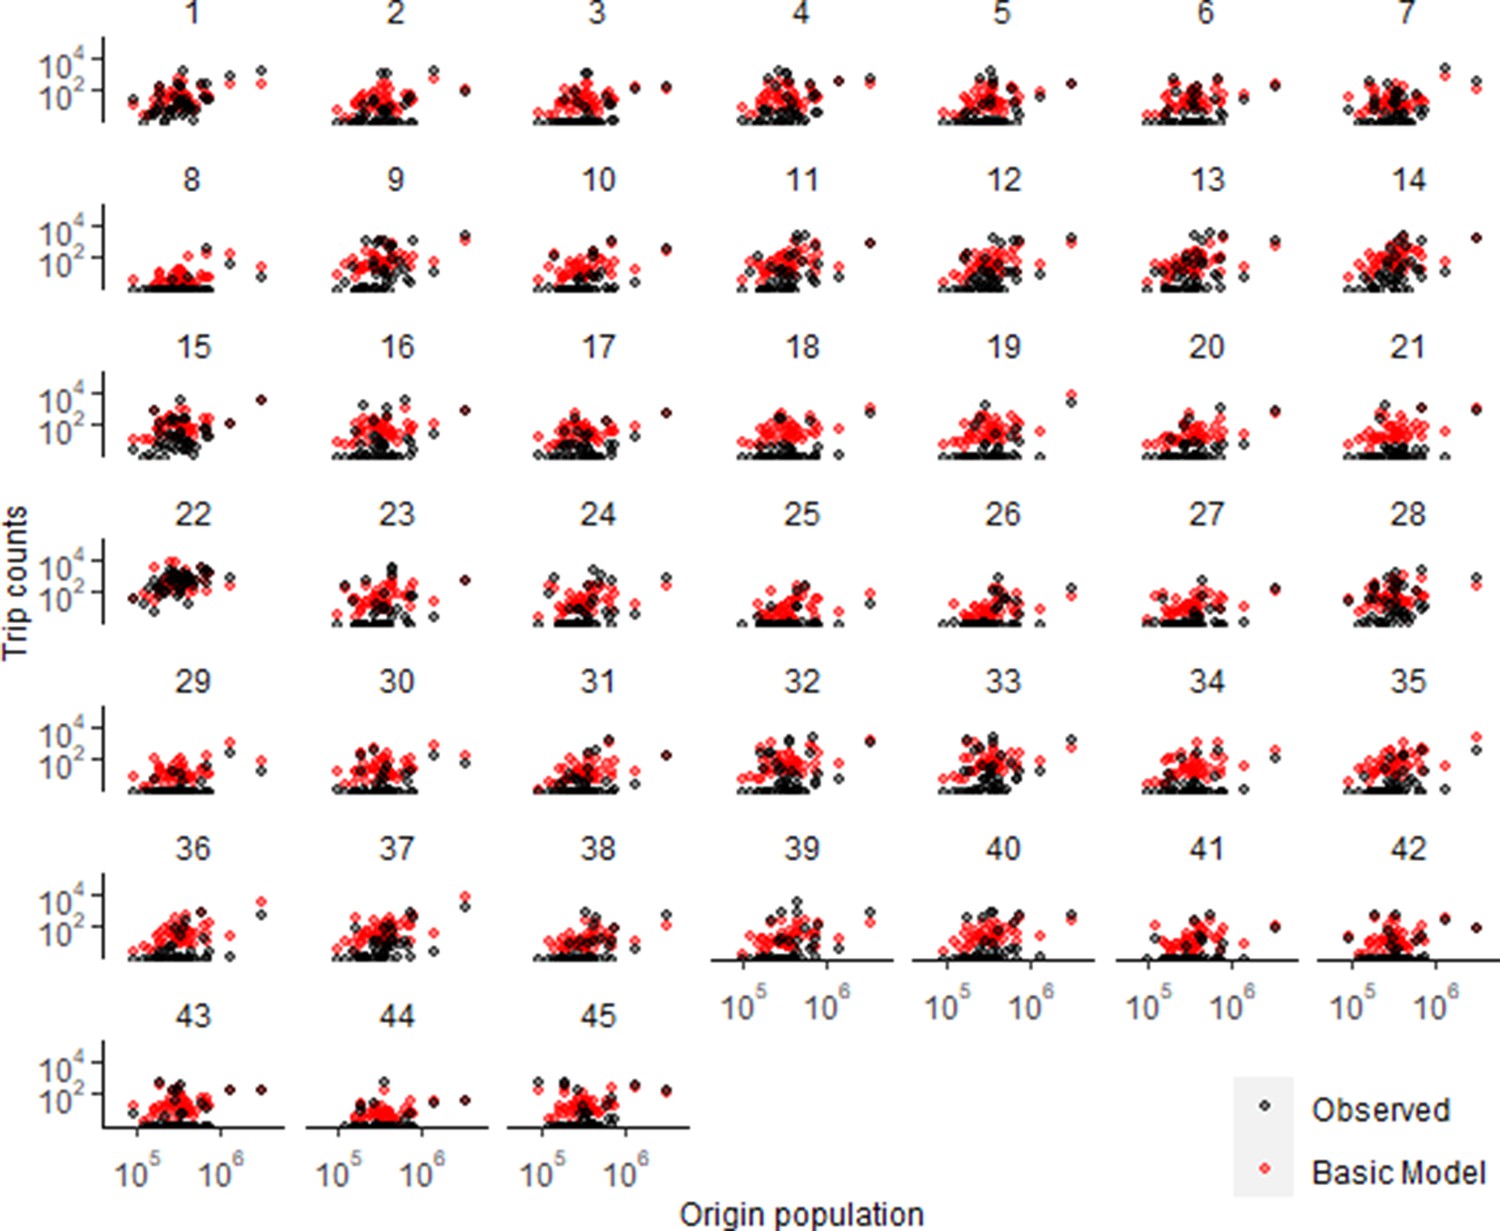
Figure 1—figure supplement 4
Trip estimates as a function of origin population for all districts in Kenya.
Basic model used power distance kernel. See Supplementary file 1B for key to district numbers and Figure 1—figure supplement 9 for a map.
Figure 1—figure supplement 5
Trip estimates as a function of trip distance for all districts in Burkina Faso.
Basic model used power distance kernel. See Supplementary file 1B for key to district numbers and Figure 1—figure supplement 9 for a map.
Figure 1—figure supplement 6
Trip estimates as a function of origin population for all districts in Burkina Faso.
Basic model used power distance kernel. See Supplementary file 1B for key to district numbers and Figure 1—figure supplement 9 for a map.
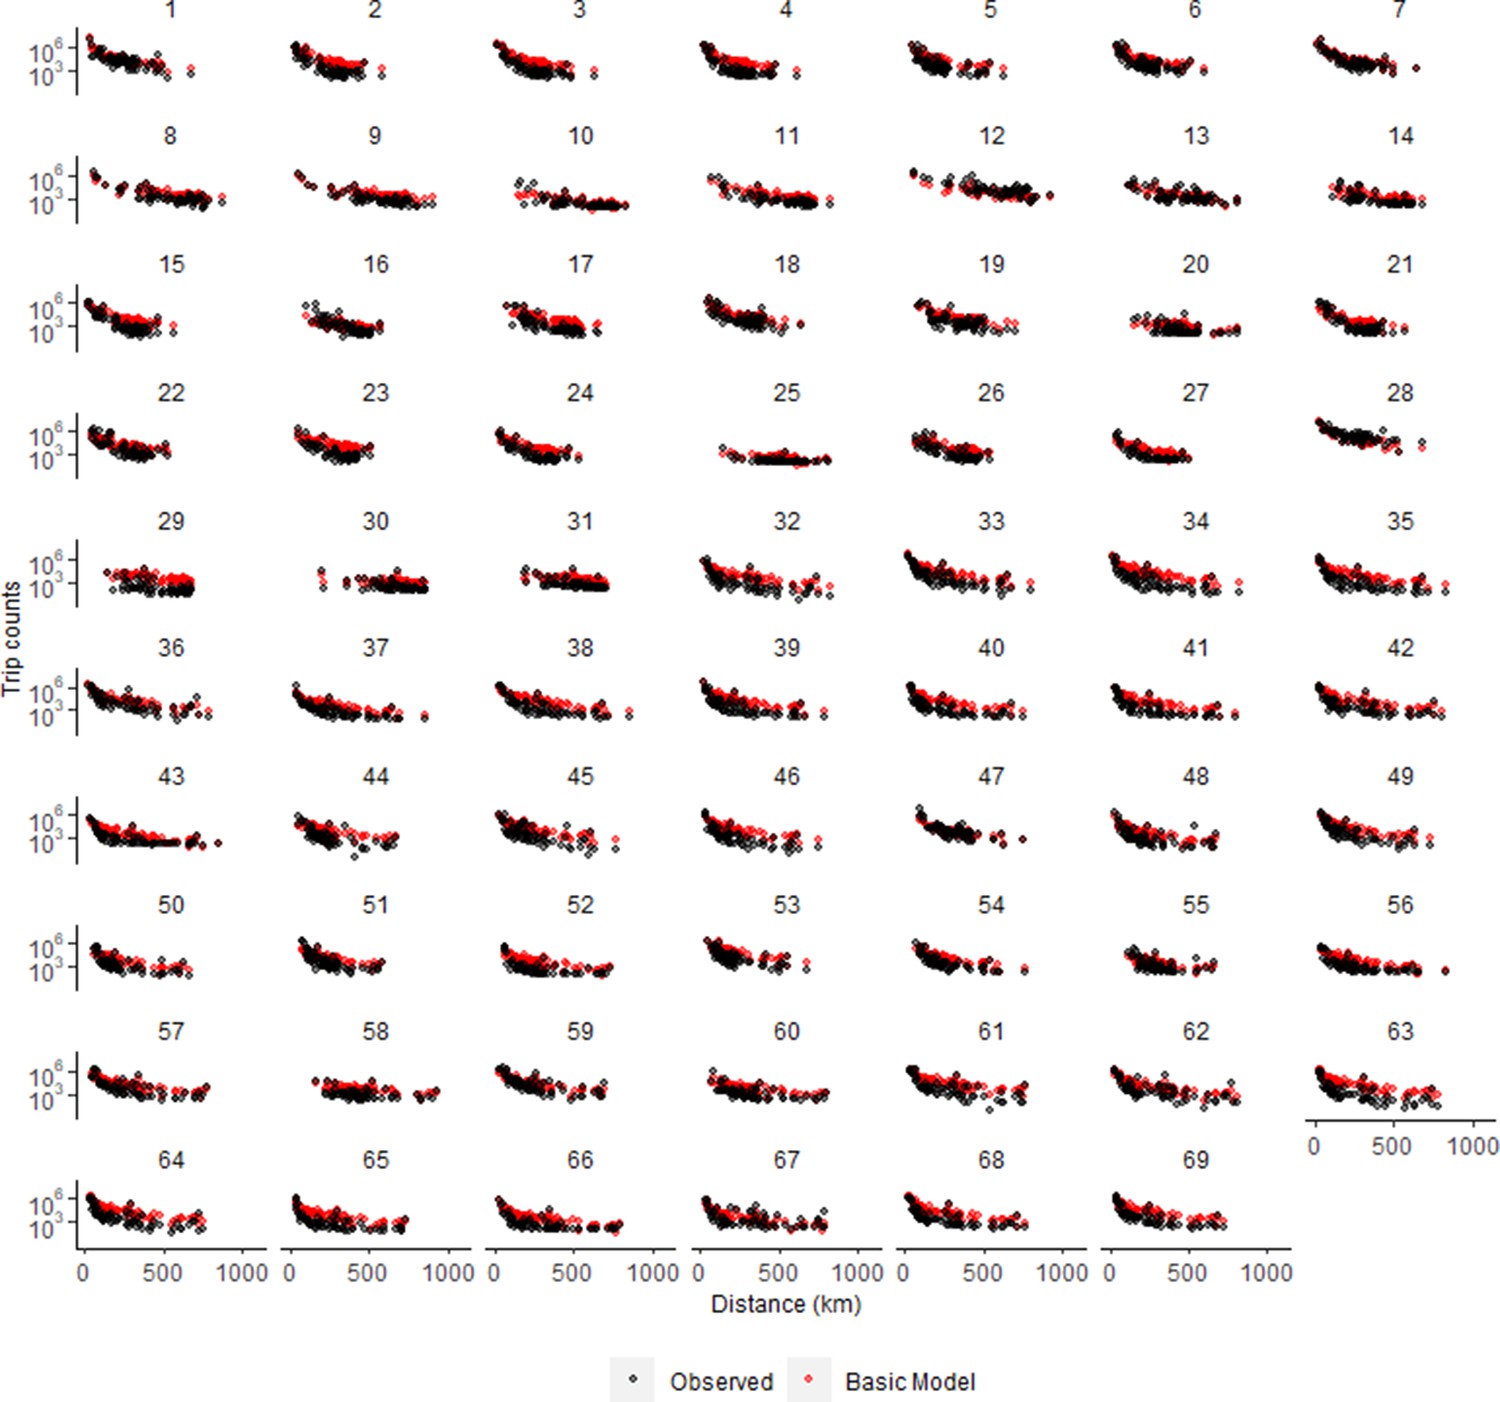
Figure 1—figure supplement 7
Trip estimates as a function of trip distance for all districts in Zambia.
Basic model used power distance kernel. See Supplementary file 1B for key to district numbers and Figure 1—figure supplement 9 for a map.
Figure 1—figure supplement 8
Trip estimates as a function of origin population for all districts in Zambia.
Basic model used power distance kernel. See Supplementary file 1B for key to district numbers and Figure 1—figure supplement 9 for a map.
Figure 1—figure supplement 9
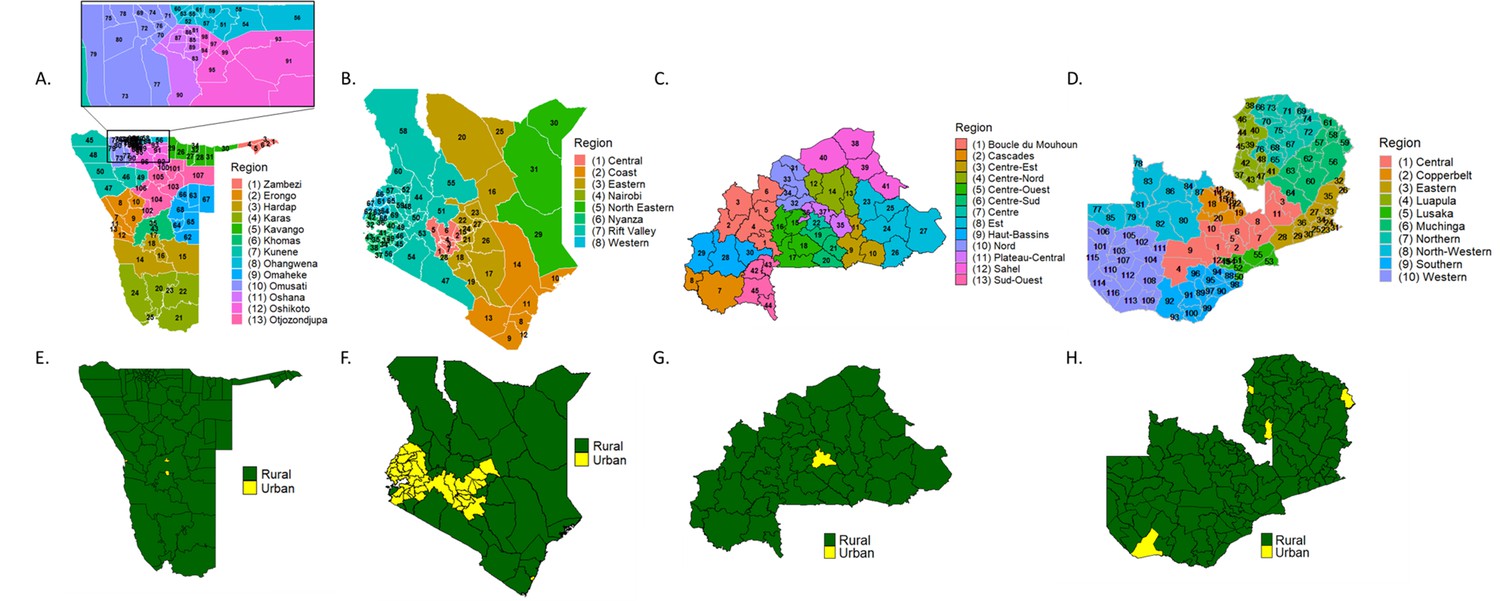
Relevant maps for Namibia, Kenya, Burkina Faso, and Zambia.
(A-D) Administrative level two units are labeled for each country. See Supplementary file 1B for key to match ID number to district name. (E-H). Districts were sorted into urban and rural categories.
Figure 2 with 2 supplements
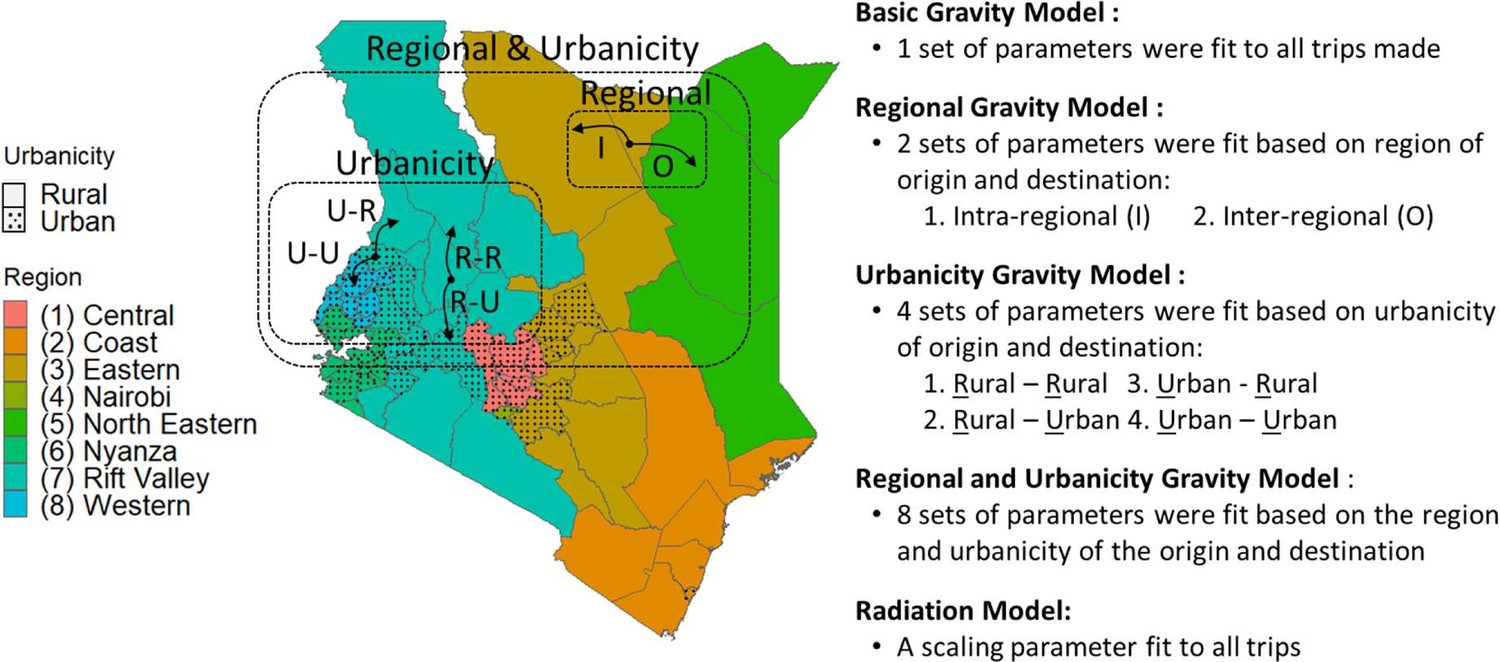
Variations of the gravity model were fit to data to capture different types of trips.
Here, Kenya is used to demonstrate the trip types that could be defined by the region (represented by color) and/or urbanicity (solid = predominantly rural, dotted = predominantly urban) of the trip’s origin and destination to outline the various models fit. See Figure 2—figure supplements 1–2 for the fitted parameters.
-
Figure 2—source data 1
Table of model parameter values fit for each country, both distance kernels, and all trip types.
- https://cdn.elifesciences.org/articles/68441/elife-68441-fig2-data1-v1.docx
Figure 2—figure supplement 1
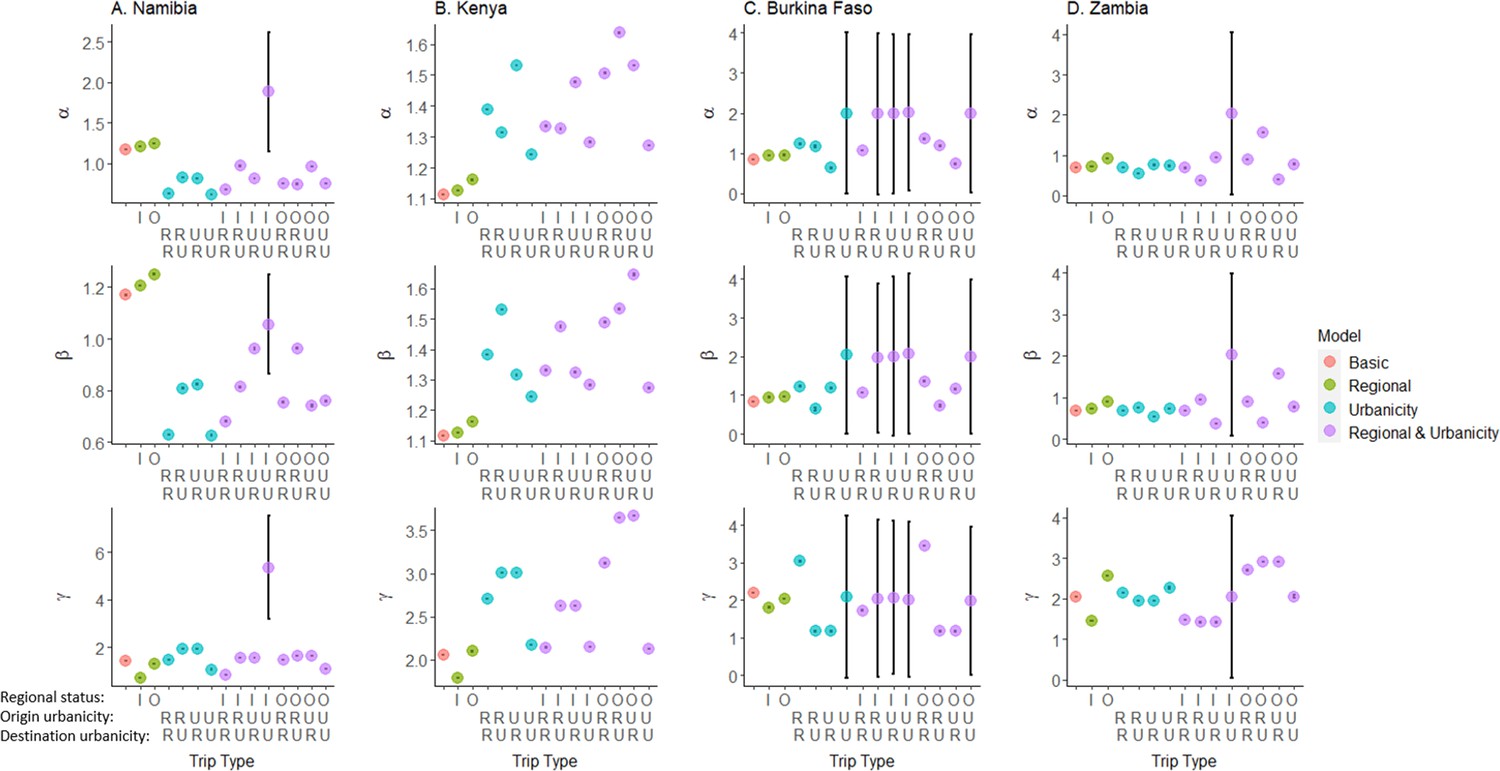
Gravity model parameters (power distance kernel).
Mobile phone data was used to fit parameters for origin population size (α), destination population size (β), and trip distance (γ) for each country. Different sets of parameters were fit, based on the gravity model type (color) and trip type (I: intra-regional, O: inter-regional, U: urban, R: rural). While the general trend of distance parameter as a function of trip type was similar across countries, the role the population size parameters played was country-specific. Note that there were no IUU routes in Namibia nor UU, IRU, IUR, IUU, or OUU routes in Burkina Faso, resulting in large standard deviations for the fitted parameters. Parameter values presented in Figure 2—source data 1.
Figure 2—figure supplement 2
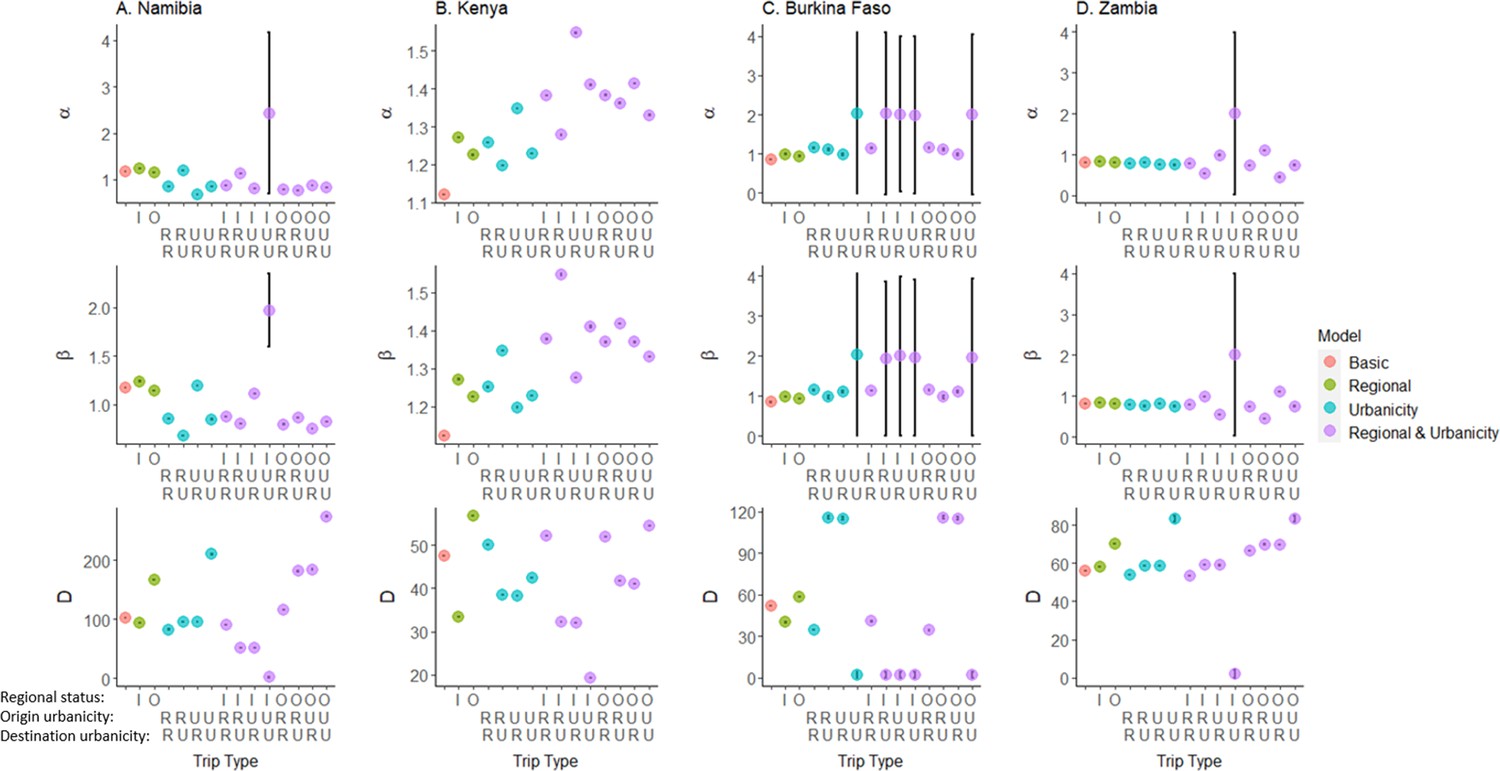
Gravity model parameters (exponential distance kernel).
Mobile phone data was used to fit parameters for origin population size (α), destination population size (β), and trip distance (D) for each country. Different sets of parameters were fit, based on the gravity model type (color) and trip type (I: intra-regional, O: inter-regional, U: urban, R: rural). While the general trend of distance parameter as a function of trip type was similar across countries, the role the population size parameters played was country-specific. Note that there were no IUU routes in Namibia nor UU, IRU, IUR, IUU, or OUU routes in Burkina Faso, resulting in large standard deviations for the fitted parameters. Parameter values presented in Figure 2—source data 1.
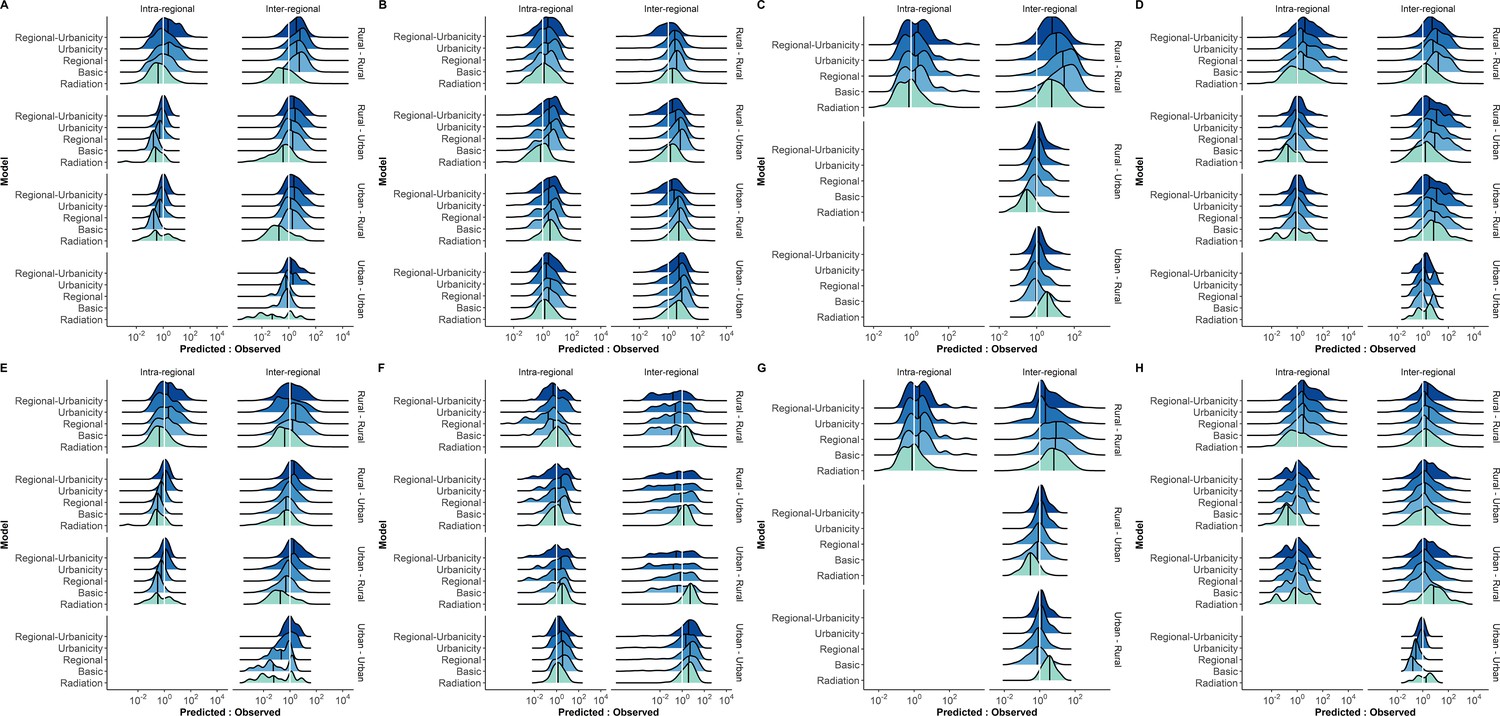
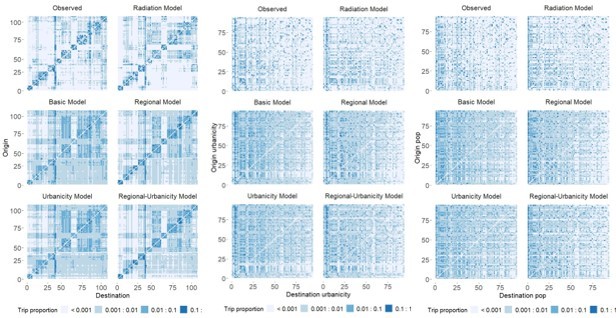
Figure 3 with 7 supplements
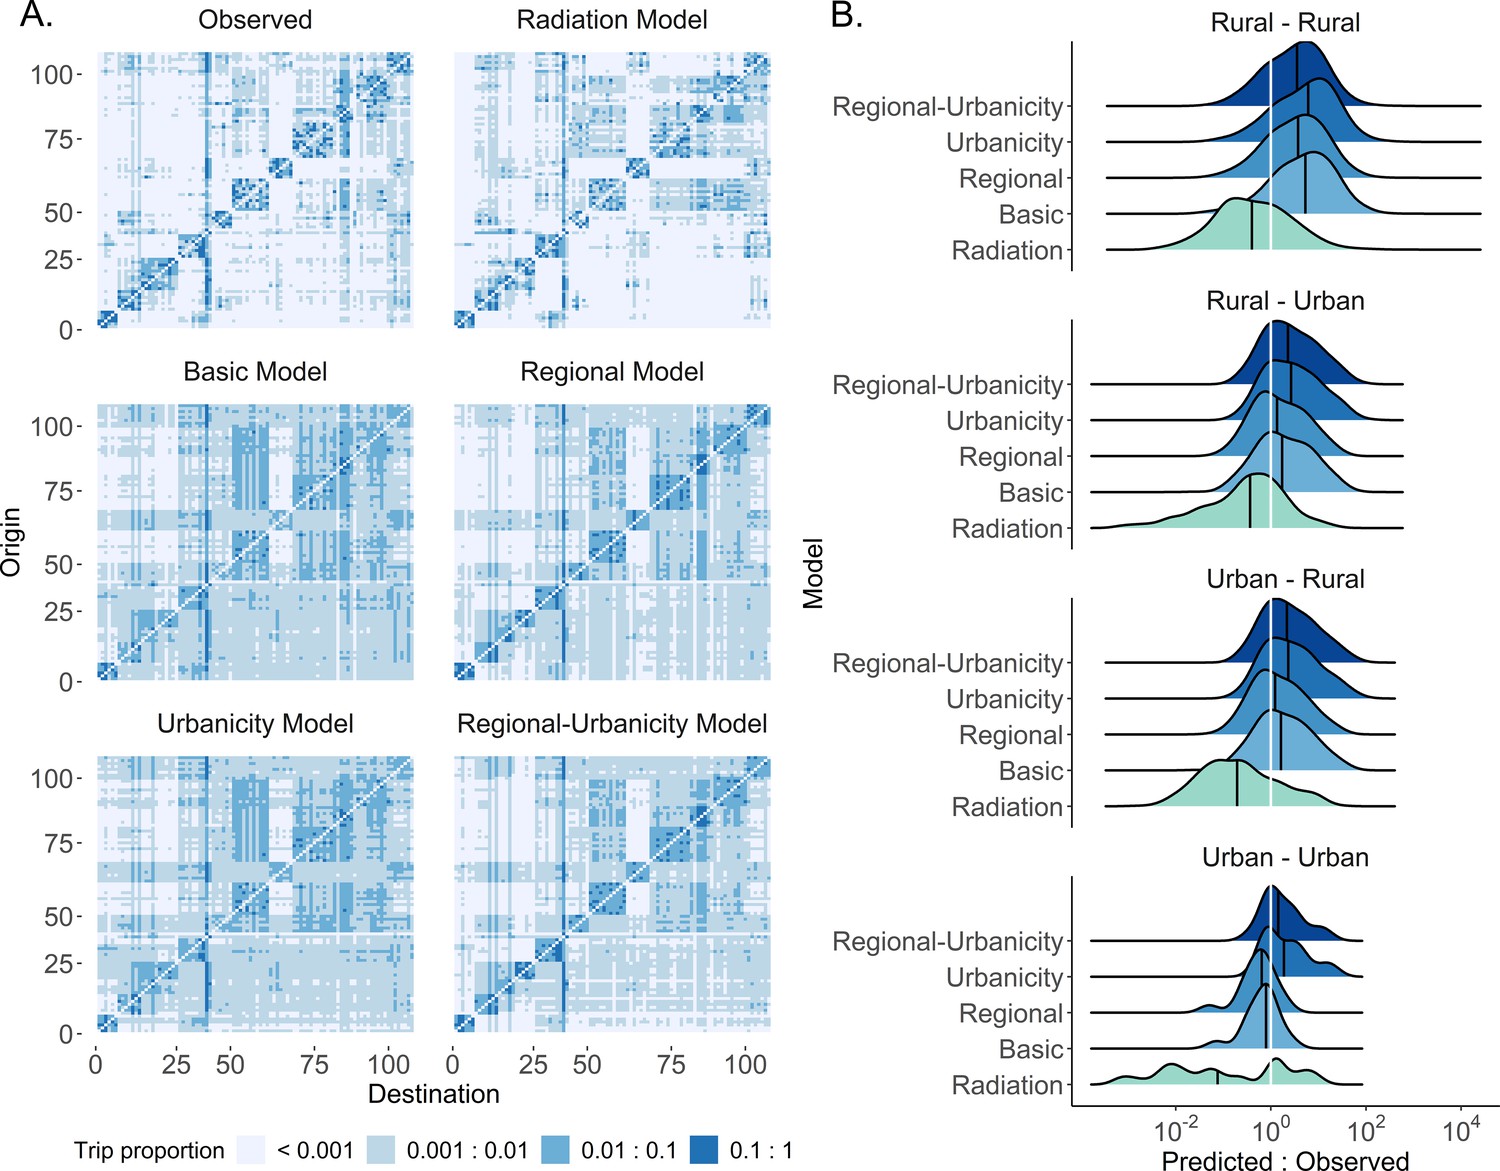
The modeled estimates of trip counties and fits by type of trip.
(A) The proportion of trips from each origin location in Namibia was estimated by five different spatial models (power distance kernel displayed here) and ordered by the origin and destination ID. Regional clustering was more pronounced and there were fewer inter-regional trips in the adjusted models and radiation model, relative to the basic model. See Figure 3—figure supplements 1–4 for all countries and both distance kernel functions. The columns and rows of the OD matrix are ordered by district ID. (B) The ratio of predicted to observed trip counts in Namibia was calculated to determine the distribution of trips that were over- (ratio >1) or underestimated (ratio <1) in each trip type by model. The median ratio (solid black vertical line) for each trip type is compared with the equity line (white vertical line) for each model (shown as different colors). The proportion of trips that fall within the selected interval (± 10% of the observed trip count) was also used to assess a model’s ability to capture trips in that category. Generally, the basic model captured urban-to-urban trips the best and overestimated the other trip types. See Figure 3—figure supplements 5–7 for all countries, trip types, and distance kernel functions.
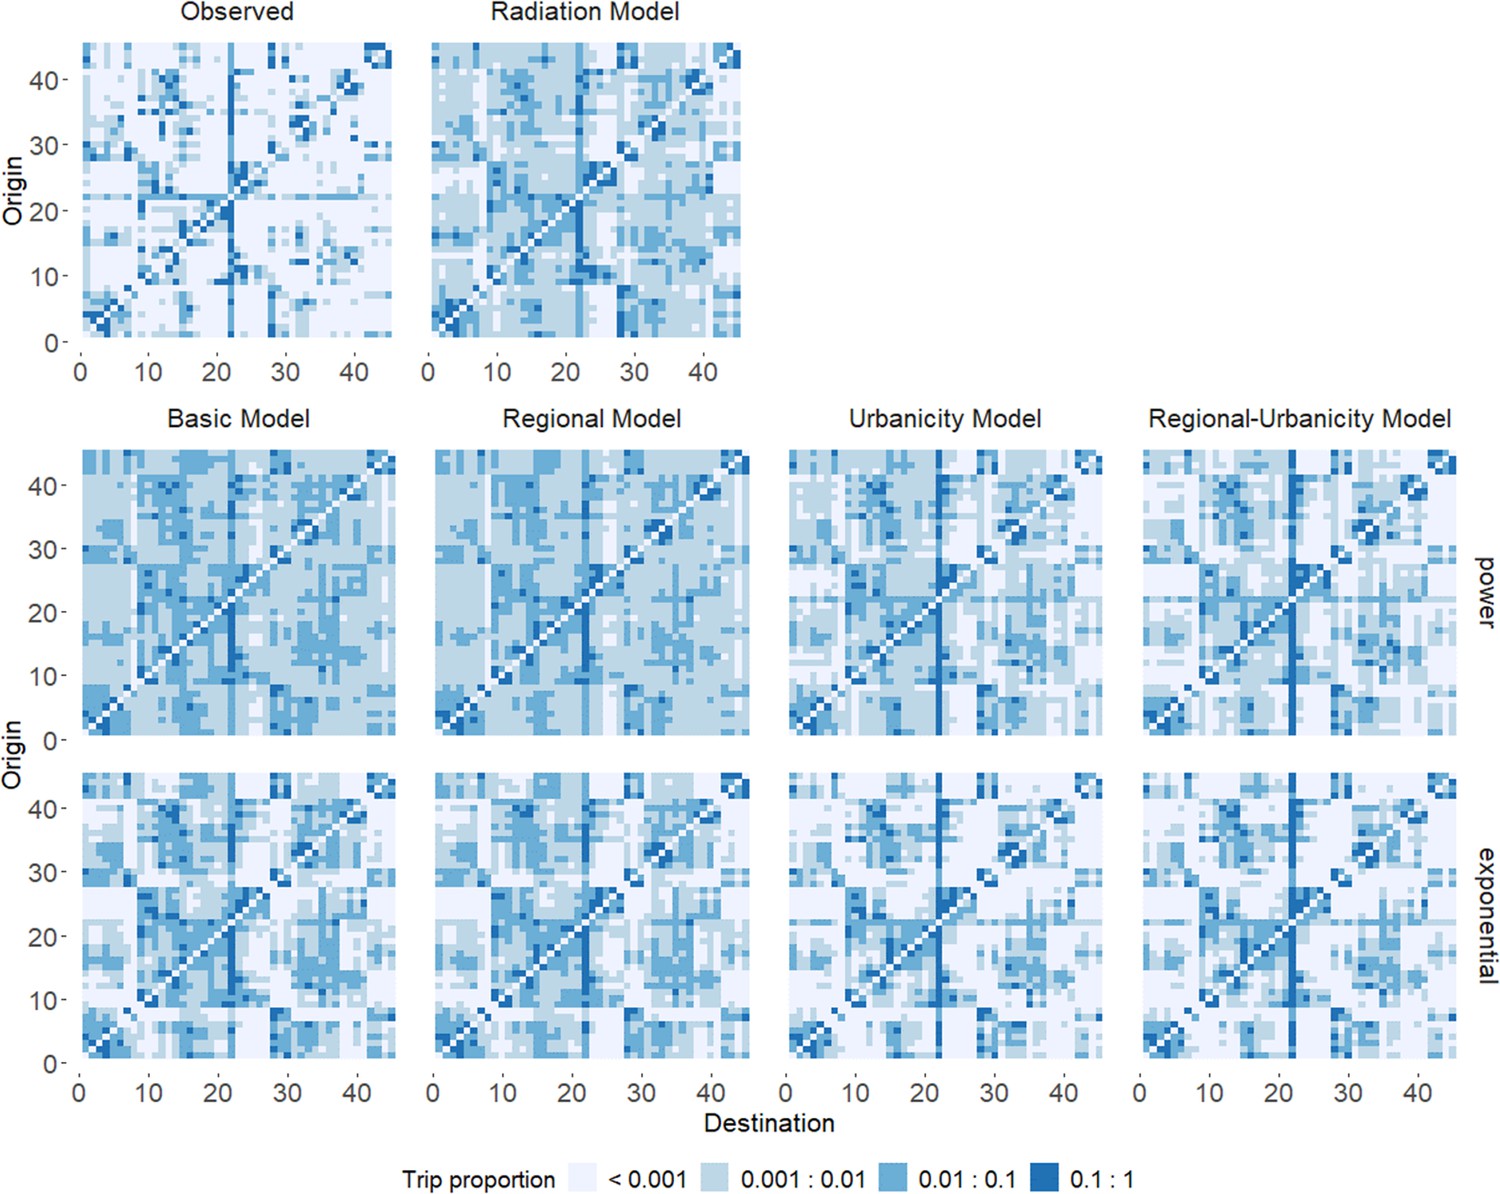
Figure 3—figure supplement 1
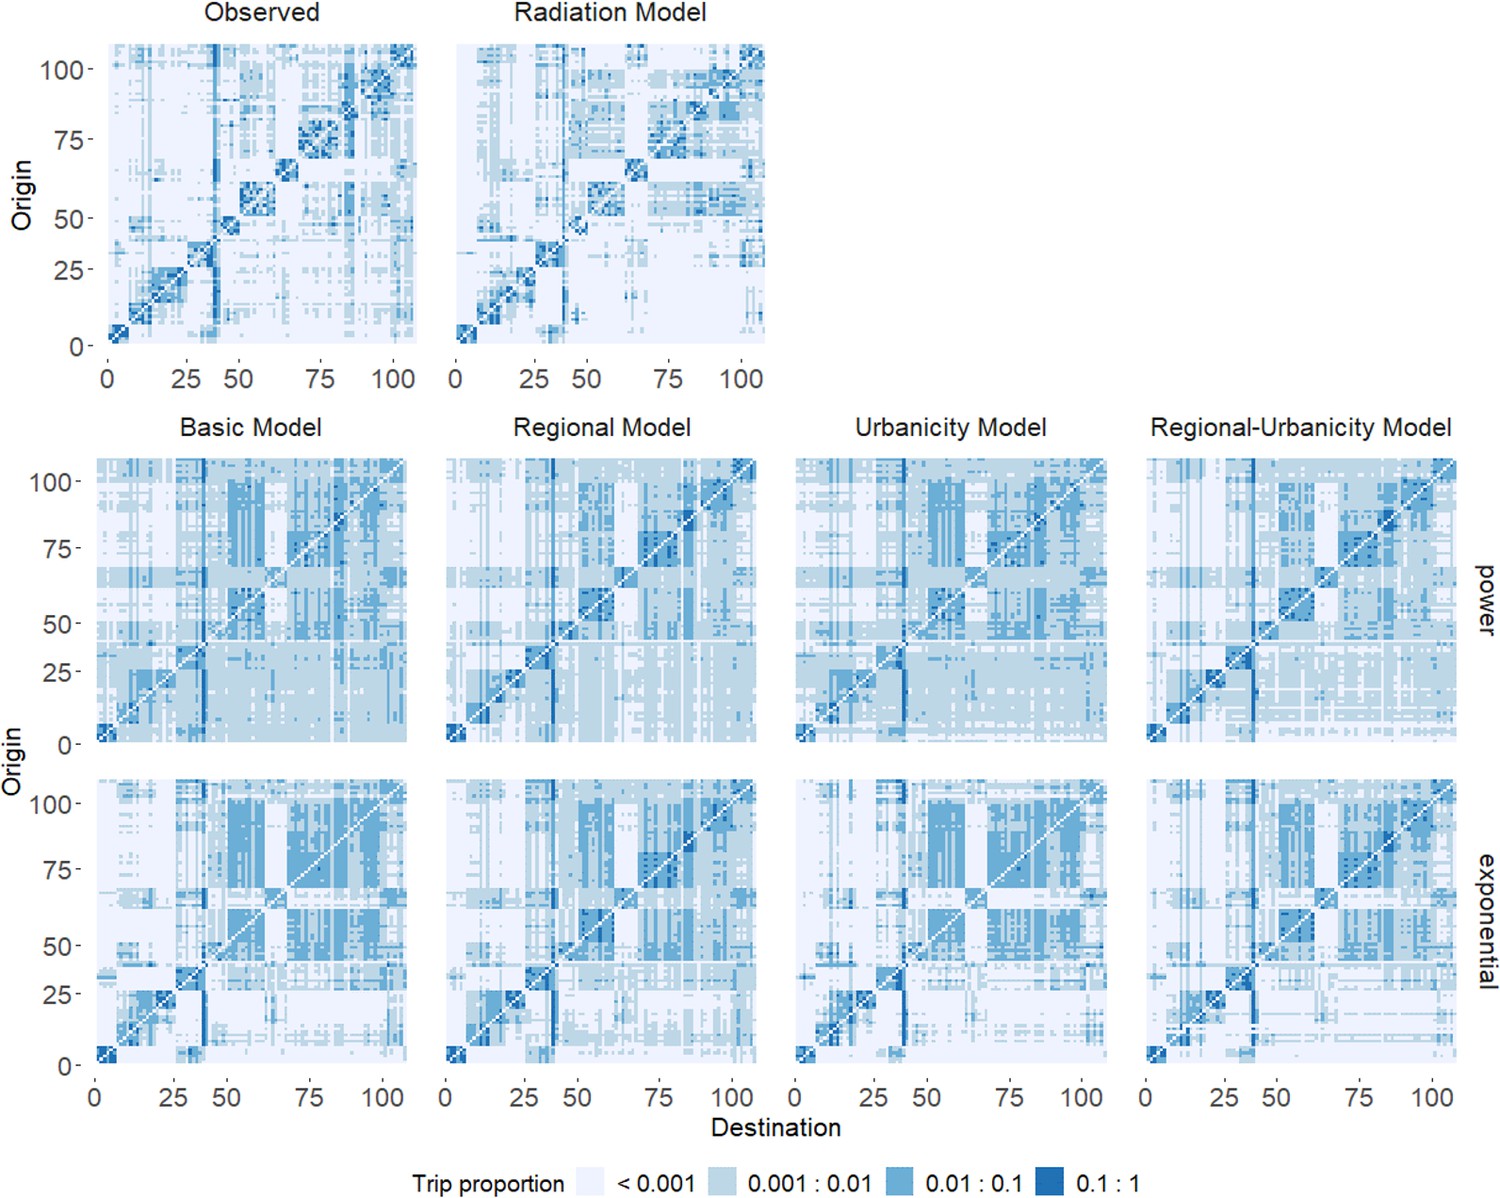
Predicted trip proportions for different models compared to the observed trip proportions from mobile phone data in Namibia.
Gravity model variants were repeated with power (middle row) and exponential (bottom row) distance kernels. See Supplementary file 1B for key to district numbers.
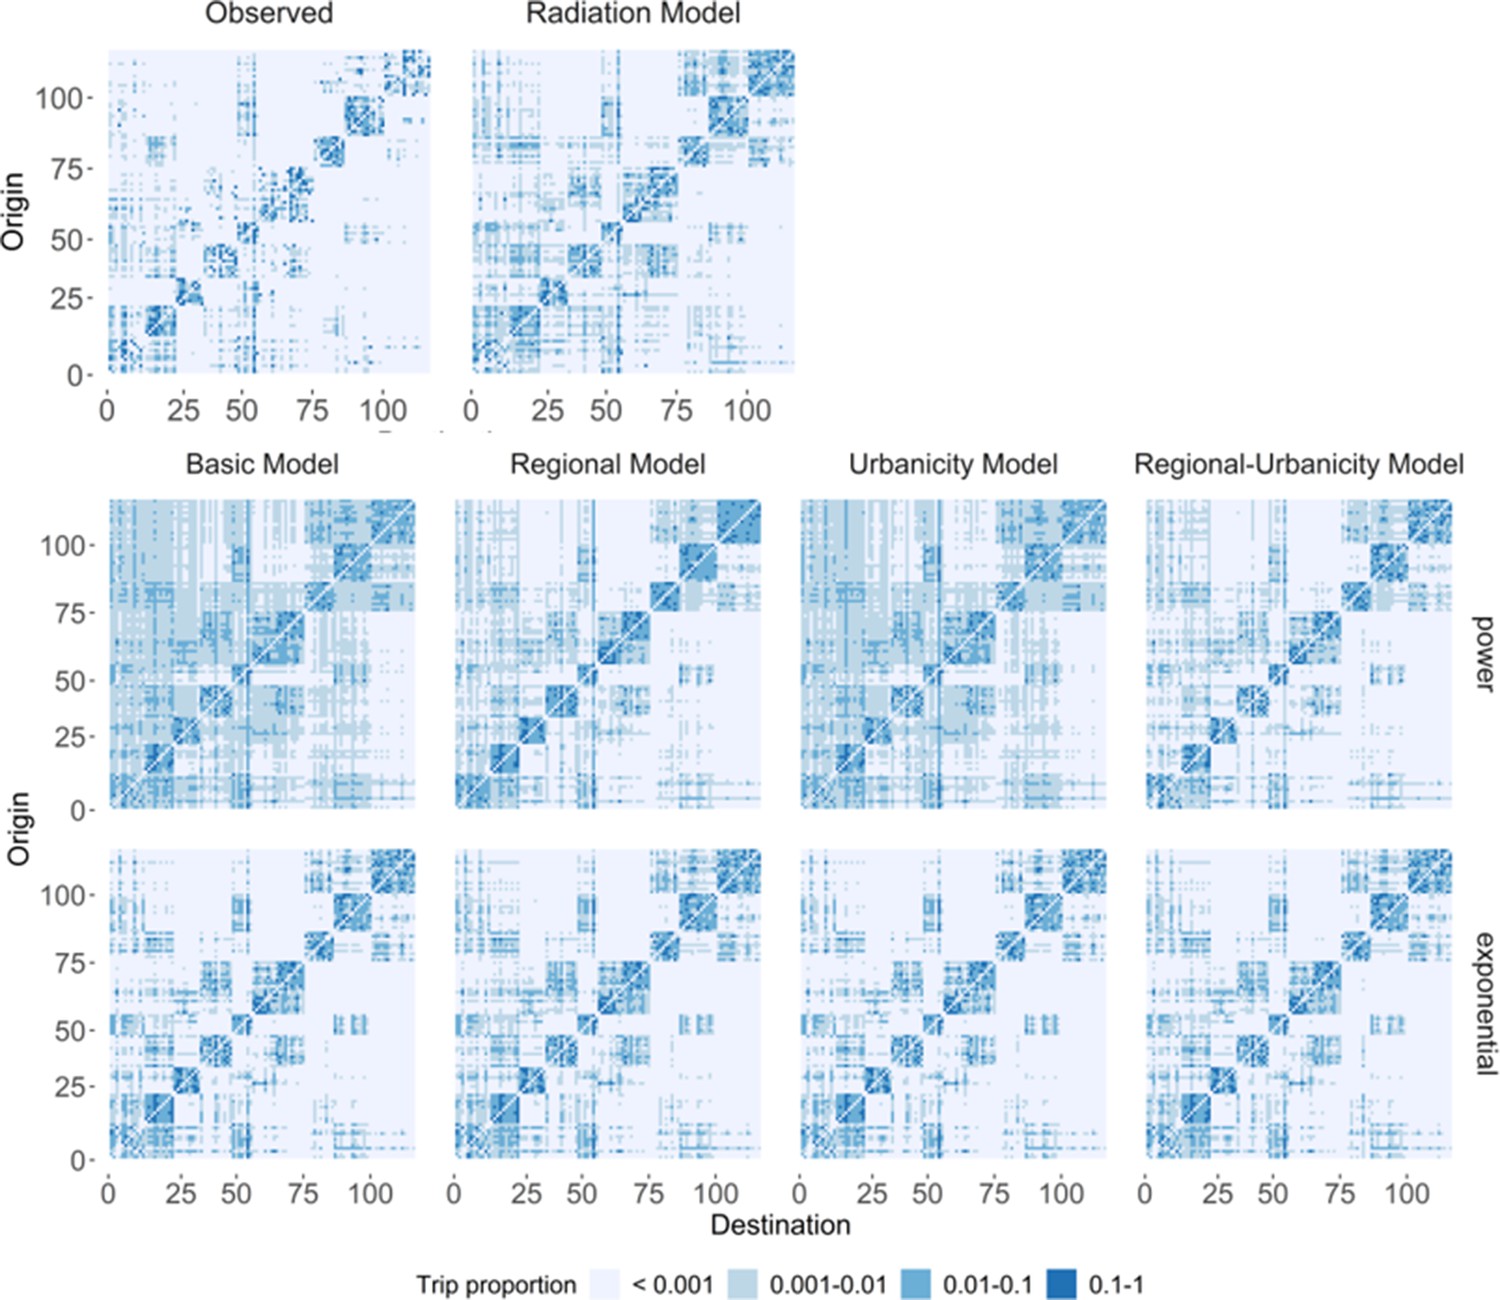
Figure 3—figure supplement 2
Predicted trip proportions for different models compared to the observed trip proportions from mobile phone data in Kenya.
Gravity model variants were repeated with power (middle row) and exponential (bottom row). See Supplementary file 1B for key to district numbers.
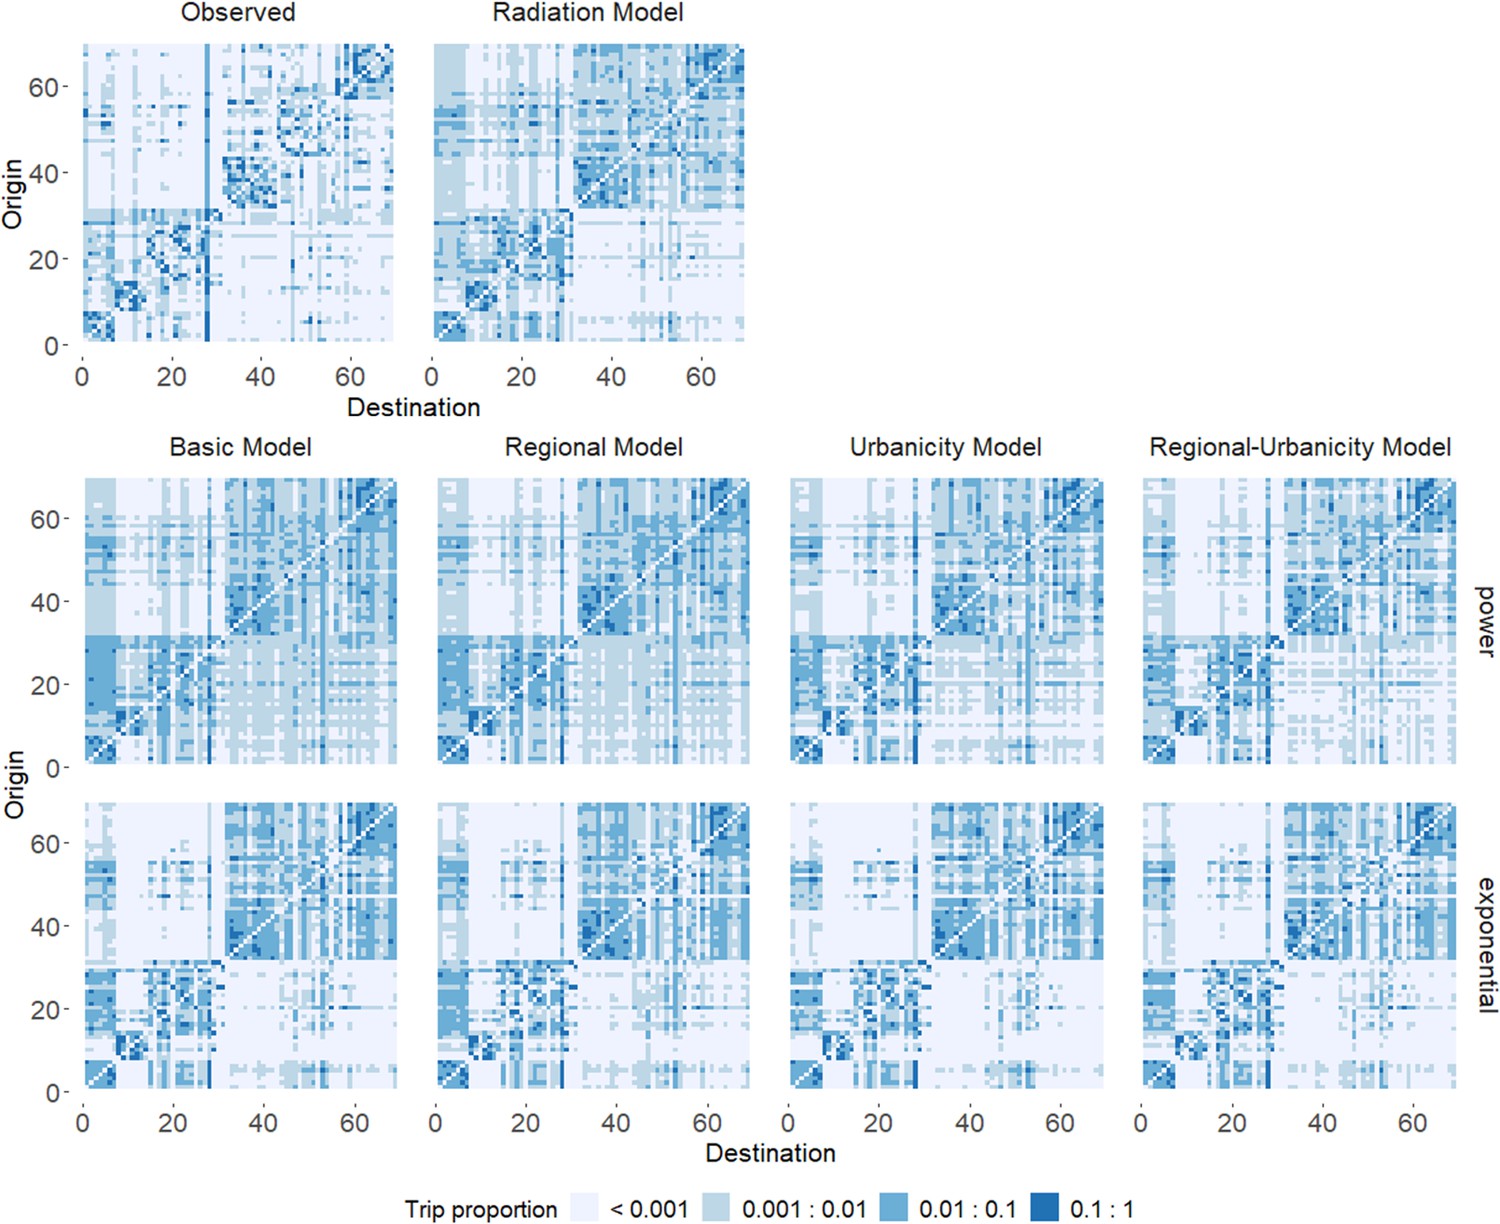
Figure 3—figure supplement 3
Predicted trip proportions for different models compared to the observed trip proportions from mobile phone data in Burkina Faso.
Gravity model variants were repeated with power (middle row) and exponential (bottom row). See Supplementary file 1B for key to district numbers.
Figure 3—figure supplement 4
Predicted trip proportions for different models compared to the observed trip proportions from mobile phone data in Zambia.
Gravity model variants were repeated with power (middle row) and exponential (bottom row). See Supplementary file 1B for key to district numbers.
Figure 3—figure supplement 5
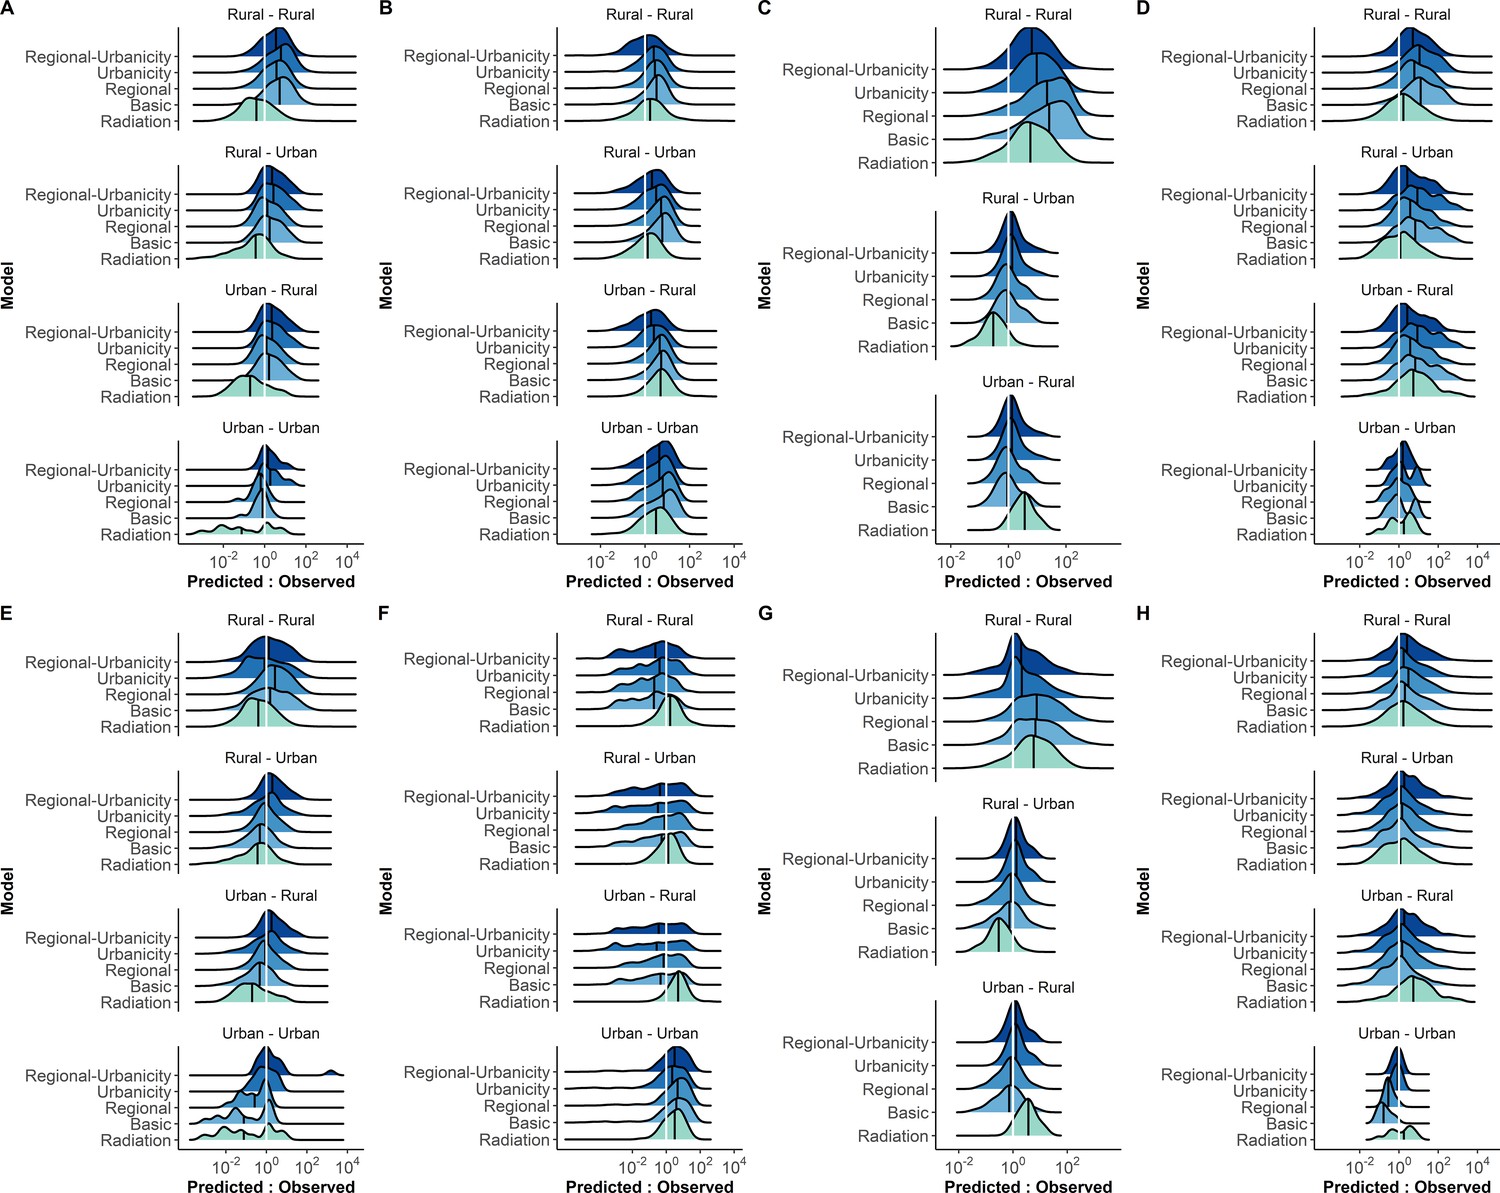
Distribution of predicted to observed trip count ratios for each urbanicity trip category in each country.
Distributions of trips from gravity models using power distance kernel (A–D) and exponential distance kernel (E–H). The median ratio (black vertical line) for each trip type is compared with the equity line (white vertical line) for each model (color). Trips that fell below the equity line were underestimated by the model, while those that fell above were overestimated. The proportion of trips that fall within the selected interval ( ± 10% of the observed trip count, values reported in Supplementary file 3B-C) was used to assess how well a model captured trips in that category.
Figure 3—figure supplement 6
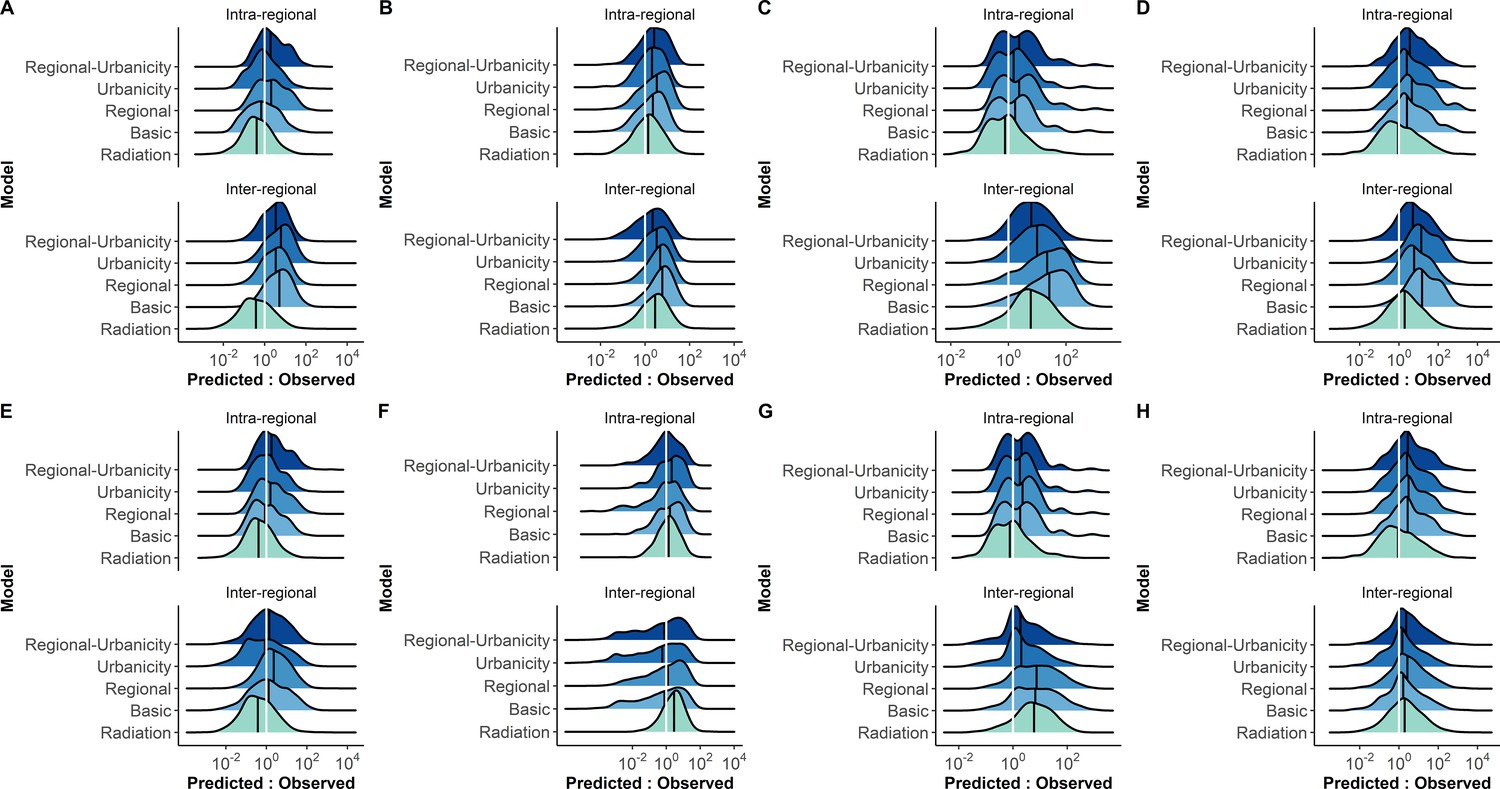
Distribution of predicted to observed trip count ratios for each regional trip category in each country.
Distributions of trips from gravity models using power distance kernel (A-D) and exponential distance kernel (E-H). The median ratio (solid black vertical line) for each trip type is compared with the equity line (dashed vertical line) for each model (color). Trips that fell below the equity line were underestimated by the model, while those that fell above were overestimated. The proportion of trips that fall within the selected interval ( ± 10% of the observed trip count, values reported in Supplementary file 3B-C) was used to assess how well a model captured trips in that category.
Figure 3—figure supplement 7
Distribution of predicted to observed trip count ratios for each regional-urbanicity trip category in each country.
Distributions of trips from gravity models using power distance kernel (A-D) and exponential distance kernel (E-H). The median ratio (solid black vertical line) for each trip type is compared with the equity line (dashed vertical line) for each model (color). Trips that fell below the equity line were underestimated by the model, while those that fell above were overestimated. The proportion of trips that fall within the selected interval ( ± 10% of the observed trip count, values reported in Supplementary file 3B-C) was used to assess how well a model captured trips in that category.
Author response image 1
Tables
Table 1
Gravity model variations (using power distance kernel) and radiation model, ranked for each country based on Deviance Information Criterion (DIC) and percent change (%Δ) from the basic gravity model.
| Rank | Namibia | Kenya | Burkina Faso | Zambia | ||||
|---|---|---|---|---|---|---|---|---|
| Model | DIC (%Δ) | Model | DIC (%Δ) | Model | DIC (%Δ) | Model | DIC (%Δ) | |
| 1 | Reg - Urb. | 3.62E + 06 (41.0) | Reg - Urb. | 2.43E + 08 (30.1) | Reg - Urb. | 1.93E + 05 (27.7) | Reg - Urb. | 2.01E + 06 (16.3) |
| 2 | Urbanicity | 4.56E + 06 (25.6) | Urbanicity | 2.53E + 08 (27.2) | Urbanicity | 2.05E + 05 (23.1) | Regional | 2.08E + 06 (13.4) |
| 3 | Regional | 4.61E + 06 (24.8) | Regional | 3.40E + 08 (2.1) | Regional | 2.52E + 05 (5.7) | Urbanicity | 2.38E + 06 (1.1) |
| 4 | Basic | 6.12E + 06 (0.0) | Basic | 3.48E + 08 (0.0) | Basic | 2.67E + 05 (0.0) | Basic | 2.40E + 06(0.0) |
| 5 | Radiation | 8.68E + 06 (-41.7) | Radiation | 4.26E + 08 (-22.4) | Radiation | 3.39E + 05 (-27.2) | Radiation | 4.3E + 06 (-79.9) |
Author response table 1
| DIC | γ | α | β | |
|---|---|---|---|---|
| Basic Model (pwr) | 6.12E+06 | 1.42 | 1.17 | 1.17 |
| Regional-Urbanicity Model (pwr) | 3.62E+06 | 0.83:5.35 | 0.68:1.88 | 0.68:1.06 |
| New population density model (pwr) | 4.97 E+06 | 0.59:3.11 | 0.11:1.93 | 0.45:1.64 |
Additional files
-
Supplementary file 1
Country and trip details.
A. Basic characteristics of countries and trips.
B. Key of region and district IDs and names. See Figure 1—figure supplement 9 for a map.
- https://cdn.elifesciences.org/articles/68441/elife-68441-supp1-v1.docx
-
Supplementary file 2
Further analysis of model fits.
A. Gravity model variations and radiation model, ranked for each country based on Deviance Information Criterion (DIC) (Standard Deviation) and percent change (%Δ) from basic model. A similar trend in ranking models by best fit was seen for gravity models with power or exponential distance kernel.
B. Model fits ranked by Deviance Information Criterion (DIC) for each country. Although the different definitions of urbanicity impacted the distribution of urbanicity trip types, the overall ranking of the model fits was not affected. Generally, the models that used the lower urban threshold (10% urban grid cells) had larger DICs (worse fits) than the models that used the higher urban threshold (50% urban grid cells). The gravity models with the power distance kernel were used here.
C. Model fits ranked by Deviance Information Criterion (DIC) for each country at administrative levels 1–3 (when available). Although the different administrative unit boundaries impacted the size of the DIC, the overall ranking of the model fits was not affected. Generally, the models that the larger administrative units (administrative one units) had smaller DICs (better fits) than the models that used the smaller administrative units (administrative three units).
- https://cdn.elifesciences.org/articles/68441/elife-68441-supp2-v1.docx
-
Supplementary file 3
Proportion of trips estimated within target interval.
A. For each trip type and country, the model was reported that estimated the highest proportion of trips with estimated trip counts that fell within ±10%the observed trips (% trips). In situations where the proportion of trips of estimated by two models differed by less than 1%, both models were included. The distance kernel used is indicated by exp (exponential) or pwr (power). See B and C for the trip proportions for all models.
B. For each trip type in each country, the percentage of estimated trips that fell within the selected interval of ±10% of the observed trip count. (Power distance kernel used in gravity models)
C. For each trip type in each country, the percentage of estimated trips that fell within the selected interval of ±10% of the observed trip count. (Exponential distance kernel used in gravity models).
- https://cdn.elifesciences.org/articles/68441/elife-68441-supp3-v1.docx
-
Transparent reporting form
- https://cdn.elifesciences.org/articles/68441/elife-68441-transrepform1-v1.pdf
Download links
A two-part list of links to download the article, or parts of the article, in various formats.
Downloads (link to download the article as PDF)
Open citations (links to open the citations from this article in various online reference manager services)
Cite this article (links to download the citations from this article in formats compatible with various reference manager tools)
Characterizing human mobility patterns in rural settings of sub-Saharan Africa
eLife 10:e68441.
https://doi.org/10.7554/eLife.68441


