Reversible phosphorylation of cyclin T1 promotes assembly and stability of P-TEFb
- Departments of Medicine, Microbiology and Immunology, University of California, San Francisco, United States
- Department of Medicine, United States
- The Howard Hughes Medical Institute, United States
- Department of Bioengineering and Therapeutic Sciences, University of California, San Francisco, United States
- Departmentof Cellular Molecular Pharmacology, California Institute for Quantitative Biosciences (QBI), and Department of Bioengineering and Therapeutic Sciences, United States
- Department of Bioengineering and Therapeutic Sciences, Department of Pharmaceutical Chemistry, and California Institute for Quantitative Biosciences (QBI), United States
Figures
Figure 1
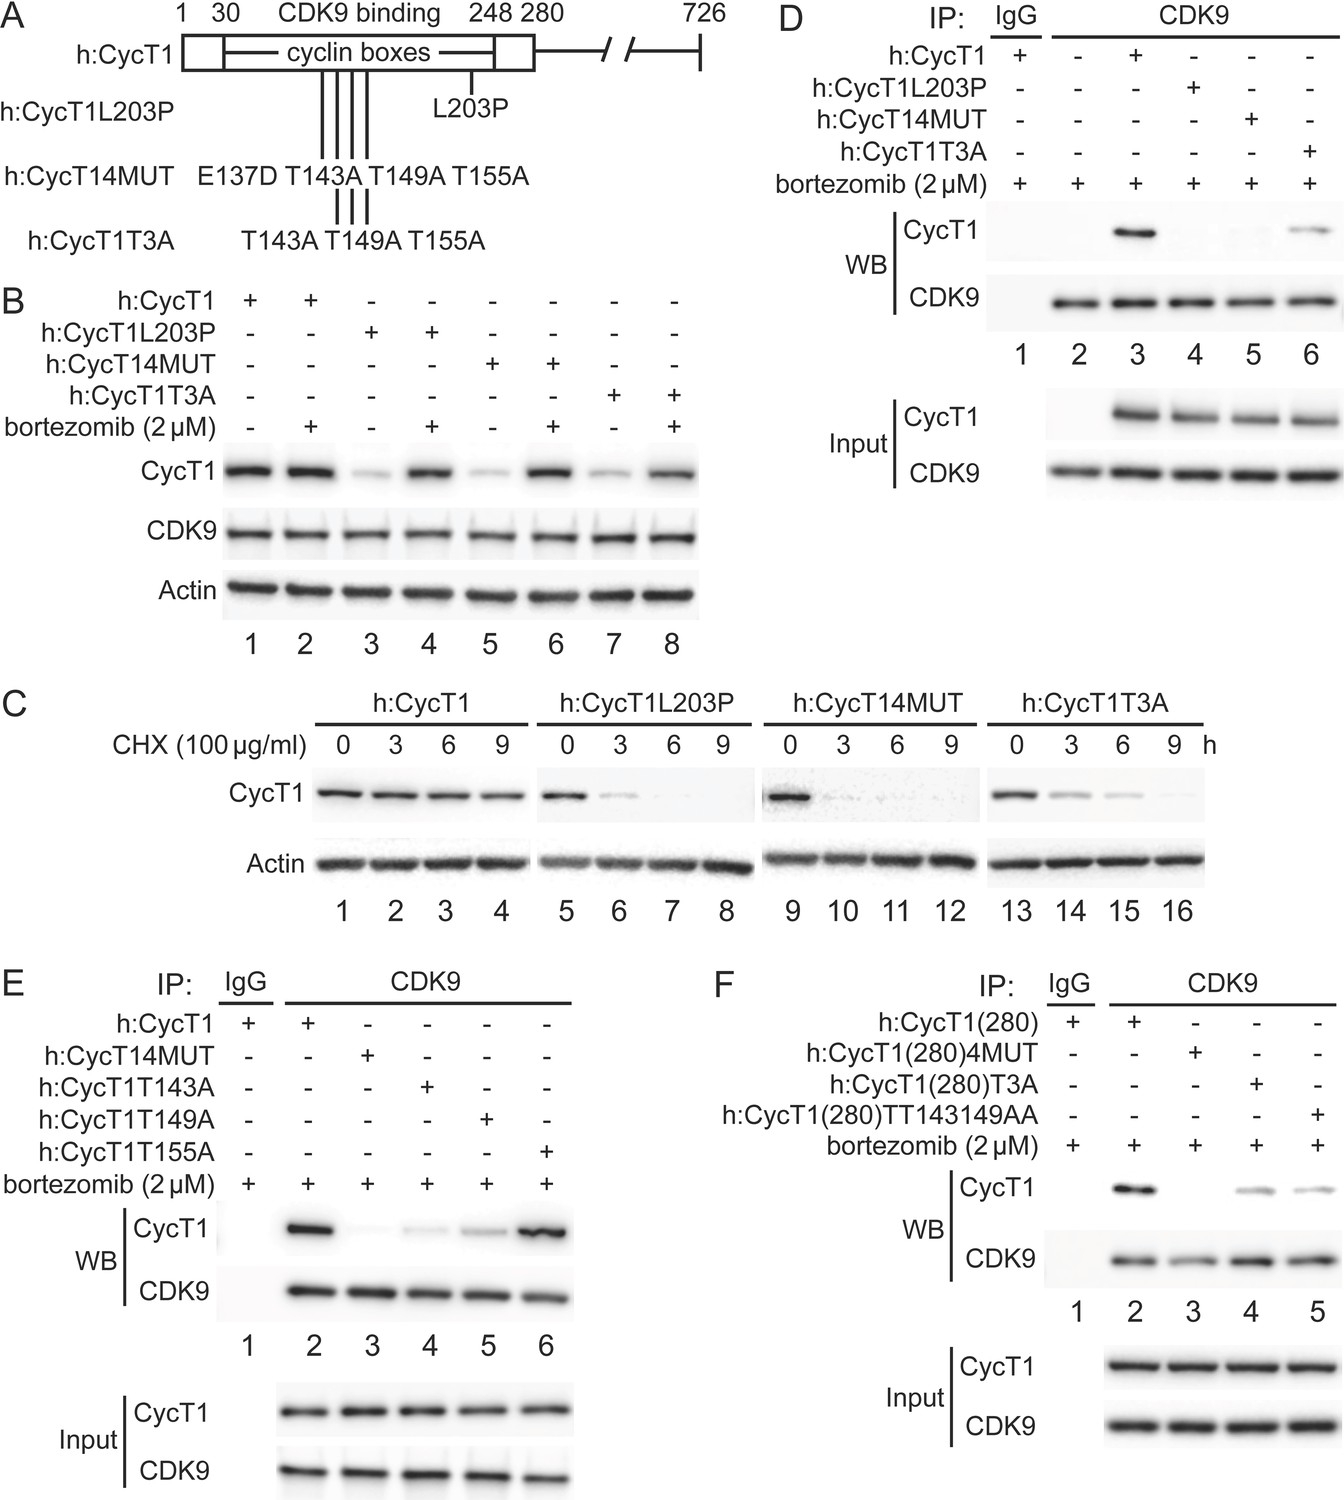
Critical residues in CycT1 (Thr143 and Thr149) are required for its binding to CDK9.
(A) Diagram of WT CycT1 and indicated mutant CycT1 proteins. The full-length human CycT1 protein contains 726 residues. Two cyclin boxes are found between positions 30 and 248. Critical residues for CDK9 binding include Thr143, Thr149, and Thr155. Glu137 and Leu203 flank these sites. Presented are critical mutations in CycT1 that form the basis of this study. (B) Mutant CycT1 proteins are unstable. WT CycT1 and three indicated mutant CycT1 proteins were expressed in 293T cells, which were untreated (lanes 1, 3, 5, and 7) or treated with 2 μM bortezomib for 12 hr (lanes 2, 4, 6, and 8) before cell lysis. Levels of CycT1 (panel 1), CDK9 (panel 2), and the loading control actin (panel 3) proteins were detected with anti-HA, anti-CDK9, and anti-β-actin antibodies, respectively, by WB. Top panels are designated as panel 1, and panel numbers increase from top to bottom (same numbering rules are applied to all WB panels throughout). Gels are marked as follows: IP, IPed proteins, above panels; next, presence and absence of co-IPed proteins is denoted by (+) and (-) signs; same for the inclusion and concentration of bortezomib; WB, western blot of co-IPed proteins; Input, western blot of input proteins. (C) Mutant CycT1 proteins are unstable. WT CycT1 and three indicated mutant CycT1 proteins were expressed in 293T cells, which were untreated (lanes 1, 5, 9, and 13) or treated with 100 μg/ml cycloheximide (CHX) for 3–9 hr (lanes 2–4; 6–8; 10–12; 14–16) before cell lysis. Levels of CycT1 (panel 1) and the loading control actin (panel 2) proteins were detected with anti-HA and anti-β-actin antibodies, respectively, by WB. (D) Interactions between CDK9 and mutant CycT1 proteins are impaired. WT CycT1 and three indicated mutant CycT1 proteins were expressed in 293T cells treated with bortezomib. Co-IPs with CDK9 are presented in panels 1 and 2. Panels 3 and 4 contain input levels of CycT1 and CDK9 proteins. (E) Interactions between CDK9 and point mutant CycT1 proteins are impaired. WT CycT1 and four indicated mutant CycT1 proteins were expressed in 293T cells treated with bortezomib. Co-IPs with CDK9 are presented in panels 1 and 2. Panels 3 and 4 contain input levels of CycT1 and CDK9 proteins. (F) Interactions between CDK9 and truncated mutant CycT1(280) proteins are impaired. WT CycT1 and three indicated mutant CycT1 proteins were expressed in 293T cells treated with bortezomib. Co-IPs with CDK9 are presented in panels 1 and 2. Panels 3 and 4 contain input levels of CycT1(280) and CDK9 proteins.
Figure 2 with 1 supplement
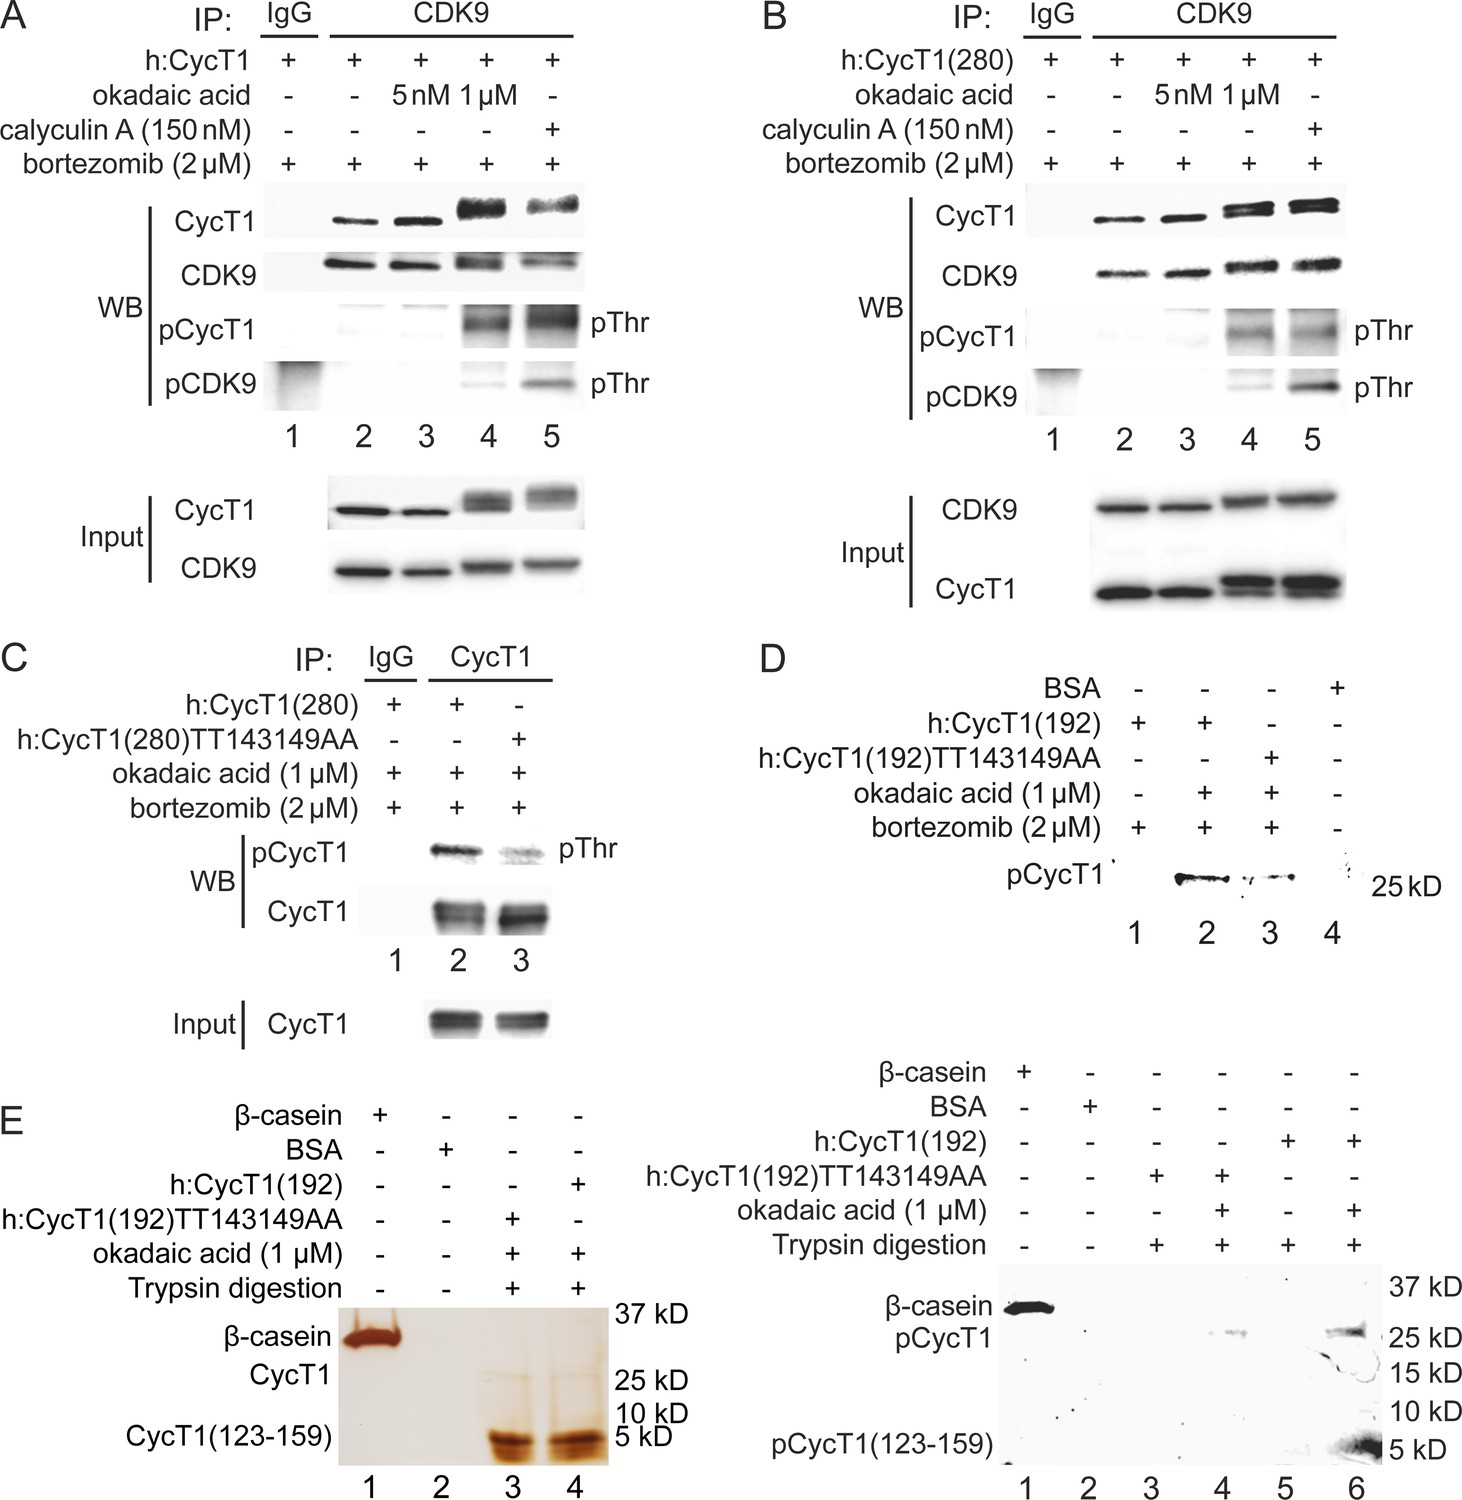
Phosphorylation of Thr143 and Thr149 in CycT1 contributes to its binding to CDK9.
(A) Threonine phosphorylation is detected in the full-length CycT1 protein. CycT1 was expressed in 293T cells untreated or treated with 5 nM or 1 μM okadaic acid, or 150 nM calyculin A (+/- signs on top). Co-IPs with CDK9 were then probed with anti-HA and anti-CDK9 antibodies in panels 1 and 2, with anti-phospho-threonine (pThr) antibodies in panels 3 and 4. Panels 5 and 6 contain input levels of CycT1 and CDK9 proteins. (B) Threonine phosphorylation is detected in CycT1(280). CycT1(280) protein was expressed in 293T cells untreated or treated with 5 nM or 1 μM okadaic acid, or 150 nM calyculin A (+/- signs on top). Co-IPs with CDK9 were then probed with anti-HA and anti-CDK9 antibodies in panels 1 and 2, with anti-pThr antibodies in panels 3 and 4. Panels 5 and 6 contain input levels of CycT1 and CDK9 proteins. (C) Thr143 and Thr149 are major phospho-threonine residues in CycT1(280). WT CycT1(280) or mutant CycT1(280)TT143149AA proteins were expressed in the presence of bortezomib and 1 μM okadaic acid in 293T cells. IPs with CycT1 were then probed with anti-pThr and anti-HA antibodies in panels 1 and 2. Panel 3 contains input levels of CycT1 proteins. (D) Thr143 and Thr149 are major phosphorylated residues in CycT1(192). WT CycT1(192) or mutant CycT1(192)TT143149AA proteins were expressed in the presence of bortezomib and/or 1 μM okadaic acid (+/- signs on top) in 293T cells. After IPs with anti-HA antibodies, IPed samples were subjected to SDS-PAGE, then phosphorylated proteins were detected by in-gel Phospho-Tag staining, with unphosphorylated BSA protein as the negative control. (E) Direct detection of Thr143/Thr149 phosphorylation by phosphopeptide mapping analysis. WT CycT1(192) or mutant CycT1(192)TT143149AA proteins were expressed in the presence of bortezomib and/or 1 μM okadaic acid (+/- signs on top) in 293T cells. After IP with anti-HA antibodies. IPed samples were digested by trypsin and subjected to SDS-PAGE, followed by silver staining (left panel) in-gel Phospho-Tag staining (right panel), using phosphorylated β-casein protein as the positive control and unphosphorylated BSA protein as the negative control.
Figure 2—figure supplement 1
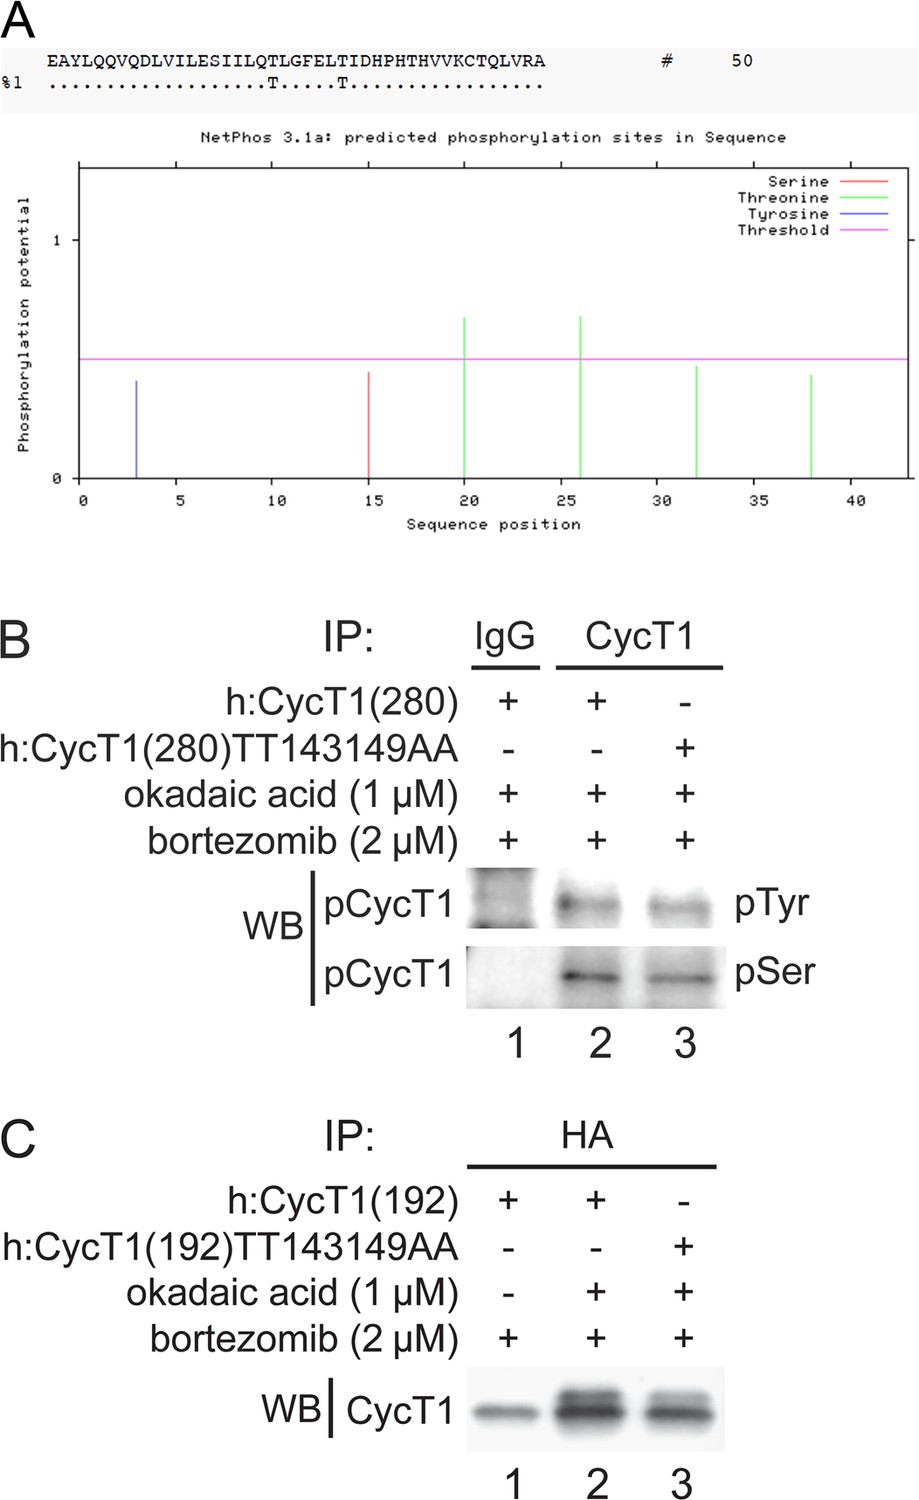
Thr143 and Thr149 are main phosphorylation sites in CycT1.
(A) Thr143 and Thr149 are predicted to be potential phosphorylation sites. Potential phosphorylation sites between 124 aa. to 166 aa. in CycT1 were analyzed by the NetPhos 3.1 program. Threshold was set to 0.5 (default value), indicated by the pink line. Thr143 and Thr149 scored highest as potential phosphorylation sites. (B) Levels of phospho-tyrosine and phospho-serine residues are similar in WT CycT1(280) and mutant CycT1(280)TT143149AA proteins. WT CycT1(280) or mutant CycT1(280)TT143149AA proteins were expressed in the presence of bortezomib and okadaic acid in 293T cells, and IPed with anti-HA antibodies. IPed CycT1 proteins were then probed with anti-phospho-tyrosine (pTyr) and anti-phospho-serine (pSer) antibodies in panels 1 and 2. (C) Phosphorylation of WT CycT1(192) and mutant CycT1(192)TT143149AA proteins is also induced by high concentration of okadaic acid treatment. WT CycT1(192) or mutant CycT1(192)TT143149AA proteins were expressed in the absence or presence of okadaic acid and bortezomib (+/- signs on top) in 293T cells, and IPed with anti-HA antibodies, followed by western blotting (WB) with anti-HA antibodies by WB.
Figure 3
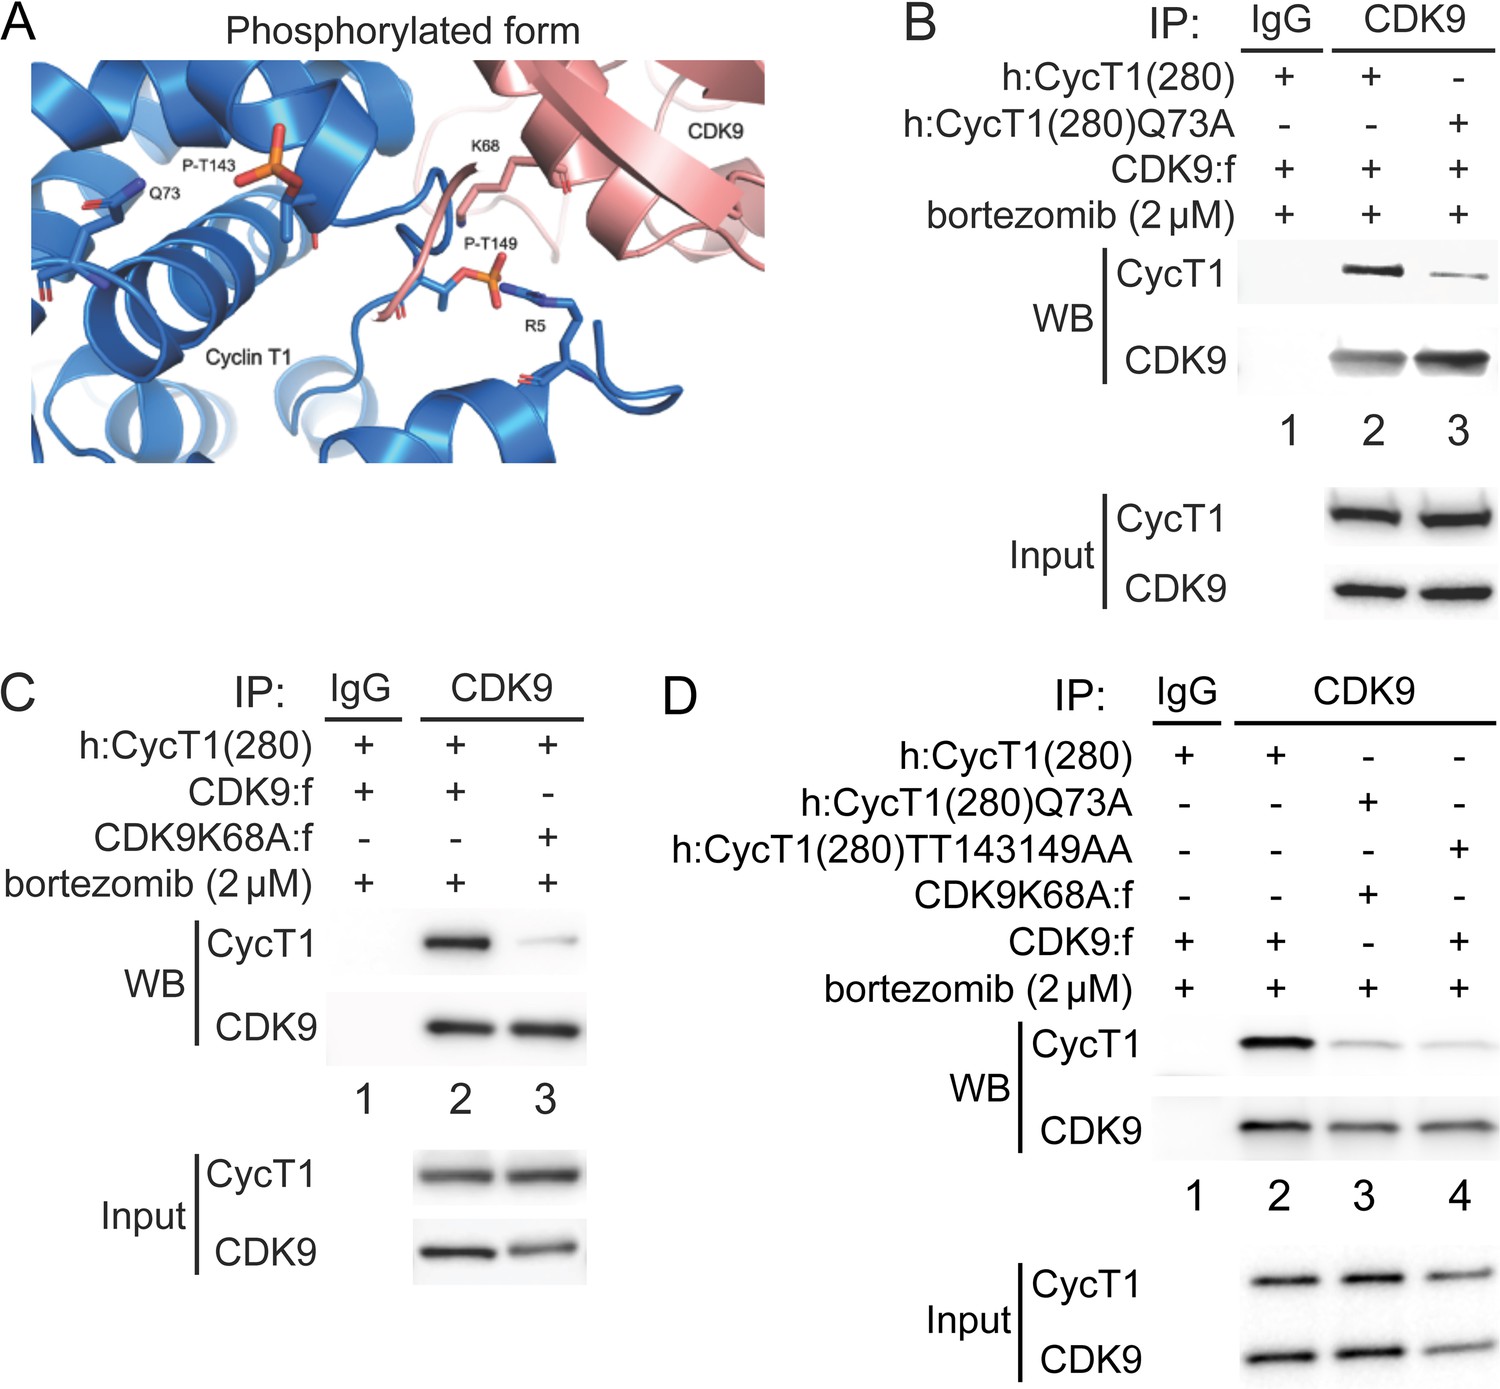
Phosphorylation of Thr143 and Thr149 stabilizes the interface between CycT1 and CDK9.
(A) Model of P-TEFb where CycT1 is phosphorylated at Thr143 and Thr149. The model was created by adding phosphates to Thr143 and Thr149 in the published crystal structure of P-TEFb (PDB ID 3MI9), followed by energy minimization and molecular dynamics (MD) simulations. Residues predicted to interact with Thr143 and Thr149 are Gln73 in CycT1 and Lys68 in CDK9, respectively. (B) Gln73 is targeted by phosphorylated Thr143 in CycT1. WT CycT1(280) or mutant CycT1(280)Q73A proteins and CDK9 were coexpressed in the presence of bortezomib (+/- signs on top) in 293T cells. Co-IPs with CDK9 are presented in panels 1 and 2. Panels 3 and 4 contain input levels of CycT1 and CDK9 proteins. (C) Lys68 in CDK9 is targeted by phosphorylated Thr149 in CycT1. WT CDK9 or mutant CDK9K68A proteins and CycT1(280) were coexpressed in the presence of bortezomib (+/- signs on top) in 293T cells. Co-IPs with CDK9 are presented in panels 1 and 2. Panels 3 and 4 contain input levels of CycT1 and CDK9 proteins. (D) Mutations of K68A in CDK9 and Q73A in CycT1 attenuate cooperatively the binding between CycT1 and CDK9, equivalently to the mutant CycT1TT143149AA protein. WT CycT1(280) or mutant CycT1(280)Q73A proteins and WT CDK9 or mutant CDK9K68A proteins were coexpressed in the presence of bortezomib (+/- signs on top) in 293T cells. Co-IPs with CDK9 are presented in panels 1 and 2. Panels 3 and 4 contain input levels of CycT1 and CDK9 proteins.
Figure 4 with 1 supplement
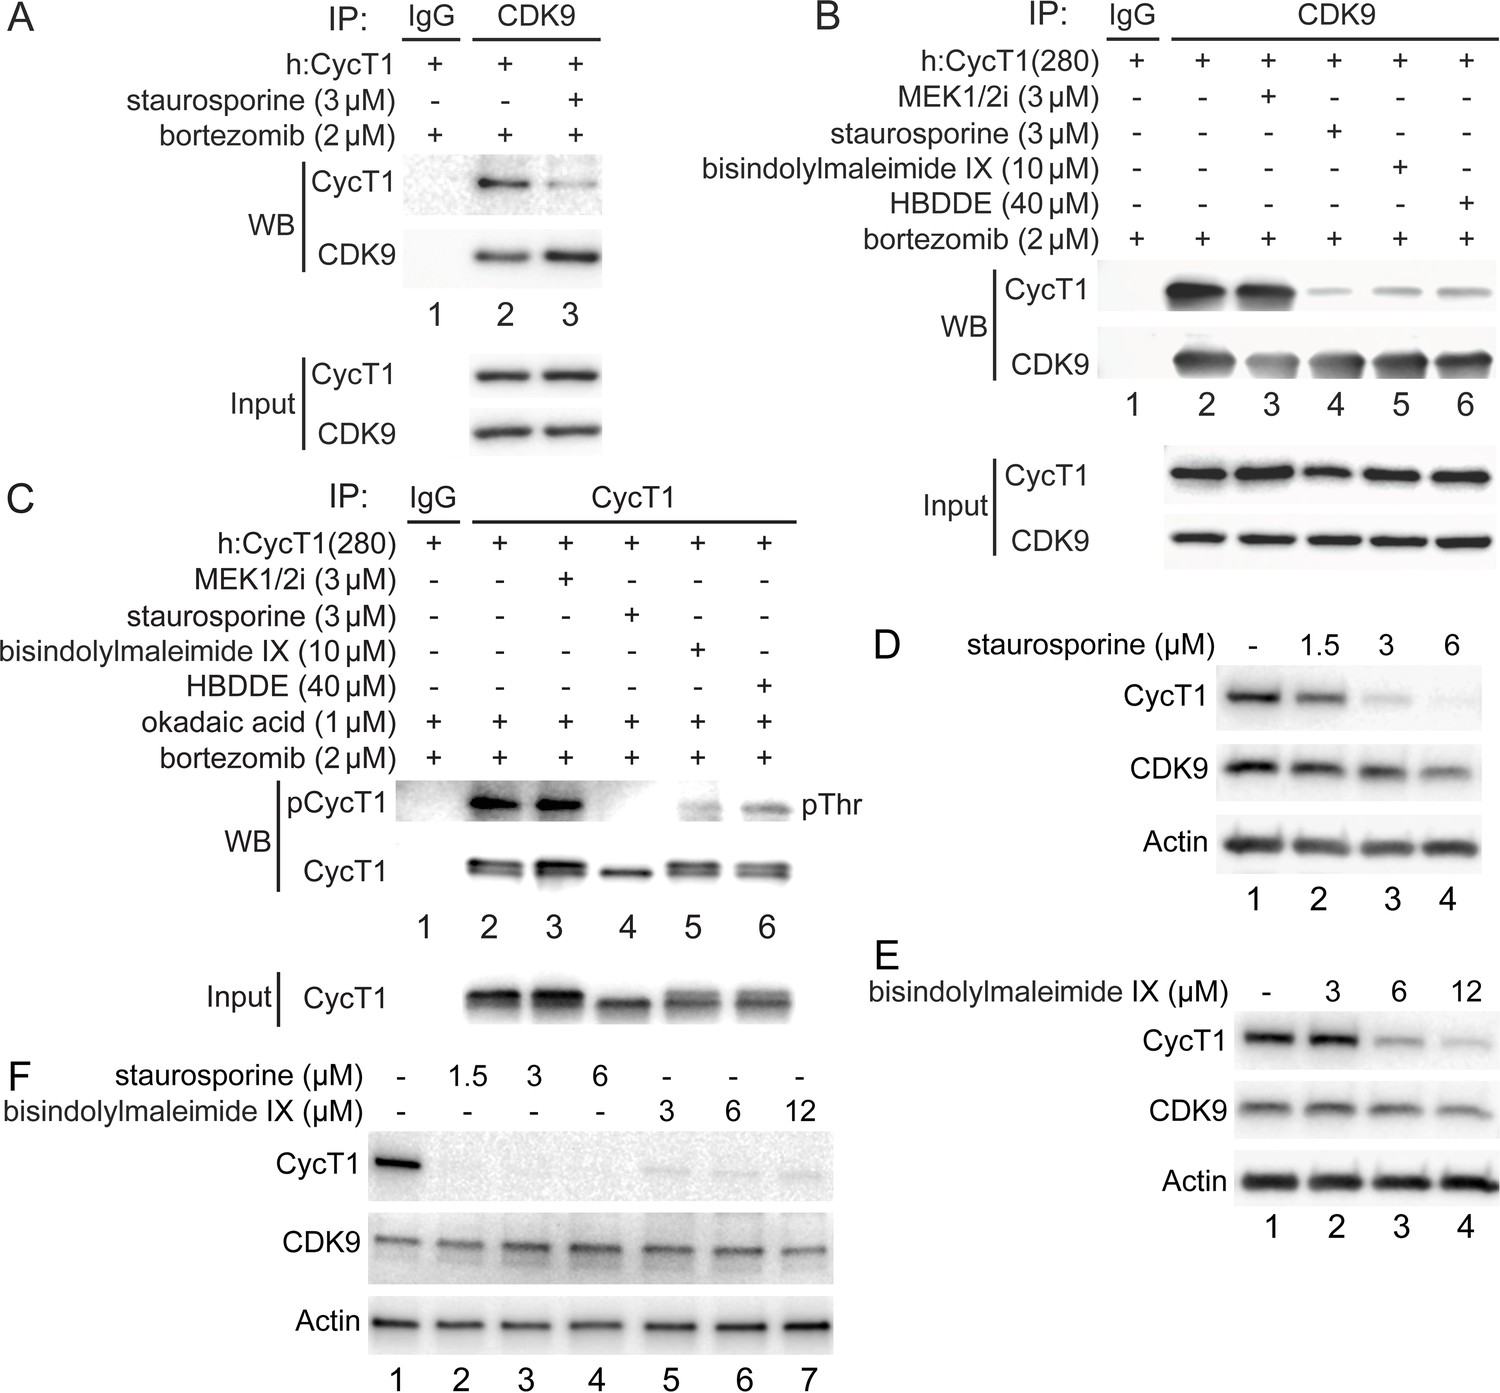
PKC inhibitors impair interactions between CycT1 and CDK9, and promote CycT1 degradation.
(A) PKC inhibitors impair interactions between CycT1 and CDK9. CycT1 and CDK9 were coexpressed in the presence or absence of staurosporine and bortezomib (+/- signs on top) in 293T cells. Co-IPs with CDK9 are presented in panels 1 and 2. Panels 3 and 4 contain input levels of CycT1 and CDK9 proteins. (B) PKC inhibitors impair interactions between CycT1(1–280) and CDK9. CycT1(280) was expressed in the presence or absence of bortezomib and indicated concentration of MEK 1/2i, staurosporine, bisindolylmaleimide IX, or HBDDE (+/- signs on top) in 293T cells. Co-IPs with CDK9 are presented in panels 1 and 2. Panels 3 and 4 contain input levels of CycT1(280) and CDK9 proteins. (C) PKC inhibitors inhibit threonine phosphorylation of CycT1. CycT1(280) was expressed in the presence or absence of bortezomib and indicated concentration of MEK 1/2i, staurosporine, bisindolylmaleimide IX, or HBDDE (+/- signs on top) in 293T cells. IPs with CycT1 are presented in panels 1 and 2. Phosphorylated proteins were visualized with anti-pThr antibodies (panel 1). Panel 3 contains input levels of CycT1(280) proteins. (D) Staurosporine decreases CycT1 levels in a dose-dependent manner. Jurkat cells were untreated (lane 1) or treated with increasing doses of staurosporine (lanes 2–4) for 12 hr before cell lysis. Levels of CycT1 (panel 1), CDK9 (panel 2), and the loading control actin (panel 3) proteins were detected with anti-CycT1, anti-CDK9, and anti-β-actin antibodies, respectively, by western blotting (WB). (E) PKC inhibitor bisindolylmaleimide IX decreases CycT1 levels in a dose-dependent manner. Jurkat cells were untreated (lane 1) or treated with increasing doses of bisindolylmaleimide IX (lanes 2–4) for 12 hr before cell lysis. Levels of CycT1 (panel 1), CDK9 (panel 2), and the loading control actin (panel 3) proteins were detected with anti-CycT1, anti-CDK9, and anti-β-actin antibodies, respectively, by WB. (F) CycT1 levels in activated primary CD4+ T cells are decreased by PKC inhibitors in a dose-dependent manner. Activated primary CD4+ T cells were untreated (lane 1) or treated with increasing amounts of staurosporine (lanes 2–4), bisindolylmaleimide IX (lanes 5–7) for 12 hr before cell lysis. Levels of CycT1 (panel 1), CDK9 (panel 2), and the loading control actin (panel 3) were detected with anti-CycT1, anti-CDK9, and anti-β-actin antibodies, respectively, by WB.
Figure 4—figure supplement 1
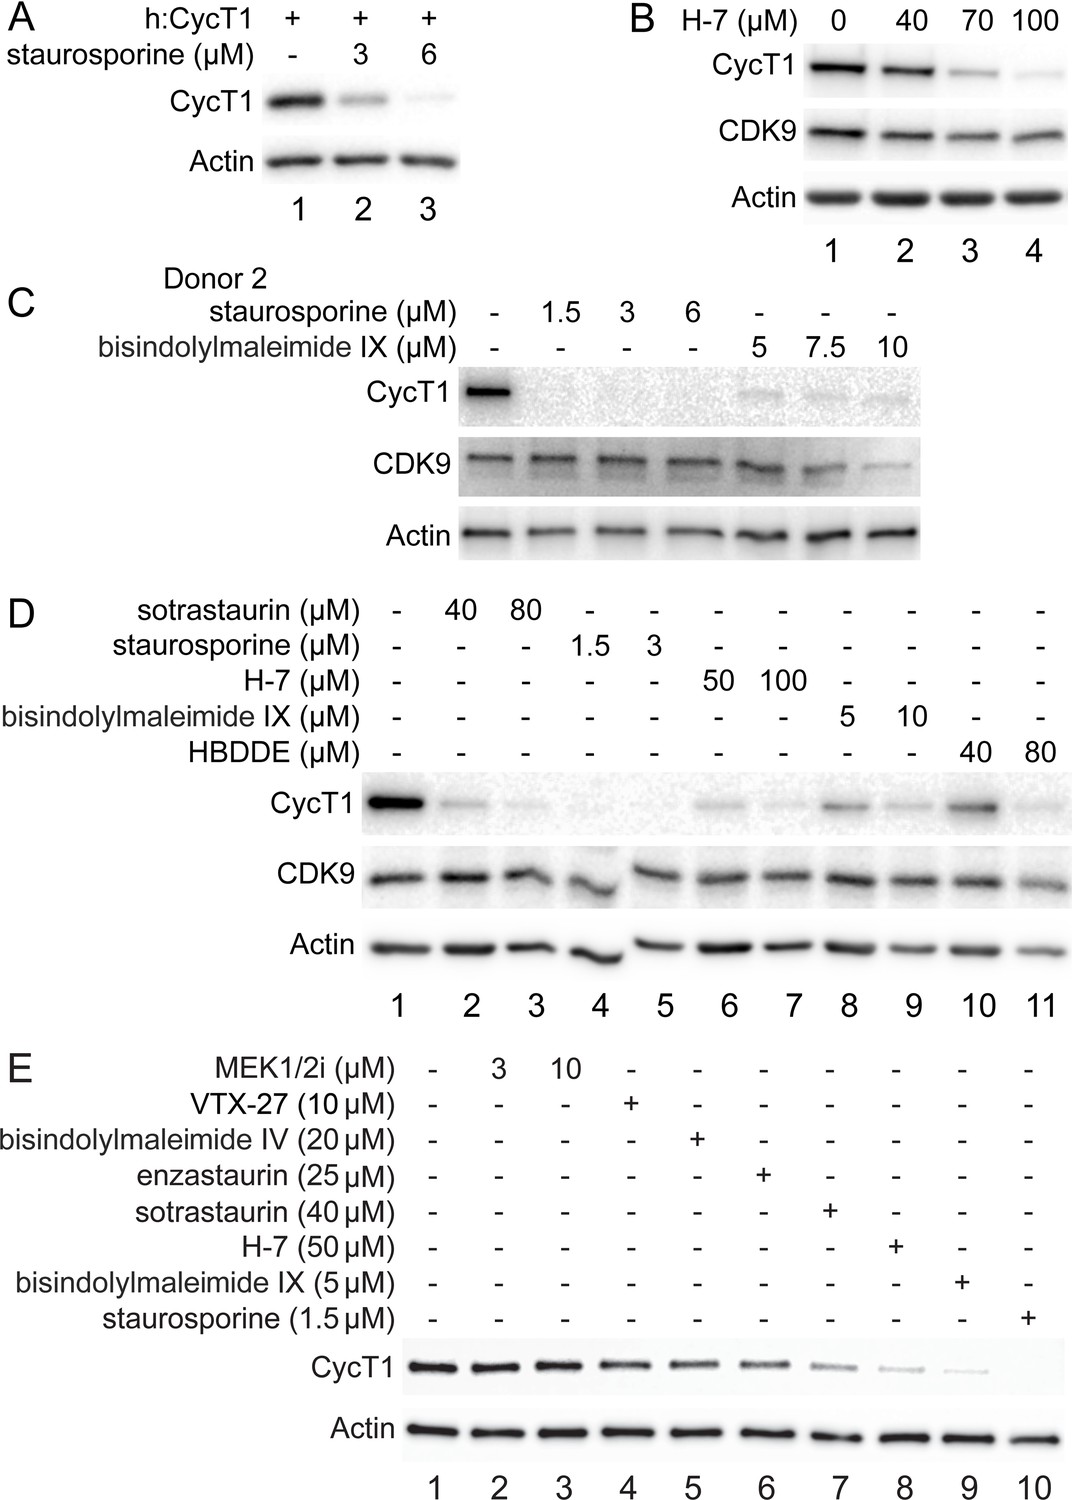
PKC inhibitors promote CycT1 degradation in different cells.
(A) Staurosporine decreases exogenous CycT1 levels in a dose-dependent manner. 293T cells expressing CycT1 were untreated (lane 1) or treated with increasing doses of staurosporine (lanes 2 and 3) for 12 hr before cell lysis. Levels of CycT1 (panel 1) and the loading control actin (panel 2) proteins were detected with anti-HA and anti-β-actin antibodies, respectively, by western blotting (WB). (B) PKC inhibitor H-7 decreases CycT1 levels in a dose-dependent manner. Jurkat cells were untreated (lane 1) or treated with increasing doses of bisindolylmaleimide IX (lanes 2–4) for 12 hr before cell lysis. Levels of CycT1 (panel 1), CDK9 (panel 2), and the loading control actin (panel 3) proteins were detected with anti-CycT1, anti-CDK9, and anti-β-actin antibodies, respectively, by WB. (C) CycT1 levels in activated primary CD4+T cells (donor 2) are decreased by PKC inhibitors in a dose-dependent manner. Activated primary CD4+T cells were untreated (lane 1) or treated with increasing amounts of staurosporine (lanes 2–4), bisindolylmaleimide IX (lanes 5–7) for 12 hr before cell lysis. Levels of CycT1 (panel 1), CDK9 (panel 2), and the loading control actin (panel 3) proteins were detected with anti-CycT1, anti-CDK9, and anti-β-actin antibodies, respectively, by WB. (D) Five different PKC inhibitors decrease levels of CycT1 in activated primary CD4+T cells in a dose-dependent manner. Activated primary CD4+ T cells were untreated (lane 1) or treated with increasing amounts of sotrastaurin (lanes 2 and 3), staurosporine (lanes 4 and 5), H-7 (lanes 6 and 7), bisindolylmaleimide IX (lanes 8 and 9), and HBDDE (lanes 10 and 11) for 12 hr before cell lysis. Levels of CycT1 (panel 1), CDK9 (panel 2), and the loading control actin (panel 3) proteins were detected with anti-CycT1, anti-CDK9, and anti-β-actin antibodies, respectively, by WB. (E) Effects of different PKC or unrelated kinase inhibitors on the expression of CycT1 in activated primary CD4+ T cells. Activated primary CD4+ T cells were untreated (lane 1) or treated with increasing amounts of MEK 1/2i (lanes 2 and 3), and indicated PKC inhibitors VTX-27 (lane 4), bisindolylmaleimide IV (lane 5), enzastaurin (lane 6), sotrastaurin (lane 7), H-7 (lane 8), bisindolylmaleimide IX (lane 9), or staurosporine (lane 10) for 12 hr before cell lysis. Levels of CycT1 (panel 1) and the loading control actin (panel 2) proteins were detected with anti-CycT1 and anti-β-actin antibodies, respectively, by WB.
Figure 5 with 1 supplement
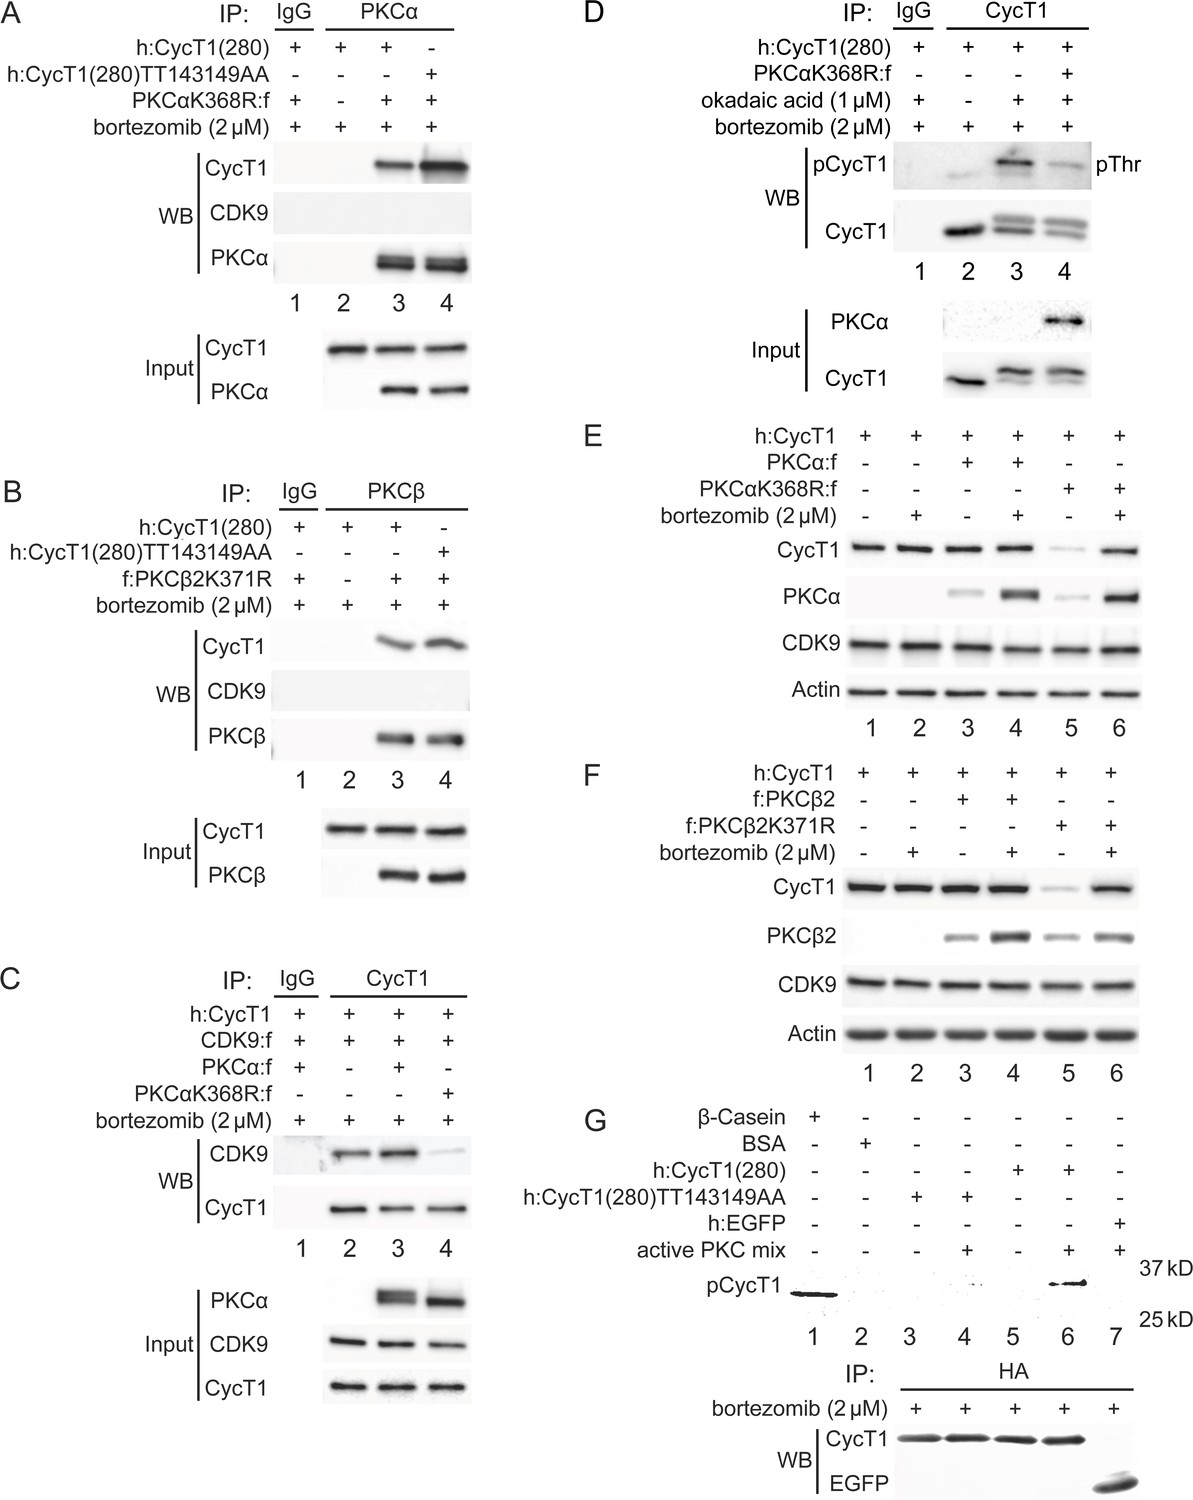
PKCα and PKCβ bind to CycT1 for its phosphorylation, promote interactions between CycT1 and CDK9, and increase the stability of CycT1.
(A) PKCα binds to CycT1(280). Dominant negative mutant PKCαK368R and WT CycT1(280) or mutant CycT1(280)TT143149AA proteins were coexpressed in the presence of bortezomib (+/- signs on top) in 293T cells. Co-IPs with PKCα are presented in panels 1–3. Panels 4 and 5 contain input levels of CycT1(280) and PKCα proteins. (B) PKCβ binds to CycT1(280). Dominant negative mutant PKCβ2K371R and WT CycT1(280) or mutant CycT1(280)TT143149AA proteins were coexpressed in the presence of bortezomib (+/- signs on top) in 293T cells. Co-IPs with PKCβ are presented in panels 1–3. Panels 4 and 5 contain input levels of CycT1(280) and PKCβ proteins. (C) Dominant negative mutant PKCαK368R protein inhibits interactions between CDK9 and CycT1. PKCα or PKCαK368R, CycT1 and CDK9 were coexpressed in the presence of bortezomib (+/- signs on top) in 293T cells. Co-IPs with CycT1 are presented in panels 1 and 2. Panels 3–5 contain input levels of PKCα, CDK9, and CycT1 proteins. (D) PKCαK368R inhibits threonine phosphorylation of CycT1(280). CycT1(280) was expressed with or without PKCαK368R in the presence or absence of okadaic acid and bortezomib (+/- signs on top) in 293T cells. IPs with CycT1 were then probed with anti-pThr antibodies in panel 1 and with anti-HA antibodies in panel 2. Panels 3 and 4 contain input levels of PKCα and CycT1(280) proteins. (E) PKCαK368R decreases levels of CycT1 in cells. PKCα or PKCαK368R, and CycT1 were coexpressed in the presence or absence of bortezomib (+/- signs on top) in 293T cells. Levels of CycT1 (panel 1), PKCα (panel 2), CDK9 (panel 3), and the loading control actin (panel 4) were detected with anti-HA, anti-Flag, anti-CDK9, and anti-β-actin antibodies, respectively, by western blotting (WB). (F) PKCβ2K371R decreases levels of CycT1. PKCβ2 or PKCβ2K371R, and CycT1 were coexpressed in the presence or absence of bortezomib (+/- signs on top) in 293T cells. Levels of CycT1 (panel 1), PKCβ2 (panel 2), CDK9 (panel 3), and the loading control actin (panel 4) were detected with anti-HA, anti-Flag, anti-CDK9, and anti-β-actin antibodies, respectively, by WB. (G) PKCα and PKCβ phosphorylate Thr143 and Thr149 in CycT1 in vitro. WT CycT1(280) and mutant CycT1(280)TT143149AA proteins were expressed in the presence of bortezomib in 293T cells. After IP with anti-HA antibodies, equal levels of WT and mutant CycT1 proteins in IPed samples were detected by WB (panel 2). Immunoprecipitated proteins were incubated with purified constitutively active PKCα and PKCβ proteins for 2 hr and separated by SDS-PAGE, followed by in-gel Phospho-Tag staining. HA-tagged EGFP was used as the negative control for IP. Phosphorylated β-casein protein and unphosphorylated BSA protein represented positive and negative controls for in-gel Phospho-Tag staining, respectively.
Figure 5—figure supplement 1
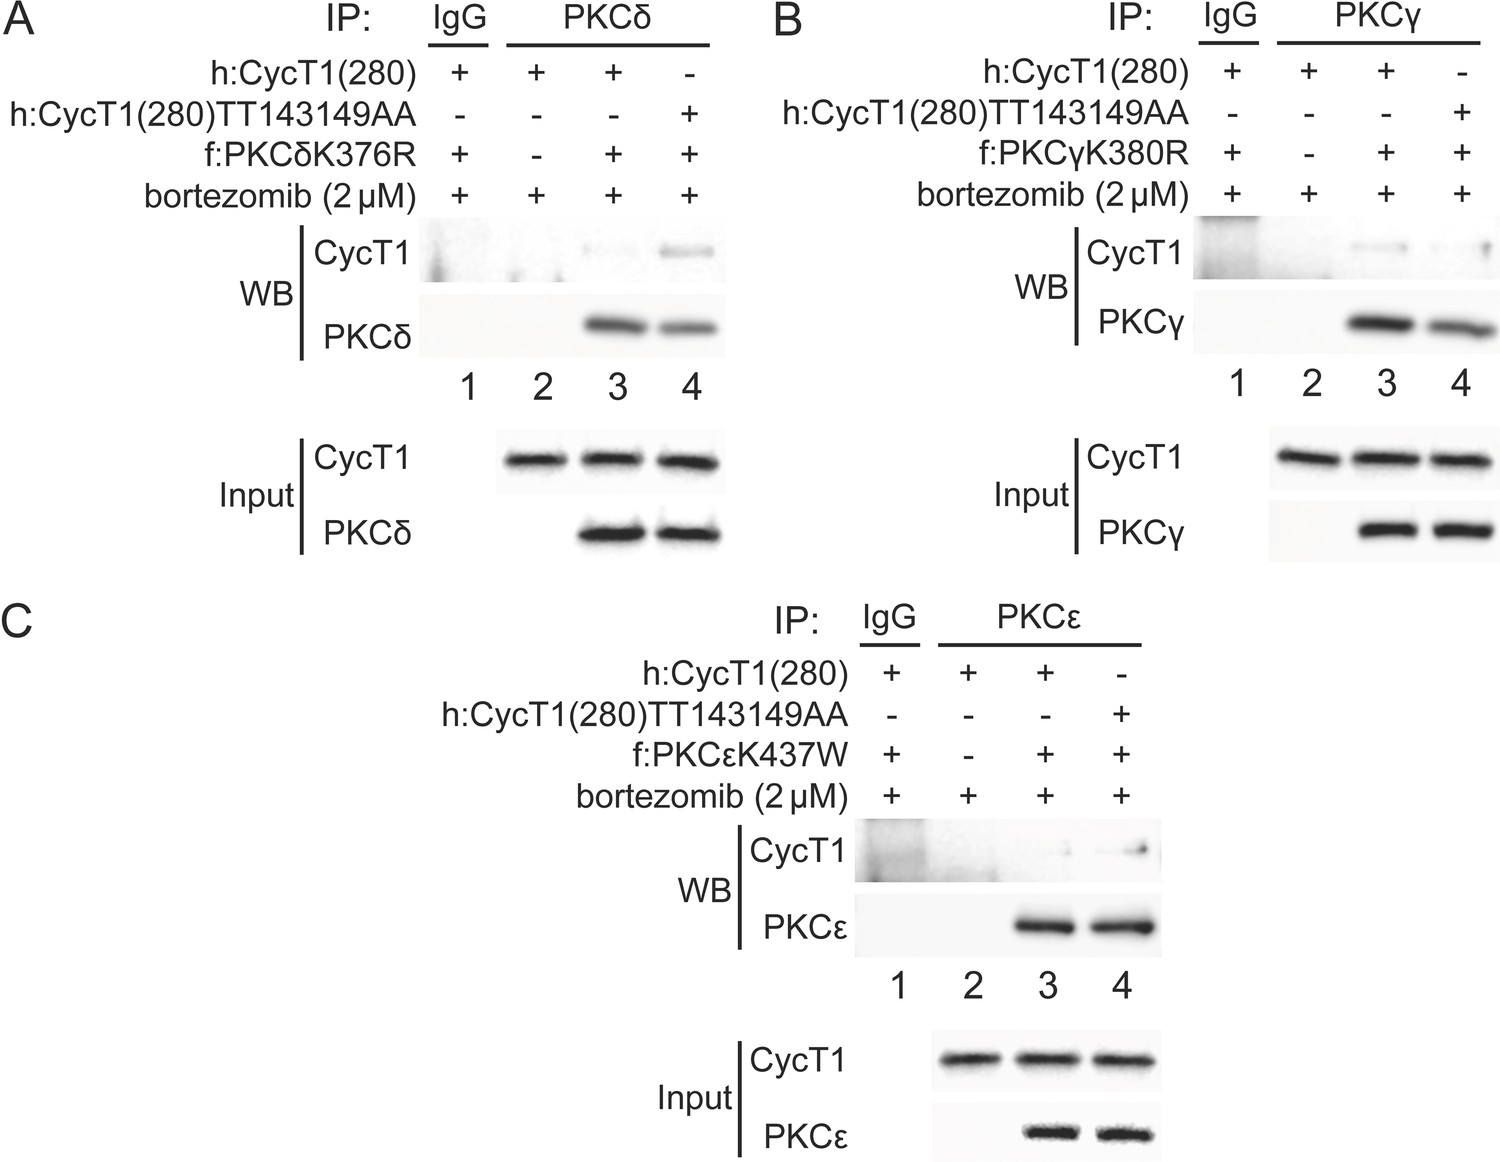
PKCδ, PKCγ, and PKCε bind weakly to CycT1.
(A) PKCδ binds weakly to CycT1(280). Dominant negative mutant PKCδK376R and WT CycT1(280) or mutant CycT1(280)TT143149AA proteins were coexpressed in the presence of bortezomib in 293T cells. Co-IPs with PKCδ are presented in panels 1 and 2. Panels 3 and 4 contain input levels of CycT1(280) and PKCδ proteins. (B) PKCγ binds weakly to CycT1(280). Dominant negative mutant PKCγK380R and WT CycT1(280) or mutant CycT1(280)TT143149AA proteins were coexpressed in the presence of bortezomib in 293T cells. Co-IPs with PKCγ are presented in panels 1 and 2. Panels 3 and 4 contain input levels of CycT1(280) and PKCγ proteins. (C) PKCε binds weakly to CycT1(280). Dominant negative mutant PKCεK437W and WT CycT1(280) or mutant CycT1(280)TT143149AA proteins were coexpressed in the presence of bortezomib in 293T cells. Co-IPs with PKCε are presented in panels 1 and 2. Panels 3 and 4 contain input levels of CycT1(280) and PKCε proteins.
Figure 6 with 1 supplement
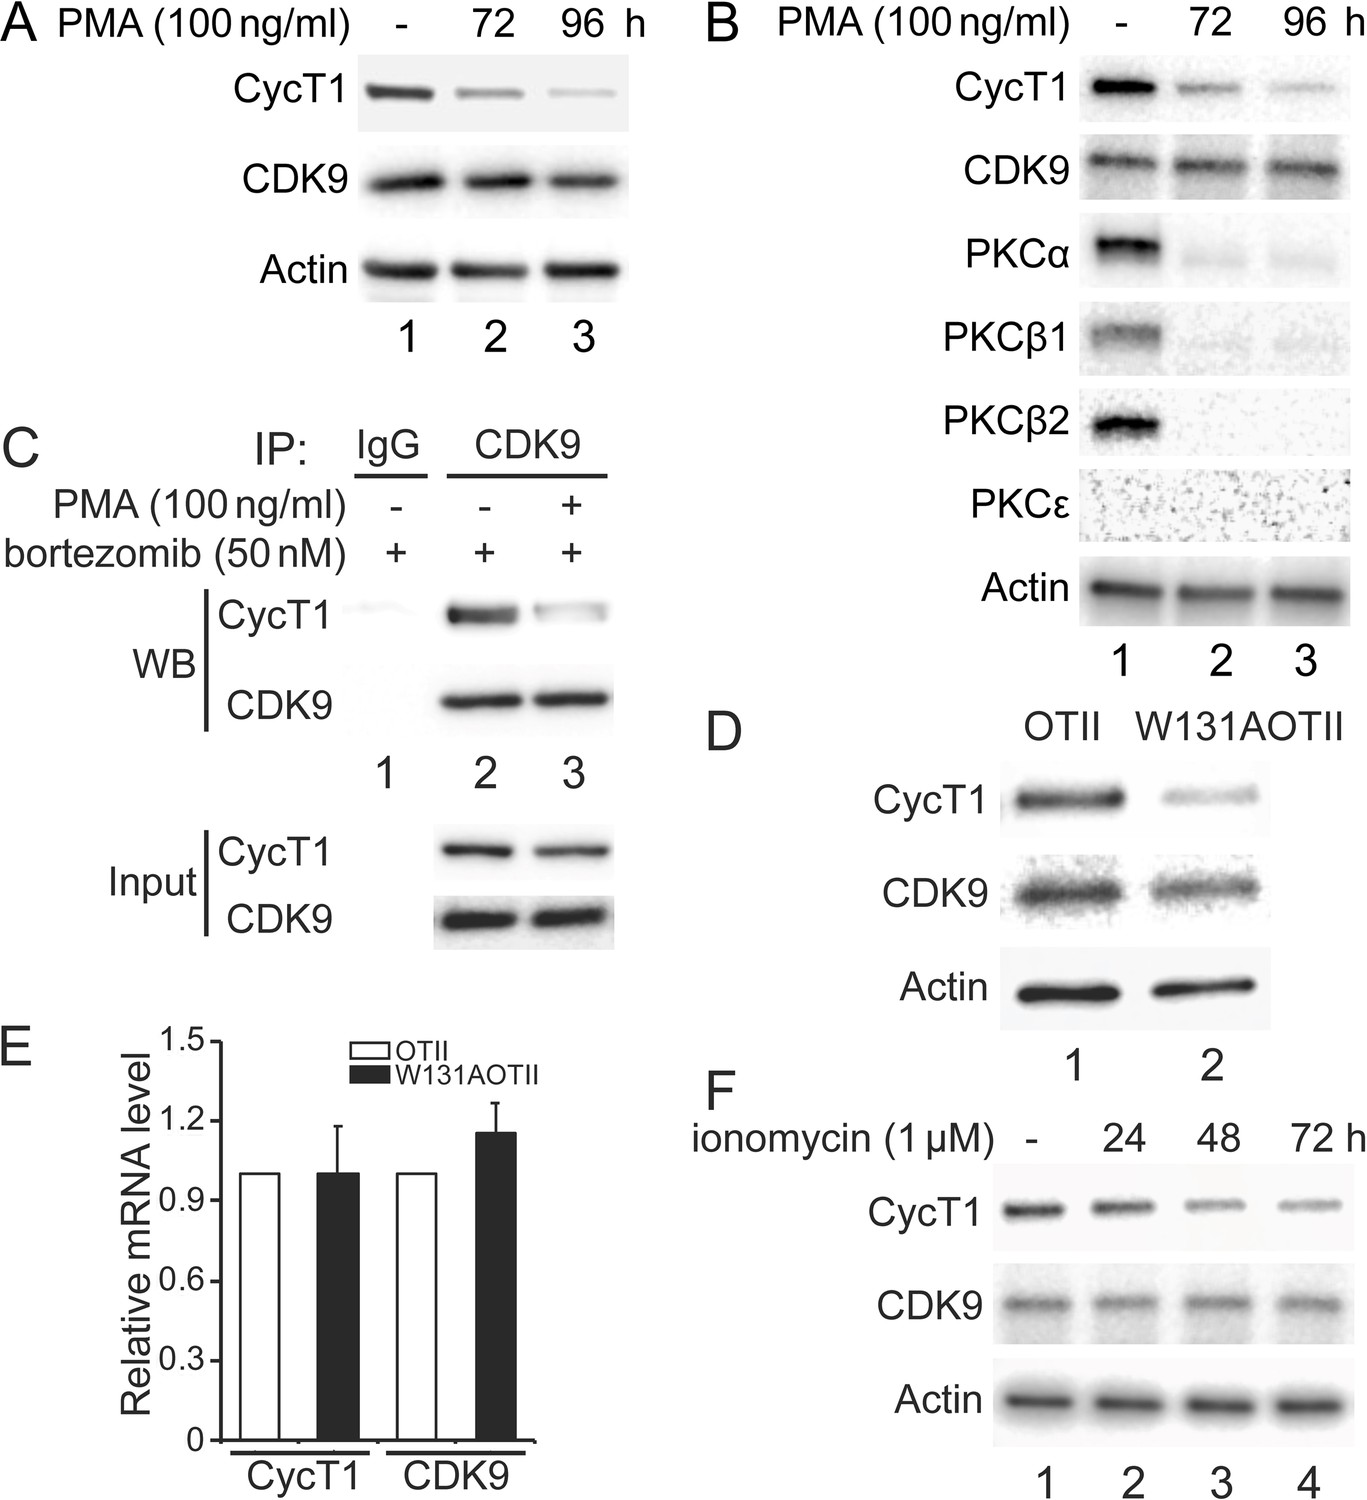
Depletion of PKCs leads to decreased levels of CycT1 in cell lines and primary cells.
(A) Prolonged PMA treatment decreases levels of CycT1 in Jurkat cells. Jurkat cells were untreated (lane 1) or treated with 100 ng/ml PMA for 72 and 96 hr (lanes 2 and 3) before cell lysis. Panels 1 and 2 contain levels of endogenous CycT1 and CDK9 proteins, and panel 3 contains the loading control actin protein. (B) Prolonged PMA treatment decreases levels of CycT1 and PKC in activated primary CD4+ T cells. Activated primary CD4+ T cells were untreated (lane 1) or treated with PMA for 72 and 96 hr (lanes 2 and 3) before cell lysis. Panels 1–6 contain levels of endogenous CycT1, CDK9, PKCα, PKCβ1, PKCβ2, and PKCε proteins. Panel 7 contains the loading control actin protein. (C) Depletion of PKC impairs interactions between CycT1 and CDK9 in activated primary CD4+ T cells. Activated primary CD4+ T cells were treated with or without PMA (+/- signs on top) for 96 hr. At 72 hr, bortezomib was added for additional 24 hr before cell lysis. Co-IPs with CDK9 are presented in panels 1 and 2. Panels 3 and 4 contain input CycT1 and CDK9 proteins. (D) CycT1 levels are decreased in mouse anergic T cells. T cells were selected from WT OTII (WT ZAP70) or mutant W131AOTII (ZAP70W131A) mice and lysed. Panels 1 and 2 contain levels of endogenous CycT1 and CDK9 proteins. Lanes are: lane 1, WT OTII mice; lane 2, mutant W131AOTII mice. Panel 3 contains the loading control actin protein. (E) mRNA levels of CycT1 and CDK9 are equal in mouse WT and anergic T cells. Relative mRNA levels of CycT1 (left two bar graphs) and CDK9 (right two bar graphs) are presented as -fold change in W131AOTII T cells (black bars) above levels of WT OTII T cells (white bars). Error bars represent standard error of average (n = 3). (F) Prolonged ionomycin treatment decreases levels of CycT1 in activated primary CD4+ T cells. Activated primary CD4+ T cells were untreated (lane 1) or treated with 1 μM ionomycin for 24, 48, and 72 hr (lanes 2–4) before cell lysis. Panels 1 and 2 contain levels of endogenous CycT1 and CDK9 proteins. Panel 3 contains the loading control actin protein.
Figure 6—figure supplement 1
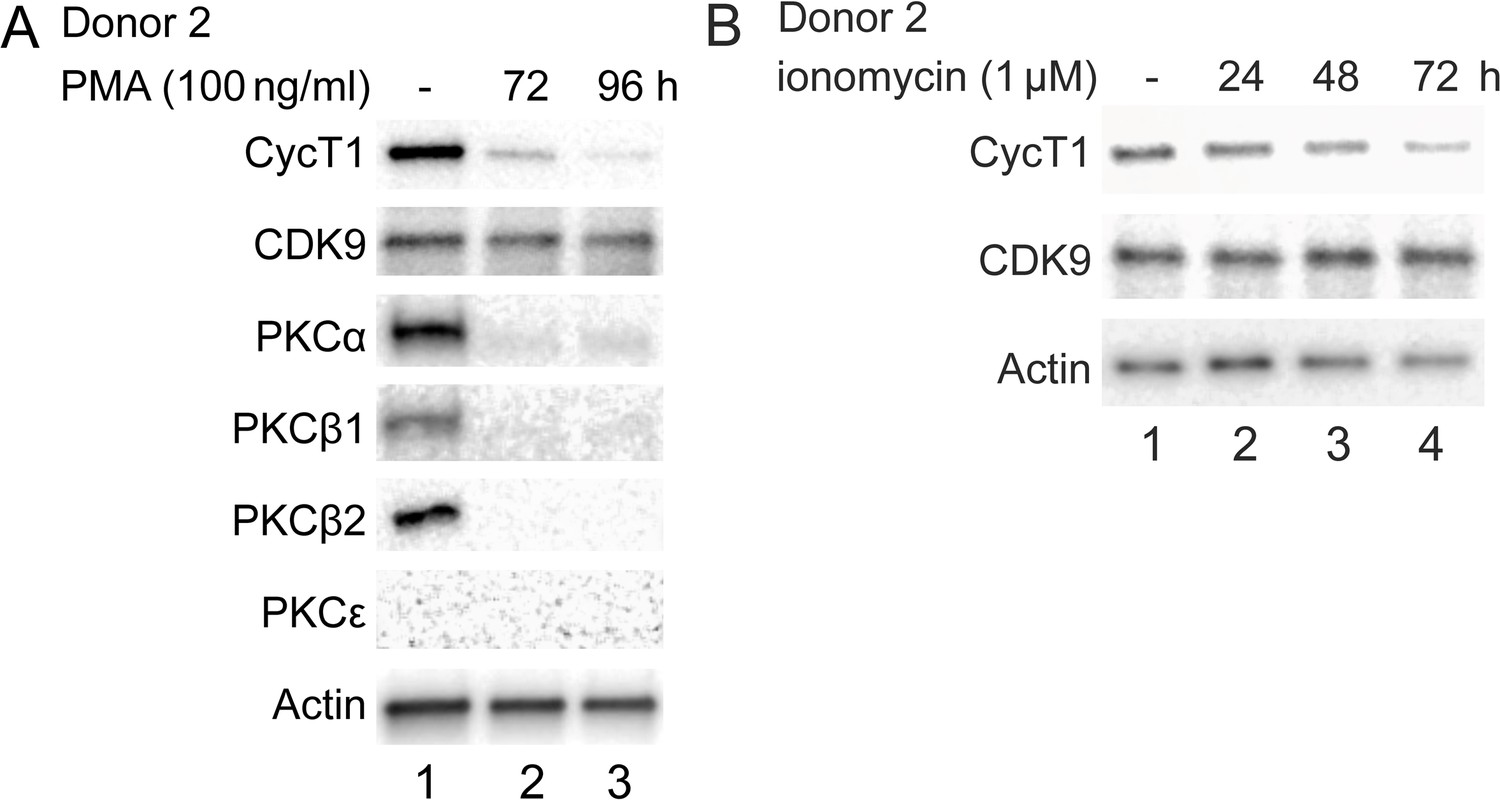
Chronic activation in primary cells decreases levels of endogenous CycT1 protein.
(A) Prolonged PMA treatment decreases levels of CycT1 and PKC in activated primary CD4+ T cells (donor 2). Activated primary CD4+ T cells were untreated (lane 1) or treated with PMA for 72 and 96 hr (lanes 2 and 3) before cell lysis. Panels 1–6 contain levels of endogenous CycT1, CDK9, PKCα, PKCβ1, PKCβ2, and PKCε proteins. Panel 7 contains the loading control actin protein. (B) Prolonged ionomycin treatment decreases levels of CycT1 in activated primary CD4+ T cells (donor 2). Activated primary CD4+ T cells were untreated (lane 1) or treated with ionomycin for 24, 48, and 72 hr (lanes 2–4) before cell lysis. Panels 1 and 2 contain levels of endogenous CycT1 and CDK9 proteins. Panel 3 contains the loading control actin protein.
Tables
Table 1
Summary of binding energies calculated using molecular mechanics/generalized born surface area (MM-GBSA) calculations.
The final binding energies (ΔGbind) are shown in bold. ΔEelec, ΔEwdV, ΔEGB, and ΔEsurf correspond to the electrostatic energy, van der Waals energy, polar solvation energy, and non-polar solvation energy contributions, respectively. Standard deviations of the mean are shown in parenthesis.
| Contribution | WT (kcal/mol) | PThr143 (kcal/mol) | PThr149 (kcal/mol) | PThr143,149 (kcal/mol) |
|---|---|---|---|---|
| ΔGbind | –82.1 (11.4) | –85.0 (13.8) | –81.6 (12.8) | –98.5 (14.3) |
| ΔEelec | –480.8 (62.6) | –849.0 (98.1) | –863.1 (107.9) | –1249.1 (86.1) |
| ΔEwdV | –144.1 (10.8) | –158.1 (12.1) | –151.0 (12.4) | –142.6 (11.4) |
| ΔEGB | 562.9 (62.4) | 944.8 (99.0) | 954.2 (105.5) | 1315.3 (83.5) |
| ΔEsurf | –20.1 (1.6) | –22.7 (1.7) | –21.7 (1.6) | –22.1 (1.7) |
Key resources table
| Reagent type (species) or resource | Designation | Source or reference | Identifiers | Additional information |
|---|---|---|---|---|
| Antibody | CycT1 (E-3) (mouse monoclonal) | Santa Cruz Biotechnology | sc-271348 | WB (1:200) |
| Antibody | CDK9 (F-6) (mouse monoclonal) | Santa Cruz Biotechnology | sc-376646 | WB (1:200);IP 4 μg per test |
| Antibody | PKCα (H-7) (mouse monoclonal) | Santa Cruz Biotechnology | sc-8393 | WB (1:200) |
| Antibody | PKCβ1 (E-3) (mouse monoclonal) | Santa Cruz Biotechnology | sc-8049 | WB (1:200) |
| Antibody | PKCβ2 (F-7) (mouse monoclonal) | Santa Cruz Biotechnology | sc-13149 | WB (1:200) |
| Antibody | PKCε (E-5) (mouse monoclonal) | Santa Cruz Biotechnology | sc-1681 | WB (1:200) |
| Antibody | CDK9 (EPR22956-37) (rabbit polyclonal) | Abcam | ab239364 | WB (1:2000);IP 4 μg per test |
| Antibody | HA (clone HA-7) (mouse monoclonal) | Sigma-Aldrich | H3663 | WB (1:1000);IP 4 μg per test |
| Antibody | Flag (clone M2) (mouse monoclonal) | Sigma-Aldrich | F1804 | WB (1:1000);IP 4 μg per test |
| Antibody | HA (rabbit polyclonal) | Sigma-Aldrich | H6908 | WB (1:1000);IP 4 μg per test |
| Antibody | Flag (rabbit polyclonal) | Sigma-Aldrich | F7425 | WB (1:1000);IP 4 μg per test |
| Antibody | CycT1 (D1B6G) (rabbit monoclonal) | Cell Signaling Technology | 81464S | WB (1:1000) |
| Antibody | β-Actin (13E5) (rabbit monoclonal) | Cell Signaling Technology | 4970S | WB (1:5000) |
| Antibody | Phospho-threonine (42H4) (mouse monoclonal) | Cell Signaling Technology | 9386S | WB (1:500) |
| Antibody | Phosphoserine (rabbit polyclonal) | Abcam | ab9332 | WB (1:500) |
| Antibody | Phospho-tyrosine (P-Tyr-100) (mouse monoclonal) | Cell Signaling Technology | 9411S | WB (1:500) |
| Antibody | Normal rabbit control IgG | Santa Cruz Biotechnology | sc-2027 | IP 4 μg per test |
| Antibody | Normal mouse control IgG | Santa Cruz Biotechnology | sc-2050 | IP 4 μg per test |
| Antibody | Amersham ECL Mouse IgG, HRP-linked whole Ab (from sheep) | Cytiva | NA931 | WB (1:10,000) |
| Antibody | Amersham ECL Rabbit IgG, HRP-linked whole Ab (from donkey) | Cytiva | NA934 | WB (1:10,000) |
| Chemical compound, drug | Bortezomib | Calbiochem | 179324-69-7 | |
| Chemical compound, drug | Okadaic acid | Cell Signaling Technology | 5934S | |
| Chemical compound, drug | Staurosporine | Selleckchem | S1421 | |
| Chemical compound, drug | Sotrastaurin | Selleckchem | S2791 | |
| Chemical compound, drug | Bisindolylmaleimide IX | Selleckchem | S7207 | |
| Chemical compound, drug | HBDDE | Selleckchem | ab141573 | |
| Chemical compound, drug | H-7 | Abcam | ab142308 | |
| Chemical compound, drug | Cycloheximide (CHX) | Sigma-Aldrich | C4859 | |
| Chemical compound, drug | Bisindolylmaleimide IV | Selleckchem | S0754 | |
| Chemical compound, drug | Phorbol 12-myristate 13-acetate (PMA) | Sigma-Aldrich | P8139 | |
| Chemical compound, drug | Ionomycin | Sigma-Aldrich | I9657 | |
| Chemical compound, drug | MEK 1/2 inhibitor (MEK 1/2i) | Calbiochem | 444967 | |
| Chemical compound, drug | Enzastaurin | Selleckchem | S1055 | |
| Chemical compound, drug | VTX-27 | Selleckchem | S0069 | |
| Chemical compound, drug | Calyculin A | Cell Signaling Technology | 9902S | |
| Peptide, recombinant protein | BSA | Invitrogen | AM2616 | |
| Peptide, recombinant protein | β-Casein | Sigma-Aldrich | C6905 | |
| Peptide, recombinant protein | Recombinant human PKCα protein (active) | Abcam | ab55672 | |
| Peptide, recombinant protein | Recombinant human PKCβ1 protein (active) | Abcam | ab60840 |
Additional files
-
Transparent reporting form
- https://cdn.elifesciences.org/articles/68473/elife-68473-transrepform1-v2.docx
-
Source data 1
Source data for figures and figure supplements.
- https://cdn.elifesciences.org/articles/68473/elife-68473-supp1-v2.pdf
Download links
A two-part list of links to download the article, or parts of the article, in various formats.
Downloads (link to download the article as PDF)
Open citations (links to open the citations from this article in various online reference manager services)
Cite this article (links to download the citations from this article in formats compatible with various reference manager tools)
Reversible phosphorylation of cyclin T1 promotes assembly and stability of P-TEFb
eLife 10:e68473.
https://doi.org/10.7554/eLife.68473


