HIF1α is required for NK cell metabolic adaptation during virus infection
- Rheumatology Division, Washington University School of Medicine, United States
- Department of Chemistry, Department of Medicine, Washington University, United States
- Department of Biomedical Research, Center for Genes, Environment and Health, National Jewish Health, United States
Figures
Figure 1 with 1 supplement
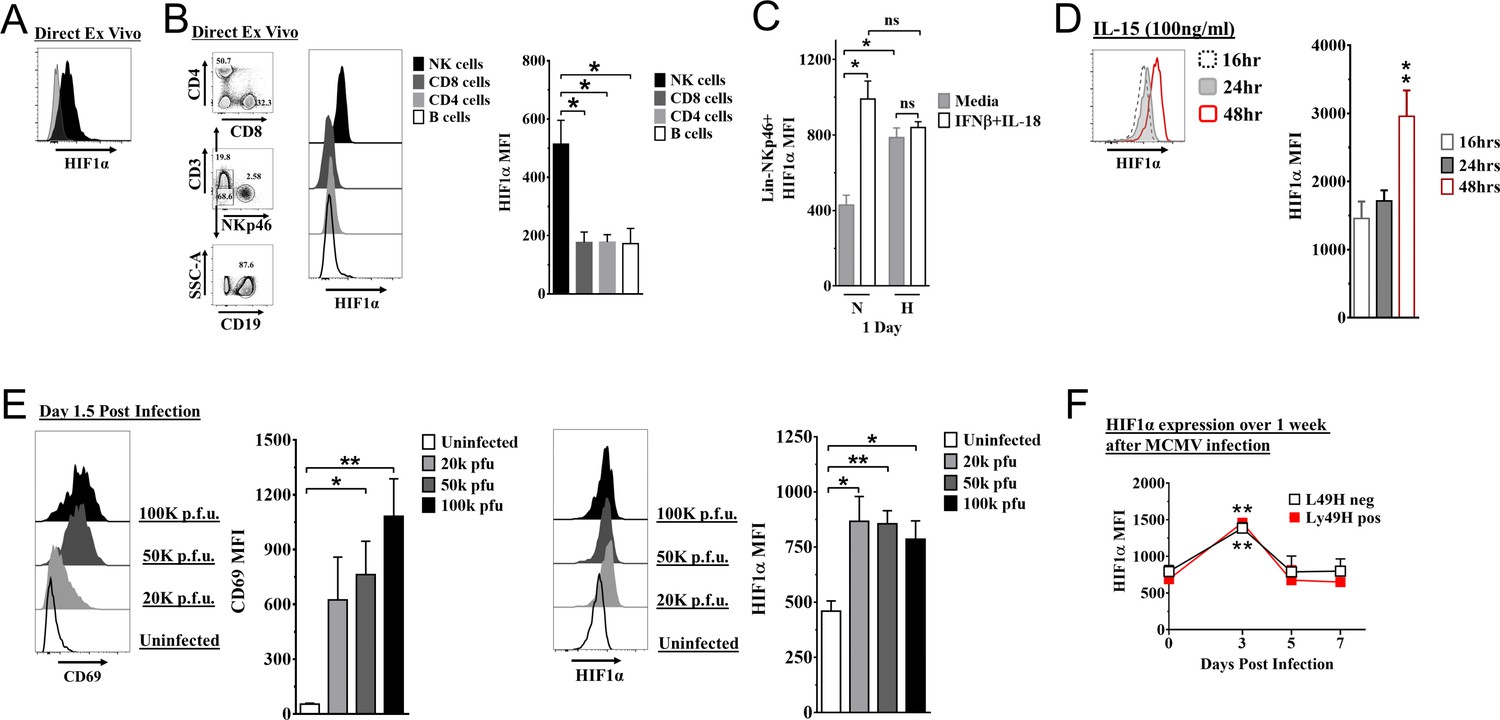
Hypoxia-inducible factor-1α (HIF1α) expression in natural killer (NK) cells.
(A) HIF1α protein expression in splenic NK cells (black) ex vivo compared to FMO control (gray) by flow cytometry. Representative experiment of two independent experiments. (B) Comparison of lymphocytes HIF1α protein expression. Bar graphs show data from two independent experiments with four mice per group. (C) Spleens from C57BL/6 mice were prepared as in Materials and methods and were stimulated with IFNβ (200 units) + IL-18 (50 ηg/ml) for 24 hr in normoxia (N, 20%) or hypoxia (H, 1%). HIF1α expression in NK cells was determined. Data are from two independent experiments with three mice per group. (D) Splenic NK cells were cultured in 25 ηg/ml IL-15 for 48 hr and HIF1α expression was measured at 16, 24, and 48 hr. Data are from two independent experiments with four mice per group. (E) CD69 and HIF1α was determined at day 1.5 post-infection (pi). Data are from 2–3 independent experiments with three mice per group. Statistical significance for uninfected versus indicated dose. (F) HIF1α expression in Ly49H+ or Ly49H- NK cells over 7 days from C57BL/6 mice that were infected with 50K plaque forming unit (pfu) murine cytomegalovirus (MCMV). Statistical significance for d0 versus indicated day. Data are from two independent experiments with 3–7 mice per group. All data depict mean ± SEM, with each data set containing data indicated number of mice per group from independent experiments. Unpaired t-test was performed (A, B, D–F) or one-way ANOVA (C). Statistical significance indicated by n.s., no significant difference; *p<0.05; **p<0.01; ***p<0.001; ****p<0.0001.
Figure 1—figure supplement 1
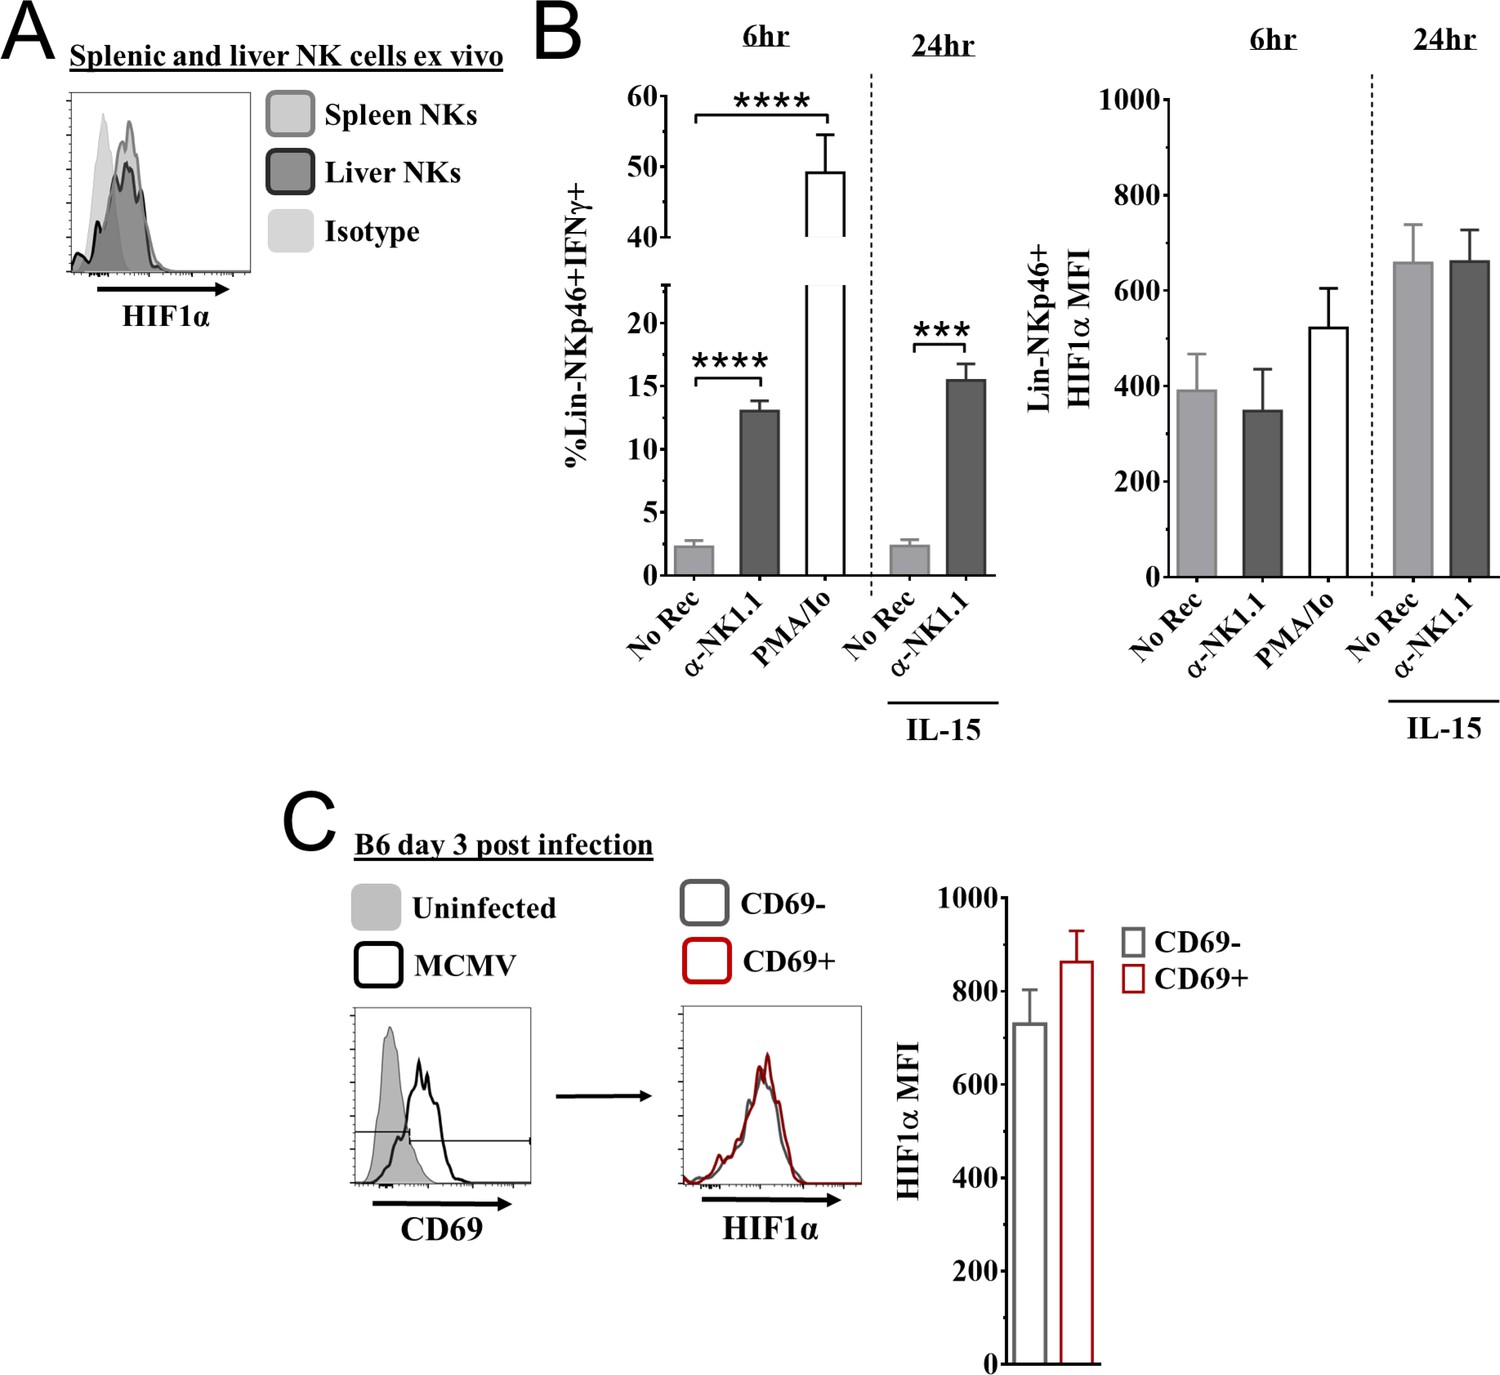
Expression of hypoxia-inducible factor-1α (HIF1α) in natural killer (NK) cells.
(A) Representative histogram of HIF1α expression in splenic and liver NK cells direct ex vivo. Data are from two independent experiments from five mice per group. (B) Splenocytes from C57BL/6 mice stimulated for 6 hr with either anti-NK1.1, PMA and ionomycin (PMA/Io), or no receptor stimulation (No Rec). For 24 hr culture, splenic NK cells were stimulated with anti-NK1.1, or no receptor stimulation (No Rec) in the presence of low IL-15. IFNγ (left) and HIF1α (right) expression was measured in splenic NK cells. Data are from 2–3 independent experiments with 3–5 mice per group. (C) CD69 expression of splenic NK cells 3 days post murine cytomegalovirus (MCMV) infection, and HIF1α expression in CD69- and CD69+ NK cells (left) with quantification (right). Data are from three independent experiments with six mice per group. Data depict mean ± SEM, with each data set containing data indicated number of mice per group from independent experiments. Statistical significance indicated by n.s., no significant difference, *p<0.05, **p<0.01, ***p<0.001, ****p<0.0001.
Figure 2 with 1 supplement
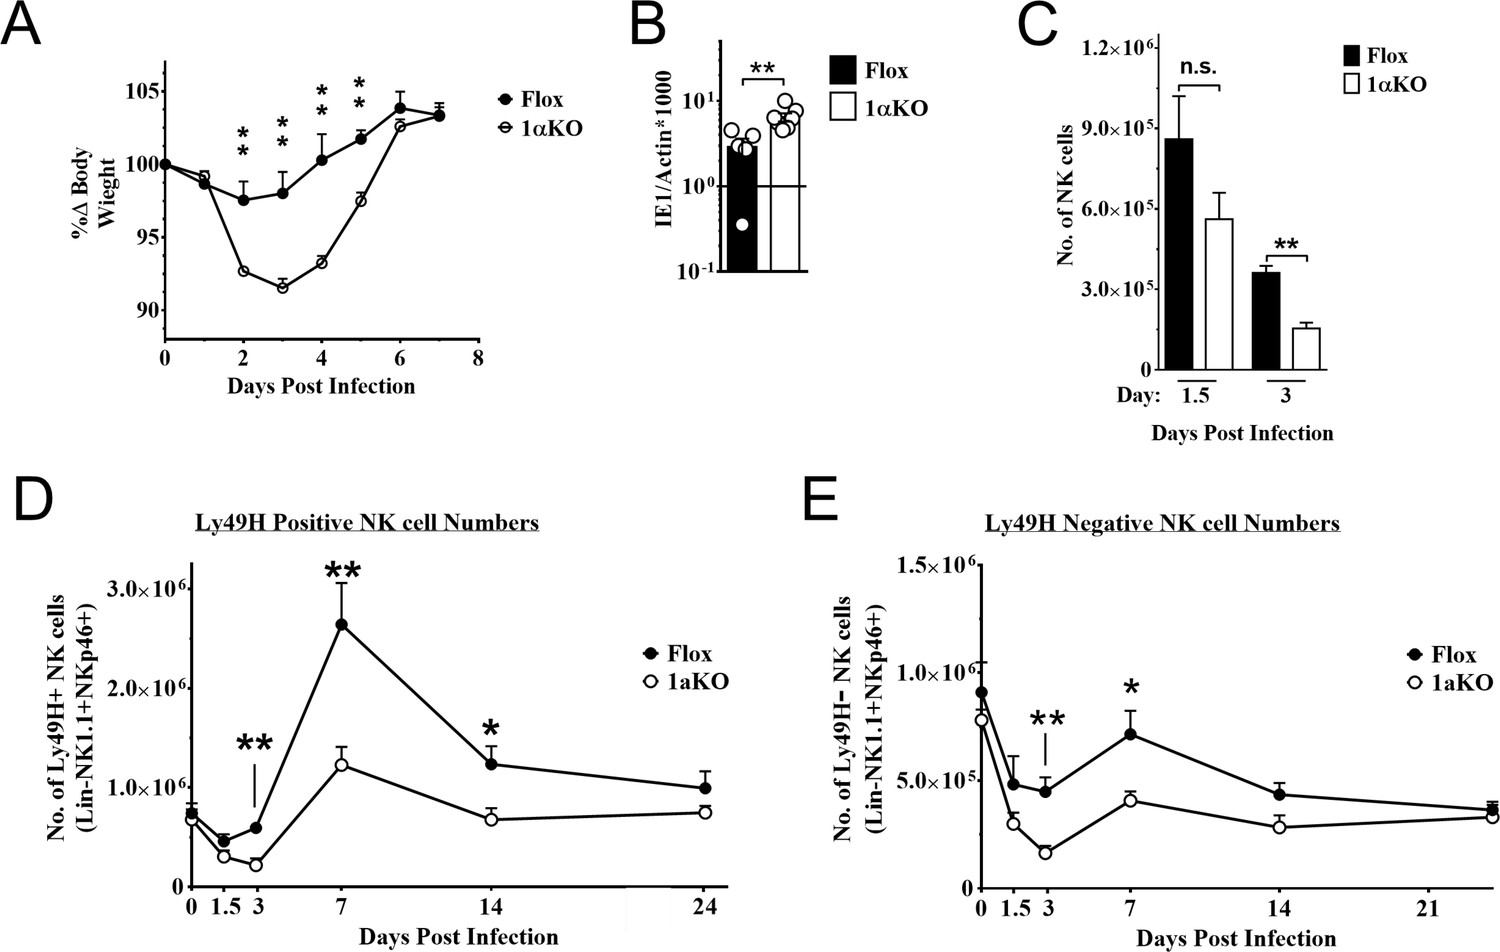
Natural killer (NK) cells require hypoxia-inducible factor-1α (HIF1α) for an optimal response to virus infection.
(A) 1αKO or FL control mice were infected with 50K plaque forming unit (pfu) then monitored for weight loss over 7 days. Each data represents four mice from two independent experiments. (B) Splenic viral load in 1αKO or FL control mice were infected with 50K pfu then spleens harvested day 5 post-infection (pi). Data are pooled from four biologically independent experiments with a total of 5–7 mice in the indicated groups. (C) Number of bulk NK cells was quantified at days 1.5 and 3 pi from 1αKO or FL control mice. Data are from 2–3 independent experiments with 4–6 mice per group. (D) 1αKO or FL control mice were infected with 50K pfu and Ly49H+ NK cell expansion was determined at days 1.5, 3, 7, 14, and 24 pi. Data are from three independent experiments with 4–9 mice per group. (E) Quantification of 1αKO or Flox Ly49H- NK cells at days 1.5, 3, 7, 14, and 24 post murine cytomegalovirus (MCMV) infection. Data are from 3–4 independent experiments with 3–4 mice per group. Data depict mean ± SEM, with each data set containing data indicated number of mice per group from independent experiments. Unpaired t-test was performed on (A–D). Statistical significance indicated by n.s., no significant difference; *p<0.05; **p<0.01; ***p<0.001; ****p<0.0001.
Figure 2—figure supplement 1
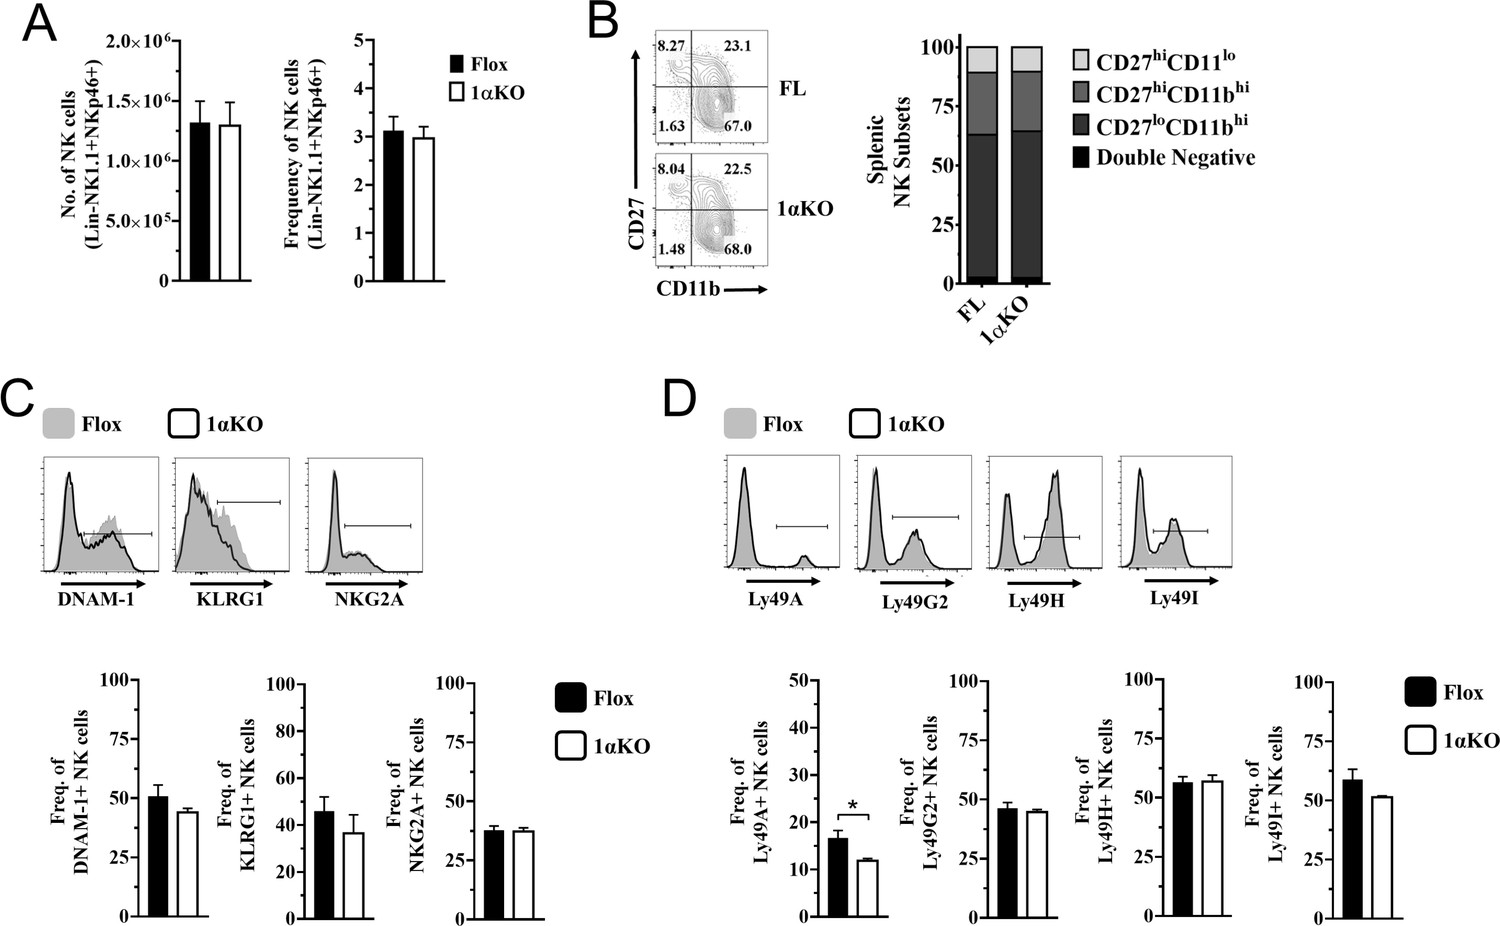
Normal development in hypoxia-inducible factor-1α (HIF1α) KO natural killer (NK) cells.
(A) Quantification of NK cells absolute numbers (left) and frequencies (right) of NK cells in Flox controls and 1αKO direct ex vivo. Data are from three independent experiments with 6–9 mice per group. (B) Representative contour plot (left) and quantification (right) of CD27 and CD11b maturation markers direct ex vivo in Flox controls and 1αKO NK cells. Data are from two independent experiments with three mice per group. (C) Representative histograms (top) and frequencies (bottom) of DNAM-1, KLRG1, and NKG2A on NK cells of 1αKO or FL control mice. Data are from 2–3 independent experiments with 3–7 mice per group. (D) Representative histograms (top) and frequencies (bottom) of Ly49A, Ly49G2, Ly49H, and Ly49I. Data are from 2–3 independent experiments with 3–7 mice per group. Data depict mean ± SEM, with each data set containing data indicated number of mice per group from independent experiments. Statistical significance indicated by n.s., no significant difference, *p<0.05, **p<0.01, ***p<0.001, ****p<0.0001.
Figure 3 with 1 supplement
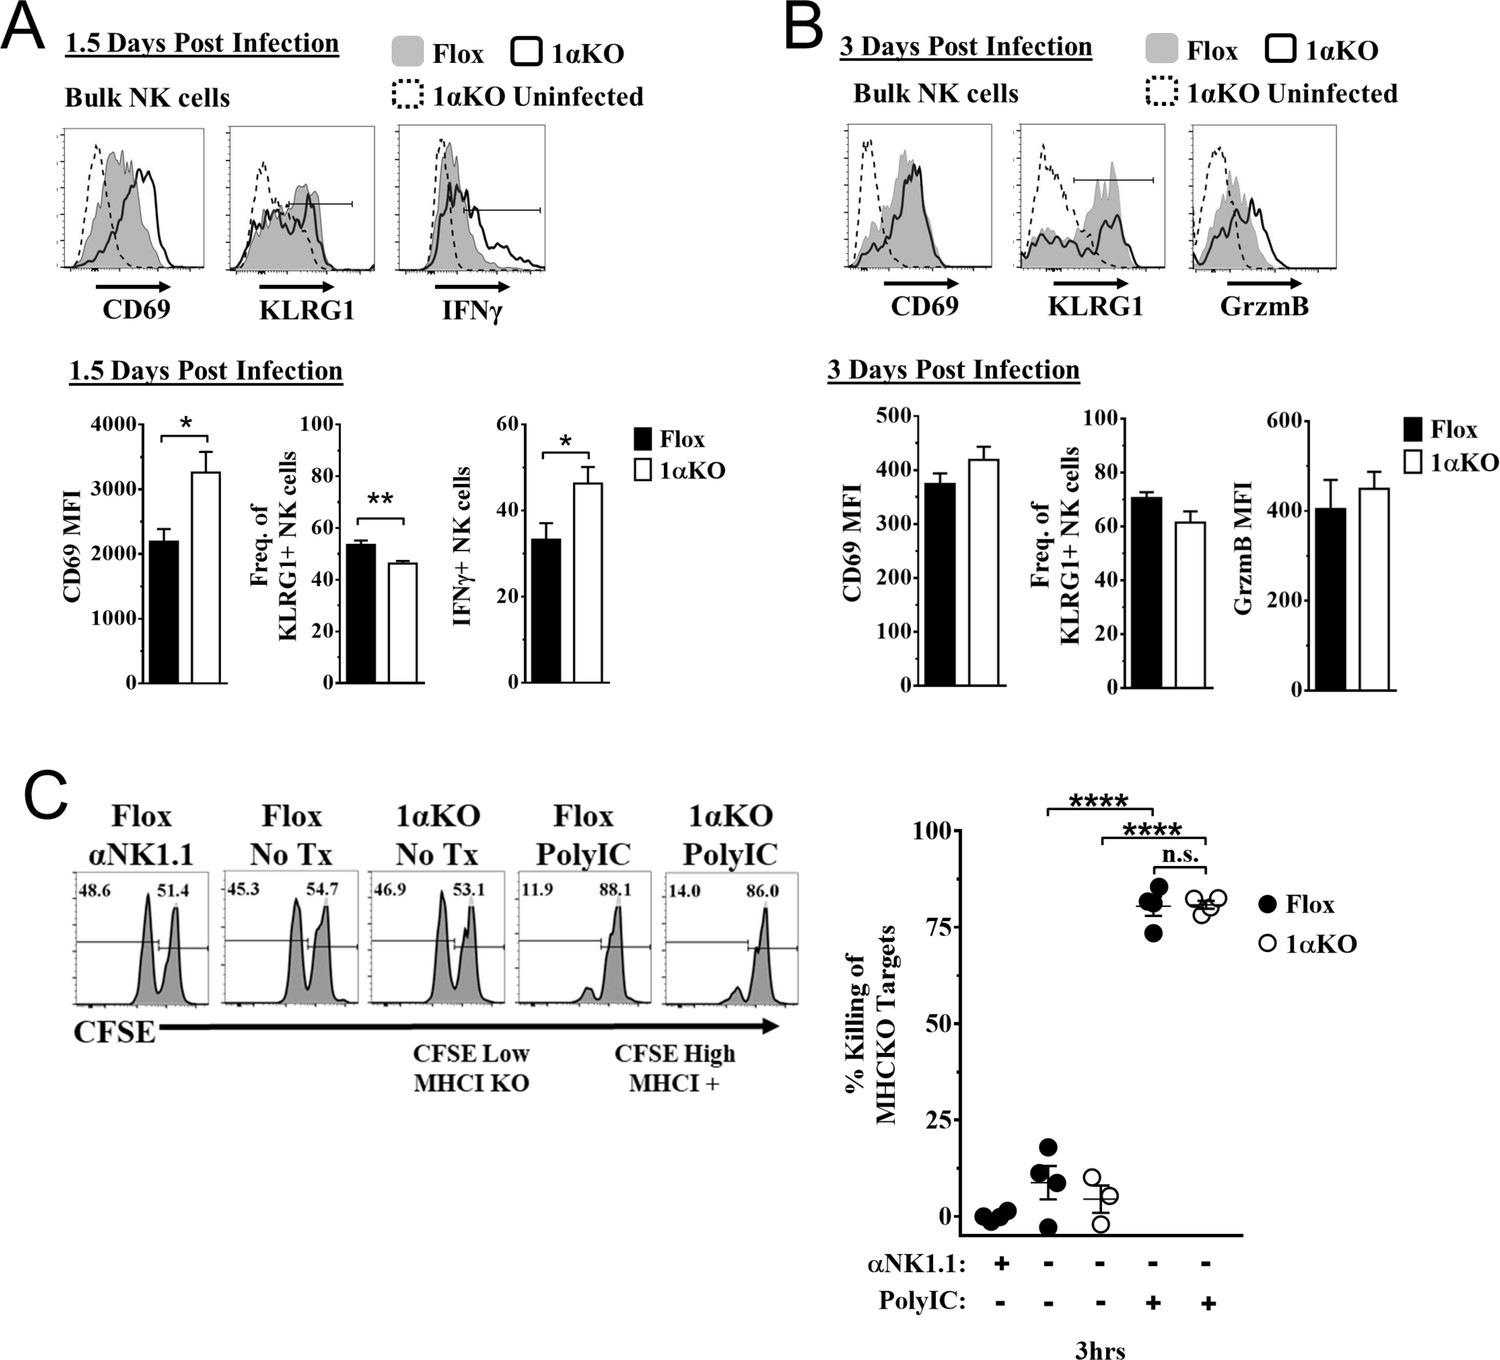
Hypoxia-inducible factor-1α (HIF1α) is dispensable for natural killer (NK) cell effector function.
(A) Representative histograms (top) and quantification (bottom) of CD69 MFI on NK cells and frequency of KLRG1+ and IFNγ+ NK cells at day 1.5 post-infection (pi) of 1αKO or FL control mice. Data are from 2–3 independent experiments with 4–6 mice per group. (B) Representative histograms (top) and quantification (bottom) of CD69 and Granzyme B MFI (GrzmB) of NK cells, and frequency of KLRG1+ NK cells at day 3 pi. Data are from two independent experiments with four mice per group. (C) 1αKO or FL control mice were injected with PBS or Poly (I:C) then 3 days later 20 × 106 splenocytes at 1:1 ratio of CFSE-labeled MHCI-sufficient (CFSEHigh) and -deficient (CFSELow) were intravenously transferred into mice. MHC-deficient splenocyte elimination was measured 3 hr post-transfer by flow cytometry. Data are from three independent experiments with 3–4 mice per group. Data depict mean ± SEM, with each data set containing data indicated number of mice per group from independent experiments. Unpaired t-test was performed on (A, B) or one-way ANOVA (C). Statistical significance indicated by n.s., no significant difference; *p<0.05; **p<0.01; ***p<0.001; ****p<0.0001.
Figure 3—figure supplement 1
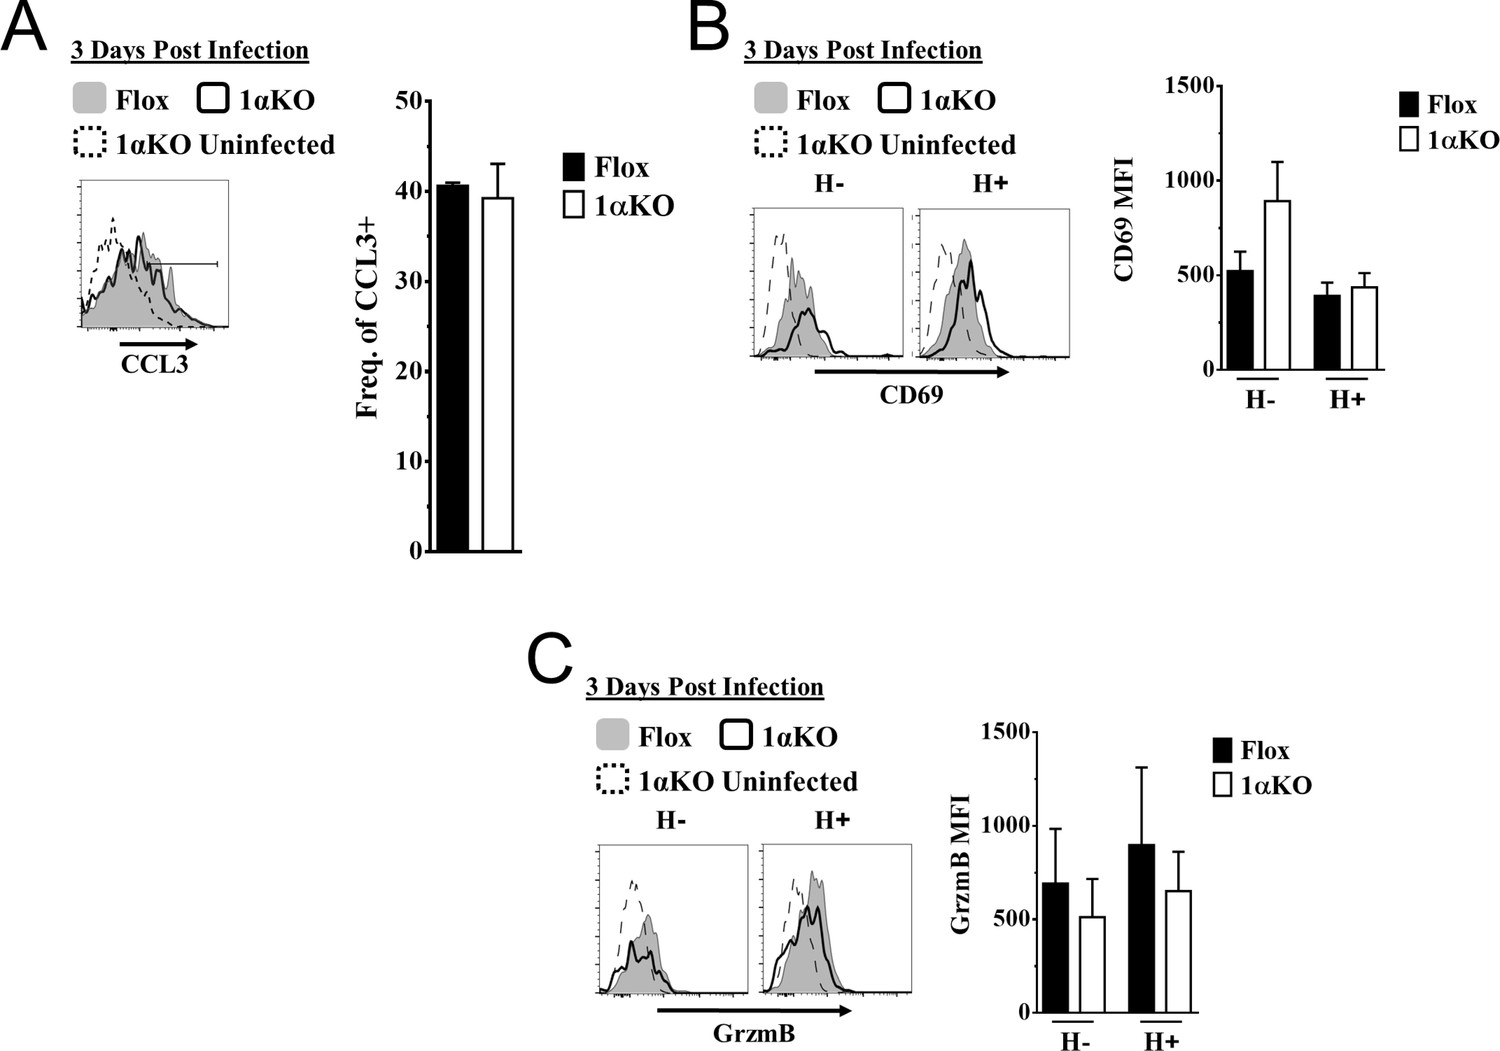
Ly49H + and Ly49H- hypoxia-inducible factor-1α (HIF1α) KO natural killer (NK) cells have similar activation compared to Flox controls.
(A–C) 1αKO or Flox mice infected with murine cytomegalovirus (MCMV) received a dose of 50K plaque forming unit (pfu) and analyzed as indicated. (A) Histogram (left) and quantification of frequency (right) represent CCL3 expression in NK cells at day 3 post MCMV infection. Data are from two independent experiments with four mice per group. (B) Histograms (left) and quantification of (right) of CD69 MFI on Ly49H+ and Ly49H- NK cells at day 3 post MCMV infection. Data are from two independent experiments with three mice per group. (C) Representative histograms (left) and quantification of MFI (right) of Granzyme B (GrzmB) expression in Ly49H+ and Ly49H- NK cells at day 3 post MCMV infection. Data are from two independent experiments with three mice per group. Data depict mean ± SEM, with each data set containing data indicated number of mice per group from independent experiments. Statistical significance indicated by n.s., no significant difference, *p<0.05, **p<0.01, ***p<0.001, ****p<0.0001.
Figure 4 with 1 supplement
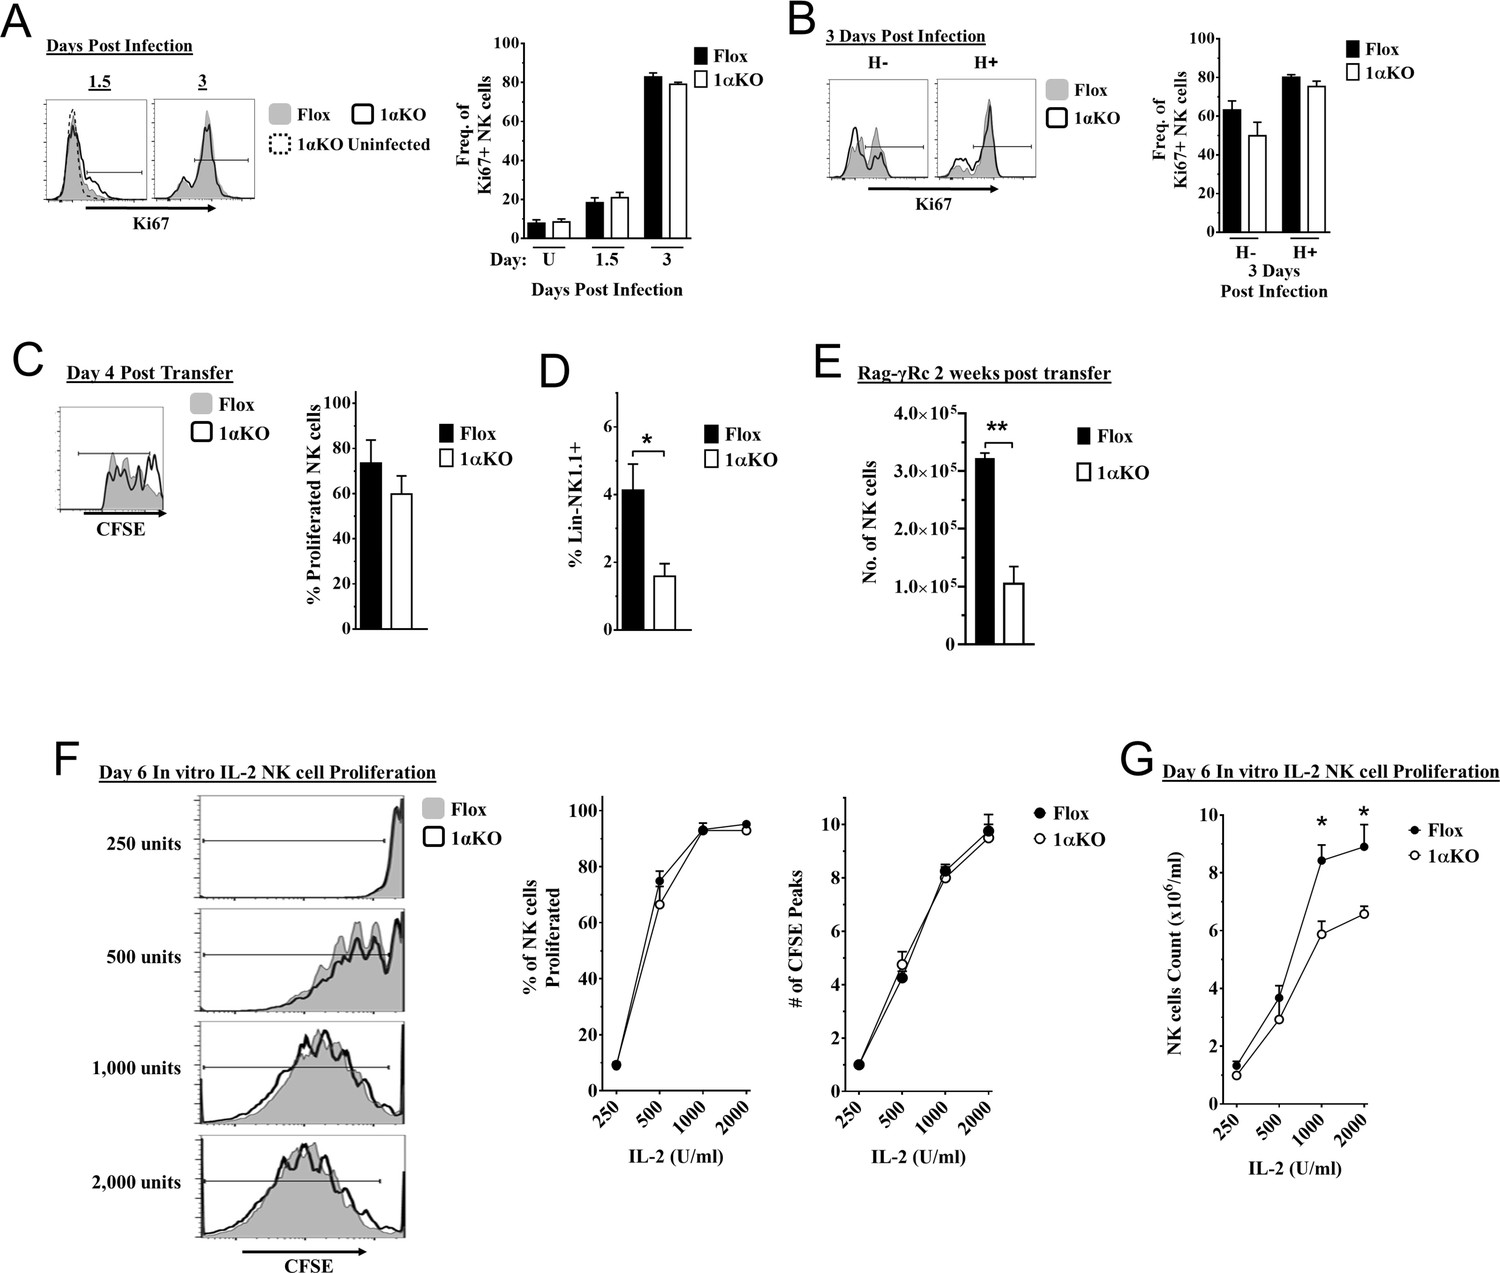
Cell division in hypoxia-inducible factor-1α (HIF1α) KO natural killer (NK) cells is normal but numbers are reduced.
(A, B) 1αKO or FL control mice infected with murine cytomegalovirus (MCMV) received a dose of 50K plaque forming unit (pfu) and analyzed as indicated. (A) Ki67 expression with representative histograms (left) and frequency quantification (right) in 1αKO or FL control bulk NK cells at day 1.5 and day 3 post-infection (pi). Data are from three independent experiments with 5–7 mice per group. (B) Expression of Ki67 in Ly49H negative and positive NK cells shown in histogram (left) and frequencies quantified (right). Data are from two independent experiments with three mice per group. (C, D) Rag-γRc mice analyzed for CFSE + splenic NK cells from 1αKO or FL control mice 4 days post transfer, showing representative histogram (C, left) and quantification of total proliferation (C, right), and frequencies (D). Data are from two independent experiments with four mice per group. (E) Rag-γRc mice analyzed on day 14 since post splenocyte transfer for numbers of NK cells in the spleen from 1αKO or FL control mice. Data are from two independent experiments with three mice per group. (F, G) In vitro proliferation assays were done using human recombinant IL-2 at different concentrations and time points indicated below. (F) Representative histograms (left), quantification of total proliferated cells (middle), and number of CFSE peaks (right) of CFSE labeled NK cells from 1αKO or FL control mice stimulated with different concentrations of IL-2 for 6 days. (G) Numbers of NK cells were counted from (F) and graphed in cells per 1 ml. Data are from two independent experiments with four mice per group. Data depict mean ± SEM, with each data set containing data indicated number of mice per group from independent experiments. Unpaired t-test was performed on (A–G). Statistical significance indicated by n.s., no significant difference; *p<0.05; **p<0.01; ***p<0.001; ****p<0.0001.
Figure 4—figure supplement 1
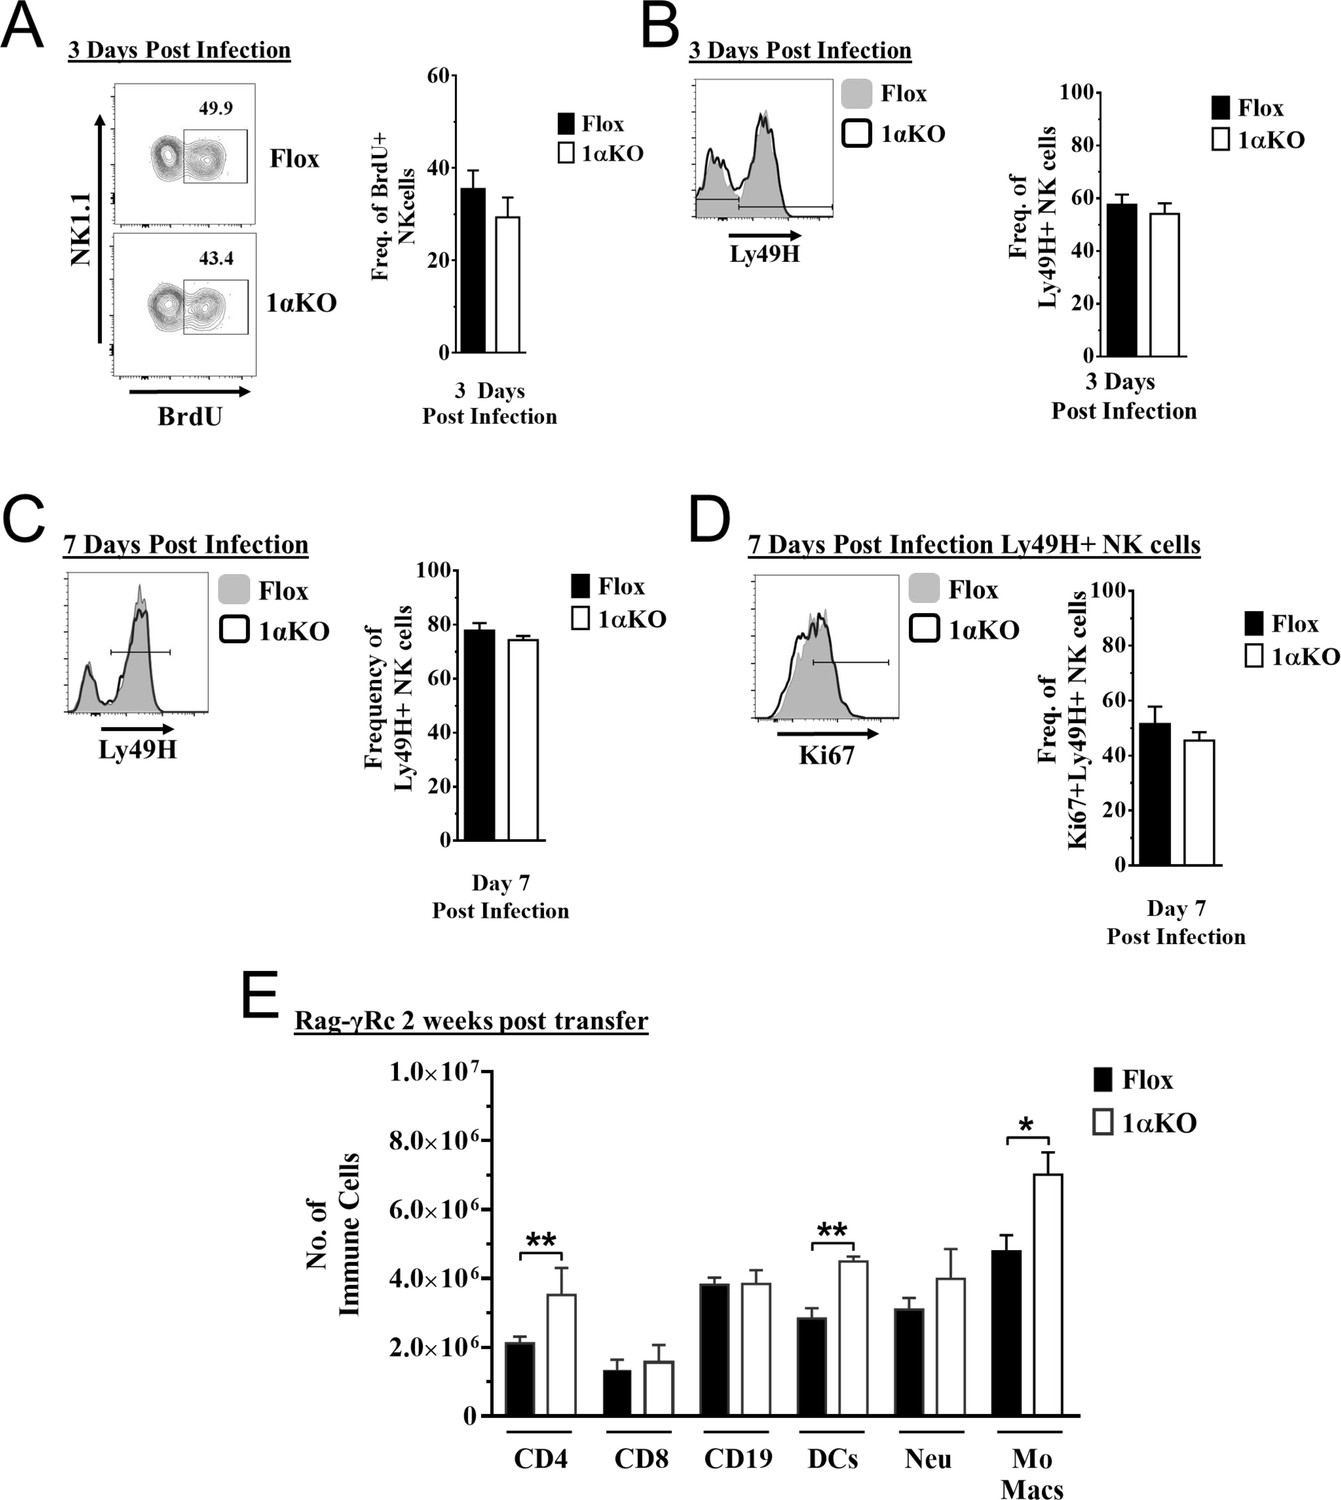
Proliferation is normal in hypoxia-inducible factor-1α (HIF1α) KO natural killer (NK) cells.
(A–D) 1αKO or Flox mice infected with murine cytomegalovirus (MCMV) received a dose of 50K plaque forming unit (pfu) and analyzed as indicated. (A) Representative contour plots (left) and quantification (right) of bulk splenic NK cells that were collected day 3 post MCMV infection and BrdU expression was determined. Data are from two independent experiments with four mice per group. (B) Representative histogram (left) and quantification of frequency (right) of Ly49H expressing NK cells at day 3 post MCMV infection. Data are from two independent experiments with four mice per group. (C) Histogram (left) shows gating for Ly49H on NK cells at day 7 post MCMV infection and is quantified in the right graph. Data are from four independent experiments with seven mice per group. (D) Histogram that is representative of Ki67 expression in Ly49H + NK cells and quantification at day 7 post MCMV infection. Data are from four independent experiments with seven mice per group. (E) Rag-γRc mice analyzed on day 14 since post splenocyte transfer for engraftment of lymphocytes and myeloid cells in the spleen. Data are from two independent experiments with three mice per group. Data depict mean ± SEM, with each data set containing data indicated number of mice per group from independent experiments. Statistical significance indicated by n.s., no significant difference, *p<0.05, **p<0.01, ***p<0.001, ****p<0.0001.
Figure 5 with 1 supplement
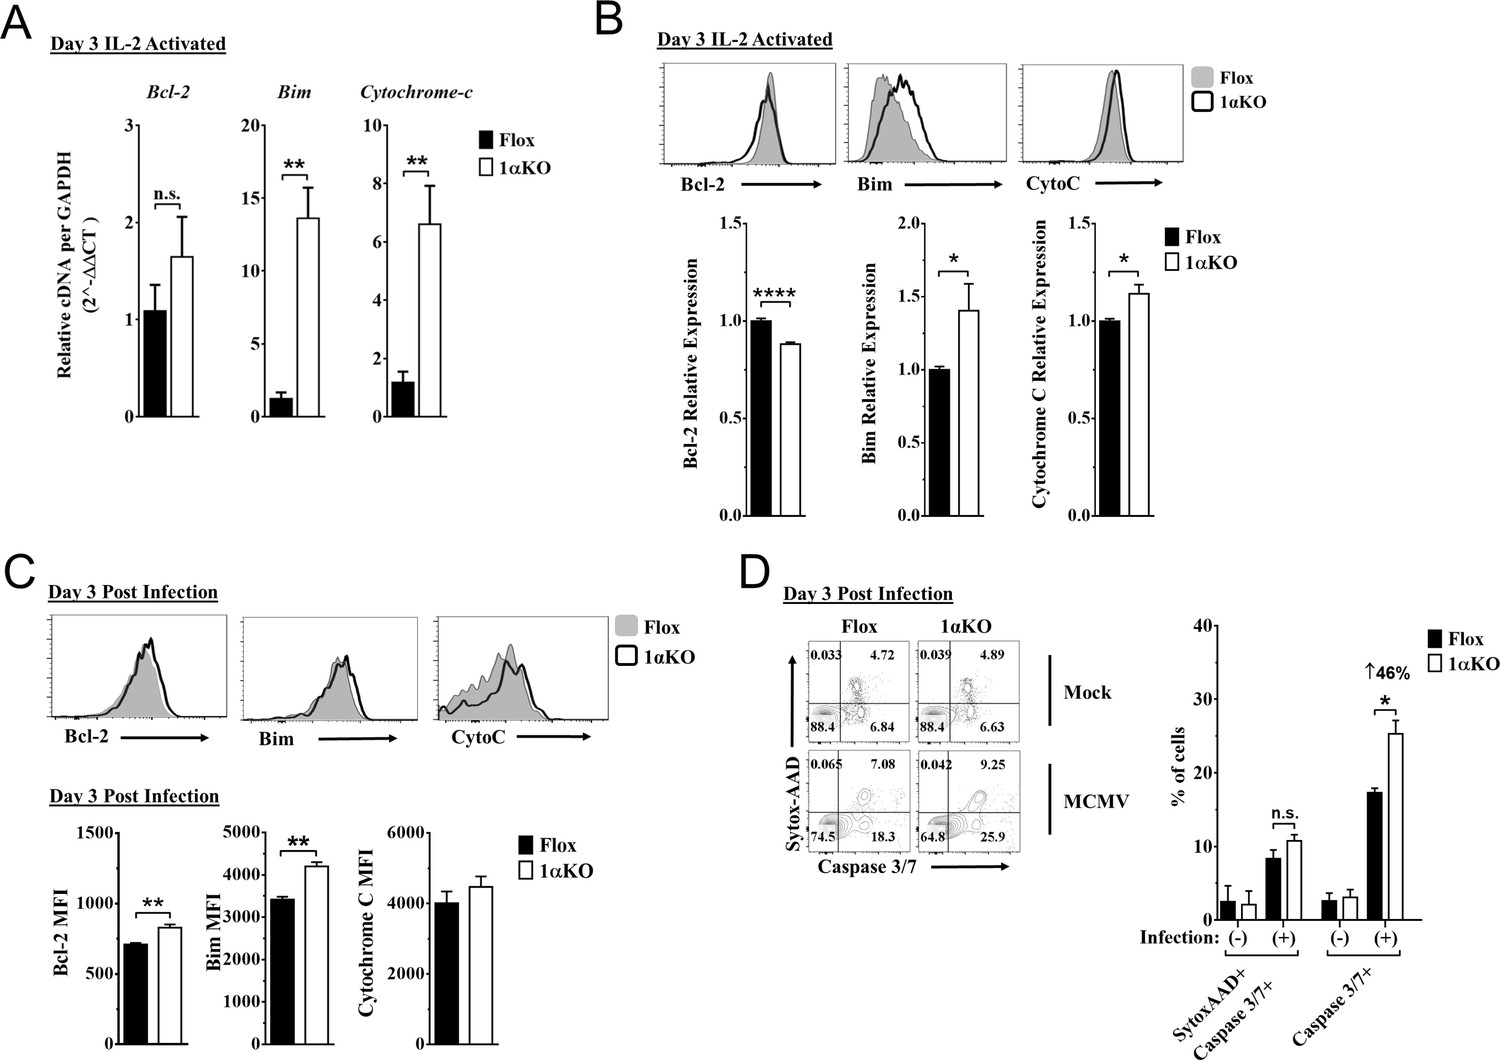
Hypoxia-inducible factor-1α (HIF1α) KO natural killer (NK) cells are predisposed to apoptosis.
(A) mRNA transcripts for levels of apoptosis associated genes Bcl-2, Bim, and cytochrome c was measured in 1αKO or FL control NK cells at day 3 post IL-2 stimulation. Data are from two independent experiments with four mice per group. (B) Representative histograms (top) and quantification (bottom) of pro-survival relative protein expression of Bcl-2, Bim, and cytochrome c (Cyto-C) in NK cells 3 days post IL-2 stimulation. Data are from 2–5 independent experiments with 4–11 mice per group. (C) Representative histograms (top) and quantification (bottom) of Bcl-2 MFI, Bim MFI, and cytochrome c (Cyto-C) MFI in NK cells day 3 post murine cytomegalovirus (MCMV) infection. Data are from 2–3 independent experiments with 4–6 mice per group. (D) Representative contour plots (left) and frequency quantification (right) of necrotic cells (Caspase 3/7+ Sytox AAD+), and apoptotic cells (Caspase 3/7+ Sytox AAD-). Data are from two independent experiments with three mice per group. Data depict mean ± SEM, with each data set containing data indicated number of mice per group from independent experiments. Unpaired t-test was performed on (A–D). Statistical significance indicated by n.s., no significant difference; *p<0.05; **p<0.01; ***p<0.001; ****p<0.0001.
Figure 5—figure supplement 1
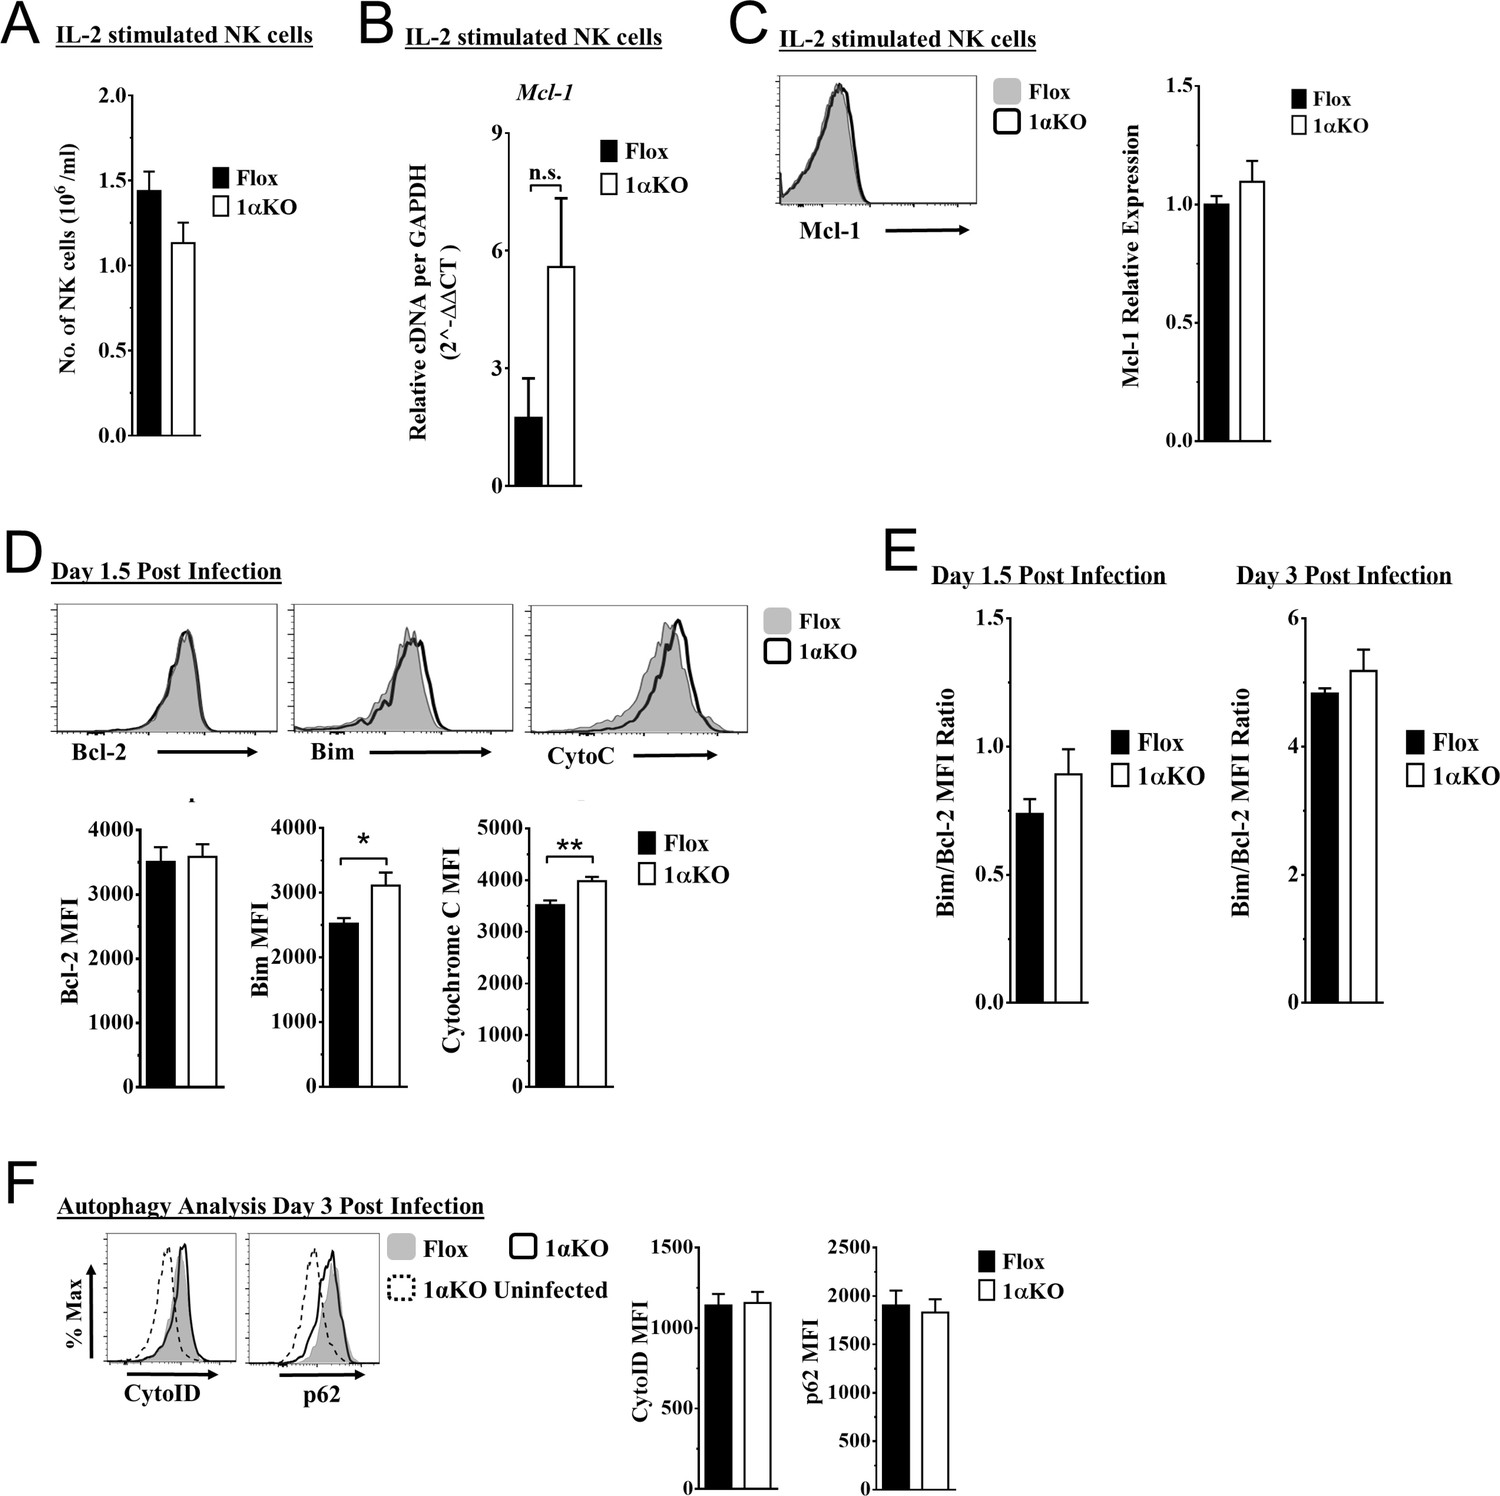
Hypoxia-inducible factor-1α (HIF1α) KO natural killer (NK) cells are predisposed to cell death.
(A–C) Enriched NK cells stimulated with 2000 units/ml of IL-2 for 3 days then harvested and analyzed as indicated. Data represents four mice per time point from two independent experiments. (A) Quantification of the number of NK cells in culture at day 3. Data are from two independent experiments with four mice per group. (B) mRNA levels for Mcl-1 were quantified using qRT-PCR. Data are from two independent experiments with four mice per group. (C) Representative histogram (top) and quantification of relative protein expression pro-survival marker Mcl-1. Data are from two independent experiments with four mice per group. (D) Representative histograms (top) and quantification (bottom) of pro-survival protein Bcl-2 MFI, and pro-apoptotic proteins Bim MFI, and cytochrome c (Cyto-C) MFI in NK cells day 1.5 post murine cytomegalovirus (MCMV) infection. Data are from 2–3 independent experiments with 4–6 mice per group. (E) Ratio of Bim to Bcl-2 MFI quantified from Flox and 1αKO NK cells at day 1.5 and day 3 post MCMV infection. Data are from three independent experiments with six mice per group for day 1.5 and two independent experiments with three mice per group for day 3. (F) Autophagy markers CytoID and p62 were measured day 3 post MCMV infection. Data are from two independent experiments with 4–5 mice per group. Data depict mean ± SEM, with each data set containing data indicated number of mice per group from independent experiments. Statistical significance indicated by n.s., no significant difference, *p<0.05, **p<0.01, ***p<0.001, ****p<0.0001.
Figure 6 with 1 supplement
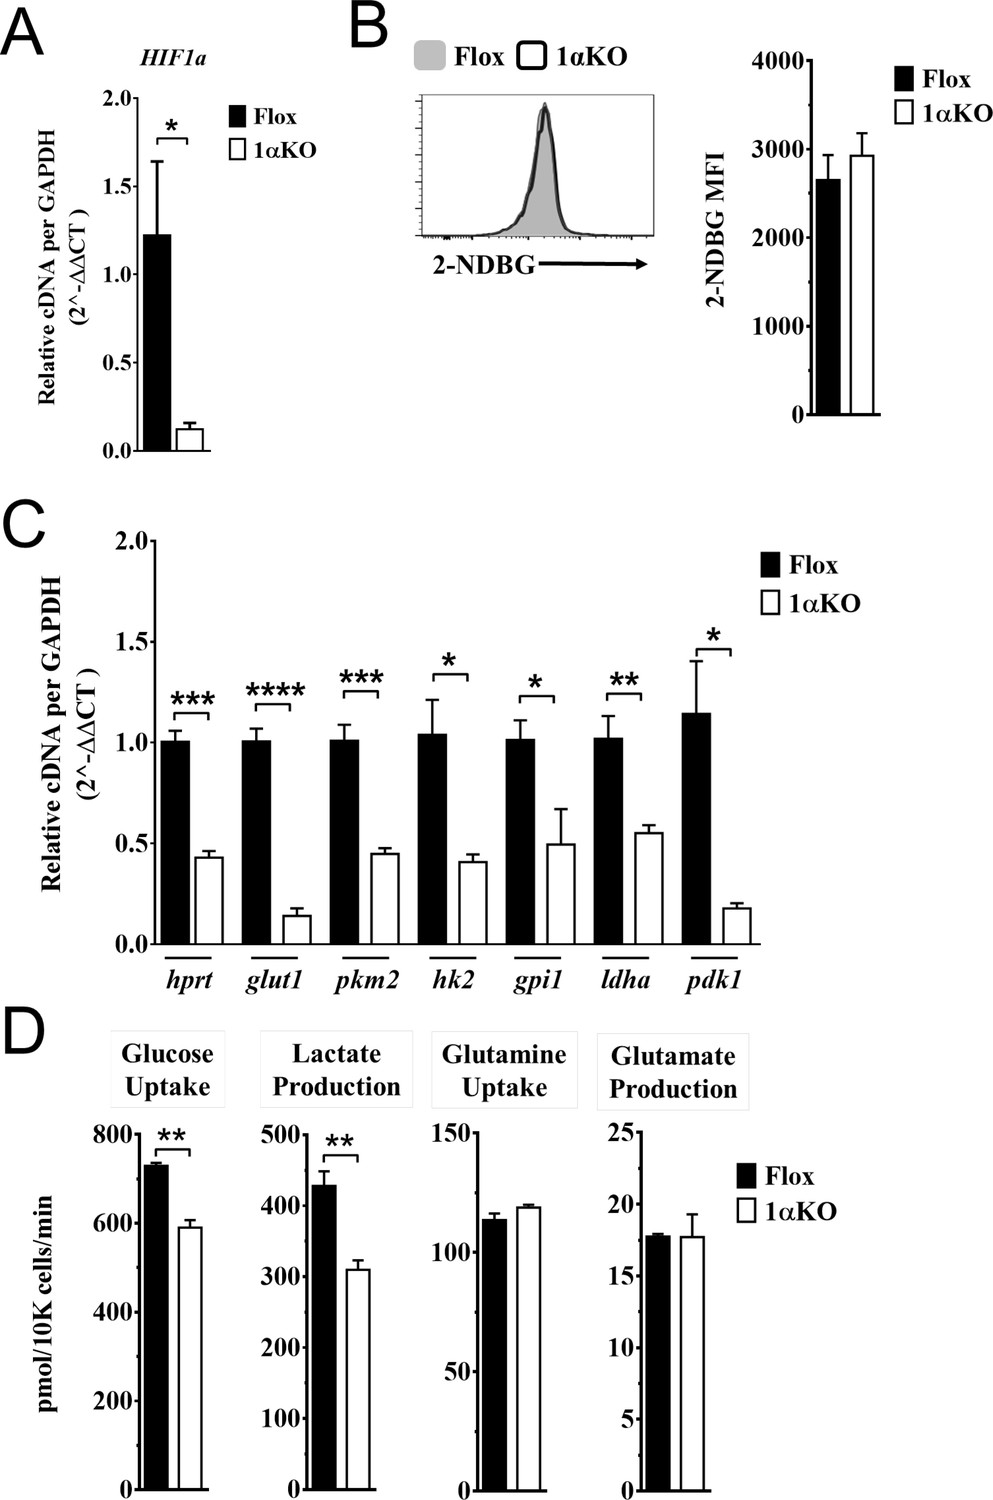
Impaired glycolytic activity contributes to impaired survival of hypoxia-inducible factor-1α (HIF1α) KO natural killer (NK) cells.
Enriched NK cells from 1αKO or FL control mice were IL-2 treated for 3 days then collected and analyzed as follows. (A) mRNA transcript levels of HIF1α for both cohort of mice measured with qRT-PCR. Data are from two independent experiments with four mice per group. (B) Flow cytometry analysis of 2-NDBG MFI expression as a measure of glucose intake. Data are from three independent experiments with six mice per group. (C) mRNA transcripts levels for glycolysis genes glut1, gpi1, hk2, hprt, ldha, pdk1, and pkm2 were measured with qRT-PCR. Data are from two independent experiments with four mice per group. (D) Media was collected from day 3 IL-2-activated NK cell cultures and using LC/MS, uptake of glucose (first panel) and glutamine (third panel), and production of lactate (second panel) and glutamate (fourth panel) was measured. Data are representative of two independent experiments with three mice per group. Data depict mean ± SEM, with each data set containing data indicated number of mice per group from independent experiments. Unpaired t-test was performed on (A–D). Statistical significance indicated by n.s., no significant difference; *p<0.05; **p<0.01; ***p<0.001; ****p<0.0001.
Figure 6—figure supplement 1
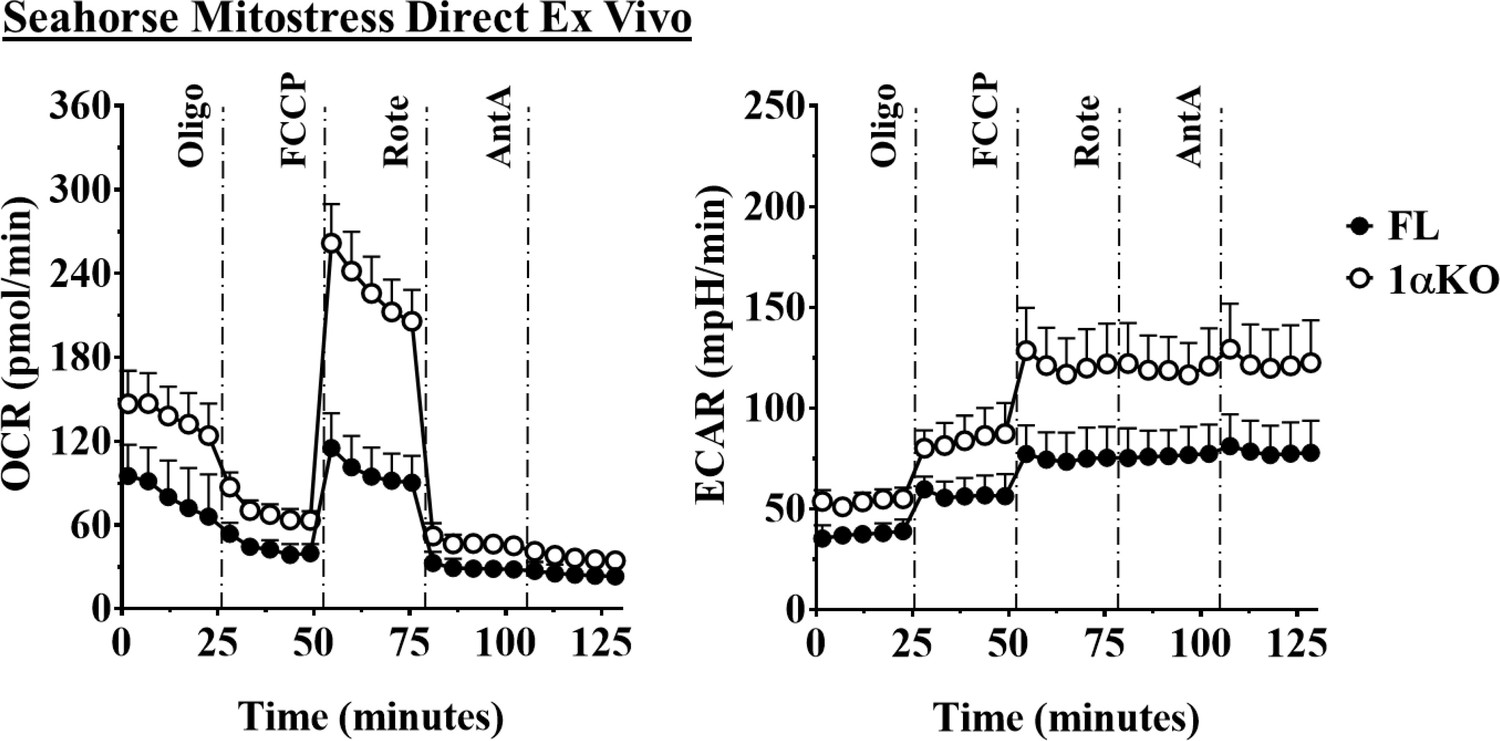
Hypoxia-inducible factor-1α (HIF1α) KO natural killer (NK) cells have dysregulated metabolism.
Enriched NK cells from 1αKO and Flox mice were subjected to a mitochondrial stress test, then, oxygen consumption rate (OCR) and extracellular acidification rate (ECAR) were measured direct ex vivo. Data are from three independent experiments with 5–6 mice per group. Data depict mean ± SEM, with each data set containing data indicated number of mice per group from independent experiments. Statistical significance indicated by n.s., no significant difference, *p<0.05, **p<0.01, ***p<0.001, ****p<0.0001.
Tables
Key resources table
| Reagent type (species) or resource | Designation | Source or reference | Identifiers | Additional information |
|---|---|---|---|---|
| Strain, strain background (Mus musculus) | β2m KO; B6.129P2-B2mtm1Unc/J | Jackson Laboratories | IMSR Cat# JAX:002070, RRID:IMSR_JAX:002070 | |
| Strain, strain background (Mus musculus) | HIF1a Flox; B6.129-Hif1atm3Rsjo/J | Jackson Laboratories | IMSR Cat# JAX:007561, RRID:IMSR_JAX:007561 | |
| Strain, strain background (Mus musculus) | NKp46iCre; Ncr1tm1.1(icre)Viv/J | Eric Vivier | MGI Cat# 5309017, RRID:MGI:5309017 | |
| Strain, strain background (Mus musculus) | Wild-type; C57BL/6NCr | Charles River | MGI Cat# 5657970, RRID:MGI:5657970 | |
| Strain, strain background (murine cytomegalovirus) | MCMV | Cheng et al., 2010 | ||
| Antibody | Anti-SQSTM1/p62 Alexa Fluor 647 (rabbit monoclonal) | Abcam | Cat# ab194721 | Flow (1:500) |
| Antibody | Anti-CD49a Brilliant Violet 421 (Armenian hamster monoclonal) | BD Biosciences | Cat# 740046, RRID:AB_2739815 | Flow (1:100) |
| Antibody | Anti-Bcl-2 Alexa Fluor 488 (mouse monoclonal) | BioLegend | Cat# 633506, RRID:AB_2028390 | Flow (1:100) |
| Antibody | Anti-Cytochrome c Alexa Fluor 647 (mouse monoclonal) | BioLegend | Cat# 612310, RRID:AB_2565241 | Flow (1:100) |
| Antibody | Anti-DNAM-1 PE (rat monoclonal) | BioLegend | Cat# 132006, RRID:AB_1279173 | Flow (1:100) |
| Antibody | Anti-HIF1a PE (mouse monoclonal) | BioLegend | Cat# 359704, RRID:AB_2562423 | Flow (5:100) |
| Antibody | Anti-Ly49A PE (rat monoclonal) | BioLegend | Cat# 116808, RRID:AB_313759 | Flow (1:200) |
| Antibody | Anti-NK1.1 BV650 (mouse monoclonal) | BioLegend | Cat# 108736, RRID:AB_2563159 | Flow (1:100) |
| Antibody | Anti-Mcl-1 PE (rabbit monoclonal) | Cell Signaling Technology | Cat# 65617, RRID:AB_2799688 | Flow (1:50) |
| Antibody | APC-AffiniPure F(ab')2 Fragment Donkey Anti-Goat IgG (H + L) (min X Ck,GP,Sy Hms,Hrs,Hu,Ms,Rb,Rat Sr Prot) antibody (polyclonal) | Jackson ImmunoResearch Labs | Cat# 705-136-147, RRID:AB_2340407 | Flow (1:300) |
| Antibody | Anti-Ly49H FITC (mouse monoclonal) | Made in-house FACS | Flow (1:100) | |
| Antibody | Anti-Bim (rabbit monoclonal) | Thermo Fisher Scientific | Cat# MA5-14848, RRID:AB_10981505 | Flow (1:200) |
| Antibody | Anti-CD3e AF700 (Syrian hamster monoclonal) | Thermo Fisher Scientific | Cat# 56-0033-82, RRID:AB_837094 | Flow (2:100) |
| Antibody | Anti-CD19 Alexa Fluor 700 (rat monoclonal) | Thermo Fisher Scientific | Cat# 56-0193-80, RRID:AB_837082 | Flow (1:100) |
| Antibody | Anti-CD11b eFluor 450 (rat monoclonal) | Thermo Fisher Scientific | Cat# 48-0112-82, RRID:AB_1582236 | Flow (1:100) |
| Antibody | Anti-CD27 PE-Cy7 (Armenian hamster monoclonal) | Thermo Fisher Scientific | Cat# 25-0271-82, RRID:AB_1724035 | Flow (1:100) |
| Antibody | Anti-CD49b APC (rat monoclonal) | Thermo Fisher Scientific | Cat# 17-5971-82, RRID:AB_469485 | Flow (1:100) |
| Antibody | Anti-CD69 PE-Cy7 (Armenian hamster monoclonal) | Thermo Fisher Scientific | Cat# 25-0691-82, RRID:AB_469637 | Flow (1:100) |
| Antibody | Anti-Granzyme B APC (mouse monoclonal) | Thermo Fisher Scientific | Cat# MHGB05, RRID:AB_10373420 | Flow (5:100) |
| Antibody | Anti-IFNg eFluor450 (rat monoclonal) | Thermo Fisher Scientific | Cat# 48-7311-82,, RRID:AB_1834366 | Flow (1:100) |
| Antibody | Anti-Ki-67 eFluor 450 (rat monoclonal) | Thermo Fisher Scientific | Cat# 48-5698-80, RRID:AB_1115115 | Flow (1:100) |
| Antibody | Anti-KLRG1 APC (Syrian hamster monoclonal) | Thermo Fisher Scientific | Cat# 17-5893-82, RRID:AB_469469 | Flow (1:100) |
| Antibody | Anti-Ly49G PE (mouse monoclonal) | Thermo Fisher Scientific | Cat# 12-5885-82, RRID:AB_466005 | Flow (2:100) |
| Antibody | Anti-Ly49H APC (mouse monoclonal) | Thermo Fisher Scientific | Cat# 17-5886-82, RRID:AB_10598809 | Flow (1:100) |
| Antibody | Anti-Ly49I FITC (mouse monoclonal) | Thermo Fisher Scientific | Cat# 11-5895-85, RRID:AB_465302 | Flow (1:100) |
| Antibody | Anti-NKG2A PE (mouse monoclonal) | Thermo Fisher Scientific | Cat# 12-5897-82, RRID:AB_46602 | Flow (2:100) |
| Antibody | Anti-NKp46 PerCPeFluor710 (rat monoclonal) | Thermo Fisher Scientific | Cat#: 46-3351-82, RRID:AB_1834441 | Flow (1:100) |
| Other | Viability stain eFluor 506 | Thermo Fisher Scientific | Cat# 65-0866-14 | Flow (1:1000) |
| Other | Viability stain eFluor 780 | Thermo Fisher Scientific | Cat# 65-0865-14 | Flow (1:1000) |
| Sequence-based reagent | Actin b | IDT DNA | TAQman assay | Forward: 5′-AGCTCATTGTAGAAGGTGTGG-3′;reverse: 5′-GGTGGGAATGGGTCAGAAG-3′;probe: 5′-TTCAGGGTCAGGATACCTCTCTTGCT-3′ |
| Sequence-based reagent | Bcl-2 | IDT DNA | PowerSYBR Green PCR Master Mix | Forward: 5'-CCTGTGGATGACTGAGTACCTG-3'; reverse; 5'-AGCCAGGAGAAATCAAACAGAGG-3' |
| Sequence-based reagent | Bim | IDT DNA | PowerSYBR Green PCR Master Mix | Forward: 5'-GGAGATACGGATTGCACAGGAG-3'; reverse: 5'-CTCCATACCAGACGGAAGATAAAG-3' |
| Sequence-based reagent | Cytochrome c | IDT DNA | PowerSYBR Green PCR Master Mix | Forward: 5'-GAGGCAAGCATAAGACTGGACC-3'; reverse: 5'-ACTCCATCAGGGTATCCTCTCC-3' |
| Sequence-based reagent | gapdh | IDT DNA | PowerSYBR Green PCR Master Mix | Forward: 5'-GTTGTCTCCTGCGACTTCA-3'; reverse: 5'-GGTGGTCCAGGGTTTCTTA-3' |
| Sequence-based reagent | glut1 | IDT DNA | PowerSYBR Green PCR Master Mix | Forward: 5'-AAGAAGCTGACGGGTCGCCTCATGC-3'; reverse: 5'-TGAGAGGGACCAGAGCGTGGTG-3' |
| Sequence-based reagent | gpi1 | IDT DNA | PowerSYBR Green PCR Master Mix | Forward: 5'-GTTGCCTGAAGAGGCCAGG-3'; reverse: 5'-GCTGTTGCTTGATGAAGCTGATC-3' |
| Sequence-based reagent | hif1a | IDT DNA | PowerSYBR Green PCR Master Mix | Forward: 5'-CATCAGTTGCCACTTCCCCA-3'; reverse: 5'-GGCATCCAGAAGTTTTCTCACAC-3' |
| Sequence-based reagent | hk2 | IDT DNA | PowerSYBR Green PCR Master Mix | Forward: 5'-GGAGAGCACGTGTGACGAC-3'; reverse: 5'-GATGCGACAGGCCACAGCA-3', |
| Sequence-based reagent | hprt | IDT DNA | PowerSYBR Green PCR Master Mix | Forward: 5'- CTGGTGAAAAGGACCTCTCGAAG-3'; reverse: 5'- CCAGTTTCACTAATGACACAAACG-3' |
| Sequence-based reagent | ldha | IDT DNA | PowerSYBR Green PCR Master Mix | Forward: 5'-CACAAGCAGGTGGTGGACAG-3'; reverse: 5'-AACTGCAGCTCCTTCTGGATTC-3' |
| Sequence-based reagent | mcl-1 | IDT DNA | PowerSYBR Green PCR Master Mix | Forward: 5'-AGCTTCATCGAACCATTAGCAGAA-3'; reverse: 5'-CCTTCTAGGTCCTGTACGTGGA-3' |
| Sequence-based reagent | mcmv ie1 | IDT DNA | TAQman assay | Forward: 5′-CCCTCTCCTAACTCTCCCTTT-3′;reverse: 5′-TGGTGCTCTTTTCCCGTG 3′;probe: 5′-TCTCTTGCCCCGTCCTGAAAACC-3′ |
| Sequence-based reagent | pdk1 | IDT DNA | PowerSYBR Green PCR Master Mix | Forward: 5'-GATTCAGGTTCACGTCACGCT-3'; reverse: 5'-GACGGATTCTGTCGACAGAG-3' |
| Sequence-based reagent | pkm2 | IDT DNA | PowerSYBR Green PCR Master Mix | Forward: 5'-CAGGAGTGCTCACCAAGTGG-3'; reverse: 5'-CATCAAGGTACAGGCACTACAC-3' |
| Commercial assay or kit | XF Cell Mito Stress Test Kit | Agilent | Cat# 103015-100 | |
| Commercial assay or kit | CYTO-ID Autophagy detection kit | Enzo Life Sciences, Inc. | Cat# ENZ-51031-0050 | |
| Commercial assay or kit | Cell Event Caspase 3/7 Green Flow Cytometry Assay Kit | Thermo Fisher Scientific | Cat# C10423 | |
| Chemical compound, drug | Recombinant mouse IL-18 | MBL | Cat# B002-5 | |
| Chemical compound, drug | Recombinant murine IL-15 | Peptrotech | Cat# 210-15 | |
| Chemical compound, drug | Interferon-beta | PBL Assay Science | Cat# 12401-1, RRID:AB_605469 | |
| Chemical compound, drug | Percoll | Sigma | Cat# P1644 | |
| Software, algorithm | FlowJo 10 | Treestar | https://www.flowjo.com/; RRID:SCR_008520 | |
| Software, algorithm | Prism 6 | GraphPad | https://www.graphpad.com/; RRID:SCR_002798 |
Additional files
Download links
A two-part list of links to download the article, or parts of the article, in various formats.
Downloads (link to download the article as PDF)
Open citations (links to open the citations from this article in various online reference manager services)
Cite this article (links to download the citations from this article in formats compatible with various reference manager tools)
HIF1α is required for NK cell metabolic adaptation during virus infection
eLife 10:e68484.
https://doi.org/10.7554/eLife.68484


