Focal seizures are organized by feedback between neural activity and ion concentration changes
- Department of Biomedical Physics, Faculty of Physics, University of Warsaw, Poland
- Epilepsy Unit, Istituto Neurologico Carlo Besta, Italy
- Department of Epileptology, University Hospital Bonn, Germany
Figures
Figure 1
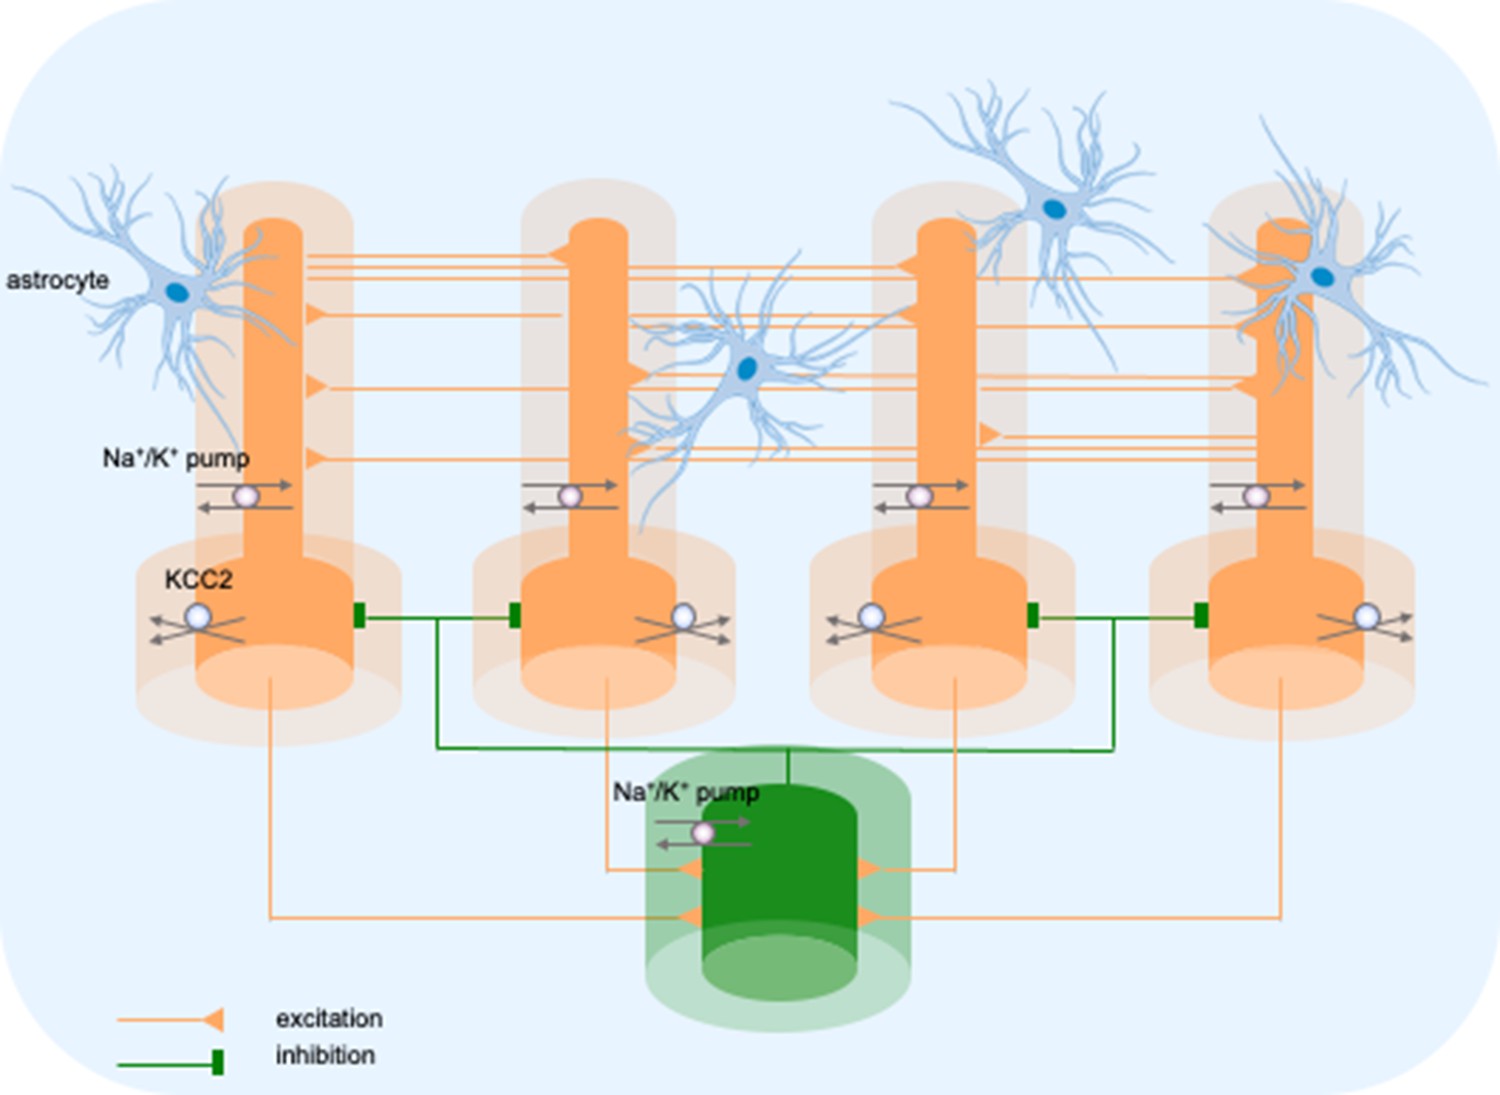
Model diagram.
The model consisted of four pyramidal cells (orange) and an interneuron (green) linked by excitatory (AMPA) and inhibitory (GABAa) synaptic connections. Each cellular compartment was surrounded by an interstitial compartment. The interstitial space was enclosed in a common bath (blue) which represented the surrounding tissue and vasculature not included in the model. The model included variable intracellular and extracellular ion concentrations computed according to ionic currents flowing across neuronal membranes, longitudinal diffusion between the dendritic and somatic compartments, radial diffusion between neighboring interstitial compartments and diffusion to/from the bath. Additionally, the model included ionic regulation mechanisms: a Na+/K+-pump, a KCC2 cotransporter and K+ buffering by astrocytes.
Figure 2

Model behavior during an SLE.
(A) Local field potential (LFP) signal. (B) Pyramidal cell (PY) membrane potential. (C) Interneuron (IN) membrane potential. (D) Extracellular potassium concentration. (E) Intracellular sodium concentration. (F) Intracellular chloride concentration. In the interictal phase (0–60 s), the model generated irregular background firing and the ion concentrations were at their resting values (A–F). The current injected into the interneuron at second 60 (C) yellow triggered fast IN spiking (C), black which also manifested as low voltage fast (LVF) activity in the LFP signal (A) Approximately 10 s after the initiation of the SLE, PY cells initiated tonic firing that subsequently shifted to bursting (B) The behavior of the PY cells was reflected in the LFP trace which showed irregular activity and synchronized bursting (A) The SLE terminated at approximately second 120 and was followed by postictal EEG suppression (PES) (A–C). The cellular activity was accompanied by significant ion concentration shifts. Extracellular potassium in the somatic compartment increased sharply and remained elevated throughout the SLE (D) dark blue. The [K+]o increase in the dendritic compartment was slower and less pronounced (D) violet. The intracellular sodium increased gradually toward a plateau (E) The intracellular chloride accumulated steadily throughout the SLE (F).
-
Figure 2—source data 1
Main simulation results.
- https://cdn.elifesciences.org/articles/68541/elife-68541-fig2-data1-v2.zip
Figure 3
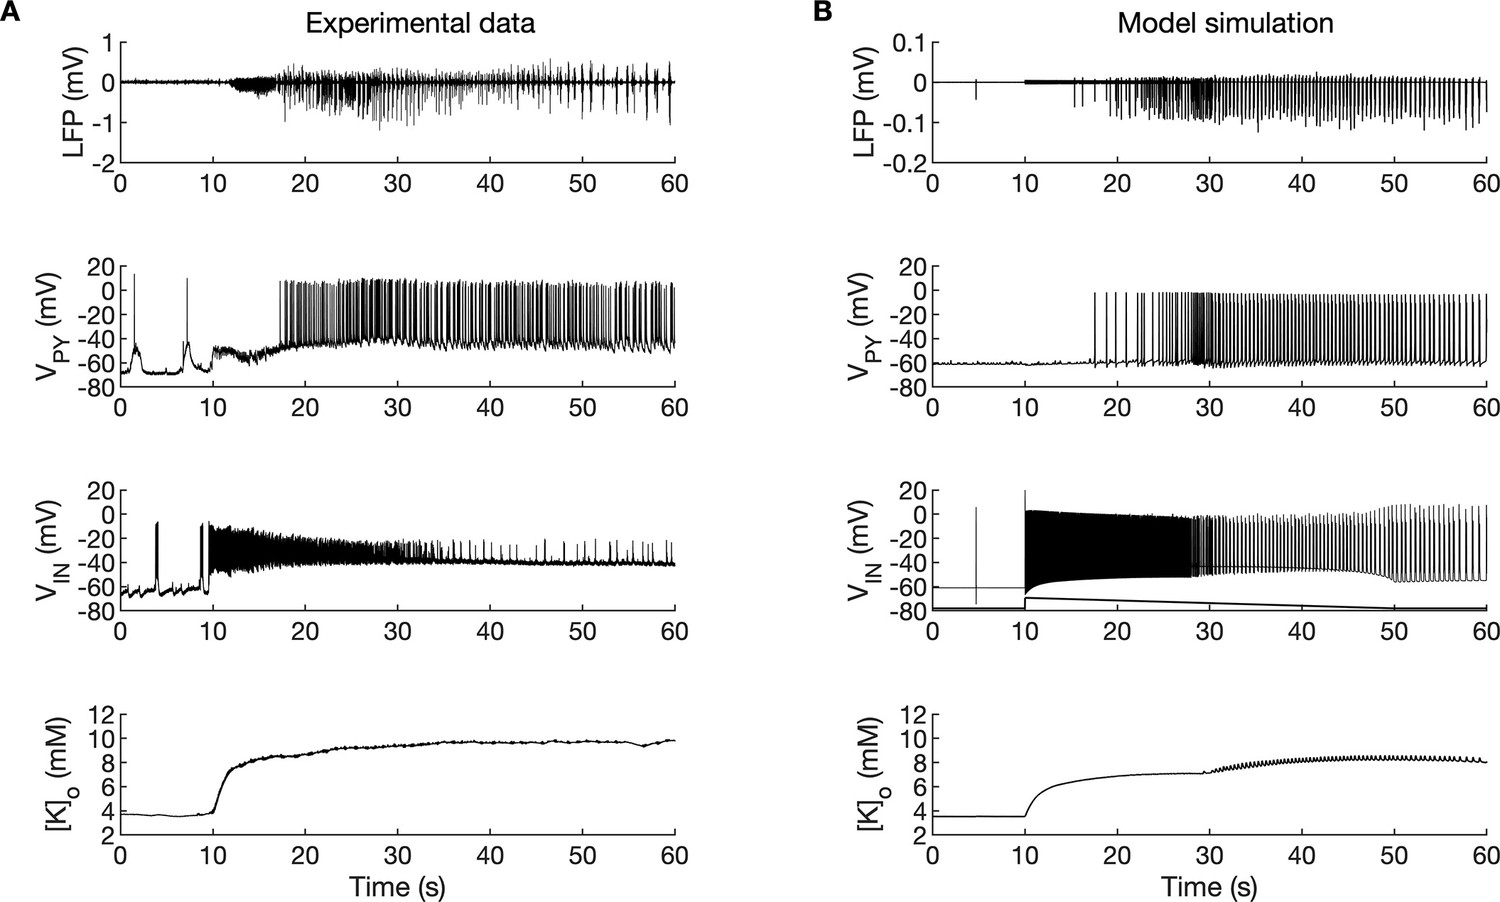
A comparison between the experimental data and the model simulation.
(A) Experimental recordings of a seizure-like event (SLE) in the in vitro isolated whole guinea pig brain preparation (de Curtis et al., 2006; Gnatkovsky et al., 2008; Uva et al., 2015). From top to bottom: LFP signal, intracellular recording of pyramidal cell (PY) and interneuron (IN), extracellular potassium. The onset of the SLE was associated with increased IN firing, silencing PY and low-voltage fast (LVF) activity in the LFP signal. Approximately 10 s after the onset of the SLE, the PY exhibited a tonic and then burst firing behavior. The extracellular potassium increased up to approximately 10 mM at the onset of the SLE and remained elevated afterward. (B) The activity patterns in the LFP signal, pyramidal cells, interneuron and [K+]o were reproduced accurately by the model. Signals presented in (A) were recorded in different experiments. LFP and interneuron data have been published previously (Gentiletti et al., 2017; Gnatkovsky et al., 2008) while pyramidal cell and [K+]o data have never been published before.
-
Figure 3—source data 1
Source files for an SLE recordings in the in vitro isolated whole guinea pig brain.
This zip archive contains experimental data shown in Figure 3. Seizure-like events were induced by 3 min arterial perfusion of 50 microM bicuculline and were recorded in the entorhinal cortex of the in vitro isolated whole guinea pig brain. The data are in the Matlab format (.mat). Matlab script (.m) loads the data from the file and creates the plot.
- https://cdn.elifesciences.org/articles/68541/elife-68541-fig3-data1-v2.zip
Figure 4
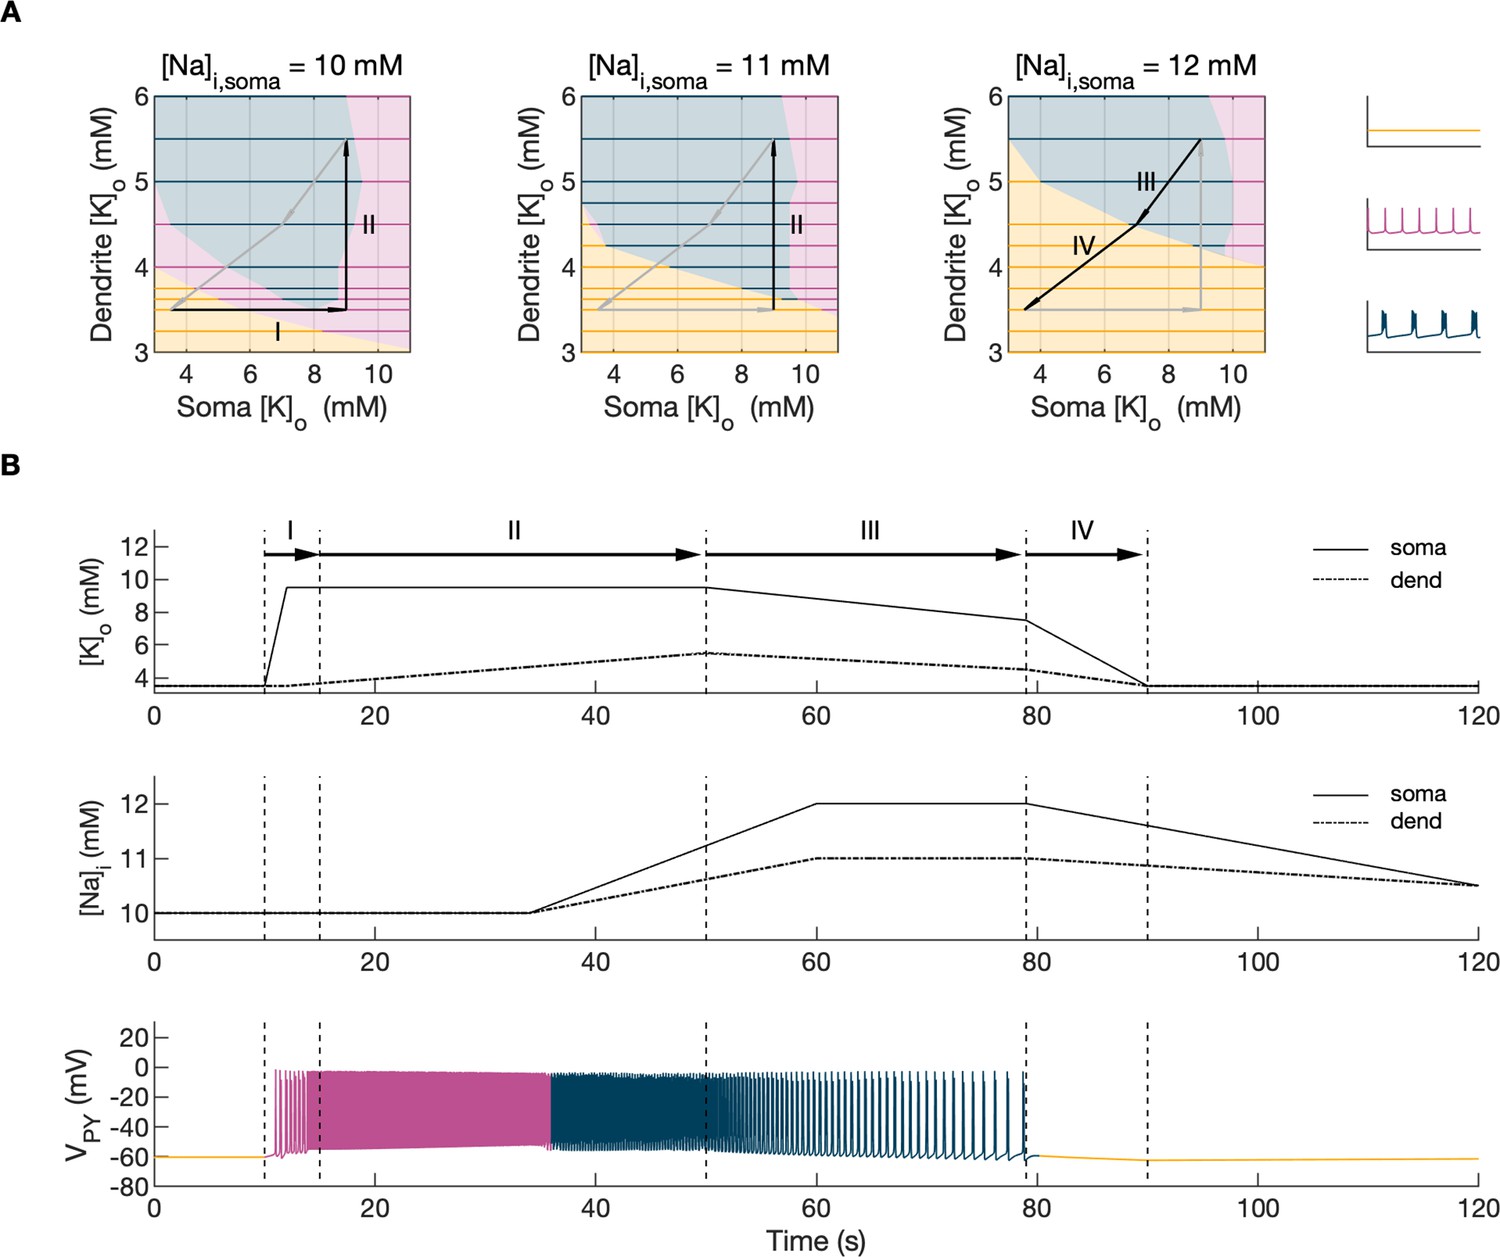
Analysis of the model.
In the bifurcation analysis extracellular potassium and intracellular sodium concentrations in the PY and IN cells were control parameters. Concentrations of all other ions were fixed at their reference values (except chloride: [Cl-]i,soma, [Cl-]i,dend equal to 7 mM), all ion accumulation mechanisms were blocked and background input was removed. (A) Bifurcation diagrams showing the dependence of the behavior of the model on [K+]o,dend and [K+]o,soma for varying values of [Na+]i,soma, [Na+]i,dend. The diagram colors correspond to types of activity shown on the right: rest (yellow), tonic firing (violet) and bursting (dark blue). An increase in [Na+]i progressively decreased the domains of tonic firing and bursting and increased the resting domain indicating a general decrease in network excitability. The black and gray arrows correspond to the evolution of [K+]o,soma, [K+]o,dend during different phases of the SLE, shown in part B. (B) A simulation of the model with [K+]o,soma, [K+]o,dend and [Na+]i,soma, [Na+]i,dend as the external control parameters, that illustrated the occurrence of transitions between different types of activity during the SLE. The top two panels show the time course of [K+]o,soma, [K+]o,dend and [Na+]i,soma, [Na+]i,dend and approximate their evolution during the SLE (Figure 2). The third panel shows the resulting PY cell behavior. The parameter evolution is divided into four phases indicated by the arrows denoted as I–IV in part (A) and (B). Phase I corresponds to a sharp increase in [K+]o,soma which led to a transition from rest to tonic firing (marked as a black arrow ‘I’ in the first panel in A). Phase II corresponds to a slow increase in [K+]o,dend which led to a transition from tonic firing to bursting (marked as a black arrow ‘II’ in the first and second panels in A). Phase III represents a period of increased [Na+]i,soma, [Na+]i,dend and decreasing [K+]o,soma and [K+]o,dend which led to the termination of the SLE represented by a black arrow ‘III’ with its tip in the yellow domain in the third panel in (A). Phase IV corresponds to the postictal period with elevated [Na+]i and a return of [K+]o,soma, [K+]o,dend to their baseline values marked as a black arrow ‘IV’ in the third panel in (A).
Figure 5
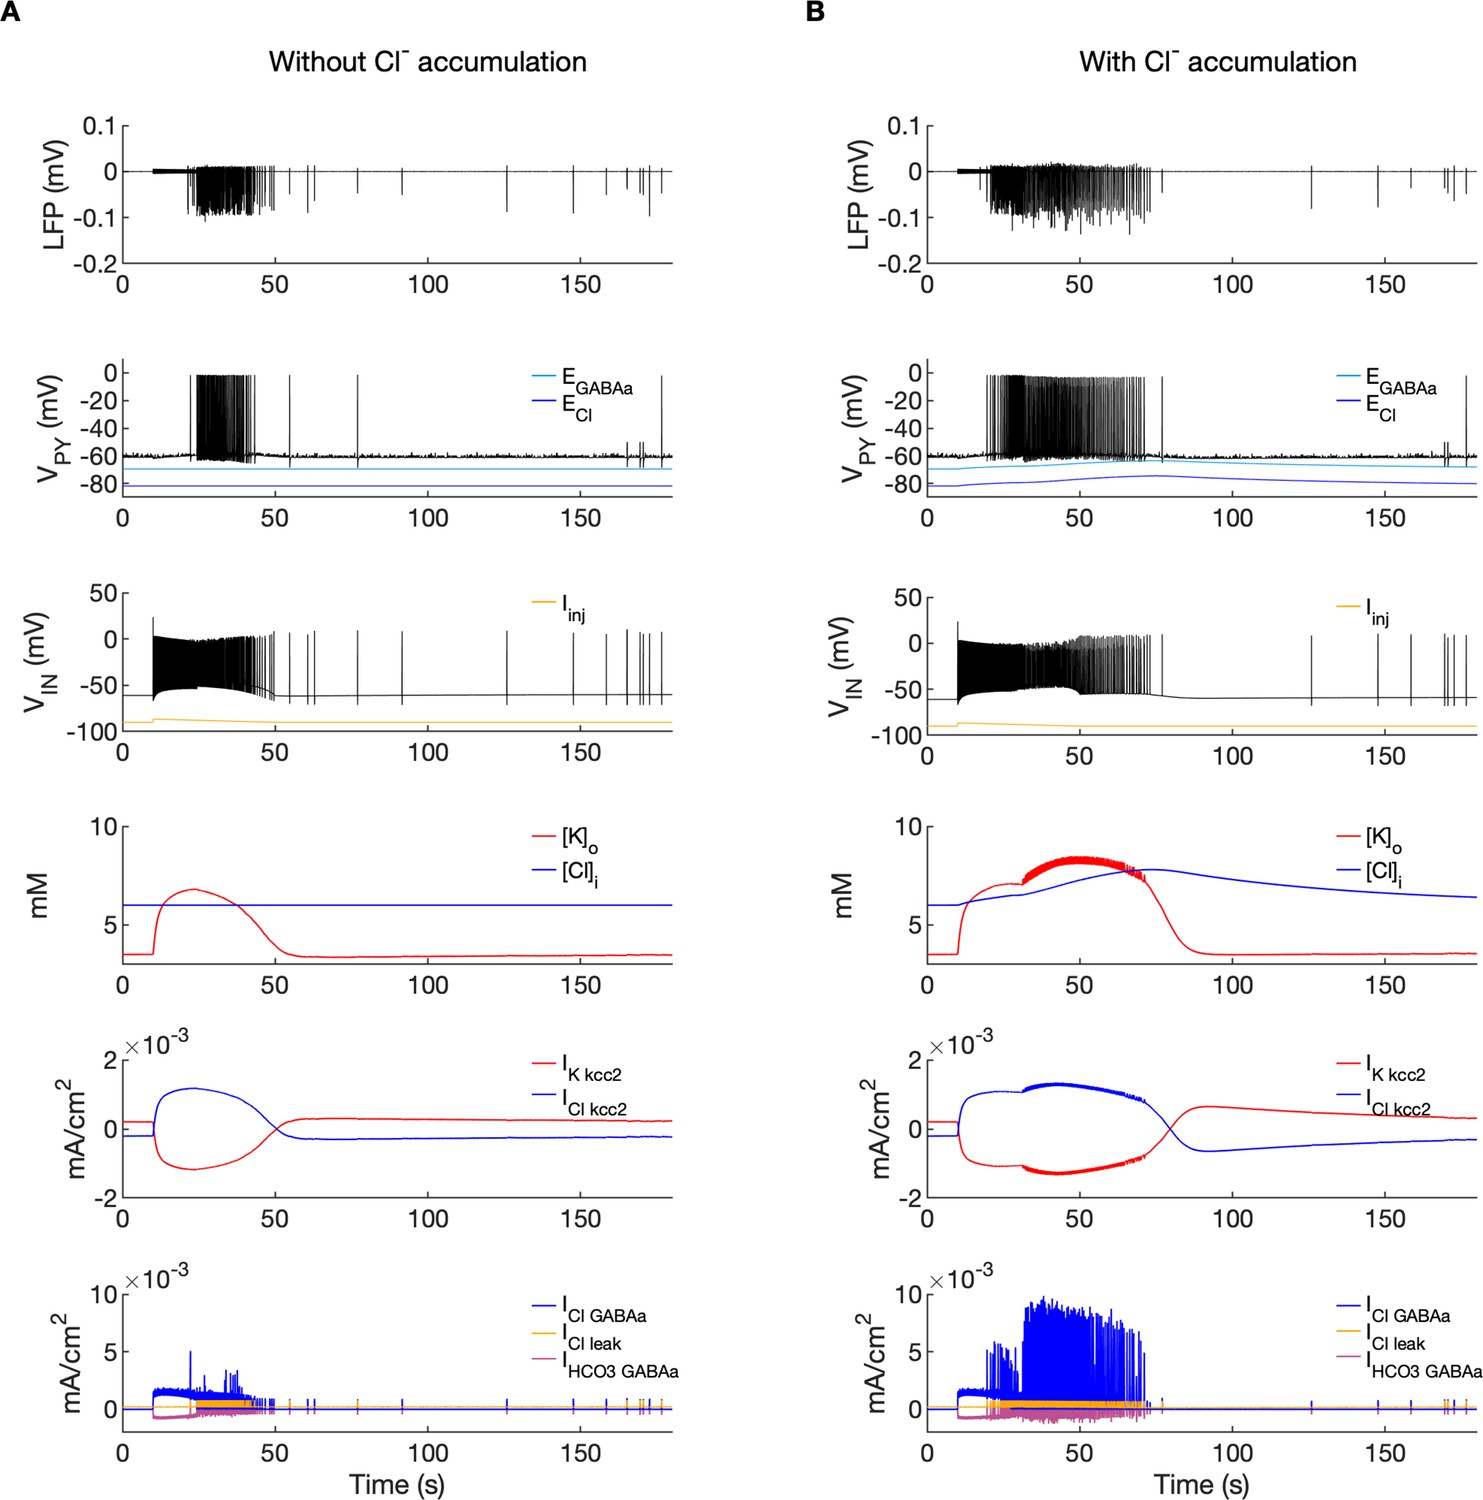
A comparison of the model without and with chloride accumulation.
The six panels in each column show respectively (from top to bottom): the LFP signal, the PY cell membrane potential, the IN membrane potential, the extracellular potassium concentration and intracellular chloride concentration, the chloride and potassium KCC2 currents in the somatic compartments and the GABAa synaptic currents (Cl- and HCO3-) together with the leak chloride current. Additionally, the equilibrium potential of chloride and GABAa are shown in the second panel from the top. (A) When the [Cl-]i accumulation mechanism was blocked, the chloride concentration was fixed at the reference value (fourth panel, blue). Without chloride accumulation, the PY cell (second panel) fired tonic train of spikes due to transient rise in [K+]o (fourth panel, red) mediated by the IN discharge triggered by the current injection (yellow, third panel). Elevated [K+]o and fixed [Cl-]i promoted K+ influx via KCC2 (fifth panel, red), thus lowering [K+]o and further preventing the generation of the full SLE. (B) With chloride accumulation, the IN discharge led to an increase in ECl and EGABAa (second panel, blue and light blue) which reduced the hyperpolarizing ICl,leak and IGABAa currents and enhanced excitability. The increase in firing rate of the PY cells led to prolonged [K+]o accumulation (fourth panel, red) leading to the full SLE.
Figure 6 with 1 supplement
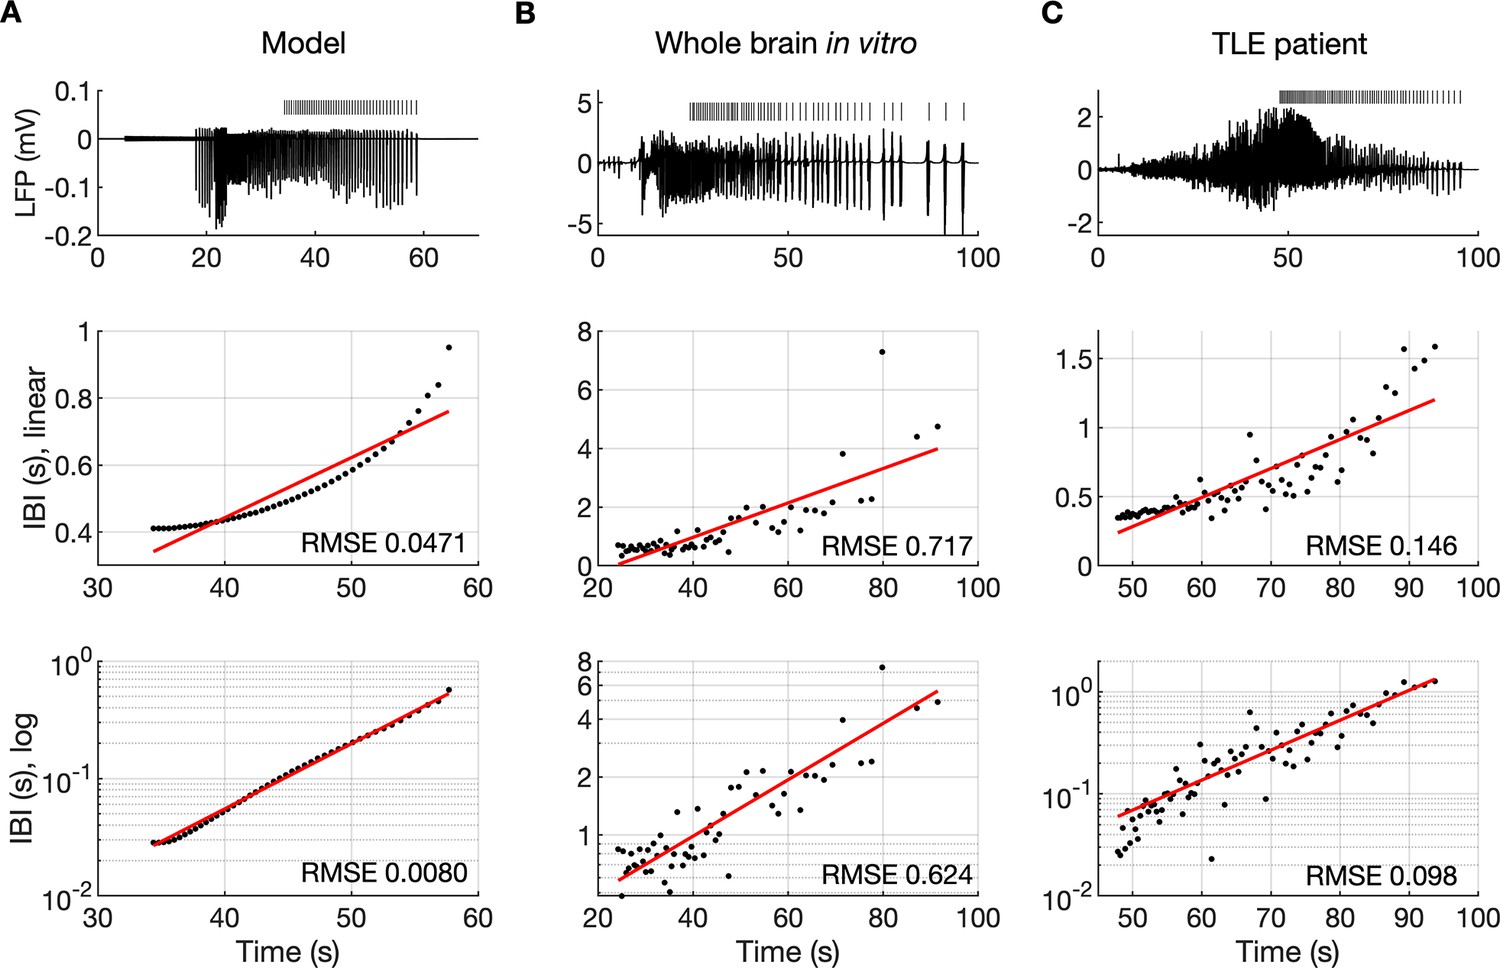
The evolution of inter-burst intervals (IBI) in the model and experimental data.
(A) In the simulation, the background input was removed and compensated with a small depolarizing current injected into the PY cells to preserve the duration of the SLE. A decreasing rate of bursting is visible in the LPF signal and in the detected bursts marked above the trace (top panel). The evolution of the IBI is shown with the y-axis on a linear scale (middle panel) and a log scale (bottom). On a linear y-axis plot, the data appear curved while on a semi-log plot they lay on a straight line, suggesting exponential scaling of the IBI with time. The red line in each plot represents the best fit for the detected IBI; linear function (middle panel) and exponential function providing a linear relationship on a semi-log plot (bottom panel). The root mean square error (RMSE) between the data points and fitted function is shown in each window. The exponential function fit yielded a smaller RMSE compared to the linear, logarithmic or square root fits (see Materials and methods), providing quantitative confirmation that at the end of the simulated SLE, the IBI duration increased exponentially with time. (B) The evolution of the IBI during the SLE induced by application of bicuculline in the whole-brain in vitro preparation (Boido et al., 2014; Gnatkovsky et al., 2008). (C) IBI evolution during a seizure recorded with intracerebral electrodes positioned in the temporal lobe in a patient submitted to presurgical evaluation (courtesy of Laura Tassi, Epilepsy Surgery Center, Niguarda Hospital, Milano, Italy). In (B) and (C), the detected IBI lay on a straight line on the semi-log plot and the exponential fit resulted in a smaller RMSE compared to the linear, logarithmic or square root fits, validating the model prediction of an exponential increase in the IBI at the end of a seizure. Only linear and exponential fits are shown. The results for all considered fits are provided in Figure 6—source data 1.
-
Figure 6—source data 1
Source files for seizure data used in the analysis of inter-burst interval slowing.
This zip archive contains simulated and experimental data shown in Figure 6. The source data are in the Matlab format (.mat). Separate Matlab scripts (.m) are provided for the analysis of inter-burst interval distribution at the end of a seizure in the Model, Whole guinea pig brain and TLE patient. Each script loads the data, calculates linear, exponential, logarithmic and square root fits with root mean square error and creates the plots for each fit.
- https://cdn.elifesciences.org/articles/68541/elife-68541-fig6-data1-v2.zip
Figure 6—figure supplement 1
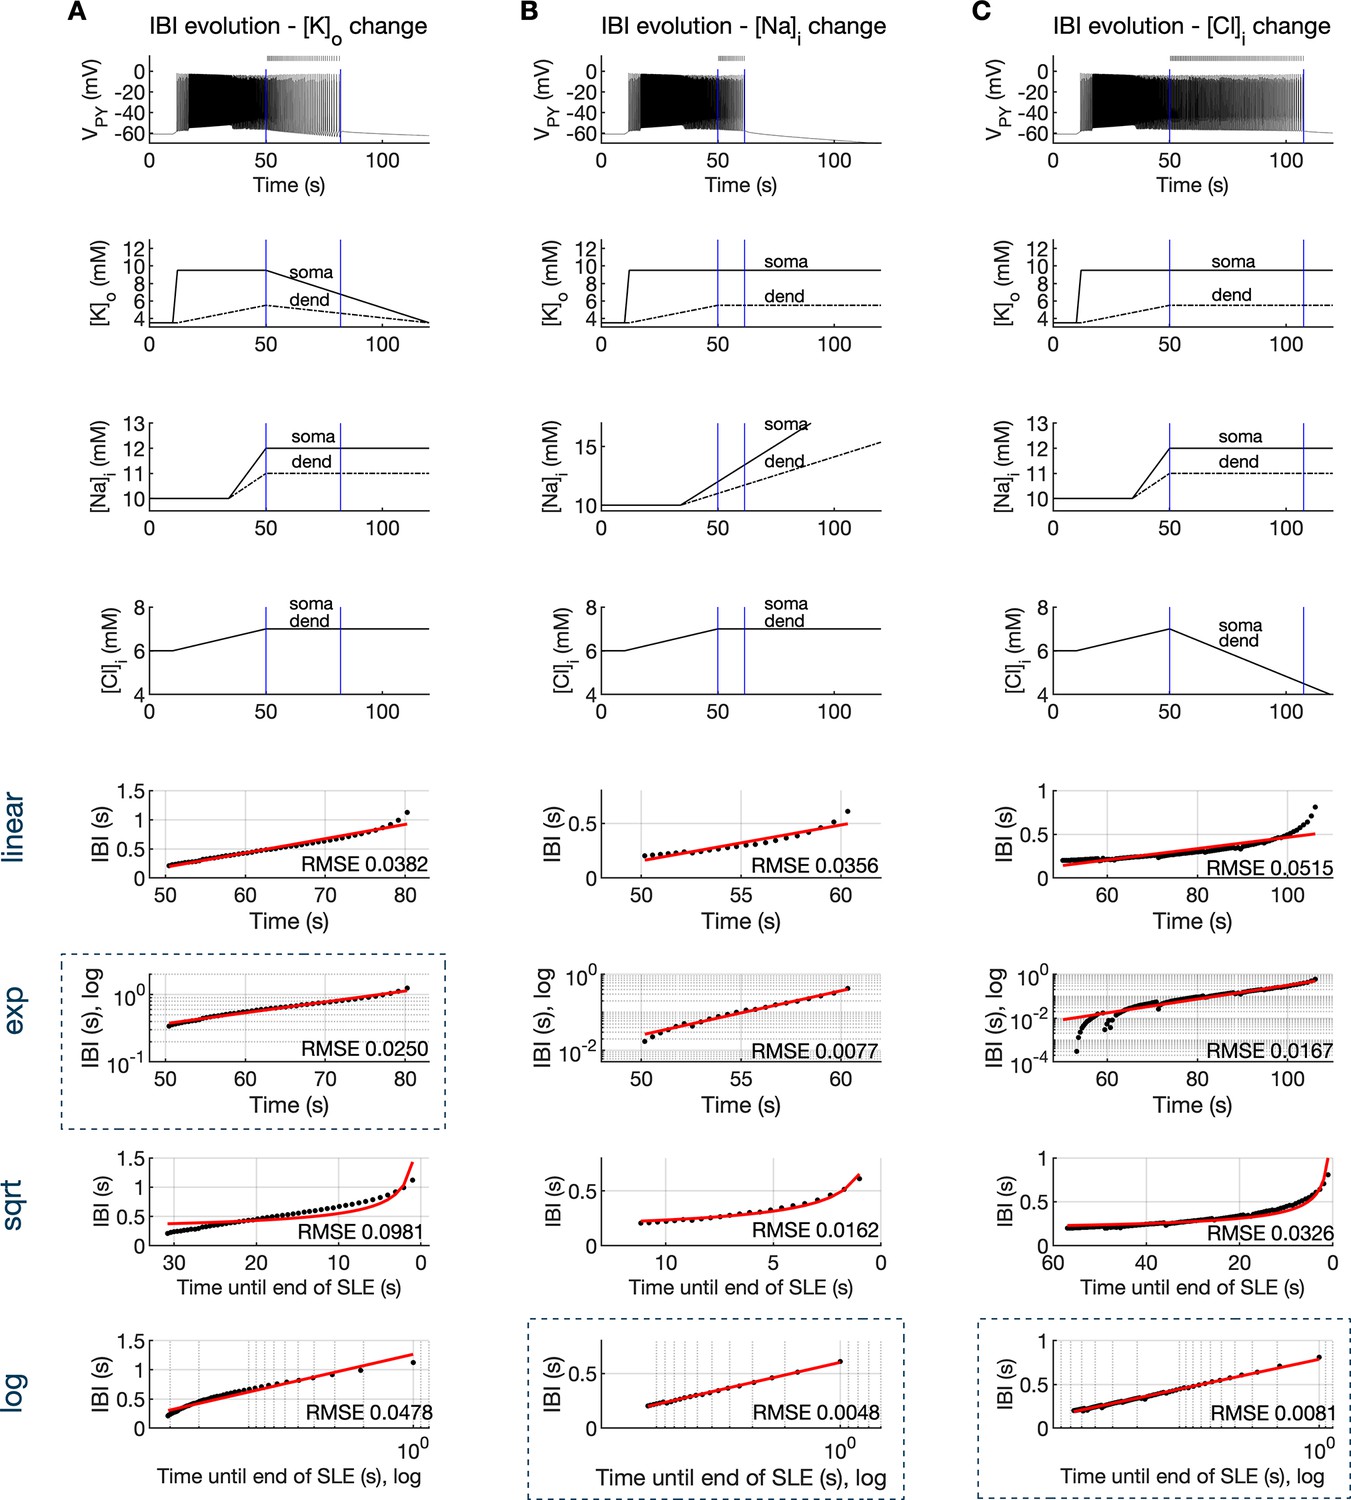
Inter-burst interval slowing mediated by ion concentration changes.
The SLE was simulated by variations in K+, Na+, and Cl- concentrations. For the first 50 s ion concentrations varied as in Figure 4B. Afterwards, the concentration of only one ion type was varied, while concentrations of all other ions were held constant. (A) In the bursting phase, discharges of PY cells were synchronous and the network dynamics was well captured by the membrane potential of a single PY cell, shown in the top panel. After second 50, a linear decrease in [K+]o (second panel) and constant [Na+]i and [Cl-]i (third and fourth panel, respectively) led to IBI slowing and SLE termination. The detected bursts are marked above the trace. Blue bars mark analyzed IBI epoch. Four bottom panels show evolution of IBI (black points) fitted with linear, exponential, square root and logarithmic functions (red lines, see Materials and methods), as marked on the left of the figure. The root mean square error (RMSE) between the data points and fitted function is shown in each window. Among all four fits, exponential fit marked by blue rectangle, provided the lowest RMSE. (B) Linear increase in [Na+]i or (C) linear decrease in [Cl-]i led to logarithmic IBI scaling (blue rectangle).
-
Figure 6—figure supplement 1—source data 1
Source files for simulated data used in the analysis of inter-burst interval slowing mediated by ion concentration changes.
- https://cdn.elifesciences.org/articles/68541/elife-68541-fig6-figsupp1-data1-v2.zip
Figure 7
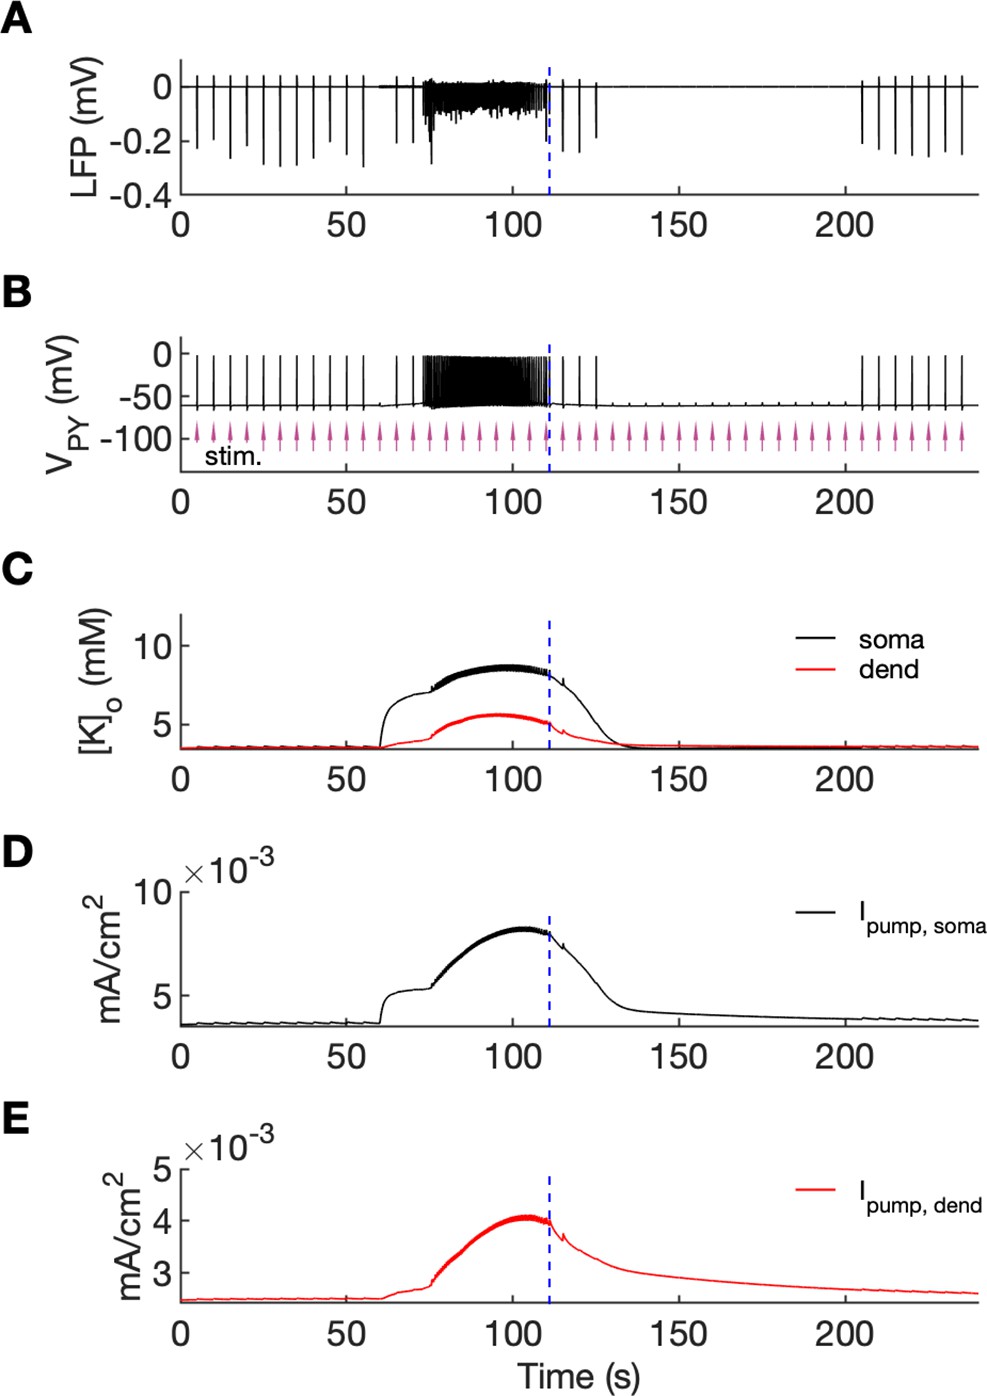
An analysis of network excitability in the postictal period.
In this figure, the background input was removed from the simulation and compensated with a small depolarizing current injected into the PY cells, as in Figure 6. (A) The LFP signal. (B) The PY cell membrane potential with external periodic stimulation delivered every 5 s, marked by the arrows (violet, stim.). The amplitude of the stimulation was set at just above the threshold for triggering a spike in the interictal period. (C) The extracellular potassium in the somatic and dendritic compartments. (D and E) The net Na+/K+-pump current in the somatic and dendritic compartment, respectively. The vertical broken line (blue) in all panels marks the SLE offset time without periodic stimulation. Immediately after termination of the SLE, the network was still excitable due to increased [K+]o. Shortly afterward, the excitability decreased due to an increased Na+/K+-pump current that outlasted the increase in [K+]o. Increased Ipump and decreased [K+]o which occurred shortly after the termination of the SLE, led to a postictal period during which the network did not respond to external stimulation for approximately 90 s.
Appendix 1—figure 1
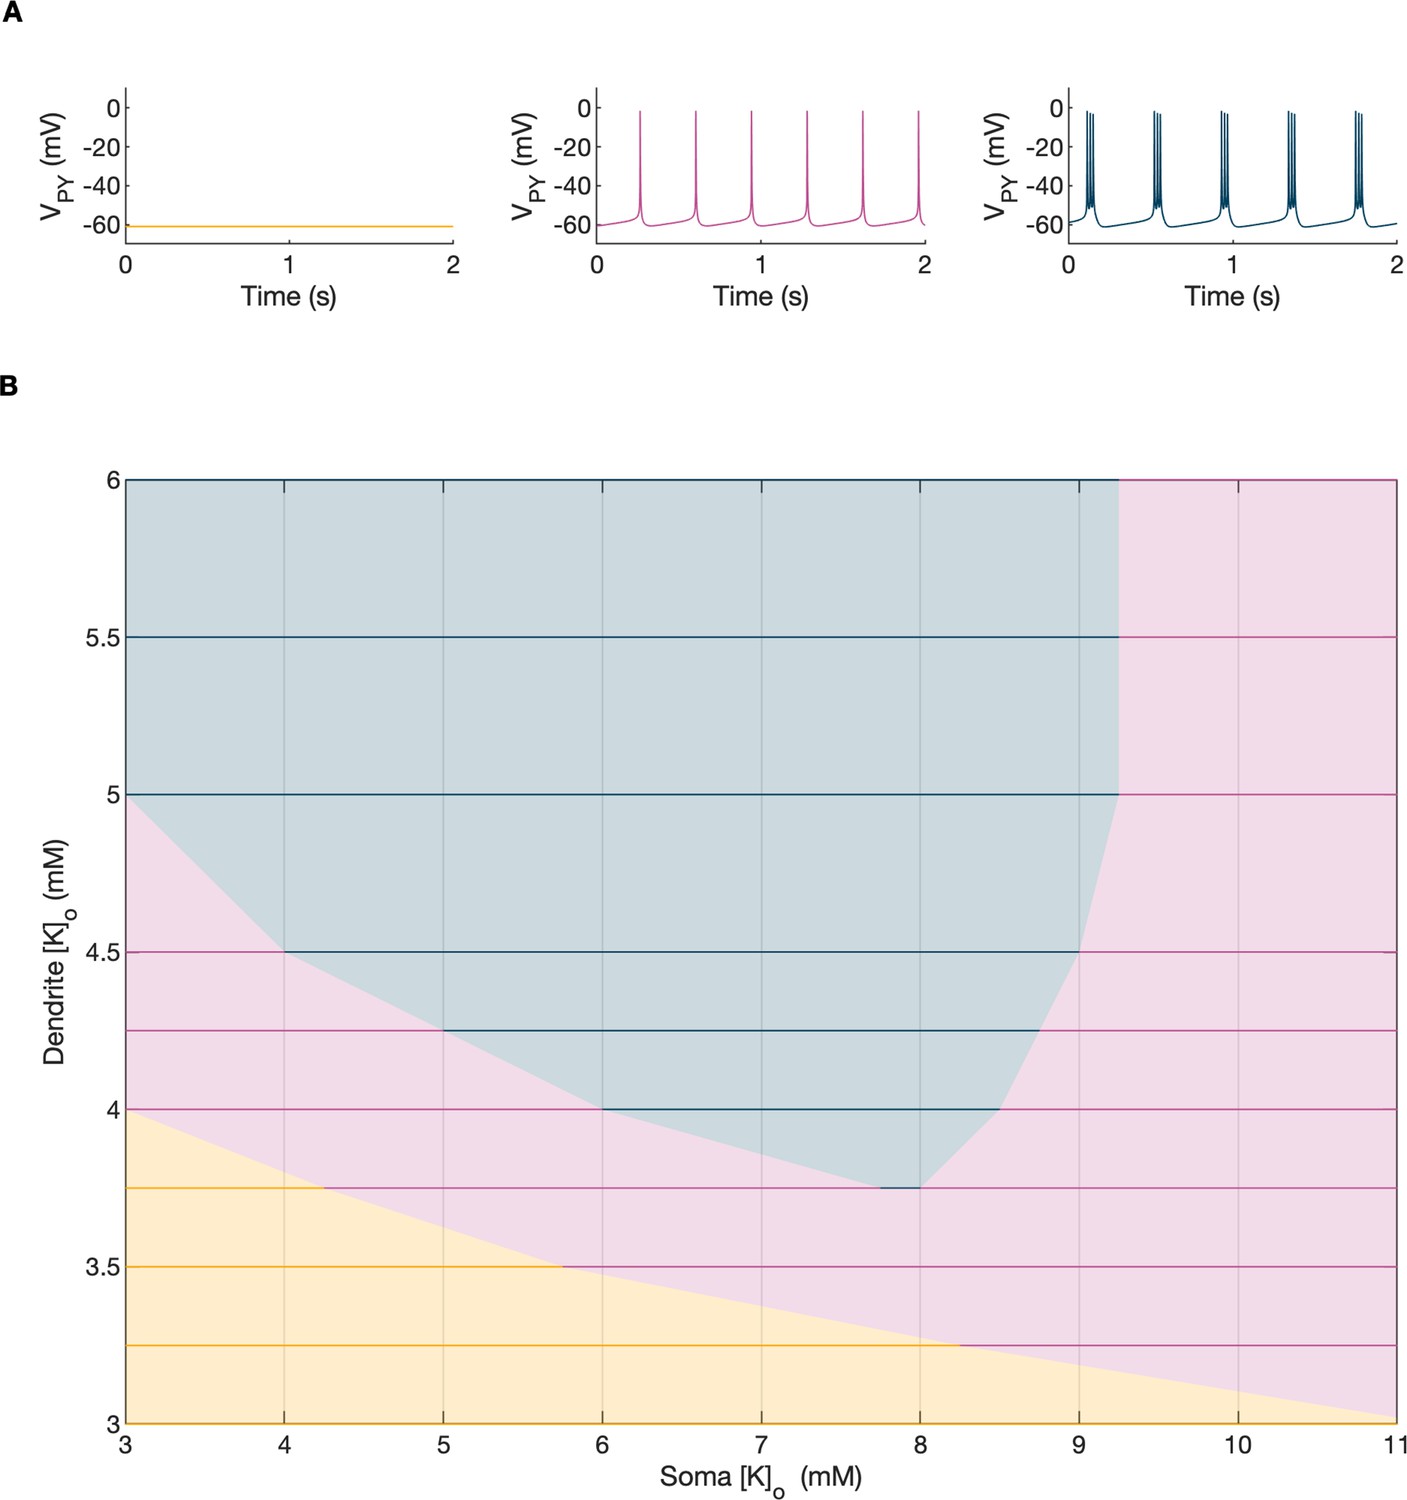
A bifurcation diagram of a single PY cell.
The 2D bifurcation diagram demonstrates the behavior of a single PY cell as a function of extracellular potassium concentration in the dendritic ([K+]o,dend) and somatic compartments ([K+]o,soma) used as control parameters. Concentrations of all other ions were fixed at their reference values (except chloride: [Cl-]i,soma, [Cl-]i,dend equal to 7 mM), all ion accumulation mechanisms were blocked and all synaptic connections were removed. (A) The three graphs show the PY cell activity traces for different values of the control parameters: resting (yellow, [K+]o,soma = 3.5 mM, [K+]o,dend = 3.5 mM), tonic firing (violet, [K+]o,soma = 4.5 mM, [K+]o,dend = 4 mM) and bursting (dark blue, [K+]o,soma = 6.5 mM, [K+]o,dend = 4 mM). In each panel, 2 seconds of activity is shown. (B) The colors of the 2D diagram correspond to the types of activity shown above in (A). For low [K+]o,dend and [K+]o,soma the cell was at rest. A moderate increase in either [K+]o,dend or [K+]o,soma, or both, led to tonic firing. Subsequent increases in these parameters led to bursting.
Appendix 1—figure 2
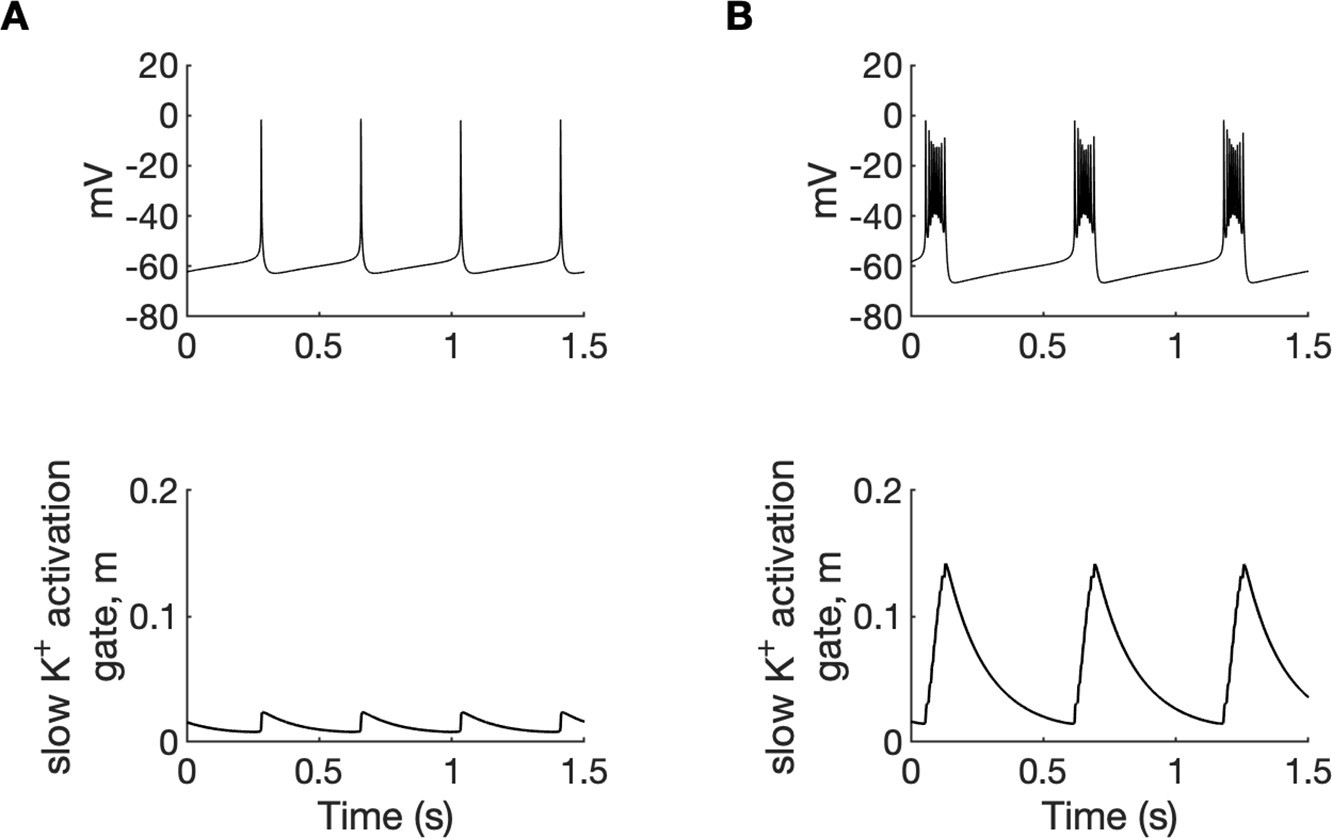
A comparison of tonic firing (A) and bursting (B) of a PY cell.
In each column, the membrane potential of a cell (top) and the activation gate of IKM (bottom) is shown. During tonic firing, the activation gate of the M-type potassium current was closed. The prolonged depolarization of the cell during bursting led to the opening of the activation gate m and activation of the IKM current, which eventually terminated the burst. The simulation was performed using an isolated PY cell model with the concentrations of all ions fixed at their reference values, except [Cl-]i,soma = 7, [Cl-]i,dend = 7 mM and (A): [K+]o,soma = 3.5 mM, [K+]o,dend = 4.5 mM, (B): [K+]o,soma = 5.25 mM and [K+]o,dend = 4.5 mM.
Appendix 1—figure 3
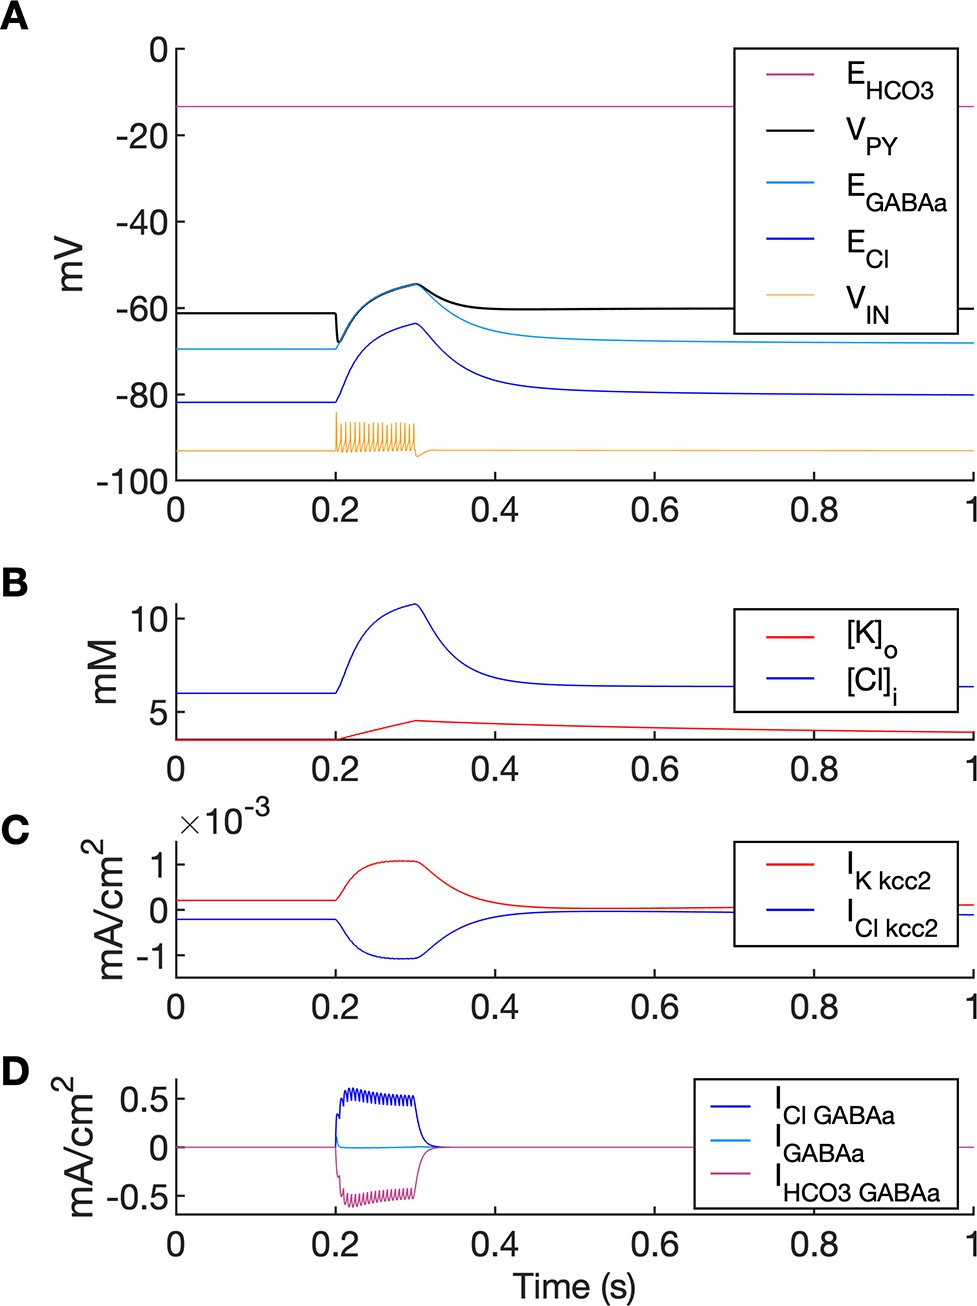
A simulation of biphasic GABAa response.
In this simulation size of both PY compartments was scaled down by factor 10, to represent small dendritic compartments. Single GABAa synapse was located in a segment having diameter 1.5 um and length 2 um (i.e., having volume 1,000 times smaller and GABAa conductance density 100 times larger than soma in the original model). (A) High frequency IN firing (shown schematically by VIN, yellow; not to scale) was induced by IN current stimulation of 100ms duration. GABAa receptor-mediated postsynaptic potential response consisted of the initial hyperpolarization followed by a long-lasting depolarization (VPY, black). Chloride accumulation ((B), blue) was mediated by large Cl- influx via GABAa receptor as compared to Cl- extrusion via KCC2 ((C) vs. (D)). Accordingly, the biphasic potential resulted from positive shift in ECl ((A), blue) and relatively high EHCO3 ((A), violet) leading to depolarizing shift in EGABAa ((A), light blue). During GABAa receptor activation VPY was clamped to EGABAa due to large GABAa conductance density.
Appendix 1—figure 4
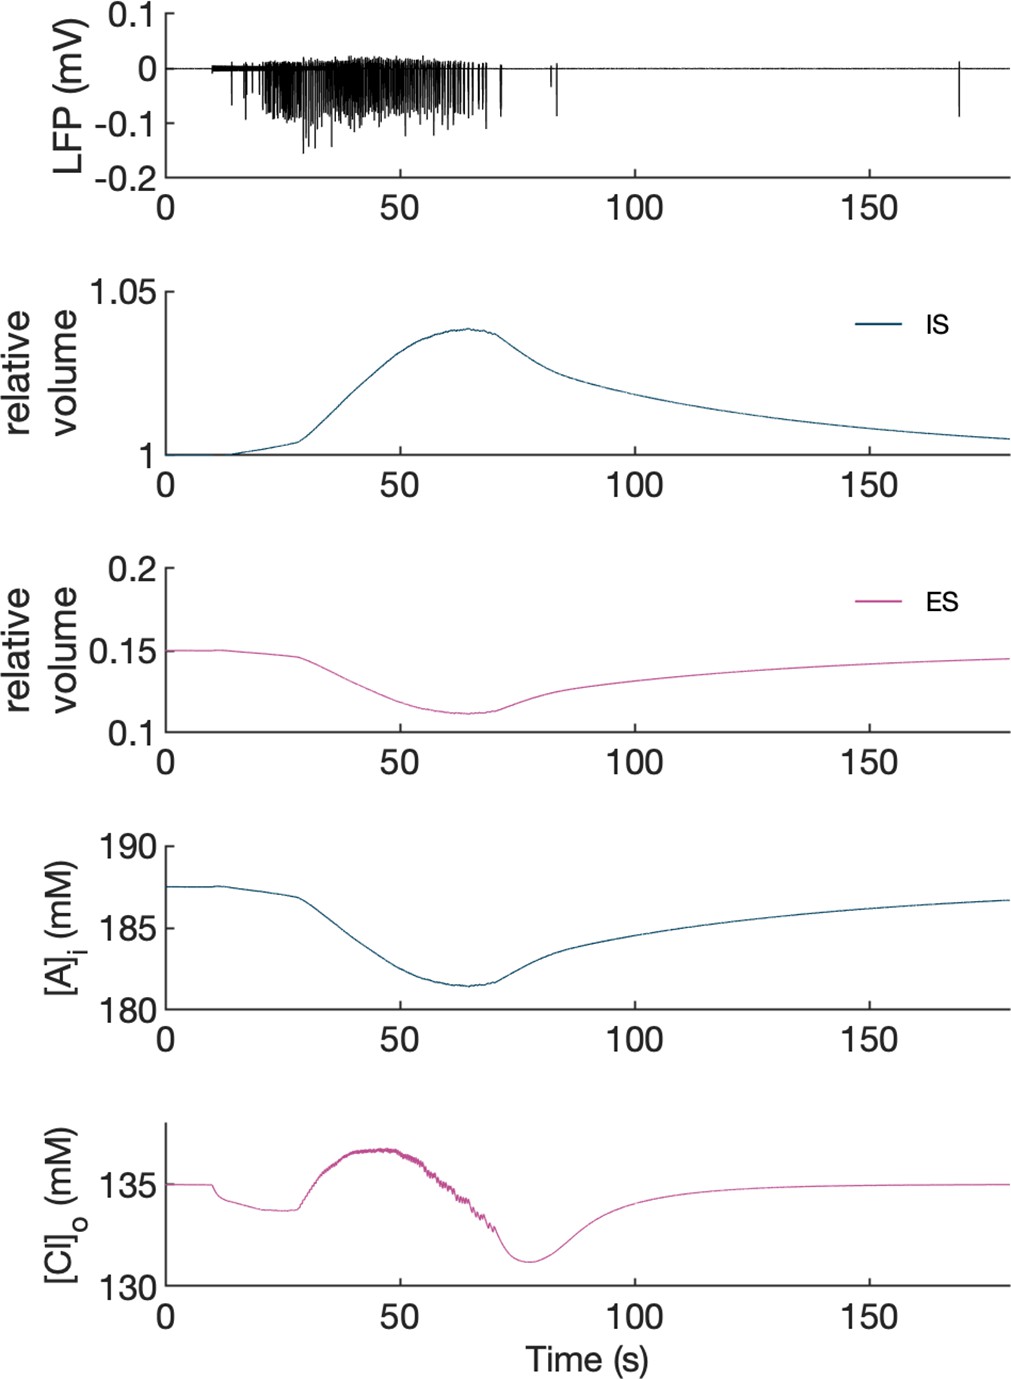
Volume changes during an SLE in the model.
The panels show from top to bottom: LFP, relative volume changes and representative changes in intracellular A- ion and extracellular Cl- concentration in the PY somatic compartment during an SLE. [A-]i was affected only by volume changes while [Cl-]o was additionally affected by inward chloride leak and GABAa currents, KCC2 and Cl- diffusion to the bath. It can be seen that an increase in intracellular space (IS) volume (second panel, dark blue) is exactly mirrored by a decrease in [A-]i. A decrease in extracellular space (ES) volume (third panel, violet) gives rise to an increase in [Cl-]o above baseline despite Cl- influx into the cells, in agreement with the experimental data (Dietzel et al., 1982).
Tables
Table 1
Gating variables of the ionic currents in pyramidal cell model.
| Current | Kinetics/time constant (ms) | |
|---|---|---|
| INa,soma | ||
| INa,dendrite | ||
| INaP | ||
| if : if : | ||
| IKdr,soma | ||
| IKdr,dend | ||
| ICaL | ||
| IKAHP | ||
| IKC, if | ||
| IKC, if | ||
| IKM | ||
Table 2
Conductances used in the model.
| Current conductance | Description | Values (S/cm2) |
|---|---|---|
| gNa,leak,PYsoma | INa,leak conductance in PY soma | 1.5*10–5 |
| gNa,leak,PYdend | INa,leak conductance in PY dendrite | 1.1*10–5 |
| gK,leak,PY | IK,leak conductance in PY soma and dendrite | 3*10–5 |
| gCl,leak,PY | ICl,leak conductance in PY soma and dendrite | 1*10–5 |
| gNa,PYsoma | INa conductance in PY soma | 0.014 |
| gNa,PYdend | INa conductance in PY dendrite | 0.0014 |
| gKdr,PYsoma | IKdr conductance in PY soma | 0.032 |
| gKdr,PYdend | IKdr conductance in PY dendrite | 0.0032 |
| gNaP | INaP conductance in PY soma | 60*10–5 |
| gCaL | ICaL conductance in PY soma and dendrite | 15*10–5 |
| gKAHP | IKAHP conductance in PY soma and dendrite | 5*10–5 |
| gKC | IKC conductance in PY soma and dendrite | 0.196*1e3 |
| gKM | IKM conductance in PY soma | 0.006 |
| gNa,leak,IN | INa,leak conductance in IN | 2.9*10–5 |
| gK,leak,IN | IK,leak conductance in IN | 6*10–5 |
| gCl,leak,IN | ICl,leak conductance in IN | 1*10–5 |
| gNa,IN | INa conductance in IN | 0.013 |
| gKdr,IN | IKdr conductance in IN | 0.027 |
Additional files
Download links
A two-part list of links to download the article, or parts of the article, in various formats.
Downloads (link to download the article as PDF)
Open citations (links to open the citations from this article in various online reference manager services)
Cite this article (links to download the citations from this article in formats compatible with various reference manager tools)
Focal seizures are organized by feedback between neural activity and ion concentration changes
eLife 11:e68541.
https://doi.org/10.7554/eLife.68541


