The dual role of amyloid-β-sheet sequences in the cell surface properties of FLO11-encoded flocculins in Saccharomyces cerevisiae
- Toulouse Biotechnology Institute, INSA, France
- Lallemand, Lallemand SAS, France
- LAAS, CNRS, France
Figures
Figure 1 with 1 supplement

Cell surface analysis of the L69 strain using silicon nitride (Si3N4) atomic force microscopy (AFM) cantilevers.
AFM height images (A) of a single yeast cell from L69 strain embedded in polydimethylsiloxane (PDMS) microtimber are shown. In (B) an AFM contact image is shown in which the topography region that was used to measure the height of the patches at the cell surface reported in (C) is zoomed in with a white circle. . In (D) is illustrated an adhesion image at high resolution of the zoomed area shown in (C) and the stiffness on this zoomed area is shown in E. (F) Shows a typical force-distance curve from which adhesion force stiffness was determined. In (G and H) are reported the distribution of adhesion forces (G) and stiffness (H) as obtained from 1024 force-distance curves on the single cell shown in this figure. In (I and J) are reported the boxplots of maximum adhesion forces and stiffness values from bimodal distribution collected from n = 416,666 force-distance curves on 24 cells from three independent experiments. The boxplots represented the mean values (squares), the medians (horizontal lines), the 25% and 75% quartiles (box limits), and outliers (whiskers).
Figure 1—figure supplement 1
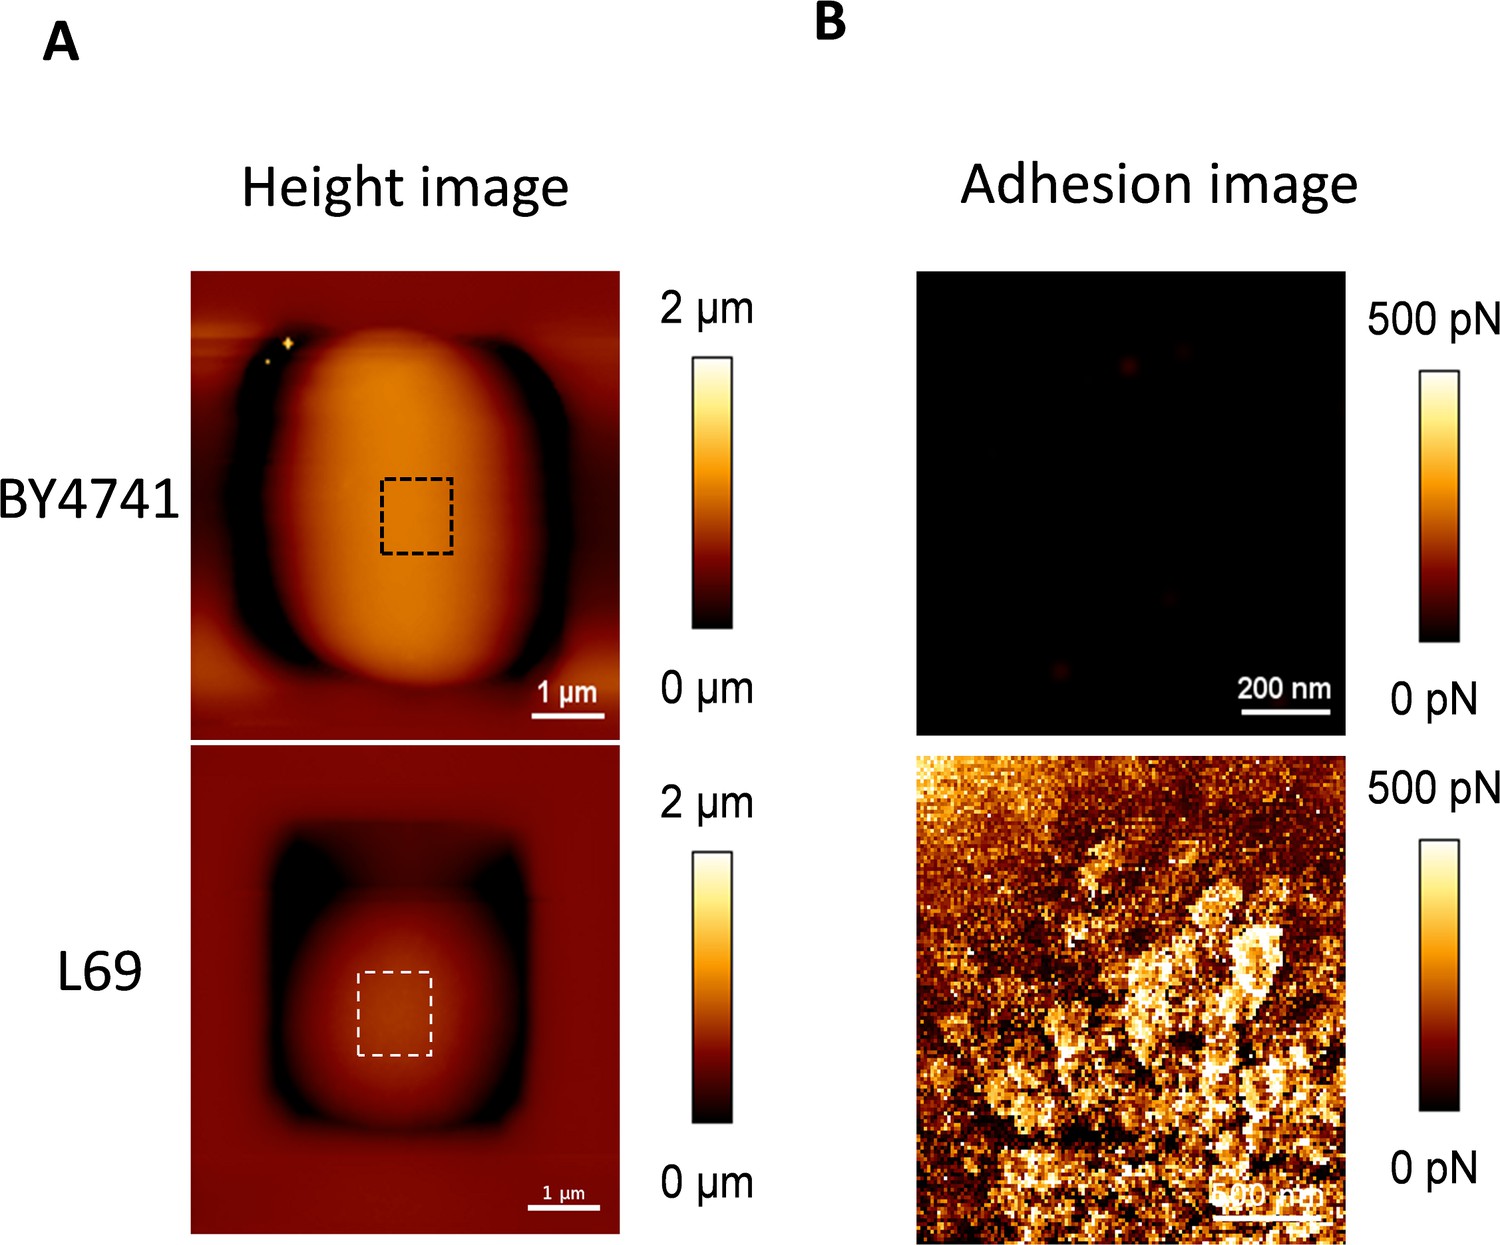
Cell surface analysis of BY4741 and L69 strains using silicon nitride (Si3N4) atomic force microscopy (AFM) cantilevers.
A single cell from strain BY4741 and L69 was trapped in the polydimethylsiloxane (PDMS) chamber as described in Materials and methods. AFM height image (z-scale: 2 µm) (A) and adhesion image (z-scale: 500 pN) analysed on the hatched square of the height image (B) were recorded in QI mode.
Figure 2 with 1 supplement
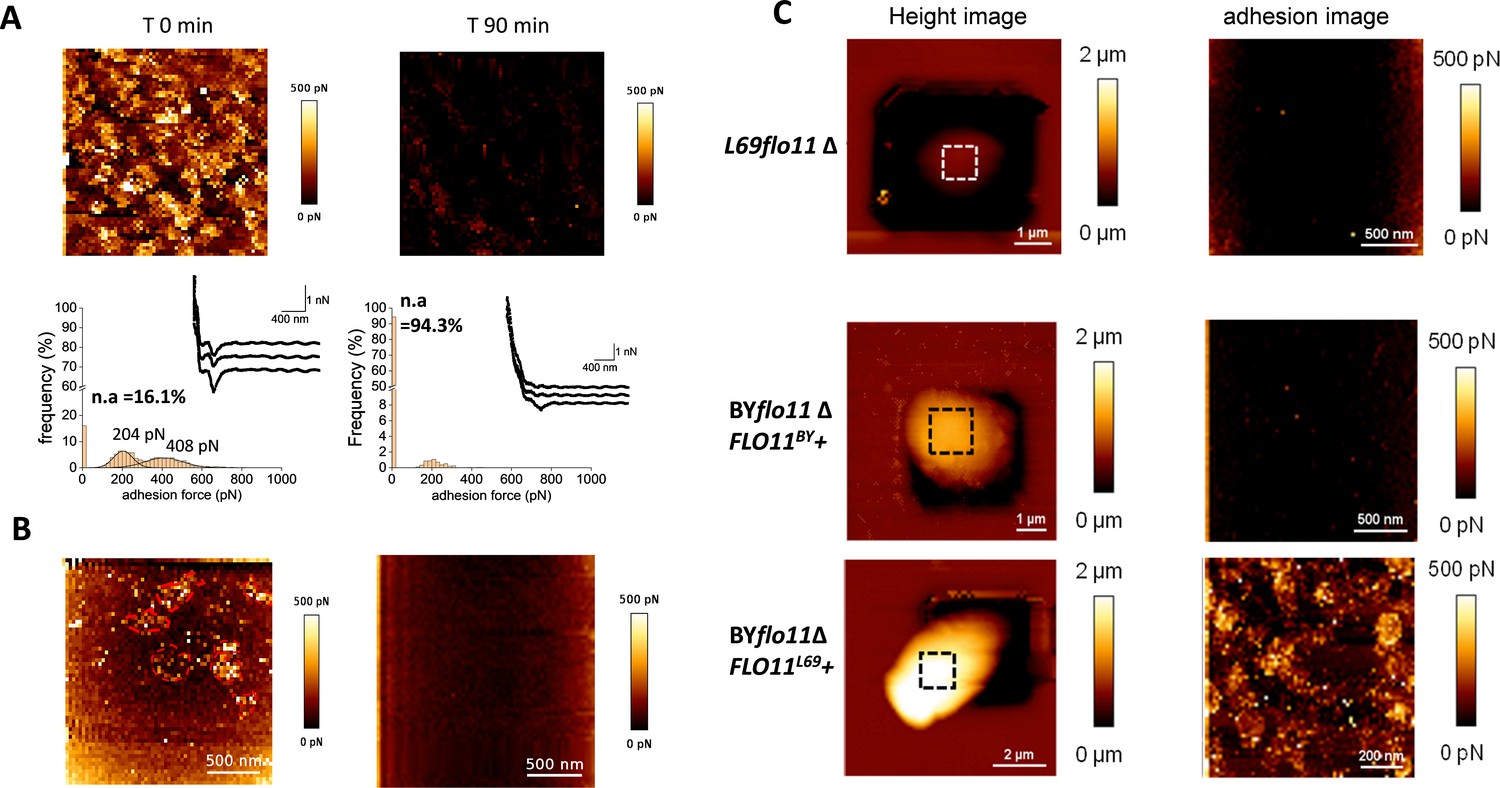
The nanosized patches at the cell surface of L69 strain are FLO11-dependent adhesion nanodomains that are abolished by anti-amyloïd compounds.
In (A) is shown the atomic force microscopy (AFM) adhesion image of a cell from L69 strain before and 90 min after treatment with 5 µM of the anti-amyloid peptide VASTTV. In (B) is shown the adhesion image of a cell from a culture of L69 strain (107 cells/ml) before and after 30 min of incubation with 10 µM of the anti-amyloid dye thioflavin S. In (C) are AFM height images and adhesion images of a single cell of the flo11Δ mutant from L69 strain and of the laboratory BY4741 strain deleted of its endogenous FLO11 gene (BYflo11Δ) and transformed with pYES 2.1 carrying FLO11 of (BYflo11Δ FLO11BY+), or FLO11 from L69 (BYflo11∆ FLO11L69+).
Figure 2—figure supplement 1
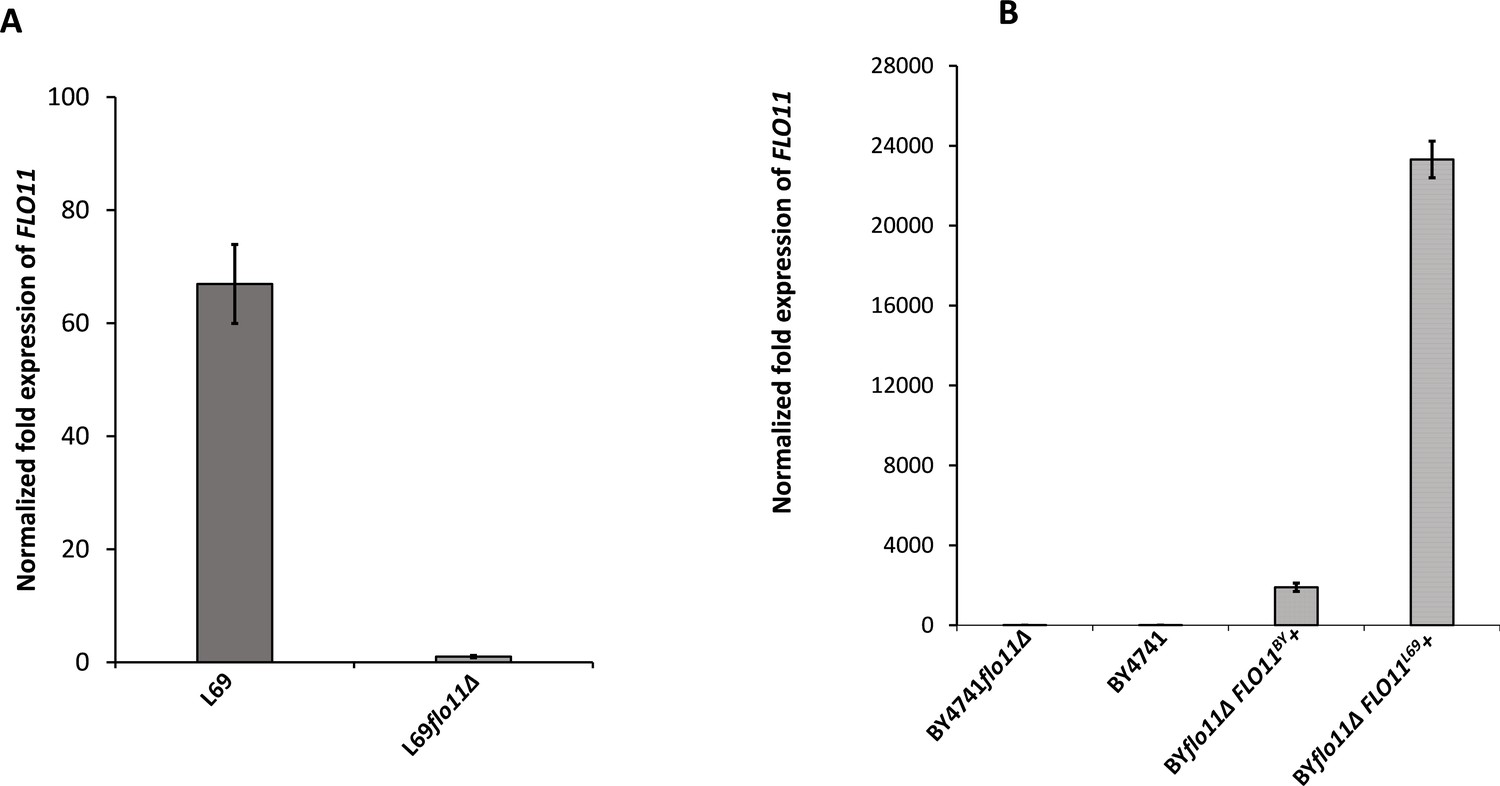
Expression levels of FLO11 in L69 and BY4741 strain measured by quantitative reverse transcription PCR (qRT-PCR).
Transcript levels of FLO11 were determined in exponential cultures of L69 and BY4741 strains on YPD (A) or on YNGal supplemented with required amino acids, uracil, and adenine at 0.1% (w/v), except for BY4741 transformed with FLO11BY or FLO11L69 for which uracil was omitted. The transcripts were normalized to internal reference genes TAF10 and UBC6.
Figure 3 with 5 supplements
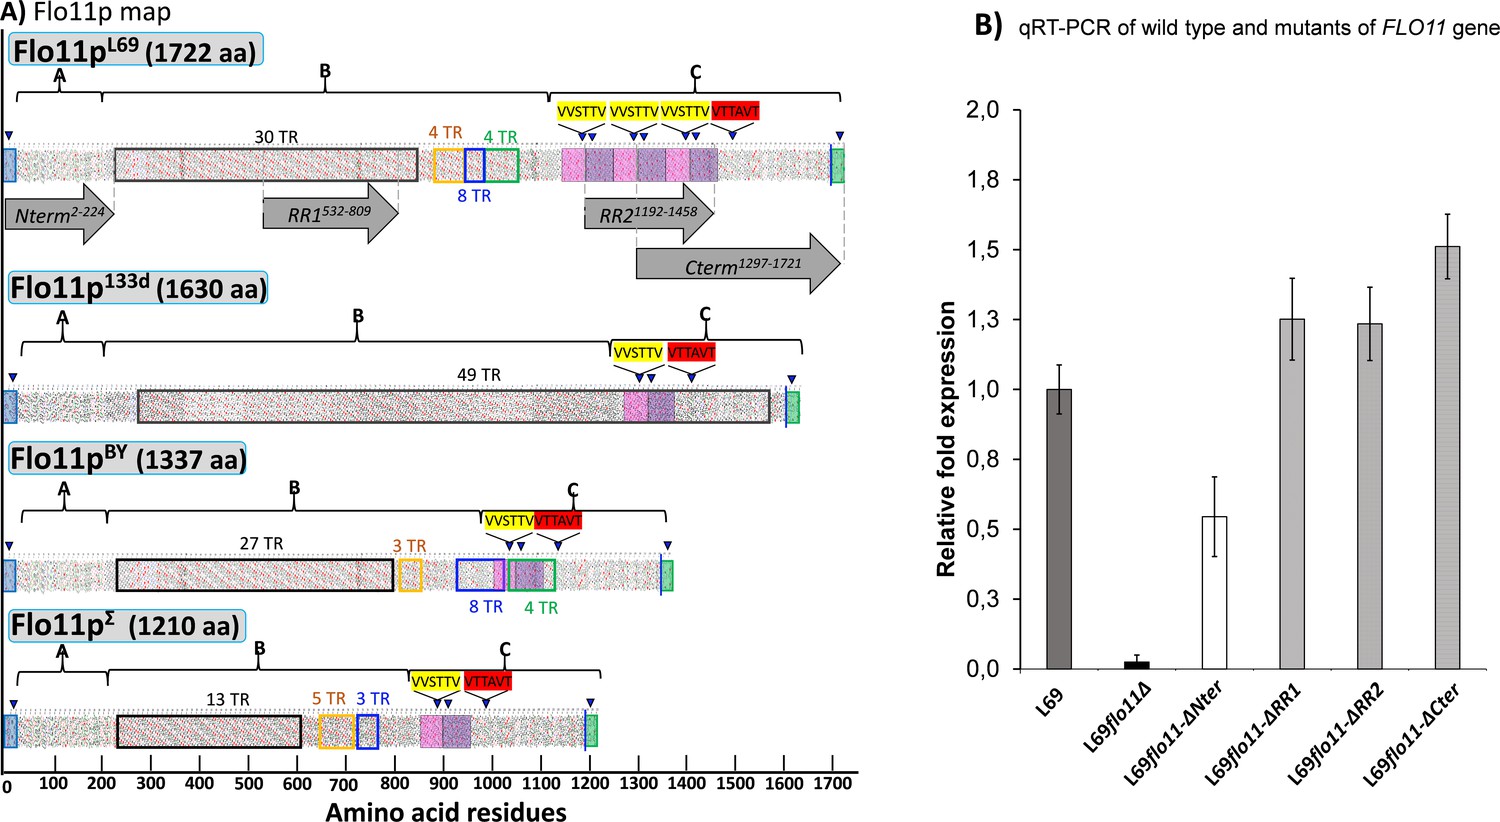
Hydrophobic cluster analysis (HCA) of the Flo11 protein from various Saccharomyces cerevisiae strain, and quantitative reverse transcription PCR (qRT-PCR) of wild-type and mutated FLO11 genes.
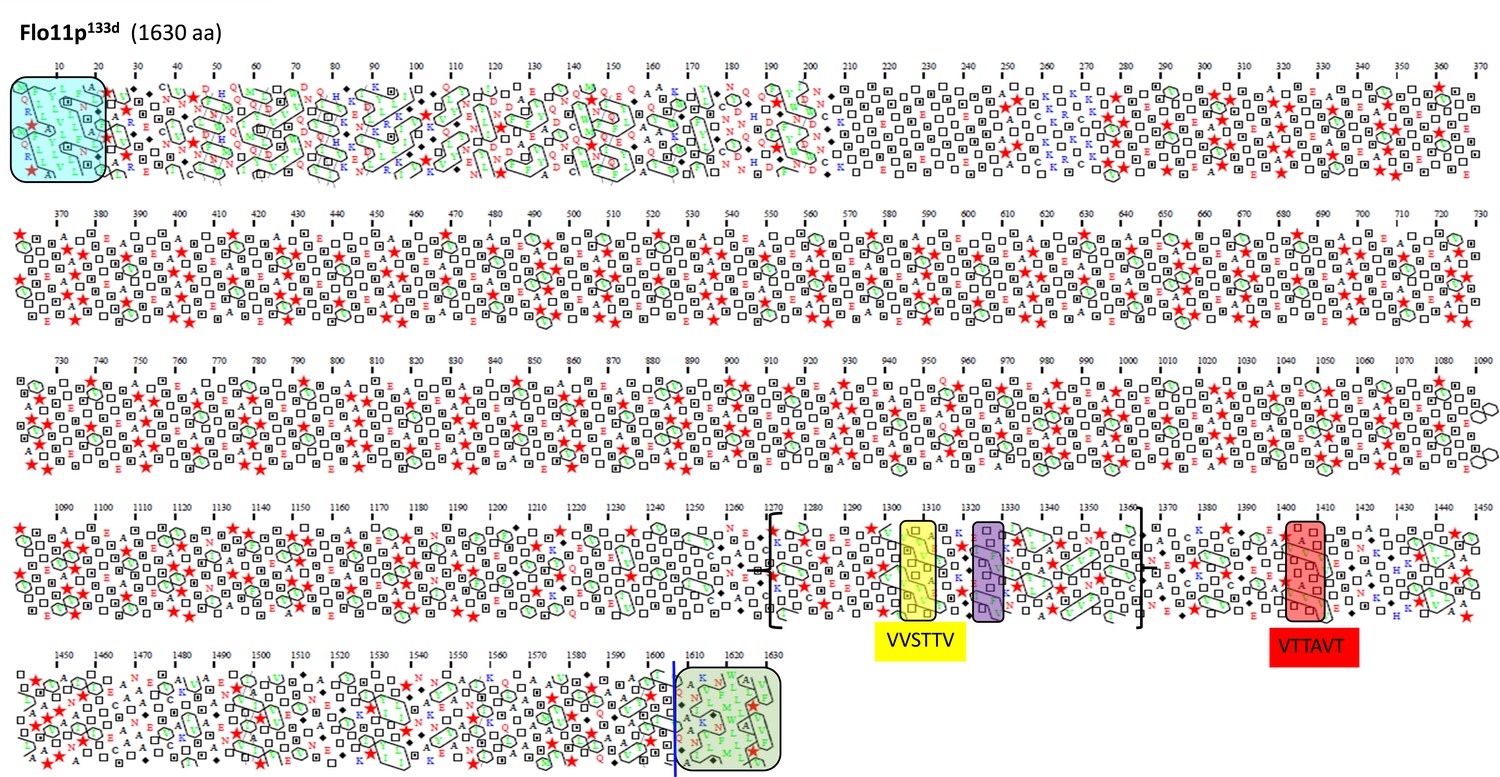
In (A) is reported the HCA plots of Flo11p from wine yeast strain L69, Flor strain 133d, and laboratory strains BY4741 and Σ1278b. The three domains of the proteins as determined using various software as described in Materials and methods are highlighted by letters A, B, and C. Tandem repeat (TR) domains are shown as unshaded boxes with each colour addressed to a specific repeat. Blue triangles indicate regions with a β-aggregation potential superior to 30% in TANGO software and amyloid-forming sequences are indicated in yellow for ‘VVSTTV’ and red for ‘VTTAVT’. Pink and purple boxes stand for two sequence repeated three times in Flo11p L69 and present only one time in the Flo11p of the other three strains. The C-terminal glycosylphosphatidylinositol (GPI) signal is boxed in green with a blue line indicating the omega-site position (GPI signal anchorage to cell wall β-glucan). Grey arrows delimit the N-terminal, RR1, RR2, and C-terminal domains. In (B) is reported the quantitative expression levels of the different FLO11 alleles encoding the corresponding Flo11 protein variants relative to the expression level of wild-type FLO11 in L69 strain. Samples for this qRT-PCR were taken in exponential growth phase on YN galactose medium. Normalization of transcripts was done using TAF10 and UBC6 as internal reference as described in Materials and methods.
Figure 3—figure supplement 1
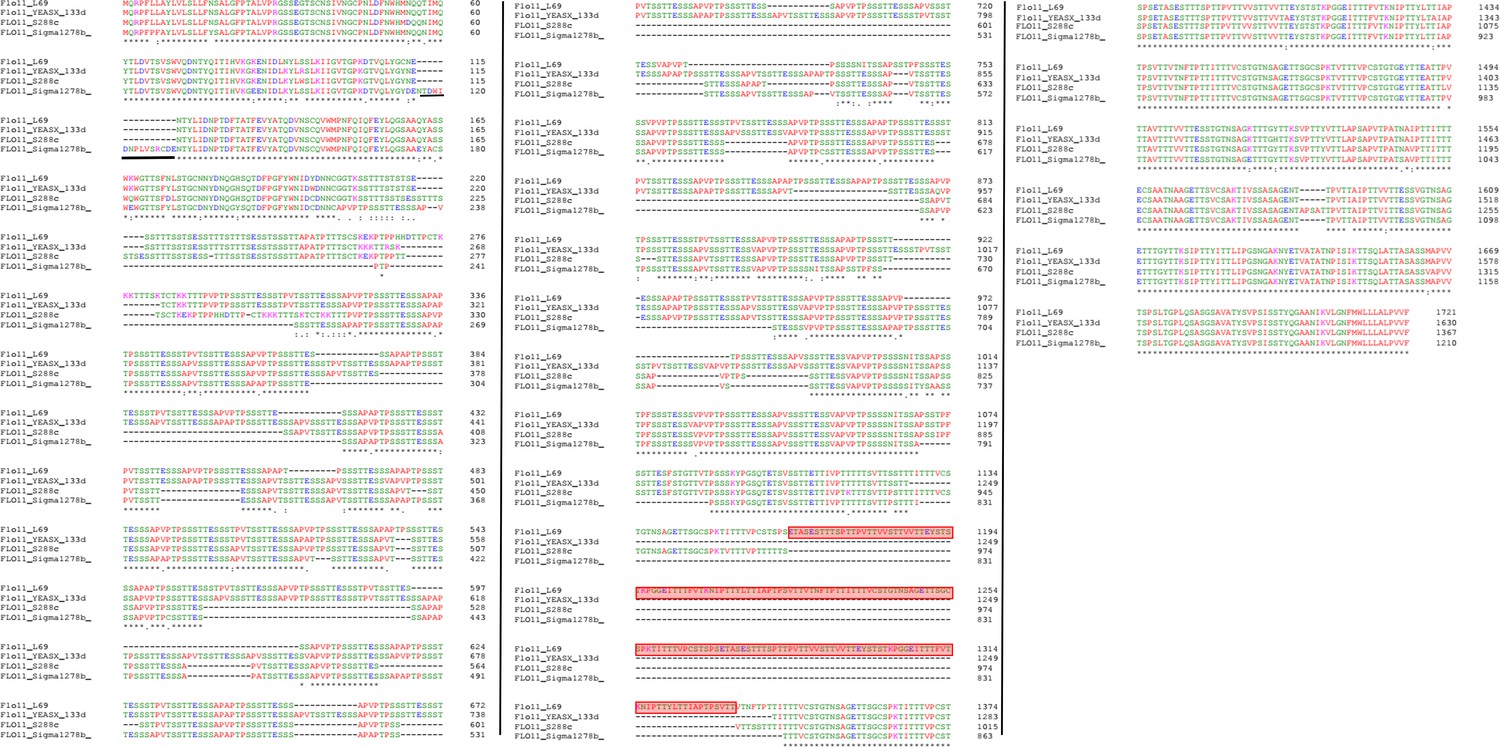
Sequences alignment of Flo11p from L69, BY4741, S1278b, and 133d strains.
The Flo11p sequences were aligned with Clustal Omega. The sequence of Flo11p from L69 strain was retrieved from the genome sequence of this strain (Lallemand Inc, unpublished data), whereas Flo11p from BY4741, S1278B, and 133d were retrieved from public repository data at NCBI. Boxed in red indicate amino acid sequence (RR2) present in Flo11p of L69 strain and absent in Flo11p of the other strains. Asterisks indicate positions with identical amino acids, dots indicate single amino acid difference between amino acid sequences. Black bar highlights the unique 15 amino acid sequence in the Flo11 of S1278b strain.
Figure 3—figure supplement 2
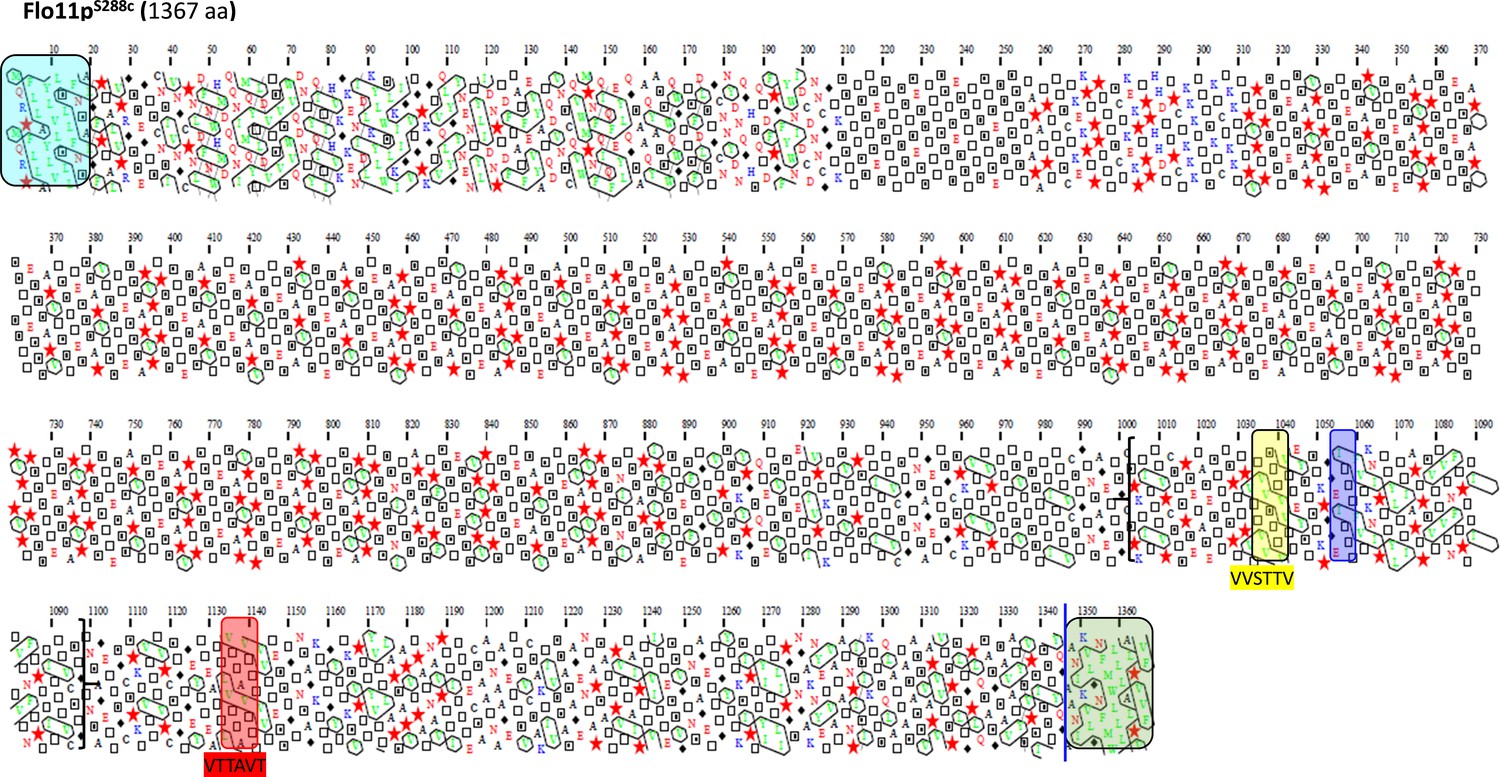
Schematic representation of the Flo11 protein sequence from BY4741 strain by hydrophobic cluster analysis.
The Flo11p from BY4741 strain is shown with the N-terminal secretion signal sequences boxed in blue determined with SignalP-4.1 server and the C-terminal glycosylphosphatidylinositol (GPI) addition signals using PredGPI tool, boxed in green with a blue line indicating the omega-site position (GPI signal anchorage to cell wall β-glucan) which includes a β-aggregation motif FMWLLA. Amyloid-core sequences ‘VVSTTV’ or ‘VTTAVT’ are highlighted in yellow and red boxes. The ITTTFV β-aggregation motif that specifically follows the first amyloid-forming sequence is shown as violet box. Between bracket is the amino acids sequence that is found times repeated in Flo11p of L69 strain.
Figure 3—figure supplement 3
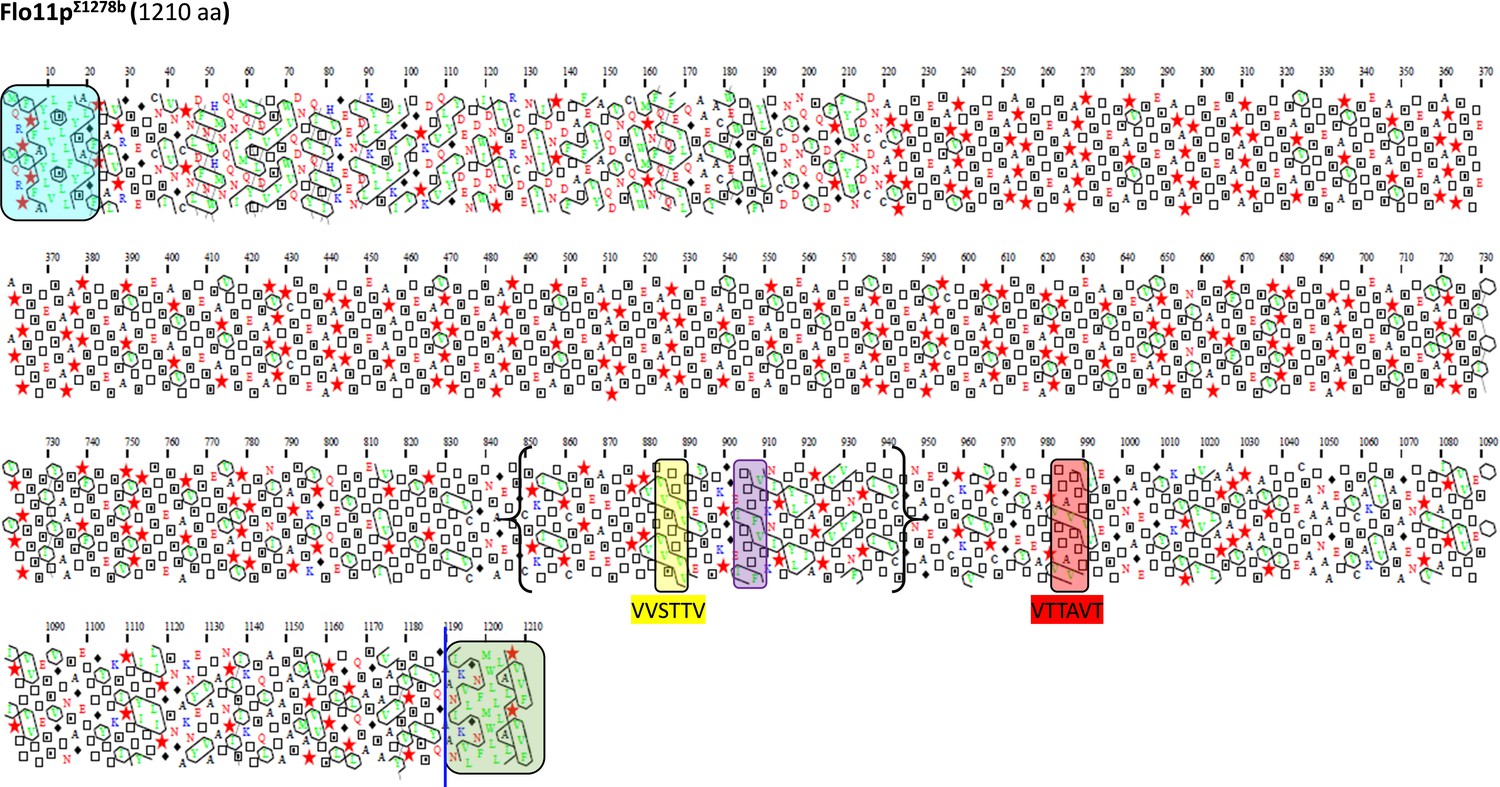
Schematic representation of the Flo11 protein sequence from S1278b strain by hydrophobic cluster analysis.
Same description as in Figure 4.
Figure 3—figure supplement 4
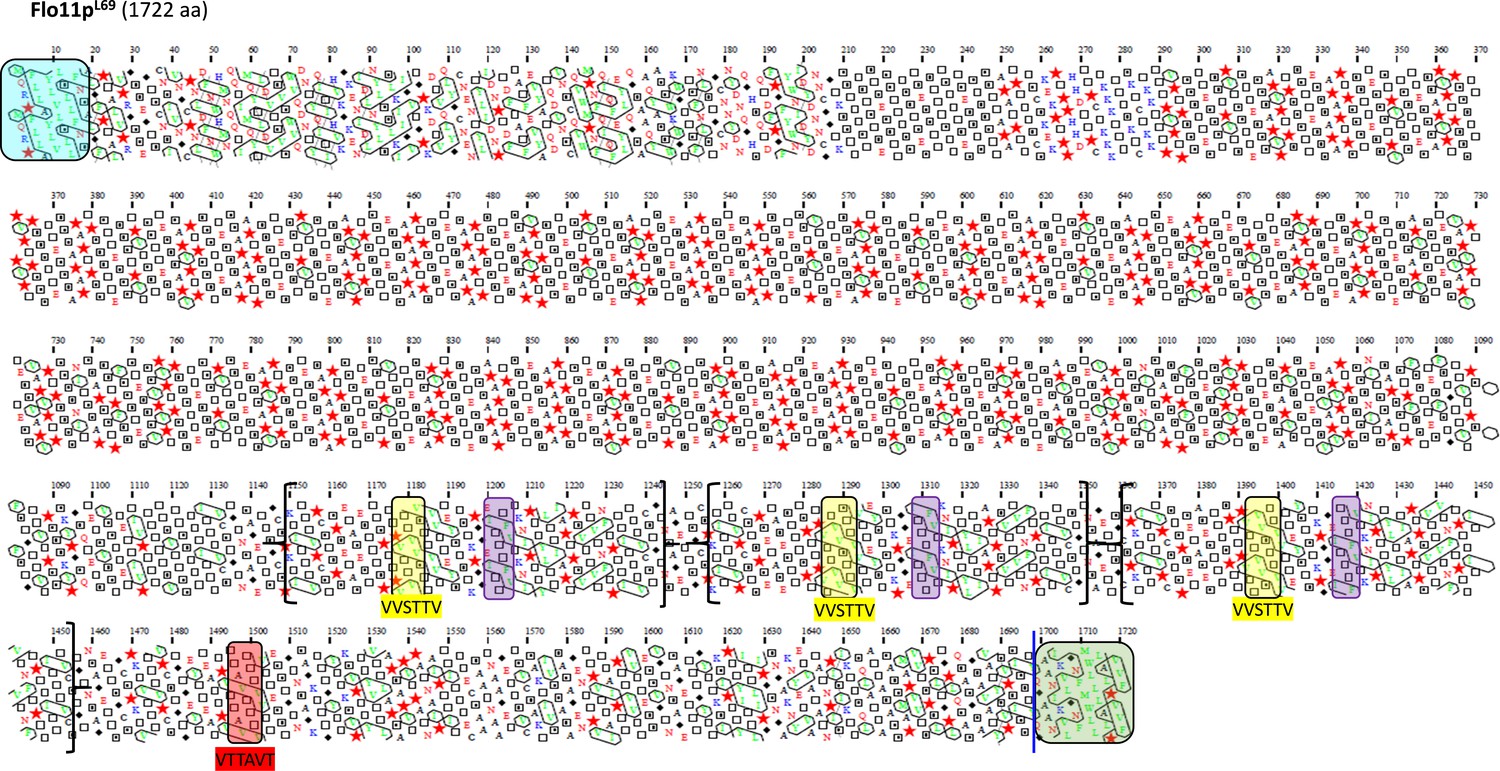
Schematic representation of the Flo11 protein sequence from L69 strain by hydrophobic cluster analysis (HCA).
Same as in Figure 4. Notice the presence of two additional amyloid-forming sequences, together with two additional β-aggregation motifs ITTTFV in this protein that are not present in Flo11p of all the other strains. In brackets is indicated the region that has been duplicated in the Flo11p to yield these two additional amyloid-β-aggregation-prone sequences in the Flo11p of L69 strain.
Figure 3—figure supplement 5
Schematic representation of the Flo11 protein sequence from flor yeast strain 133d by hydrophobic cluster analysis.
Same description as in Figure 4.
Figure 4
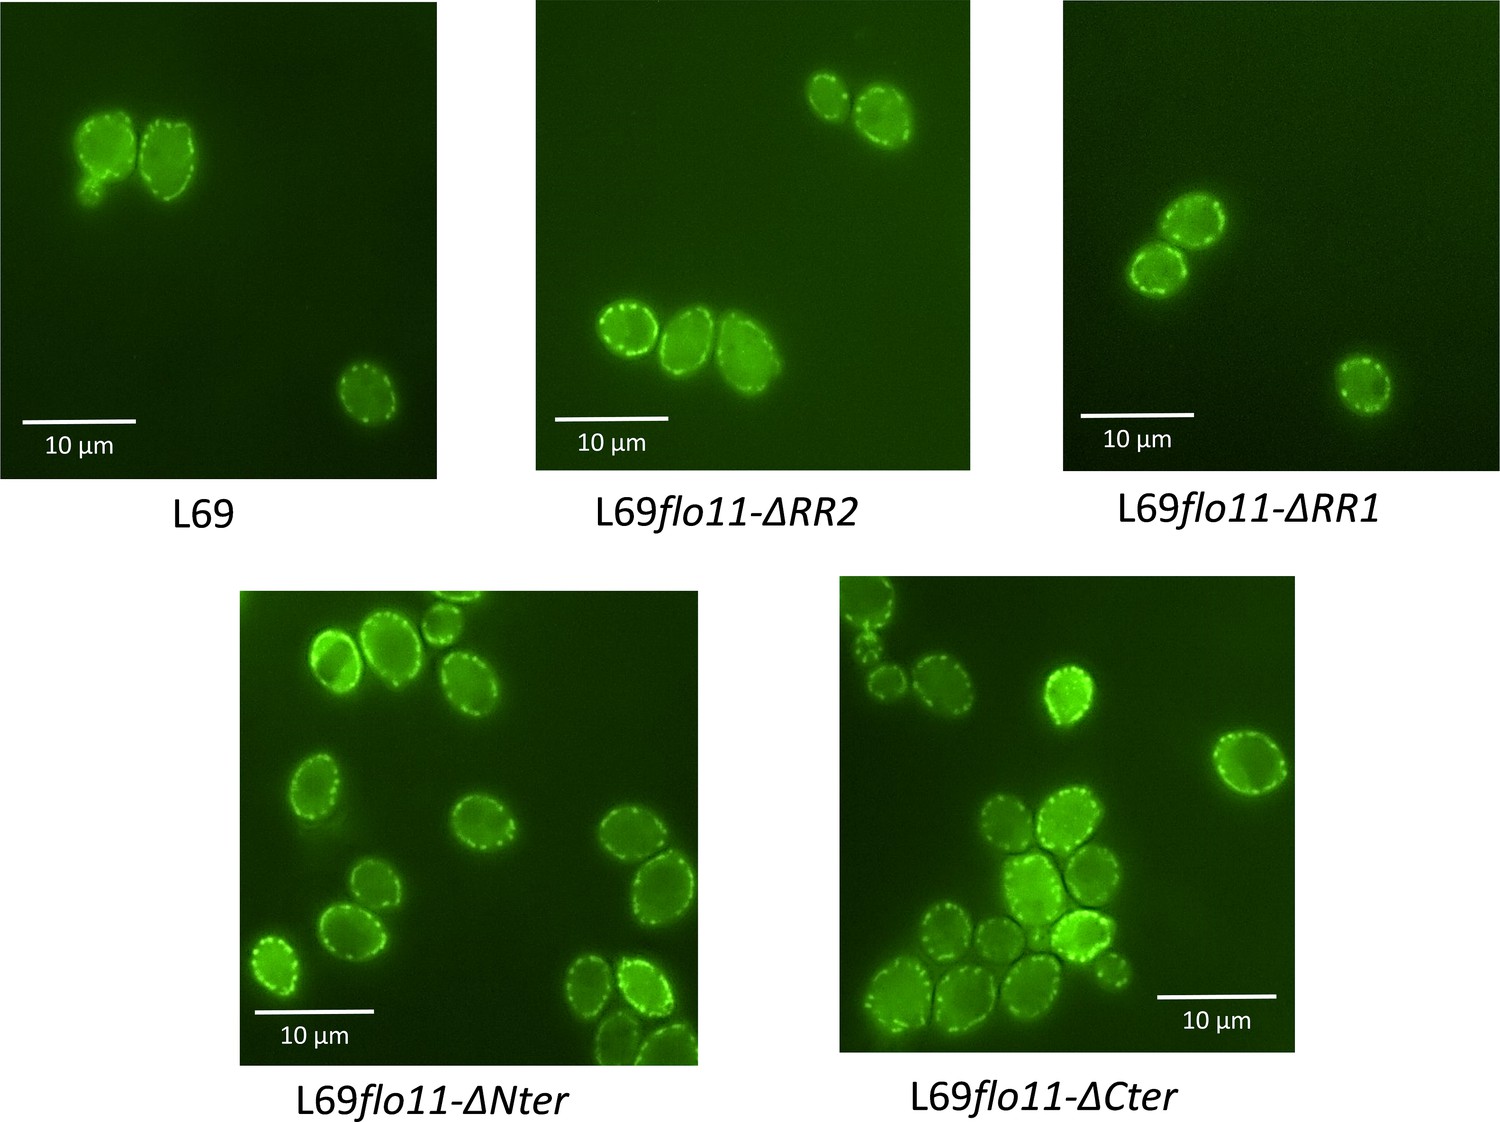
The cell wall localization of Flo11p is not impaired by removal of C-terminus, as well as of N-terminus or ablation of RR2 region bearing amyloid-core sequences.
Localization of Flo11p and its variants was visualized by confocal microscopy in strain L69 that expressed a 6x-His-tag at the C-terminus of the Flo11 or its variants from the endogenous FLO11 promoter grown on YPD% and taken at the exponential phase of growth.
Figure 5 with 3 supplements
Domain in the Flo11p of L69 responsible for the production of adhesive nanodomains.
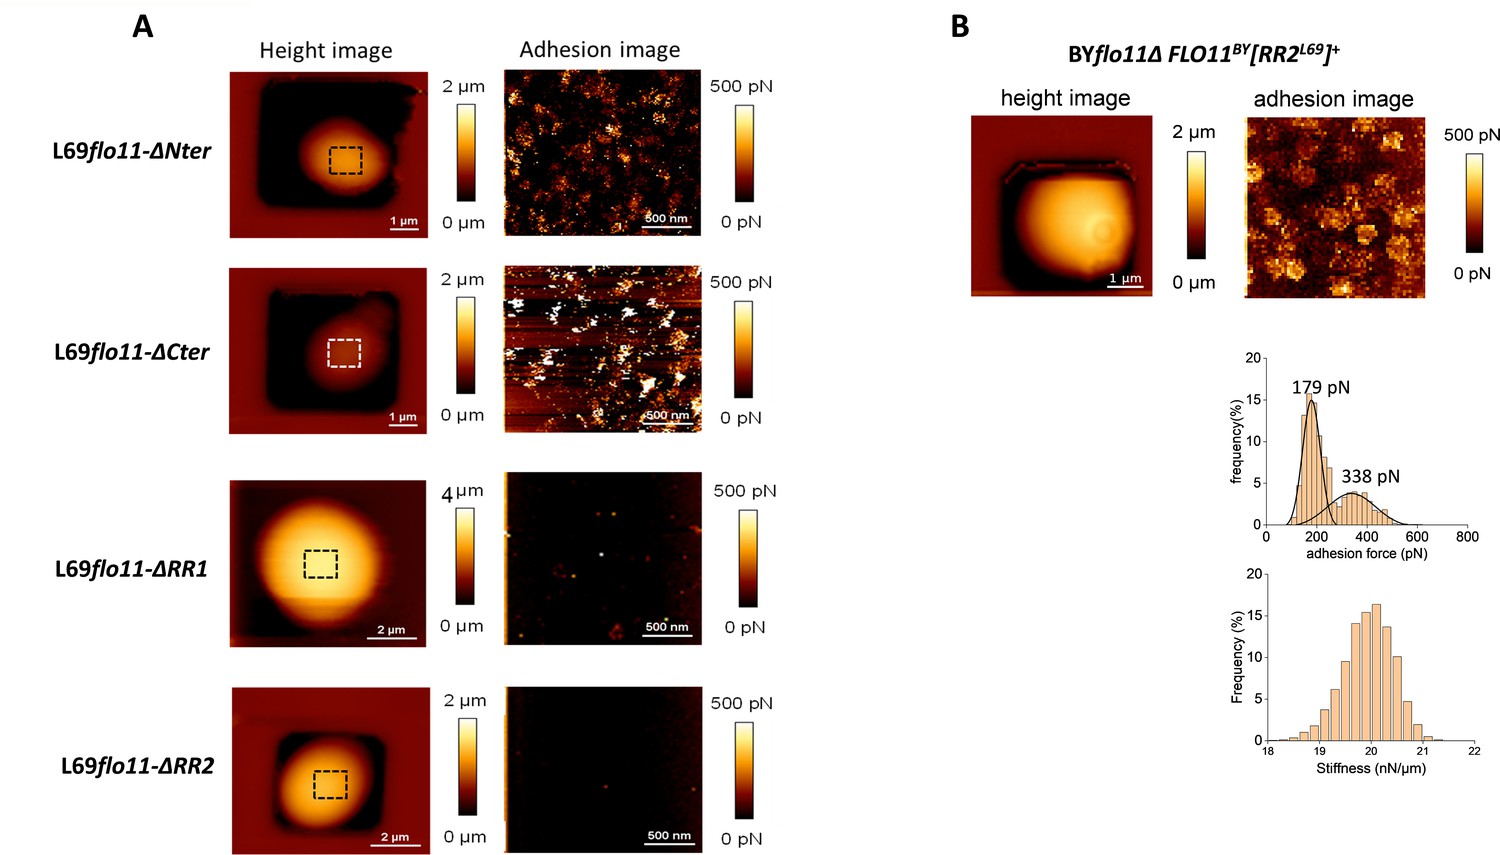
In panel (A) are shown atomic force microscopy (AFM) height image (a) and adhesion image (b) of a single cell from L69 strain expressing Flo11p defective of the N-terminus (flo11-ΔNter), C-terminus (flo11-ΔCter), or removed from the RR1 (flo11-ΔRR1) or RR2 (flo11-ΔRR2) domain as depicted in Figure 3A. In (B) is shown AFM height and adhesion images of a single cell from BYflo11Δ strain transformed with pYES2.1 carrying the chimeric FLO11BY[RR2]L69 gene that corresponded to wild-type FLO11 of BY4741 in which RR2 sequence from FLO11 of strain L69 has been inserted.
Figure 5—figure supplement 1
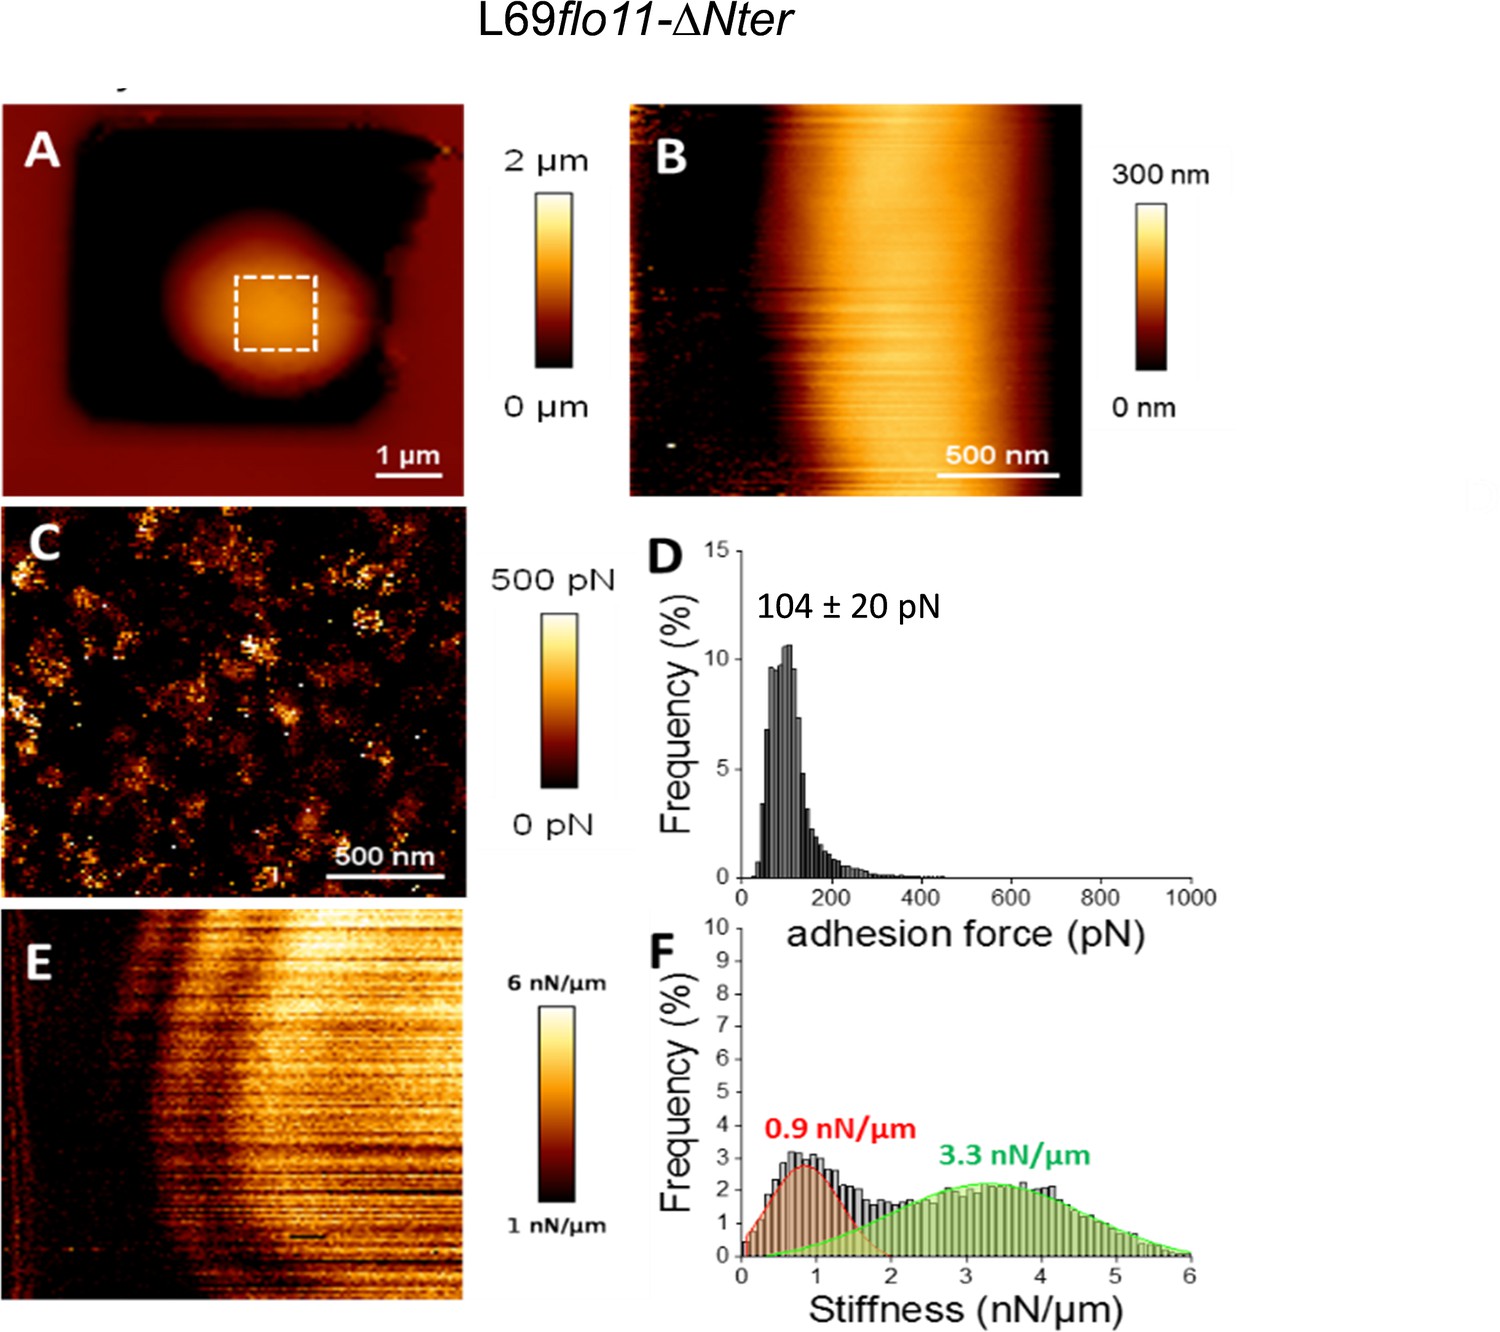
Cell surface analysis of the L69flo11-ΔNter strain using silicon nitride (Si3N4) atomic force microscopy (AFM) cantilevers.
AFM height image (A, B), adhesion image from the hatched square in A (C) and stiffness image (E) of a single yeast cell from L69 flo11-DNter trapped in a polydimethylsiloxane (PDMS) chamber is shown. In (D) is reported the adhesion force histogram obtained from 1024 force-distance curve recorded in QI mode on the area of cell surface illustrated in (C). In (F) is reported the stiffness histogram from 1024 force-distance curve recorded in QI mode. See Figure 2 and Materials and methods for the visualization and quantitative determination of adhesion force and stiffness from the force-distance curves.
Figure 5—figure supplement 2
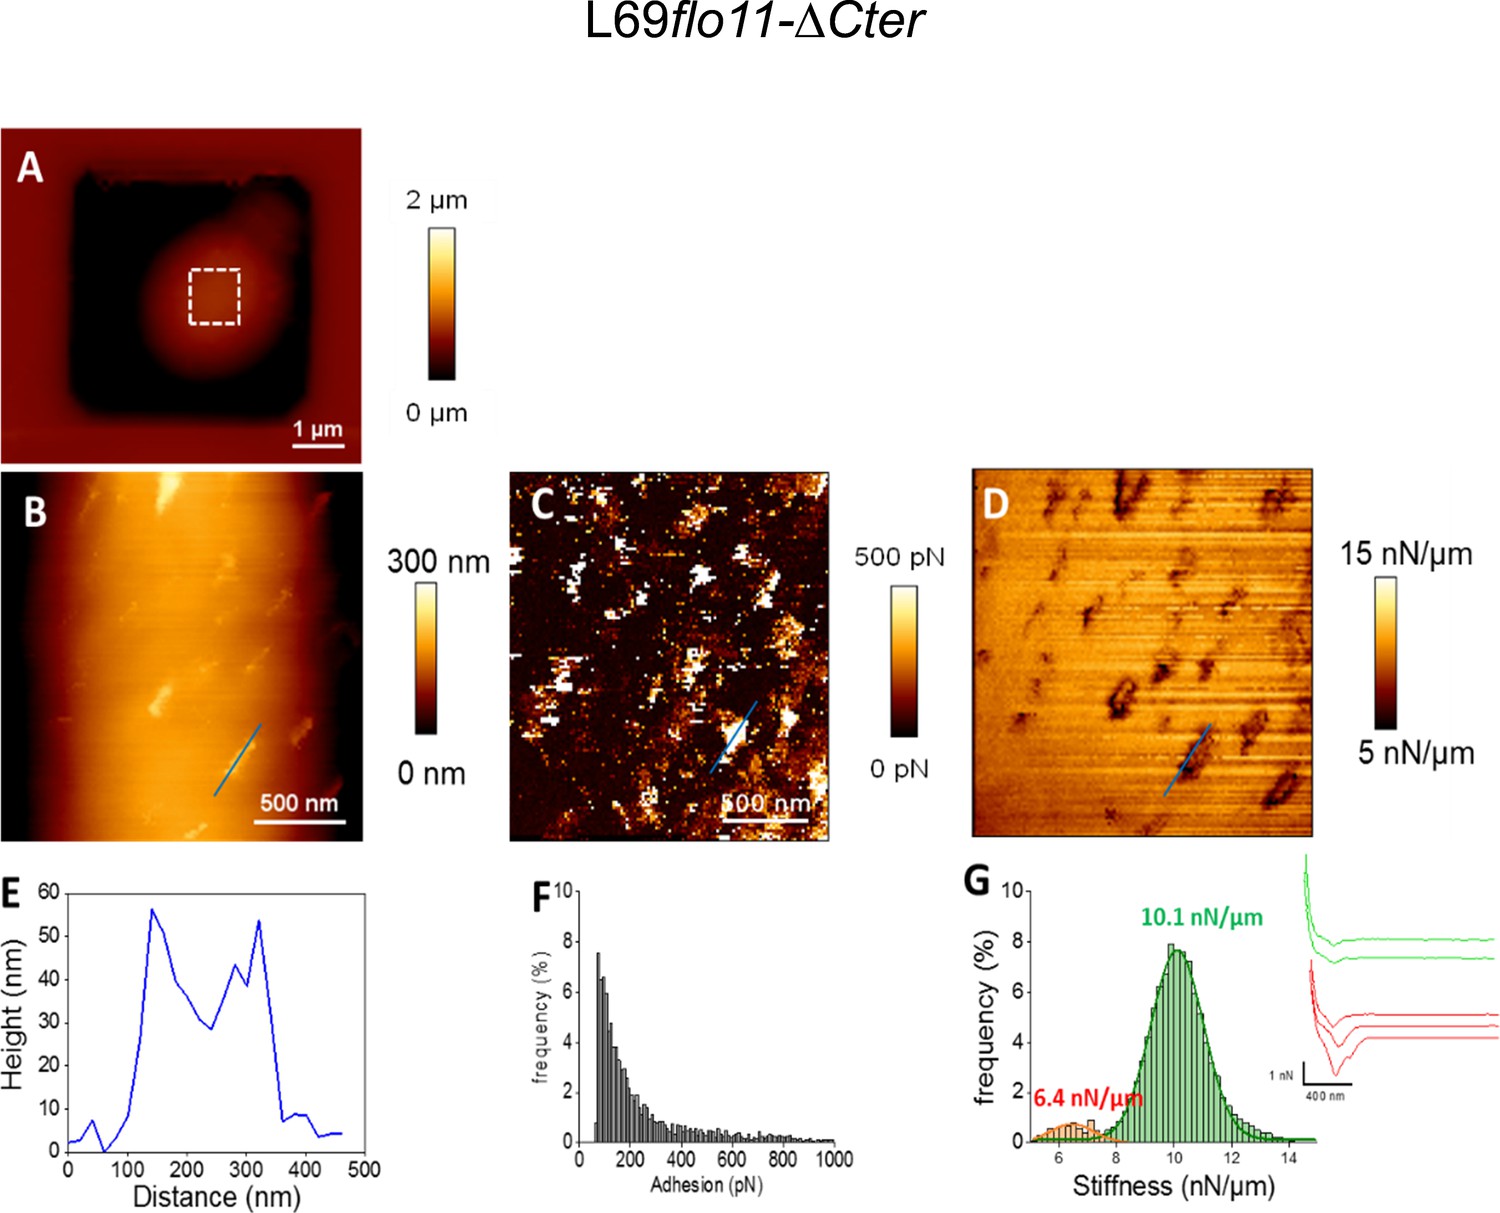
Cell surface analysis of the L69flo11-ΔCter strain using silicon nitride (Si3N4) atomic force microscopy (AFM) cantilevers.
AFM height image (A, B), adhesion image (C), and stiffness image (D) of a single yeast cell from L69 flo11-DCter is shown. In (E) is shown the height of the patches versus their size as indicated by blue line in the adhesion image in (B). In (F) is reported the adhesion forces histogram obtained from 1024 force-distance curve recorded in QI mode and in (G) the corresponding stiffness, with illustration of a few distance curves on the left of the (G) figure.
Figure 5—figure supplement 3
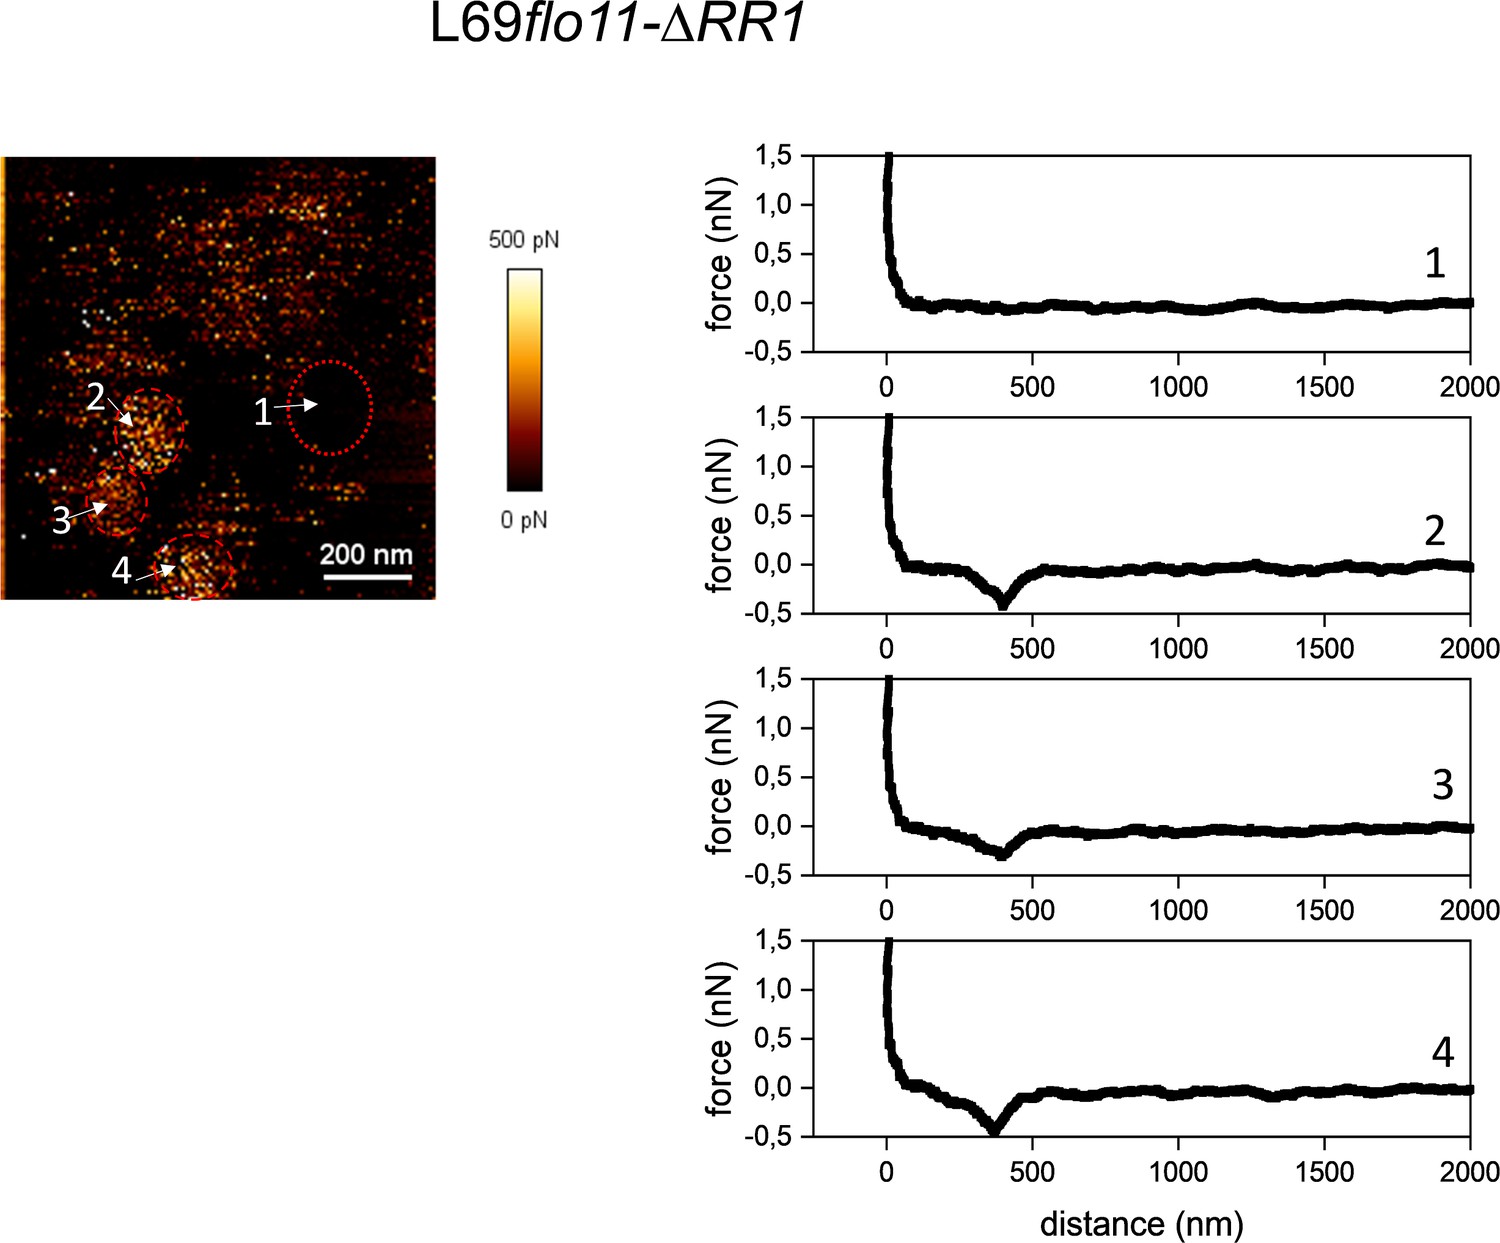
Cell surface analysis of L69flo11-ΔRR1 using silicon nitride (Si3N4) atomic force microscopy (AFM) cantilevers.
Representative force-distance curves (right) at different location on the AFM adhesion image (left) indicated by a number obtained from a single cells of L69flo11-DRR1 embedded in polydimethylsiloxane (PDMS) chamber.
Figure 6 with 1 supplement

The Flo11p-dependent cell-cell aggregation is potentiated by amyloid-forming sequences.
The yeast cells were cultivated as in Figure 5 but until entry in stationary phase and observed under an optical microscope. In (A) are shown representative photographs of cell aggregates from the various strains studied. In (B) is represented for each strain the percentage of aggregates that are formed by at least five or more cells. For each strain, more than 100 cells or aggregates were counted under the microscope. Values shown are the mean of three biological replicates and vertical bars represent standard deviations. Significant differences are denoted with asterisks (*=p-value < 0.05; **=p-value ≤ 0.01;***=p-value ≤ 0.005).
Figure 6—figure supplement 1
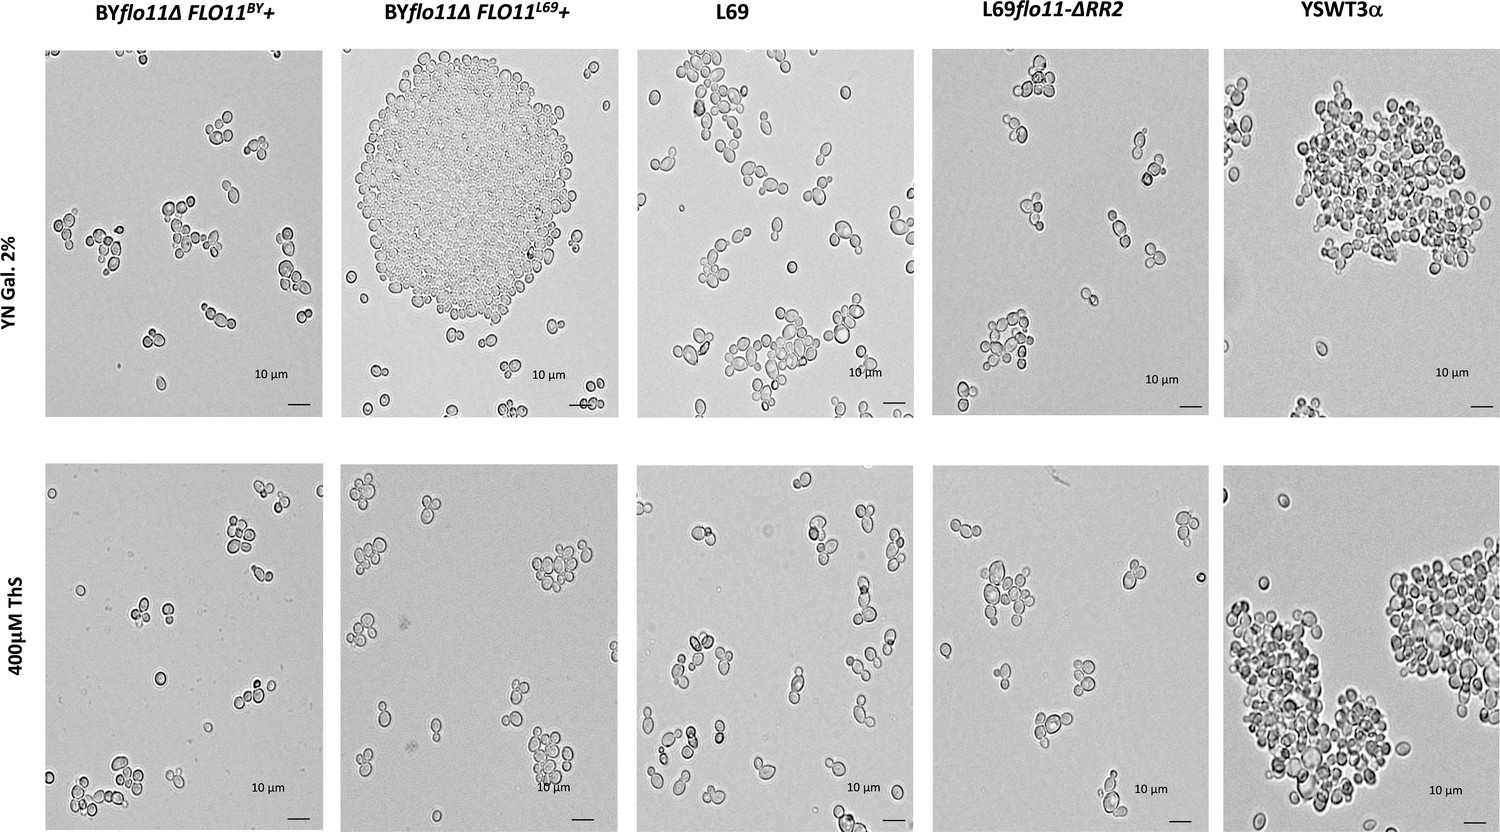
Effect of thioflavine S on the Flo11p-dependent cell-cell aggregation.
BY4741 transformed with pYES2.1 carrying either FLO11BY or FLO11L69, L69, L69flo11-∆RR2 (expressing Flo11p variant lacking RR2), and YSWT3a (haploid strain derived from S1278b) were cultivated in YNGal medium supplemented with auxotrophic requirements when needed. Cultures of these strains were harvested in exponential phase (OD around 1.0), and treated or not with 0.4 mM thioflavine S for 1 hr before microscopic observations.
Figure 7
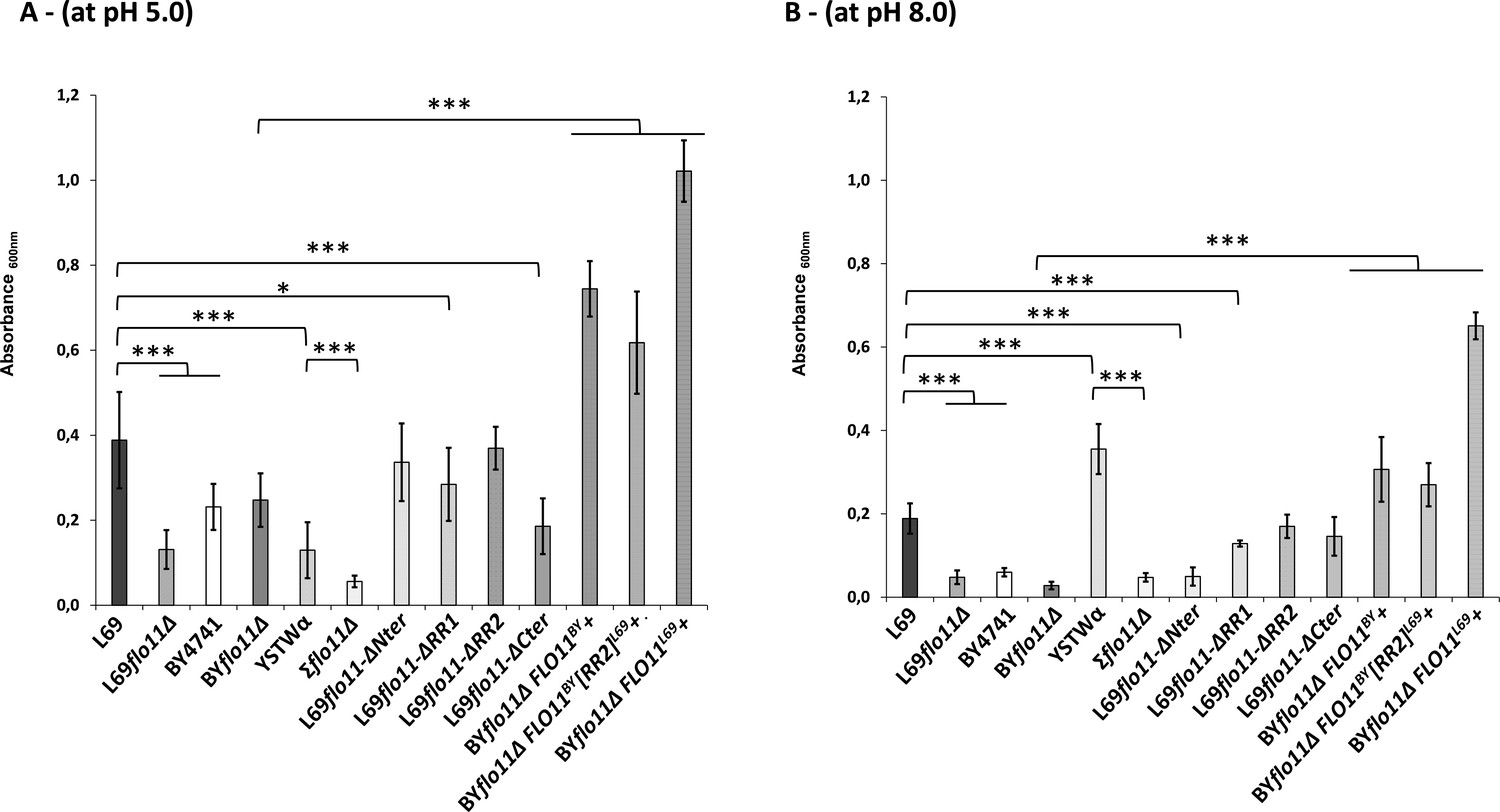
Adherence to plastic is strongly impacted by pH and does not solely depend on the A-domain of Flo11p.
Adherence of yeast cells was carried out a 96-well polystyrene plate as described in Materials and methods. The data are the mean of three replicates measurements ± standard deviation. Significant differences are denoted with asterisks (*=p-value < 0.05; **=p-value ≤ 0.01;***=p-value ≤ 0.005).
Figure 8 with 1 supplement
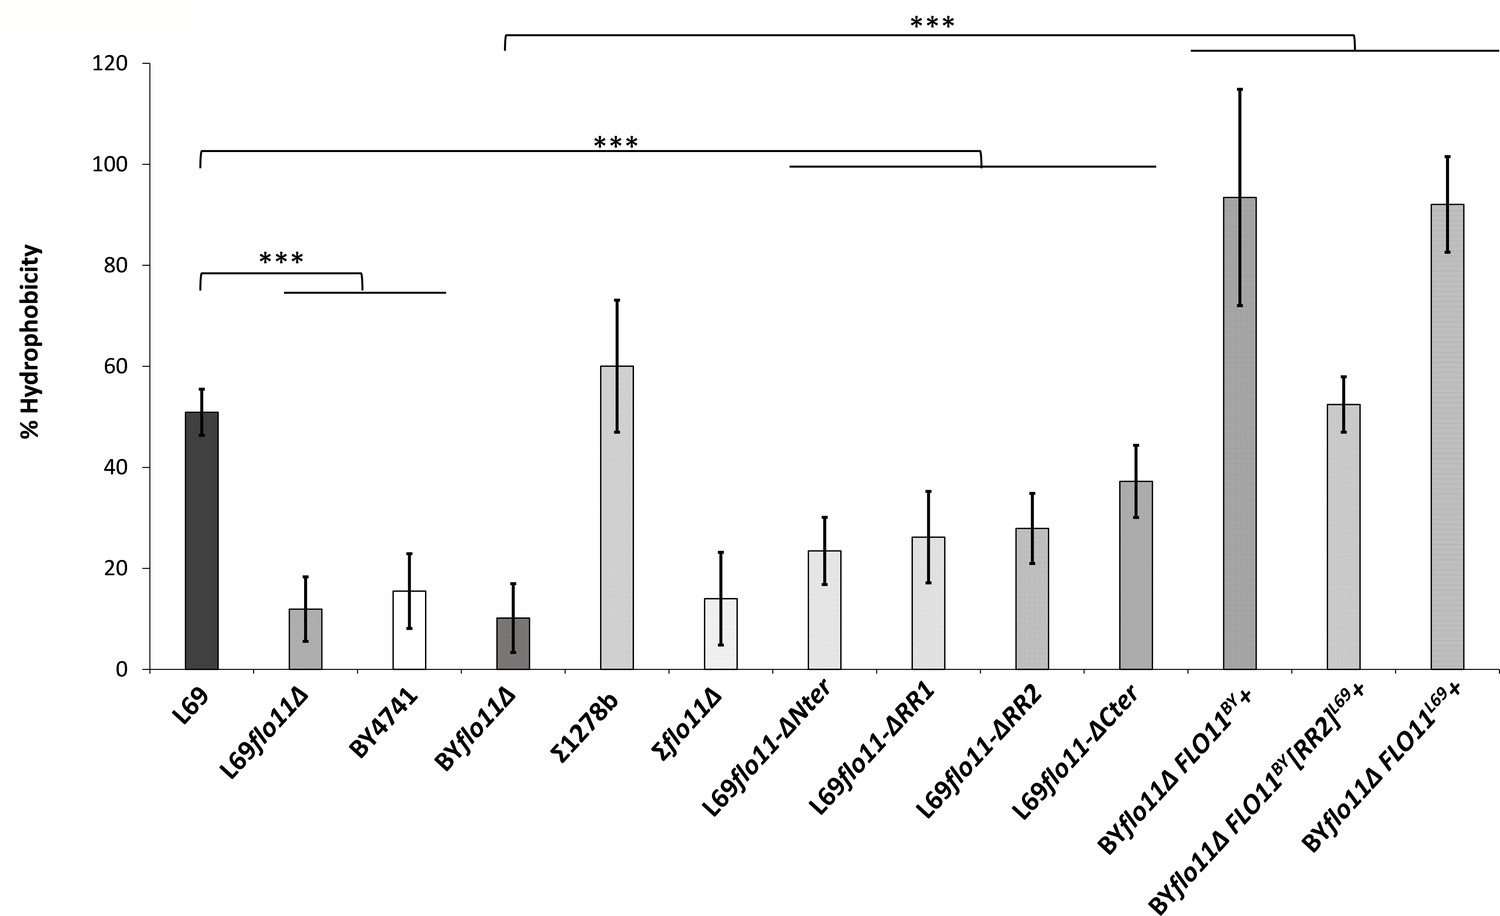
Surface hydrophobicity mainly depends on abundance of Flo11p.
Surface hydrophobicity corresponded to the percentage of cells partitioning in the octane layer, as described in Materials and methods. The data are the mean of three biological replicates and vertical bars represent standard deviations. Significant differences are denoted with asterisks (*=p-value < 0.05; **=p-value ≤ 0.01;***=p-value ≤ 0.005).
Figure 8—figure supplement 1
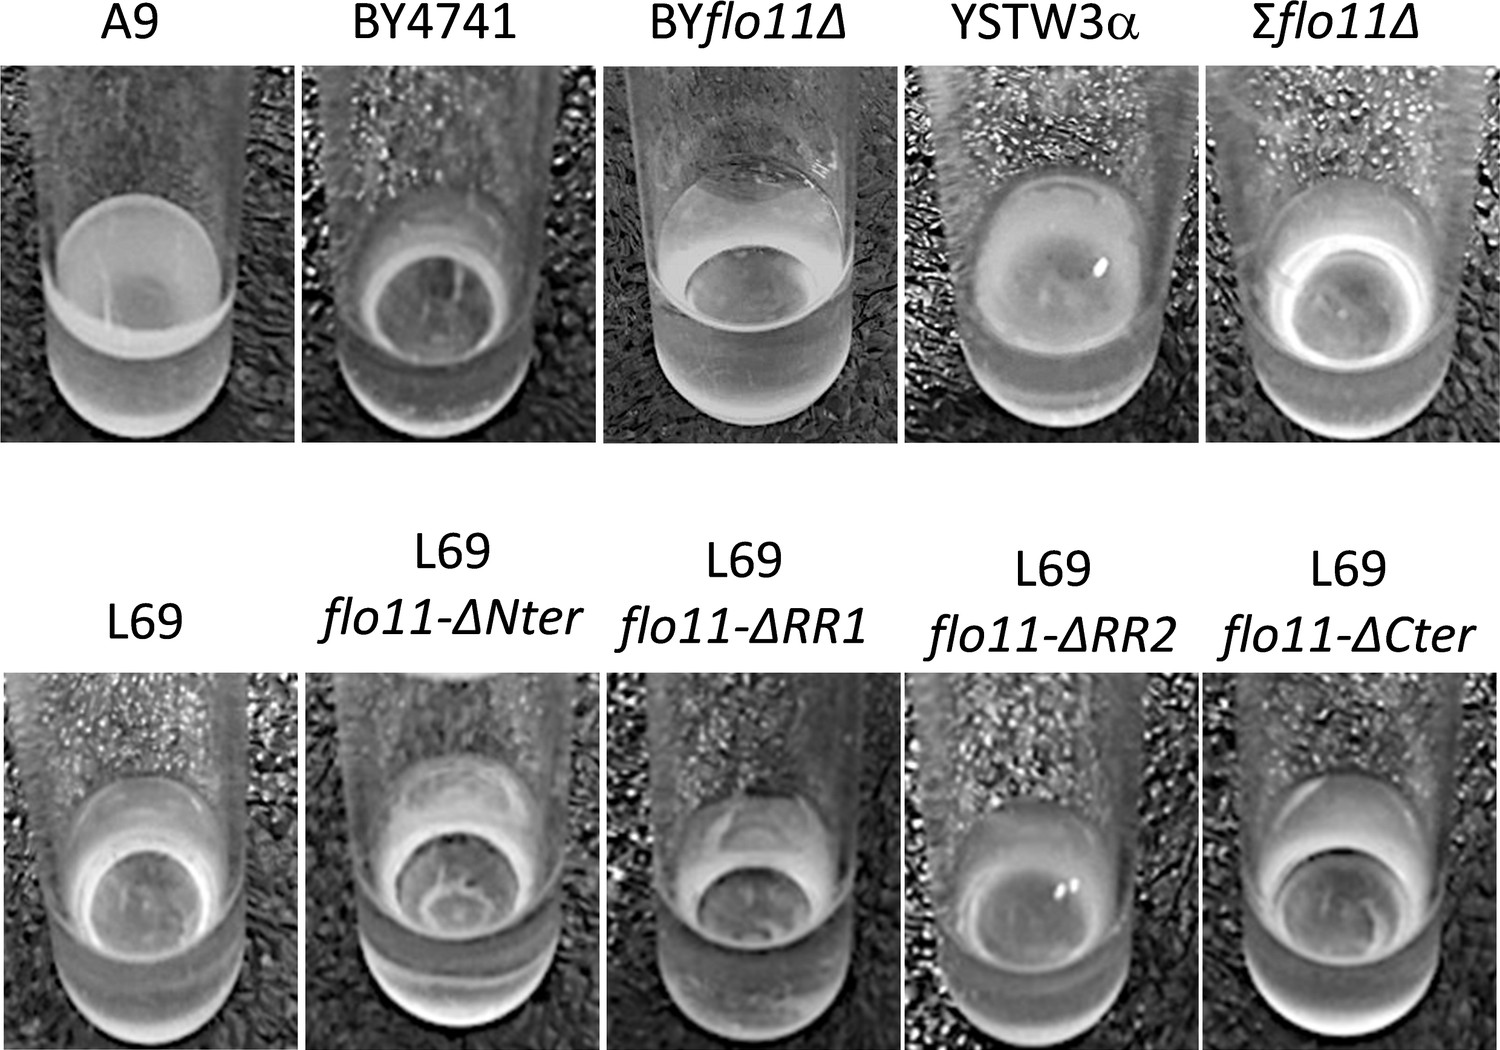
Assay of velum formation.
The assay was carried out by static incubation for 7 days of yeast cells in the flor medium at 23°C.
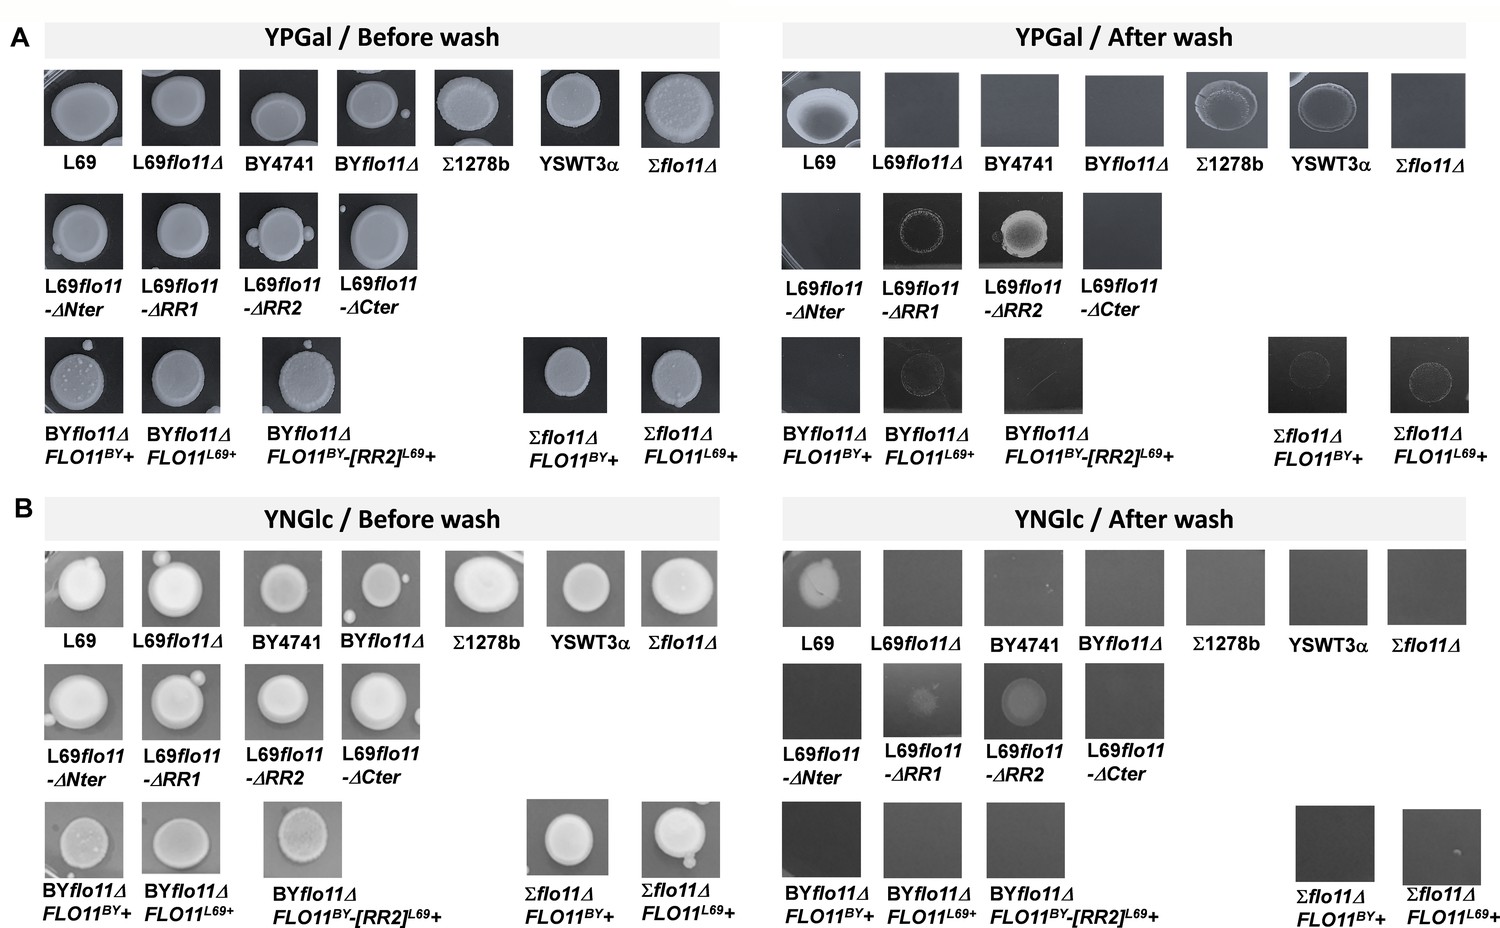
Figure 9 with 2 supplements
The Invasive growth in agar is abolished by deletion of either N- or C-terminal of the Flo11p.
All strains were pre-grown in YNGal that was supplemented with the auxotrophic requirements when needed (i.e. uracil, leucine, histidine, methionine at 0.1% for BY4741, BYflo11Δ, and YSTW3α but only leucine, histidine, methionine for BYflo11Δ and Σflo11Δ expressing FLO11BY, FLO11L69, or FLO11BY-[RR2]L69) until stationary phase. Then, 10 µl of these cultures were spotted on 2% (w/v) agar plate made with YPD (panel A) or YNGal complemented with auxotrophic requirements (panel B). Plates were incubated at 30°C for 8 days and washed under a stream of water. They were photographed before and after washing.
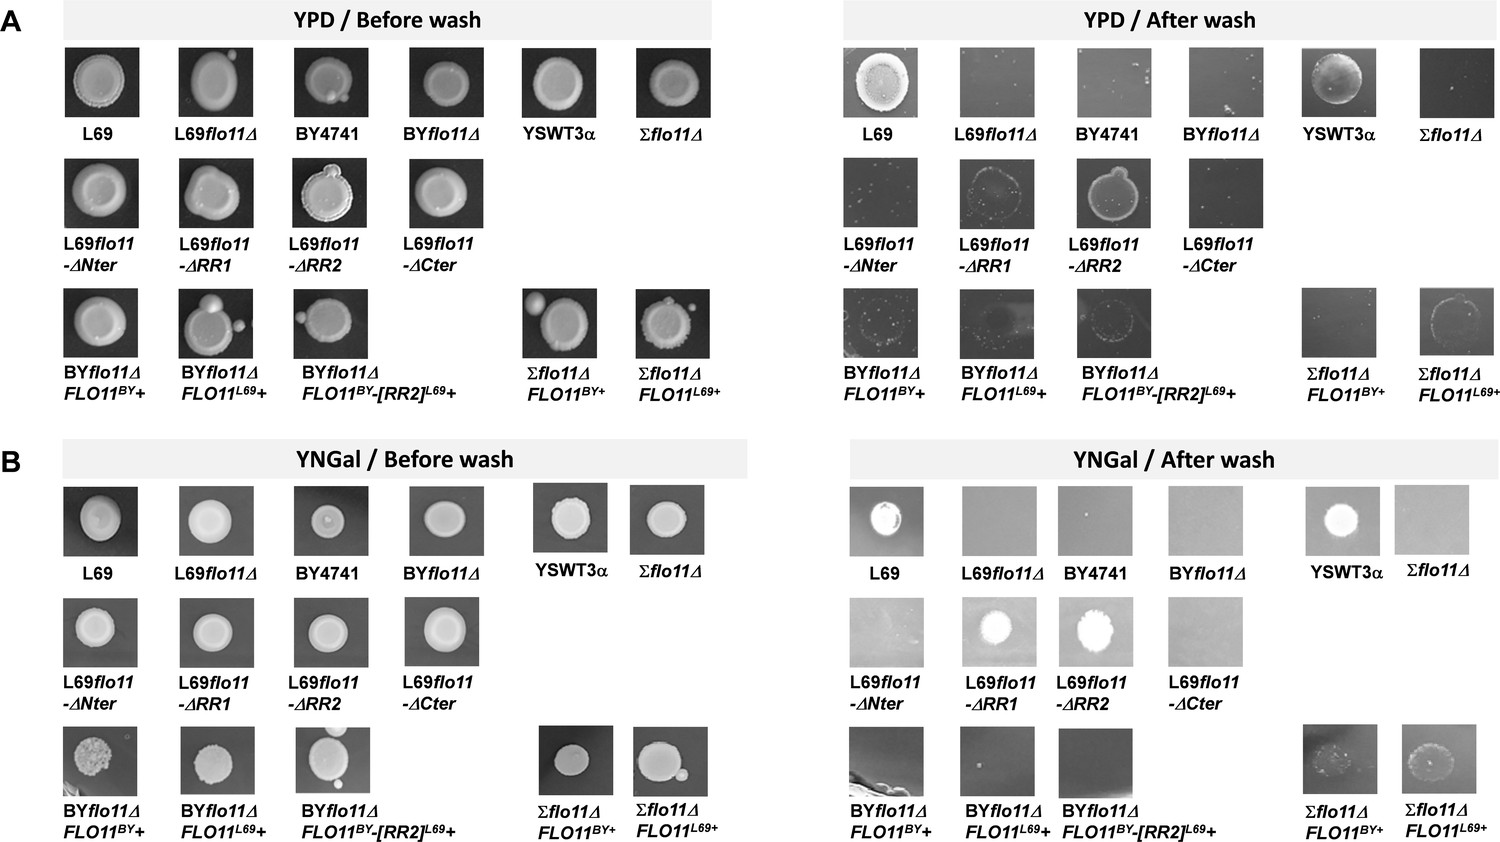
Figure 9—figure supplement 1
Invasive growth in agar by different yeast strains, and impact of the culture medium and of the domains of FLO11p on this phenotype.
Yeast cells were initially cultivated in YNGal complemented with amino acids and uracil, except for BYflo11D and Sflo11D expressing FLO11BY or FLO11L69 on a pYES2.1 plasmid for which uracil was omitted. Cells were harvested at the entrance in stationary phase and deposited as patches on agar plates which were made with (A) rich galactose medium (YP Gal) or (B) with synthetic glucose medium complemented with amino acids and uracil, except for BYflo11∆ and Sflo11D expressing FLO11BY on FLO11L69 on a pYES2.1 plasmid for which uracil was omitted. Plates were incubated at 30°C for 8 days. They were then photographed before and after washing under a stream of water.
Figure 9—figure supplement 2
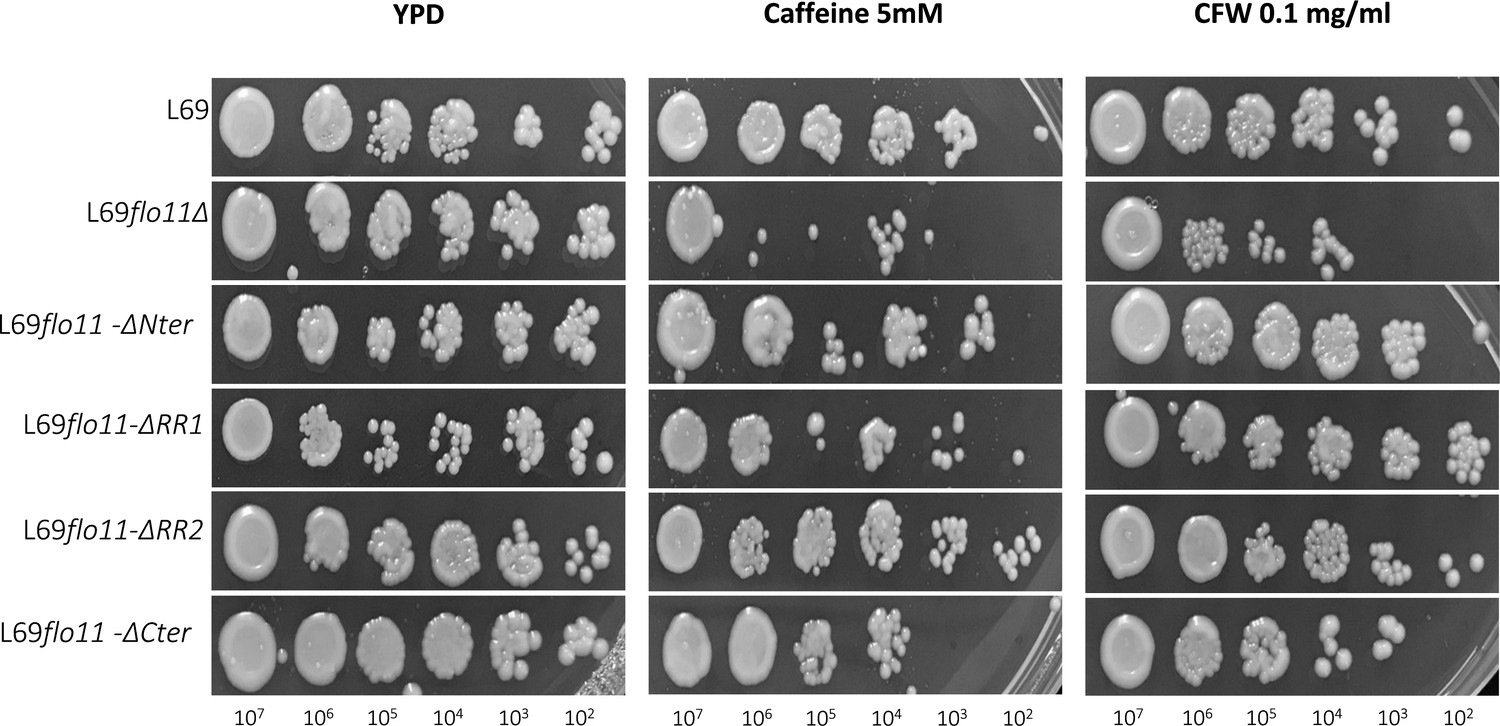
Sensitivity of L69 and L69 mutant strains to caffeine and calcofluor white (CFW) drugs.
Cells were exponentially grown in YPD medium and were collected by centrifugation, then resuspended in sterilized water at 108 cells/ml; 5 µl of this cell suspension diluted 10–105 fold was spotted on YPD agar plates in the absence or presence of caffeine or CFW at indicated concentration. Picture was taken after 2 days of growth at 30°C.
Tables
Table 1
β-Aggregation-prone sequences in Flo11 of various Saccharomyces cerevisiae strains*.
| Amyloid sequence | Amino acid position | % β-Aggregation | |
|---|---|---|---|
| Flo11pL69 | VVSTTVVVTTAVT | 1178; 1285; 13921494 | 75.759.4 |
| Flo11pBY | VVSTTVVVTTAVT | 10331494 | 75.884.8 |
| Flo11pΣ | VVSTTVVVTTAVT | 881983 | 75.659 |
| Flo11p133d | VVSTTVVVTTAVT | 13011403 | 70.959.1 |
-
*
TANGO software (http://tango.crg.es/) with default settings for pH, ionic strength, and temperature was used to determine Flo11p regions with β-aggregation potential superior to 30%.
Additional files
-
Supplementary file 1
TANGO software analysis of β-aggregation motifs in Flo1, Flo5, Flo9, Flo10, and Flo11 protein from Saccharomyces cerevisiae S288c strain.
- https://cdn.elifesciences.org/articles/68592/elife-68592-supp1-v2.docx
-
Supplementary file 2
Identification of sequence repeats and beta-aggregation prone sequence in Flo11 proteins from different yeast strains.
(a) Search for intragenic repeats using EMBOSS ETANDEM software. (b) Search for β-aggregation-prone sequence in the different Flo11 proteins using TANGO software (http://tango.crg.es/). *β-Aggregation-prone sequences > 30% were searched using TANGO software (at http://tango.crg.es/) with default setting of pH, ionic strength, and temperature. Amyloid-core sequences are highlighted in yellow.
- https://cdn.elifesciences.org/articles/68592/elife-68592-supp2-v2.docx
-
Supplementary file 3
Proteomic analysis of cell wall/cell membrane preparation from L69 strain.
- https://cdn.elifesciences.org/articles/68592/elife-68592-supp3-v2.xlsx
-
Supplementary file 4
Yeast strains used or constructed in this study.
- https://cdn.elifesciences.org/articles/68592/elife-68592-supp4-v2.docx
-
Supplementary file 5
Plasmids constructed in this work.
- https://cdn.elifesciences.org/articles/68592/elife-68592-supp5-v2.docx
-
Supplementary file 6
Oligonucleotides used in this study.
- https://cdn.elifesciences.org/articles/68592/elife-68592-supp6-v2.docx
-
Transparent reporting form
- https://cdn.elifesciences.org/articles/68592/elife-68592-transrepform1-v2.docx
Download links
A two-part list of links to download the article, or parts of the article, in various formats.
Downloads (link to download the article as PDF)
Open citations (links to open the citations from this article in various online reference manager services)
Cite this article (links to download the citations from this article in formats compatible with various reference manager tools)
The dual role of amyloid-β-sheet sequences in the cell surface properties of FLO11-encoded flocculins in Saccharomyces cerevisiae
eLife 10:e68592.
https://doi.org/10.7554/eLife.68592


