Ancient viral genomes reveal introduction of human pathogenic viruses into Mexico during the transatlantic slave trade
- Laboratorio Internacional de Investigación sobre el Genoma Humano, Universidad Nacional Autónoma de México, Mexico
- Section for Evolutionary Genomics, The Globe Institute, Faculty of Health, University of Copenhagen, Denmark
- Department of Sociology and Anthropology, North Carolina State University, United States
- Escuela Nacional de Antropología e Historia, Mexico
- Instituto Nacional de Antropología e Historia, Mexico
- Laboratorio Universitario de Geoquímica Isotópica (LUGIS), Instituto de Geología, Universidad Nacional Autónoma de México, Mexico
- LUGIS, Instituto de Geofísica, Universidad Nacional Autónoma de México, Mexico
- Department of Microbiology, Icahn School of Medicine at Mount Sinai, United States
- Vaccine and Infectious Disease Division, Fred Hutchinson Cancer Research Center, United States
Figures
Figure 1 with 7 supplements

Metagenomic analysis of Colonial individuals reveal HBV-like and B19V-like hits.
(a) Location of the archeological sites used in this study, HSJN (19.431704–99.141740) is shown as a yellow triangle and COY (19.347079–99.159017) as a yellow circle, lines in pink map show current division of Mexico City. (b) Several individuals discovered in mass burials archaeologically associated with the Hospital Real de San José de los Naturales (HSJN) and Colonial epidemics. (c) Metagenomic analysis performed with MALT 0.4.0 based on the Viral NCBI RefSeq. Viral abundances were compared and normalized automatically in MEGAN between shotgun (sample_name) and capture (sample_name-c) next-generation sequencing (NGS) data. Only HBV or B19V-positive samples are shown (all samples analyzed are shown in Figure 1—figure supplements 2–3). A capture negative control (HSJN177) is shown.
© 2016, Secretaria de Cultura INAH, SINAFO, Fototeca DSA. Panel b was taken by Salvador Pulido Méndez and is reproduced from the "Proyecto Metro Línea 8" with permission from "Secretaria de Cultura INAH, SINAFO, Fototeca DSA". This panel is not covered by the CC-BY 4.0 licence and further reproduction of this panel would need permission from the copyright holder.
Figure 1—figure supplement 1
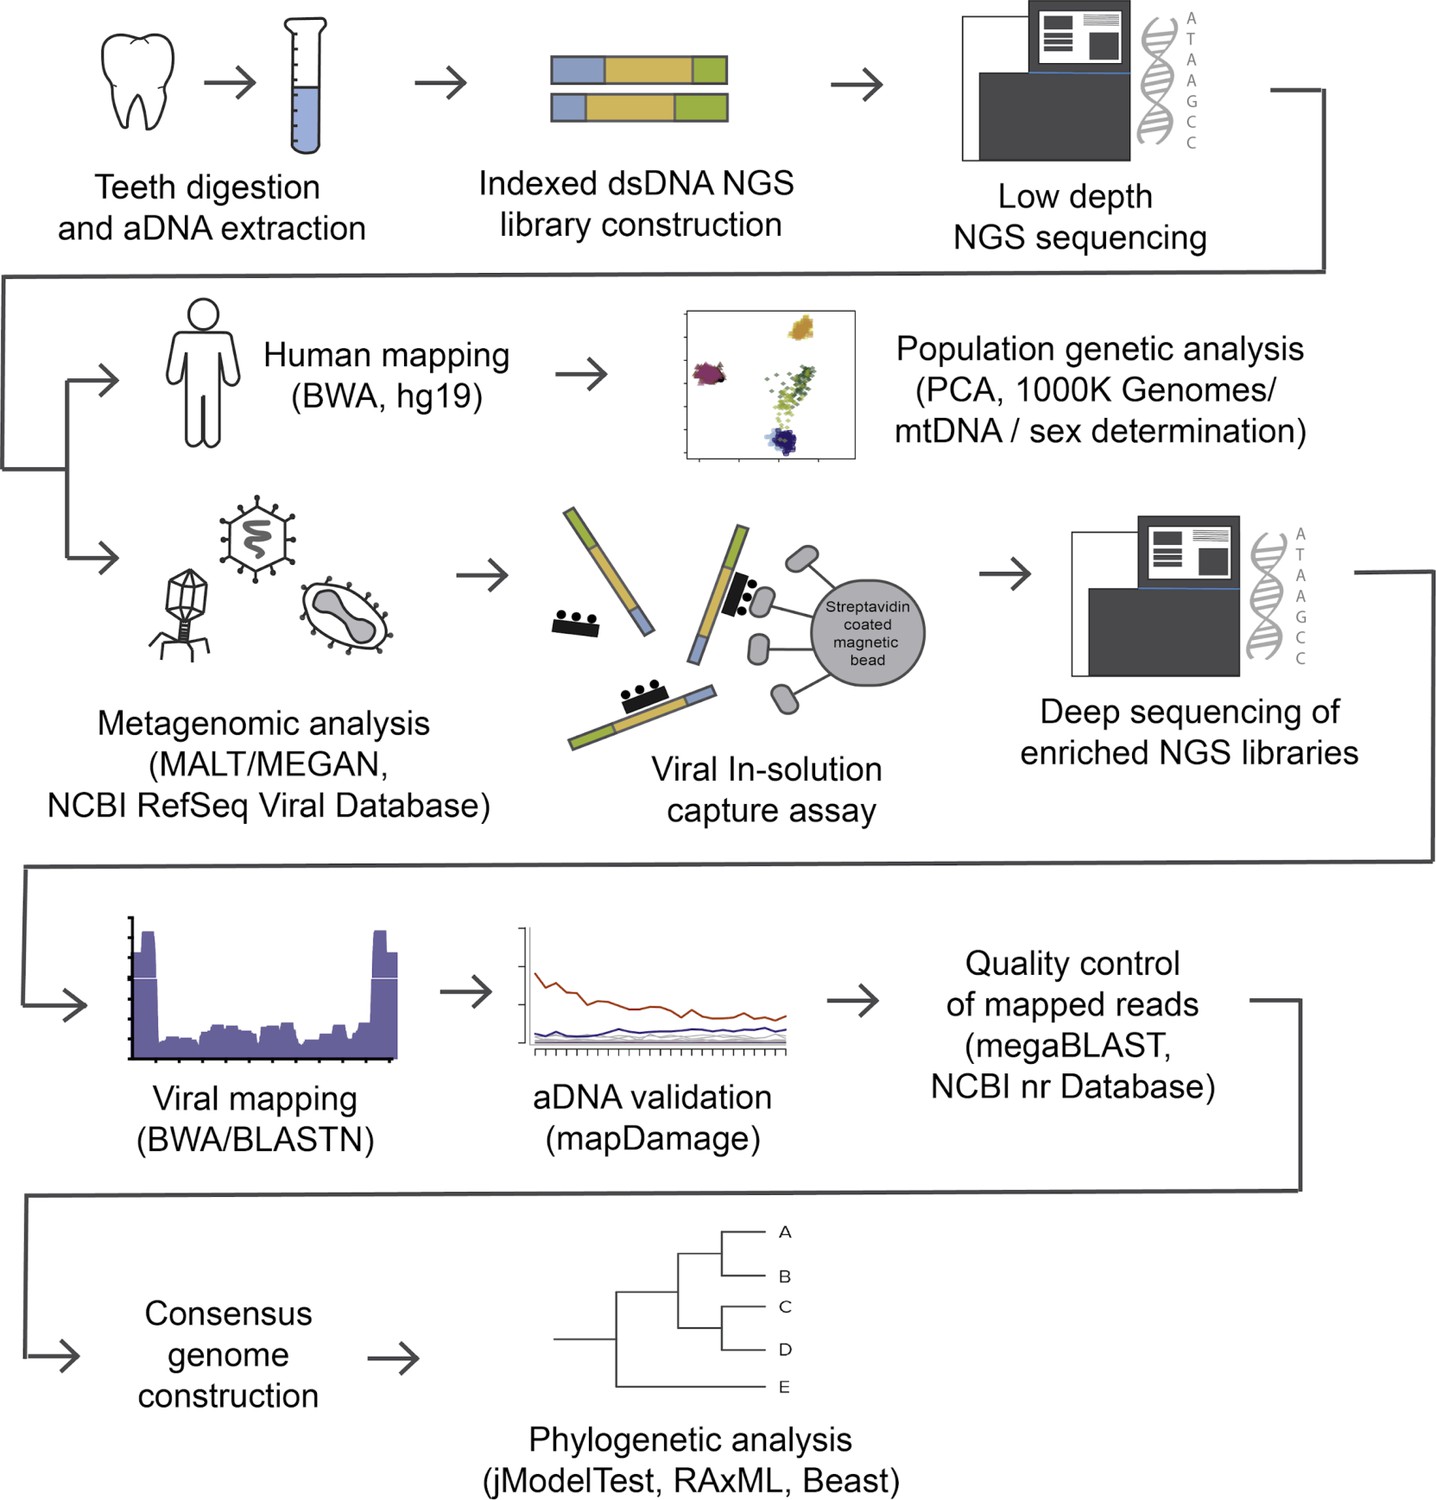
Pipeline followed for ancient viral genomes reconstruction.
Teeth were fragmented into small pieces to extract DNA from which next-generation sequencing (NGS) libraries were constructed. Reads were separated into human and non-human for downstream analysis. After metagenomic analysis, samples were chosen for viral DNA enrichment and sequencing. Two independent viral DNA capture rounds were joined to reconstruct the ancient genome and estimate damage patterns. Consensus genomes were constructed and aligned to a viral dataset with sequences from different genotypes and geographic regions to perform phylogenetic analysis.
Figure 1—figure supplement 2
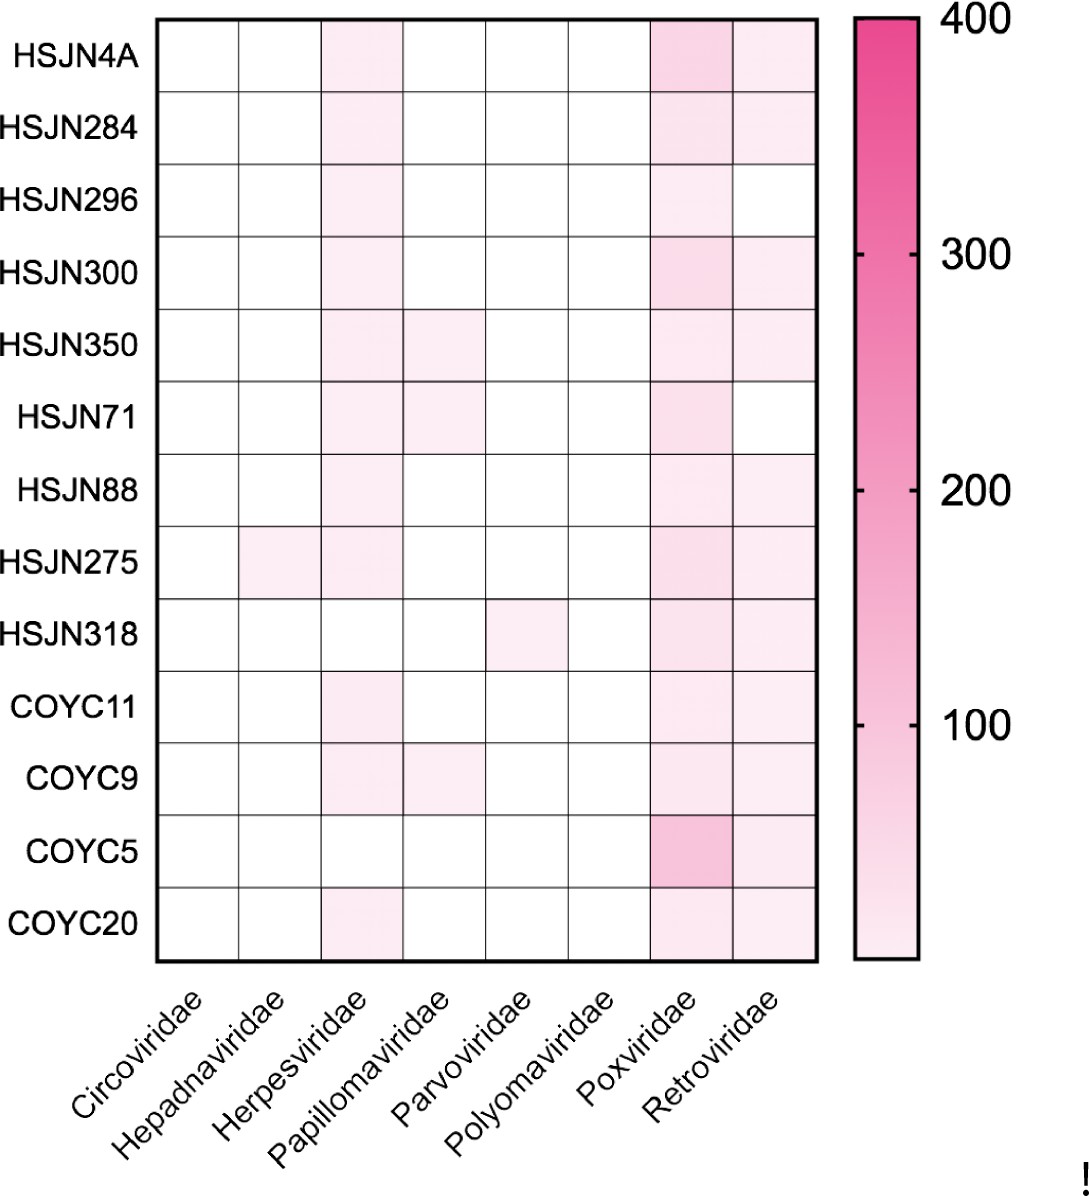
Individuals with DNA traces of clinical important viral families.
Metagenomic analysis performed on the Viral NCBI RefSeq Database with MALT, and abundances were normalized in MEGAN (default parameters). Only the individuals with the highest frequencies of hits to viral families included in our customized capture assay are shown.
Figure 1—figure supplement 3
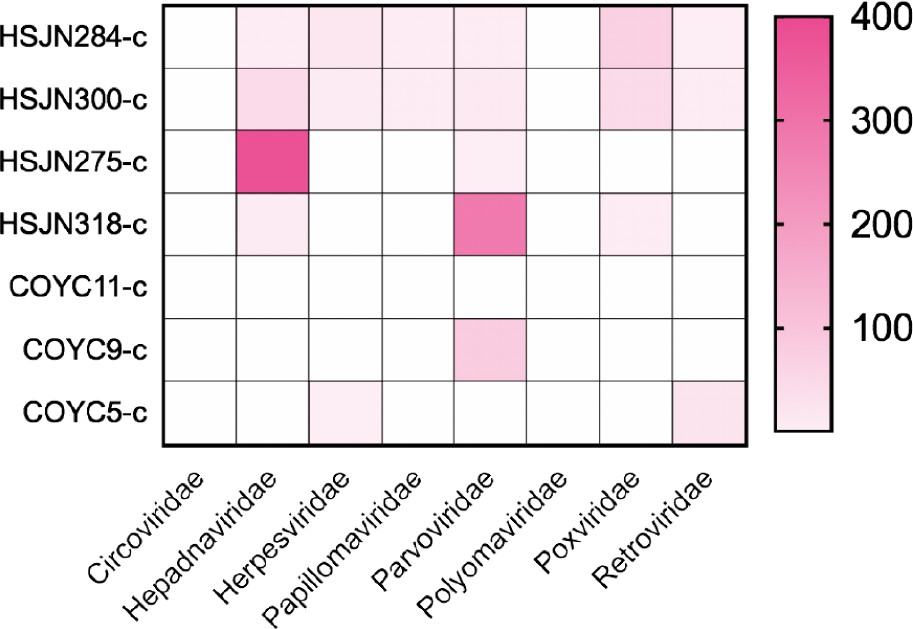
Target viral abundances post-capture.
Enriched samples normalized based on their respective shotgun sample in MEGAN (default parameters). Samples HSJN318 and HSJN275 were poorly enriched to cover the CDS region or did not present a clear damage pattern; respectively, and were not used for further phylogenetic analysis.
Figure 1—figure supplement 4
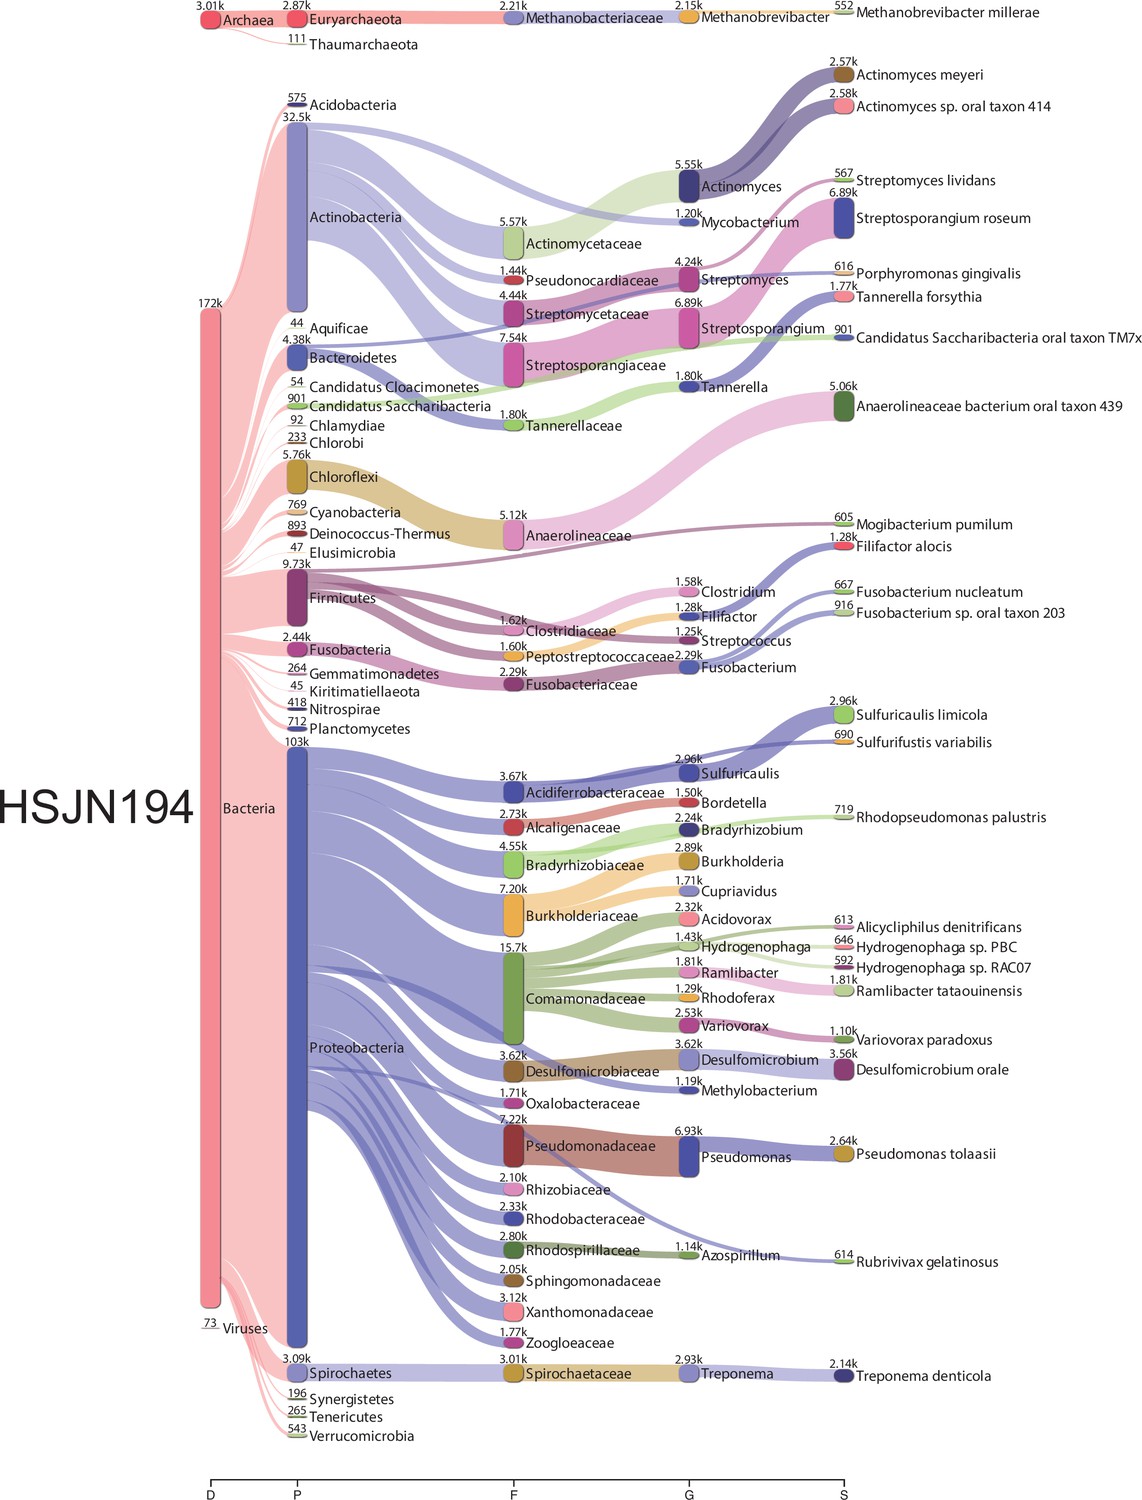
Bacterial metagenomic analysis from HSJN194.
Sankey diagrams of the taxonomic classification by Kraken2. The assignments at all taxonomy levels are shown: D (domain), K (kingdom), P (phylum), F (family), G (genre), S (species). The width of the flow is proportional to the number of reads assigned. The diagrams were obtained using Pavian.
Figure 1—figure supplement 5
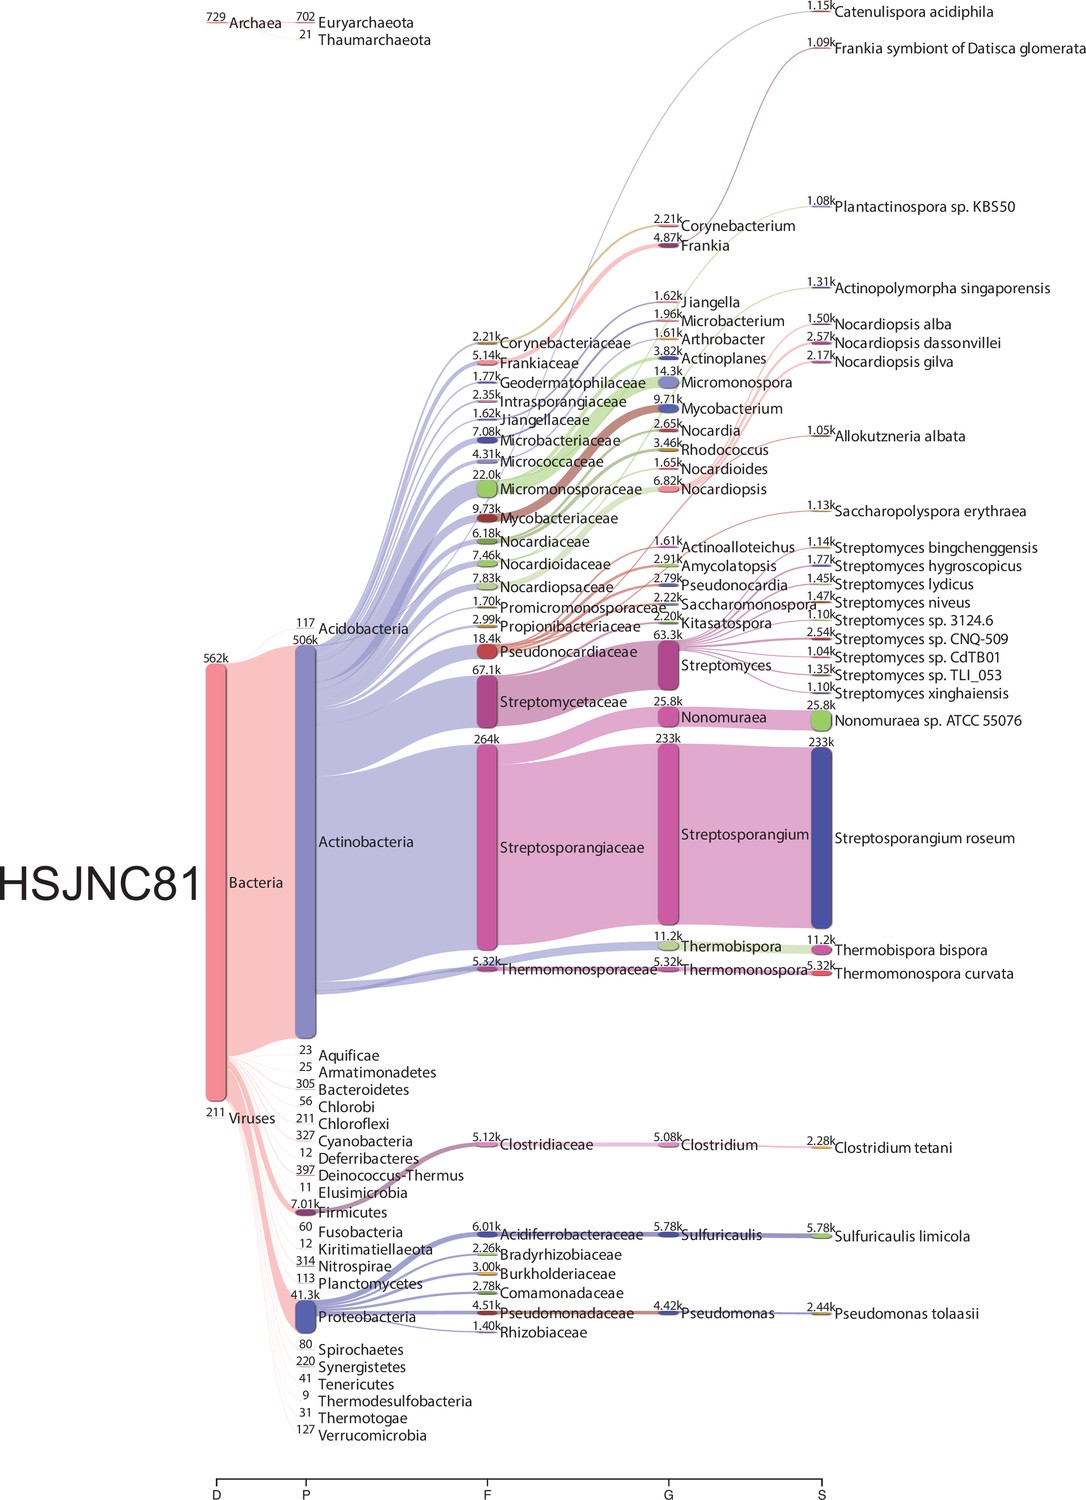
Bacterial metagenomic analysis from HSJNC81.
Sankey diagrams of the taxonomic classification by Kraken2. The assignments at all taxonomy levels are shown: D (domain), K (kingdom), P (phylum), F (family), G (genre), S (species). The width of the flow is proportional to the number of reads assigned. The diagrams were obtained using Pavian.
Figure 1—figure supplement 6
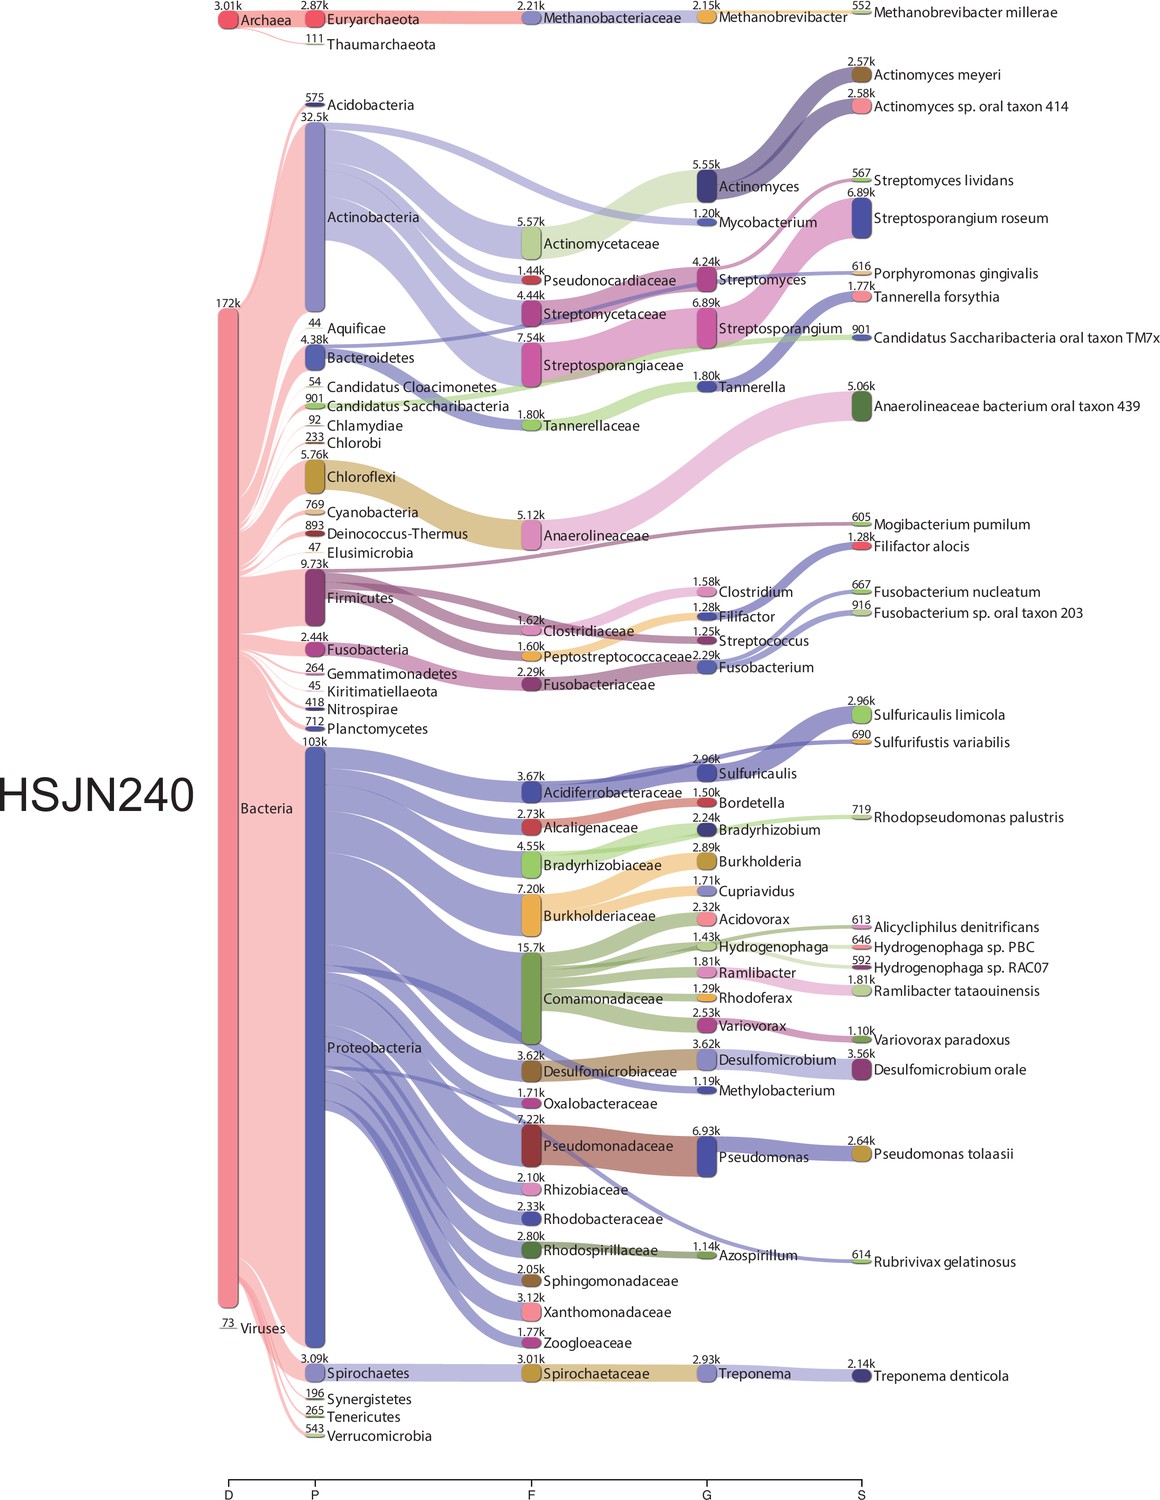
Bacterial metagenomic analysis from HSJN240.
Sankey diagrams of the taxonomic classification by Kraken2. The assignments at all taxonomy levels are shown: D (domain), K (kingdom), P (phylum), F (family), G (genre), S (species). The width of the flow is proportional to the number of reads assigned. The diagrams were obtained using Pavian.
Figure 1—figure supplement 7
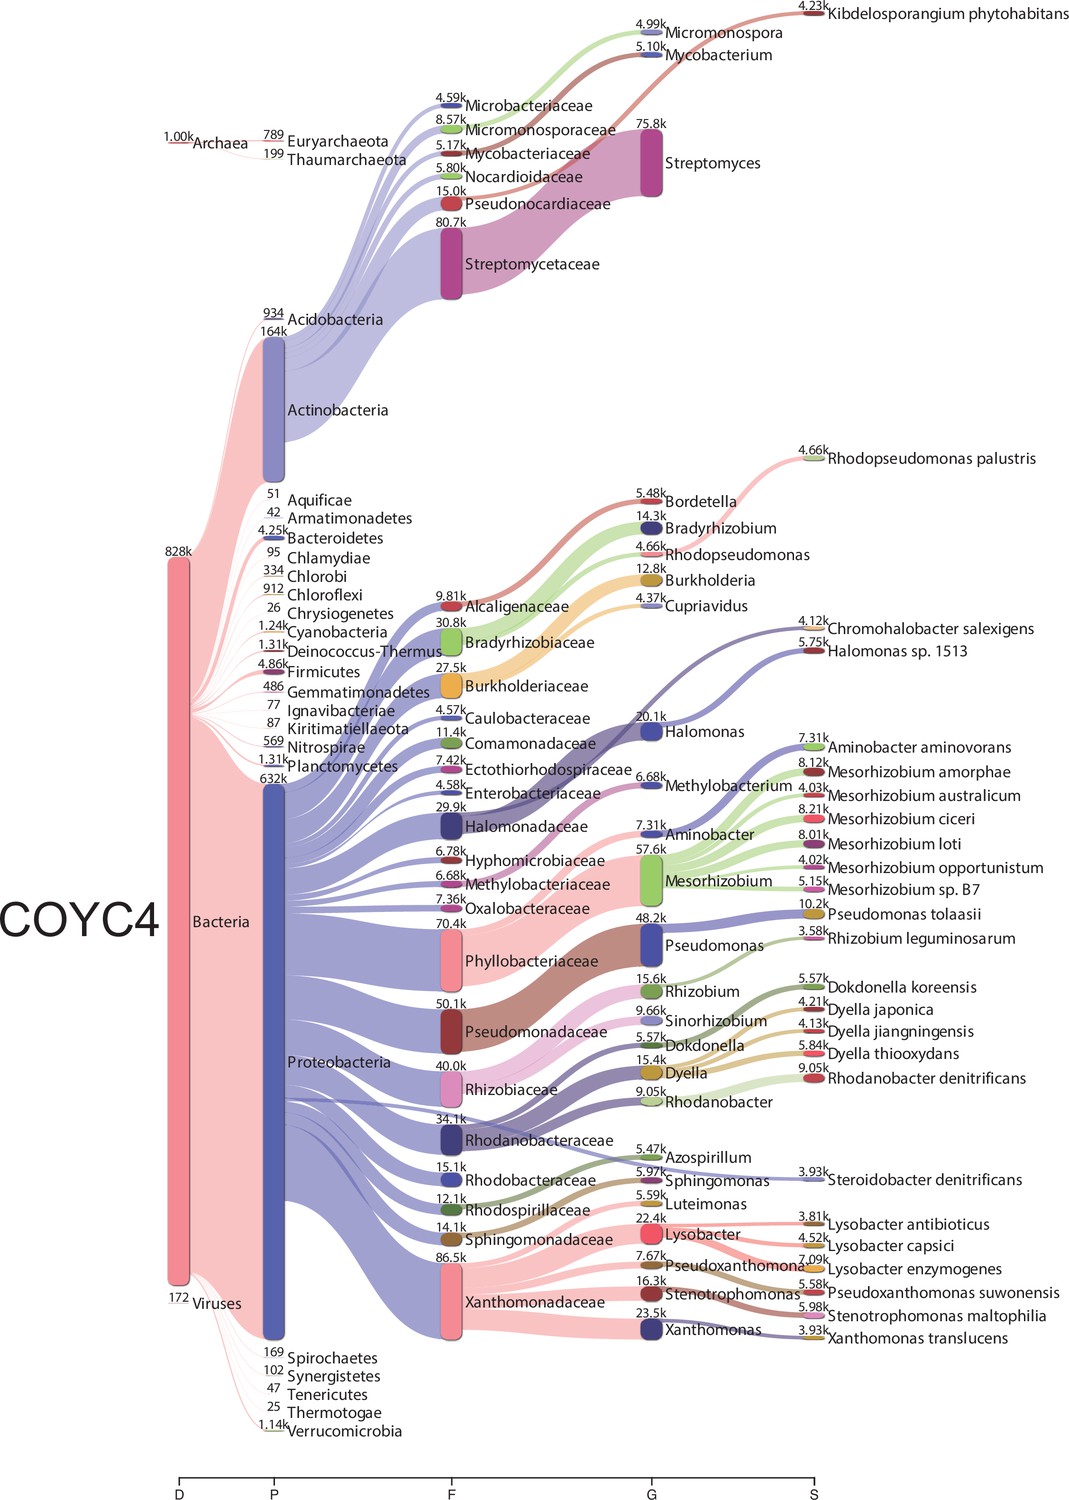
Bacterial metagenomic analysis from COYC4.
Sankey diagrams of the taxonomic classification by Kraken2. The assignments at all taxonomy levels are shown: D (domain), K (kingdom), P (phylum), F (family), G (genre), S (species). The width of the flow is proportional to the number of reads assigned. The diagrams were obtained using Pavian.
Figure 2 with 2 supplements
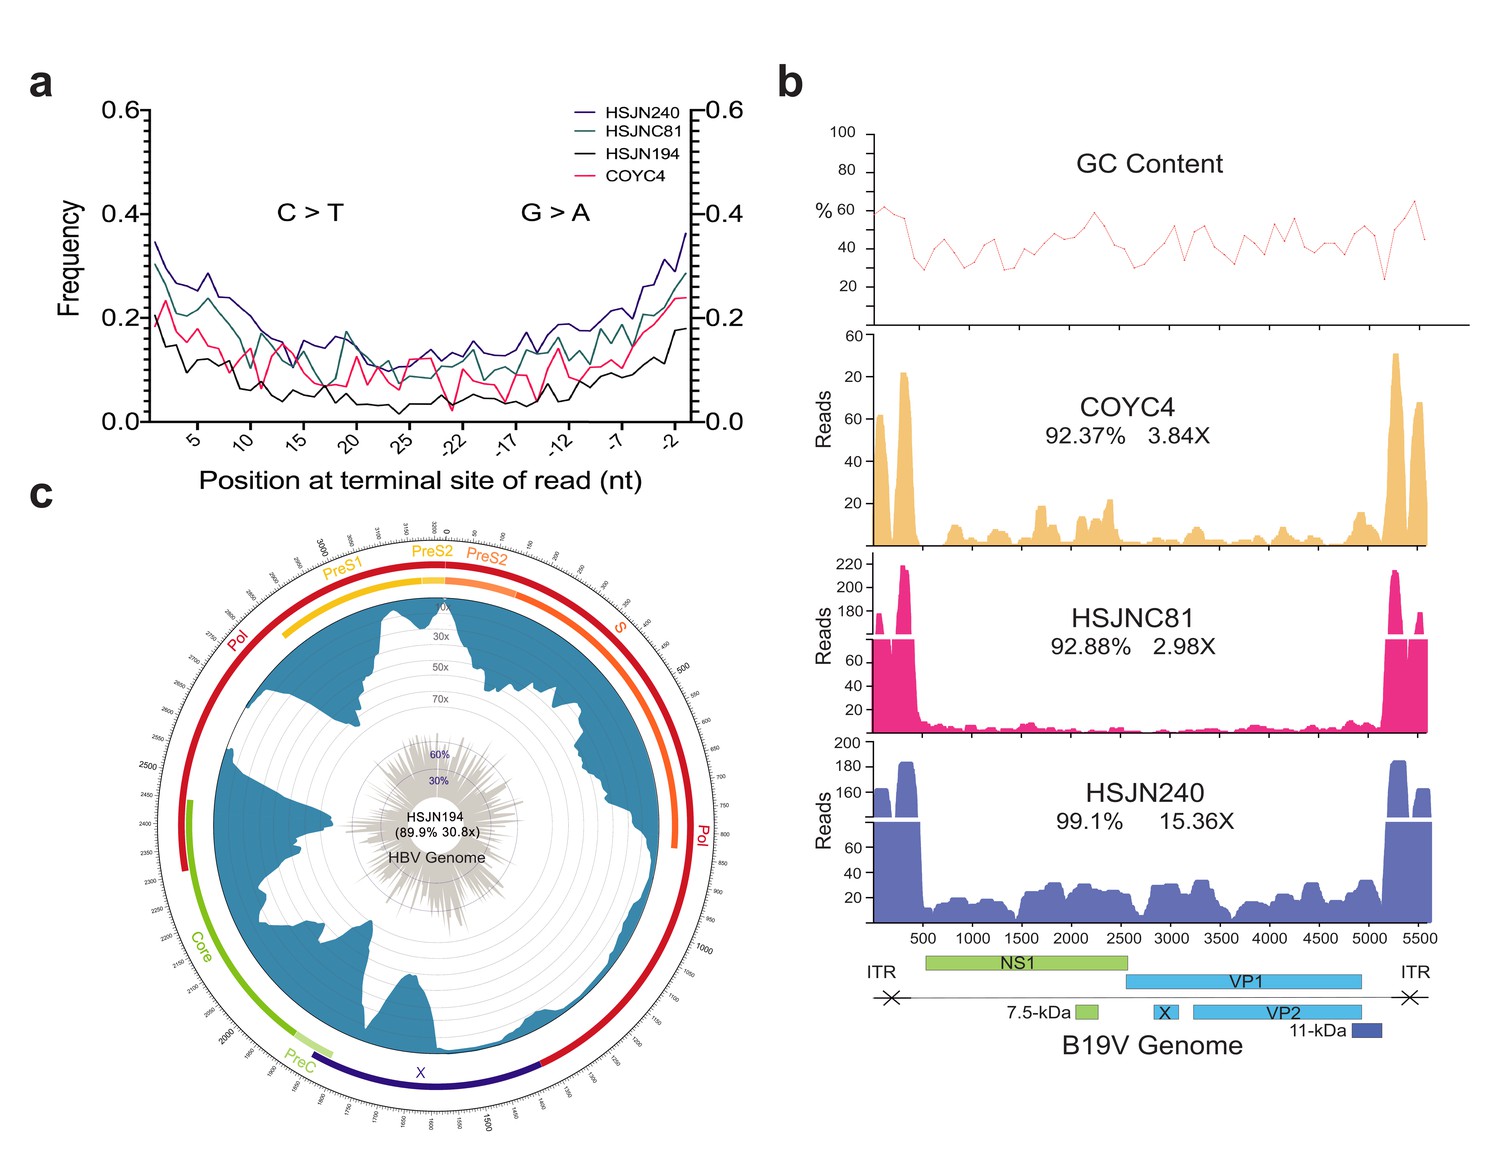
Ancient B19V and HBV ancient genomes.
(a) Superimposed damage patterns of ancient HBV (HSJN194) and B19V (HSJNC81, HSJN240, COYC4). X-axis shows the position (nt) on the 5′ (left) and 3′ (right) end of the read, and Y-axis shows the damage frequency (raw individual damage patterns are shown in Figure 2—figure supplement 1). (b) B19V ssDNA linear genome. X-axis shows position (nt) based on the reference genome (AB550331), and Y-axis shows depth (as number of reads). GC content is shown as a percentage of each 100 bp windows. Coverage and average depth for the CDS are shown under each individual ID. Schematic of the B19V genome is shown at the bottom. Highly covered regions correspond to dsDNA ITRs shown as crossed arrows. (c) HBV circular genome. Outer numbers show position (nt) based on reference genome (GQ331046), outer bars show genes with names, blue bars represent coverage, and gray bars shows GC content each 10 bp windows. Coverage and average depth are shown in the center. Low covered region between S and X overlaps with ssDNA region.
Figure 2—figure supplement 1
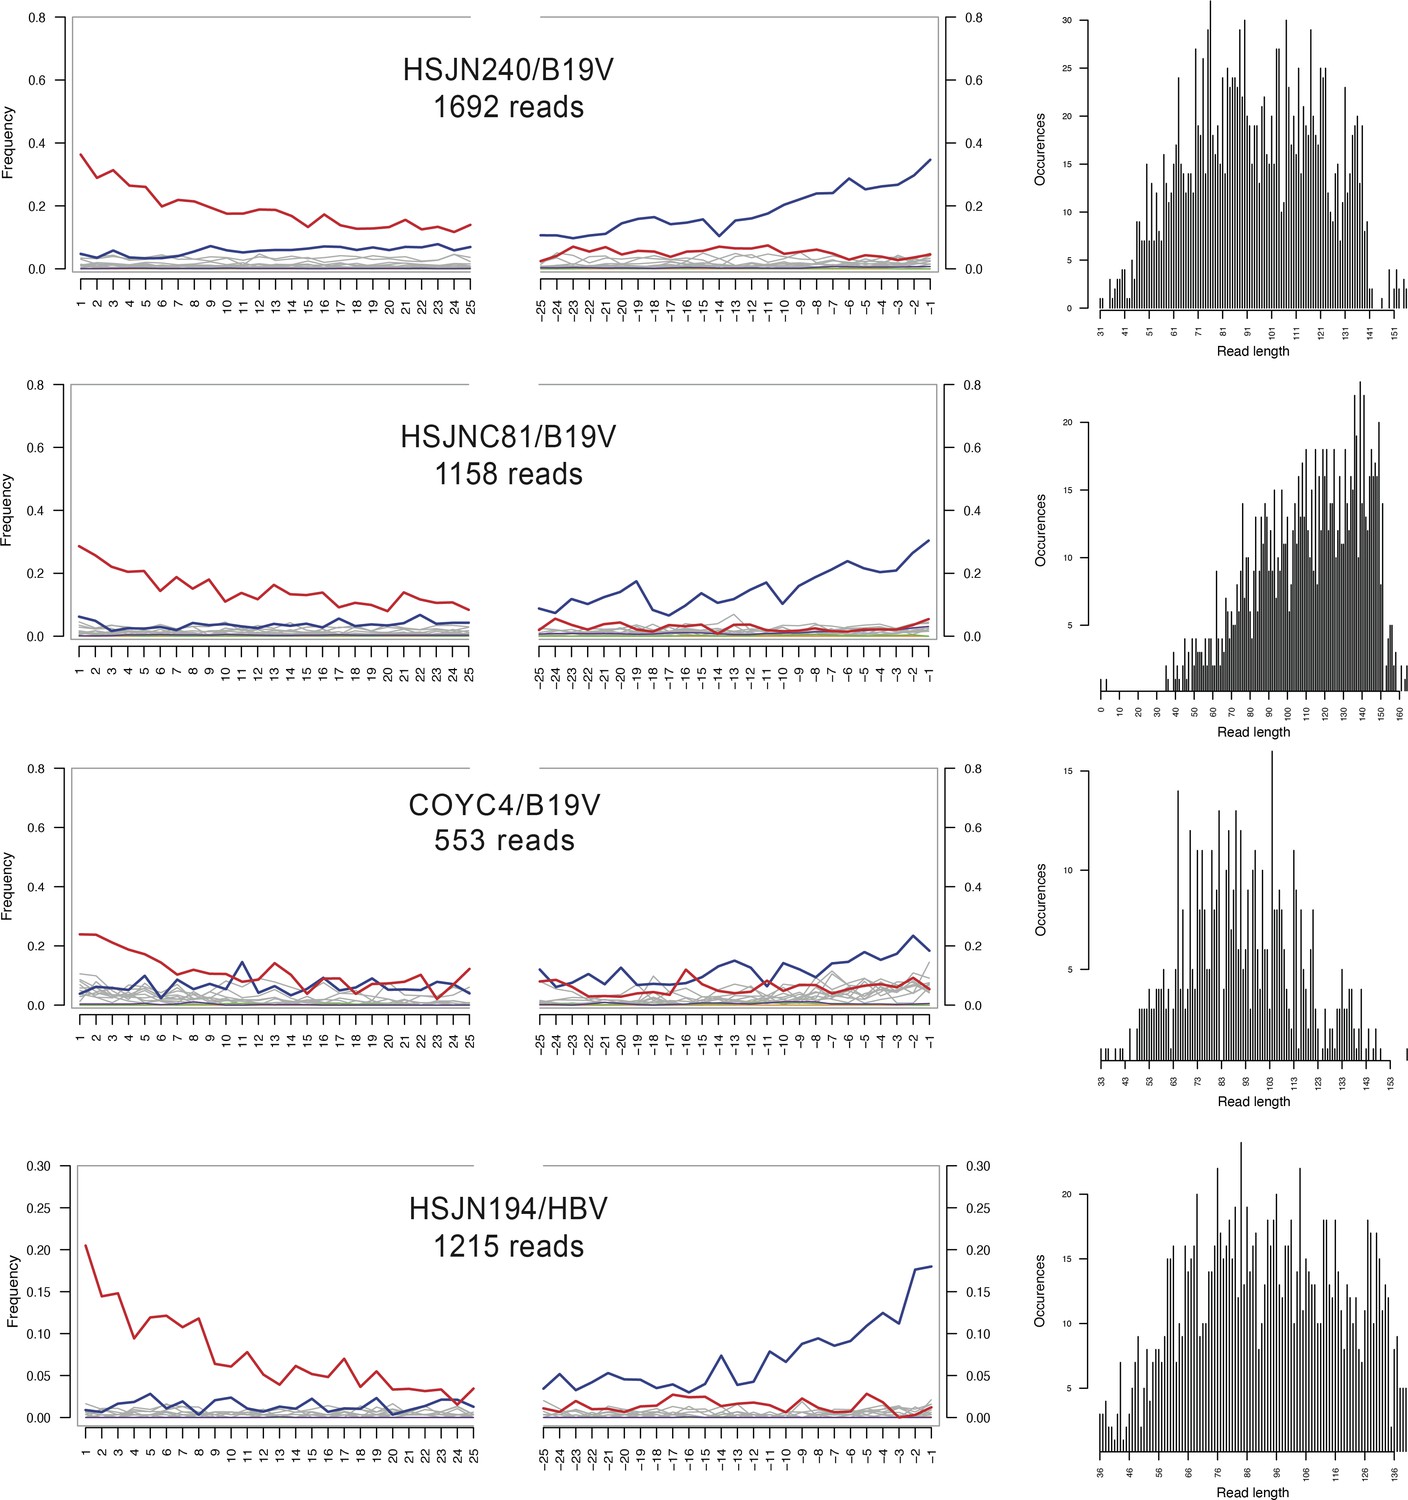
Damage patterns of ancient viral genomes.
Left: damage plots carried out with mapDamage 2.0; X-axis shows the position (nt) on the 5′ and 3′ end of the read, and on the Y-axis the frequencies of C>T and G>A transitions are indicated with red and blue lines, respectively, while other mismatches are shown in gray. Right: length distribution of the mapped reads without any cleavage treatment. Labels indicate individual/reference for virus (B19V or HBV). The number of mapped reads to the corresponding reference is indicated below each label.
Figure 2—figure supplement 2
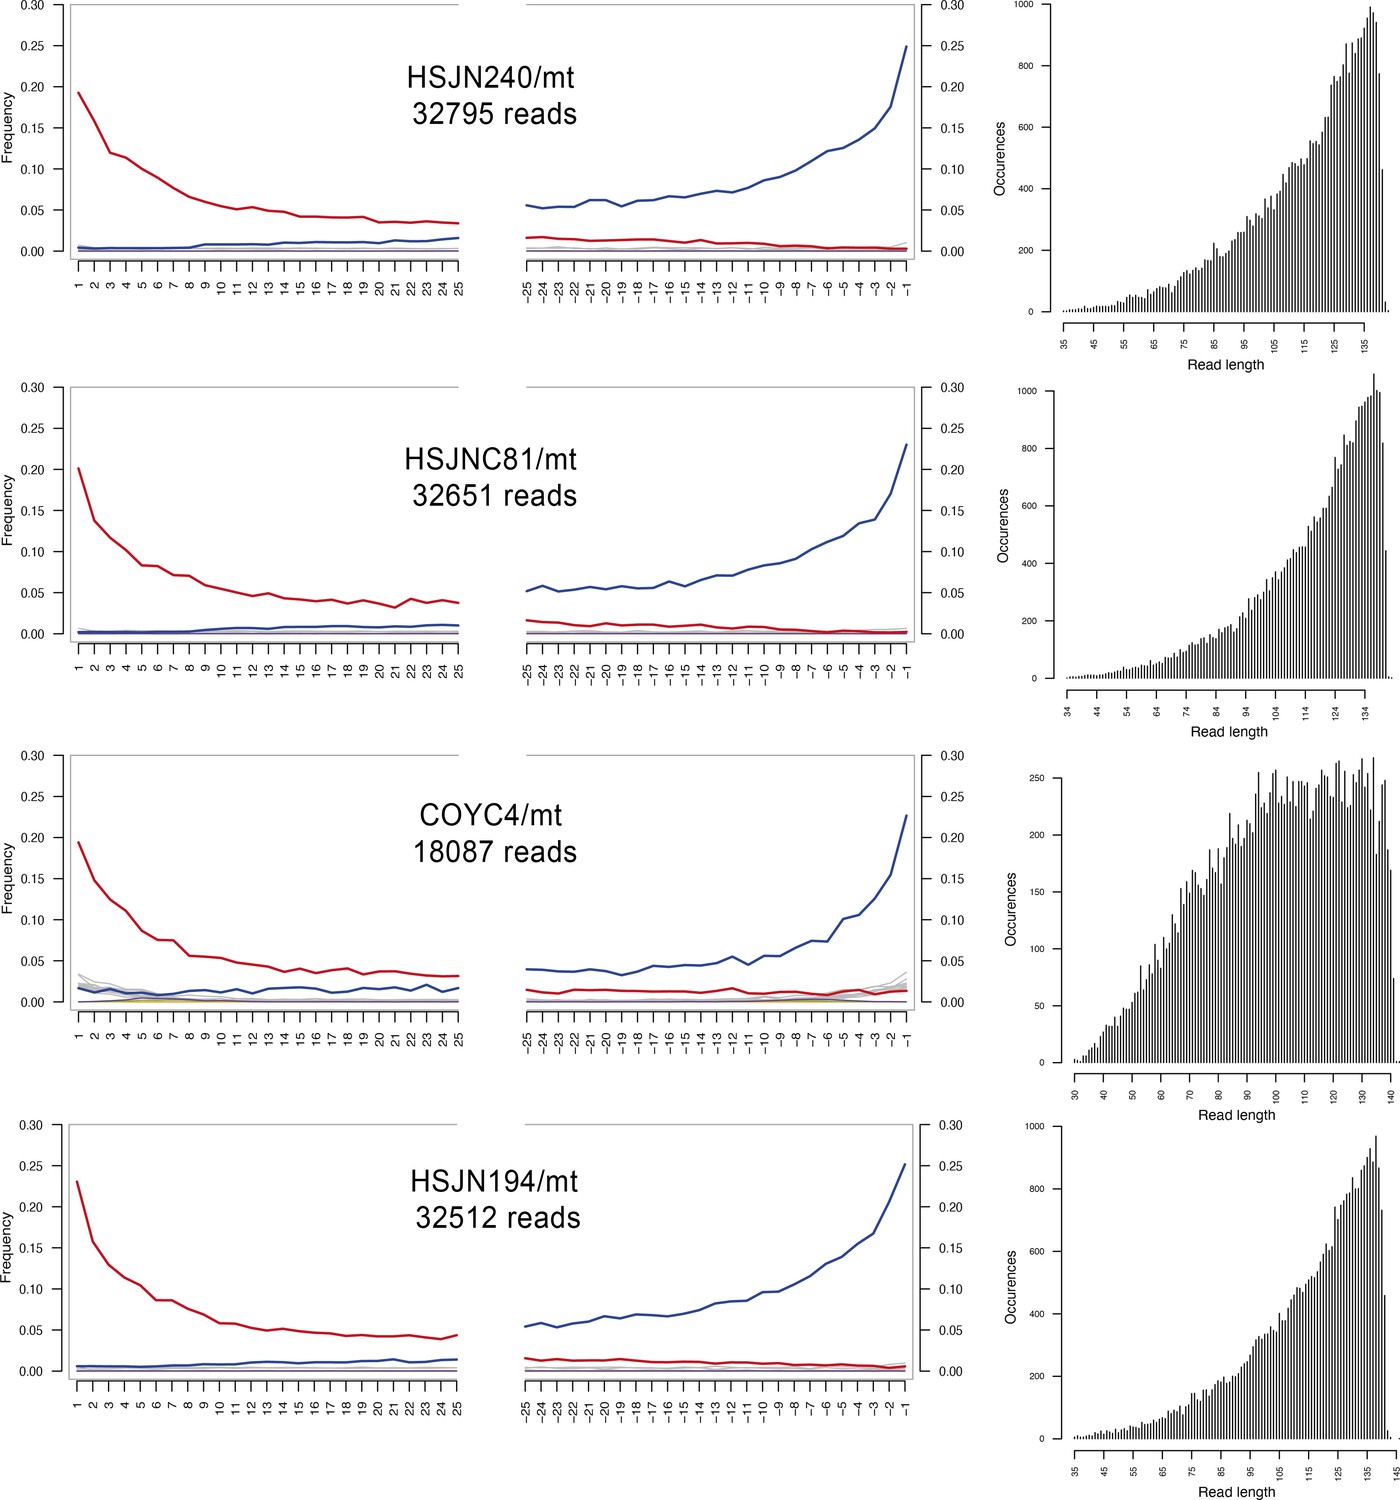
Damage patterns of mitochondria.
Left: damage plots carried out with mapDamage 2.0; X-axis shows the position (nt) on the 5′ and 3′ end of the read, and on the Y-axis the frequencies of C>T and G>A transitions are indicated with red and blue lines, respectively, while other mismatches are shown in gray. Right: length distribution of the mapped reads without any cleavage treatment. Labels indicate individual/reference for mitochondria (rCRS). The number of mapped reads to the corresponding reference is indicated below each label.
Figure 3 with 7 supplements
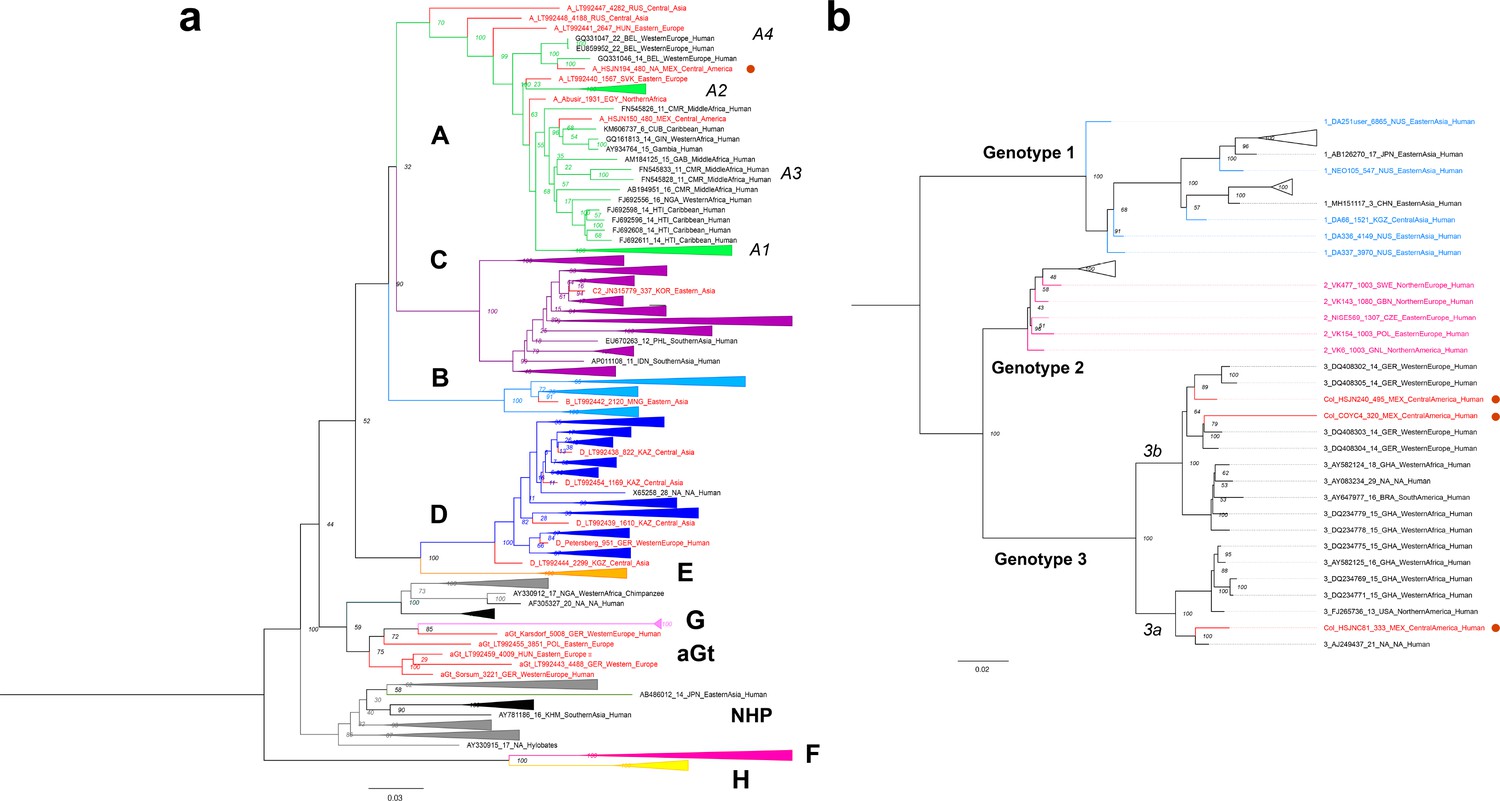
Viral Colonial genomes are similar to modern African genetic diversity.
(a, b) Maximum likelihood trees performed on RAxML 8.2.10 (1000 bootstraps) with a midpoint root Genotypes are named in bold letters and sub-genotypes in italics. Bootstrap values are shown at the node center, and triangles represent collapsed sequences from other genotypes. Sequences are named as follows: genotype_ID_sampling.year_country.of.origin_area.of.origin_host. Sequences from this study are highlighted with a red circle on the right. (a) Based on the HBV whole genome, genotypes are named with letters and each is colored differently, while ancient sequences are shown in red. NHP: non-human primates. (b) Based on B19V CDS, genotypes are named with numbers, and only ancient genomes are colored.
Figure 3—figure supplement 1
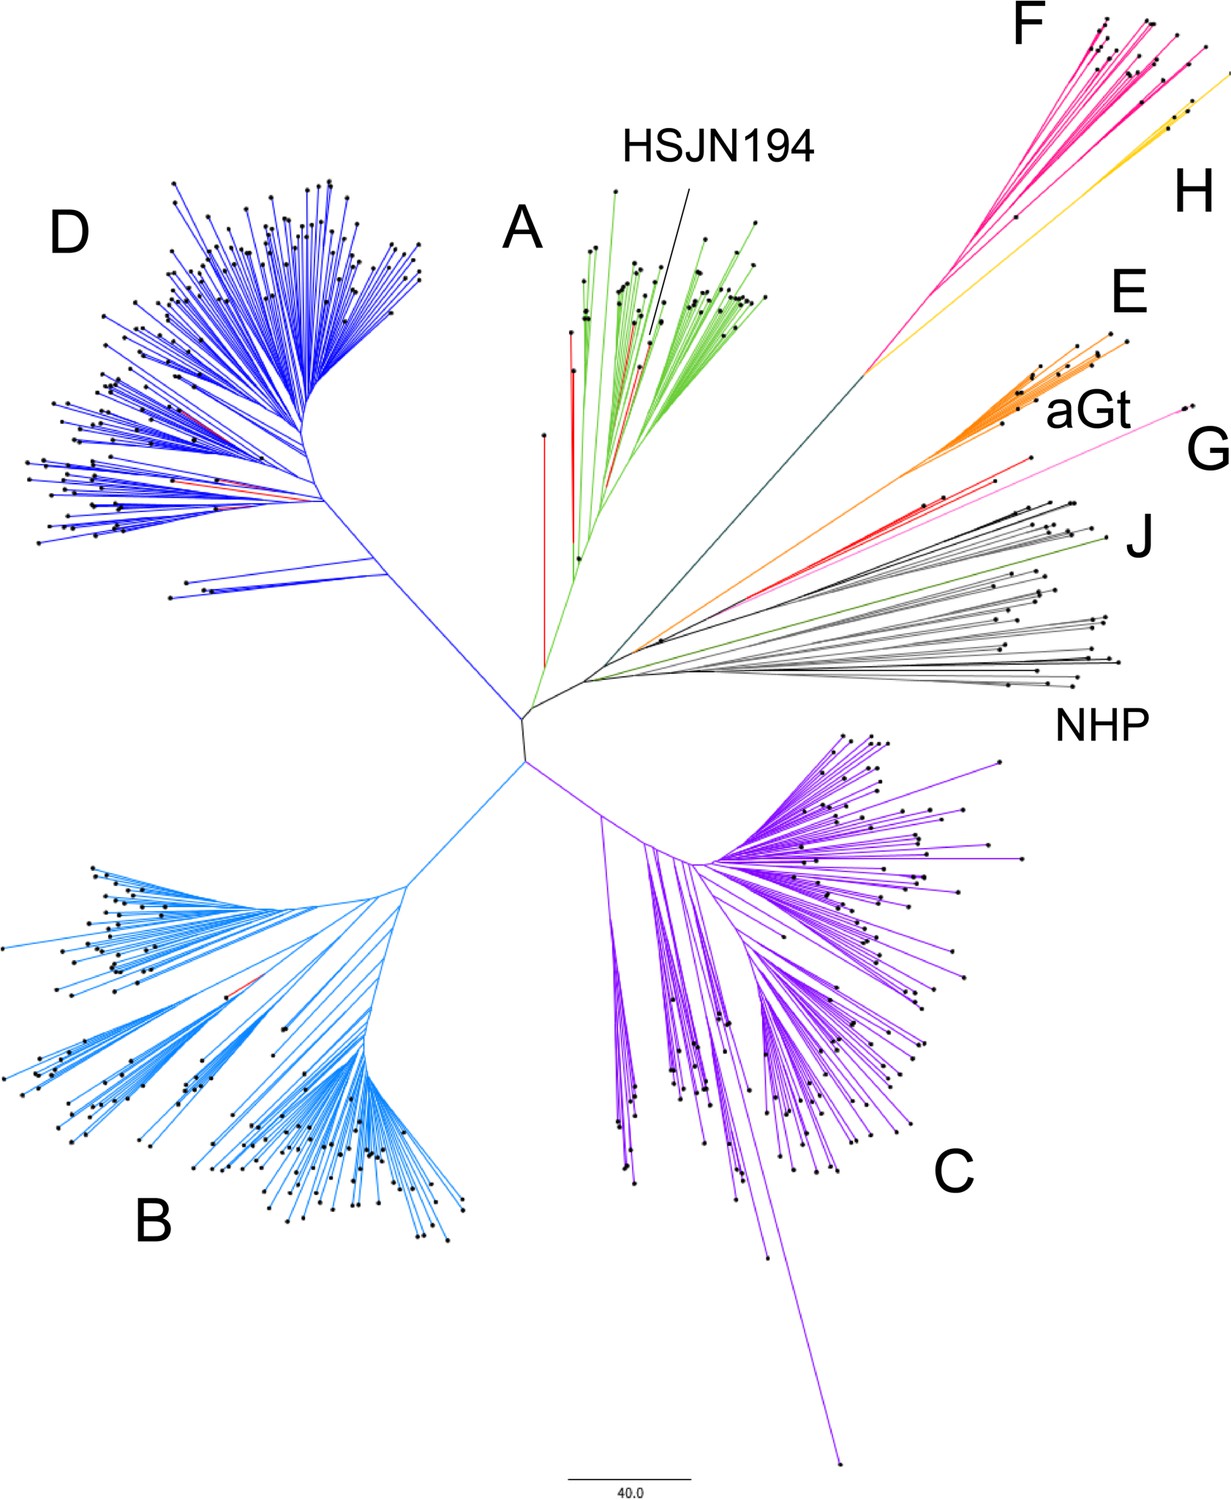
Phylogenetic analysis of HBV.
Modern sequences are colored by genotype; A: green; B: aqua; C: purple; D: blue; E: orange; F: magenta; G: pink; H: yellow; J: fern; monkeys (non-human primates): gray, while ancient genomes and aGt (ancient genotype) are in red. NHP: non-human primates. Neighbor-joining tree constructed with MEGA based on a number of differences model with 1000 bootstraps with 604 genomes each represented with a black dot; tree was formatted on FigTree 1.4.3.
Figure 3—figure supplement 2
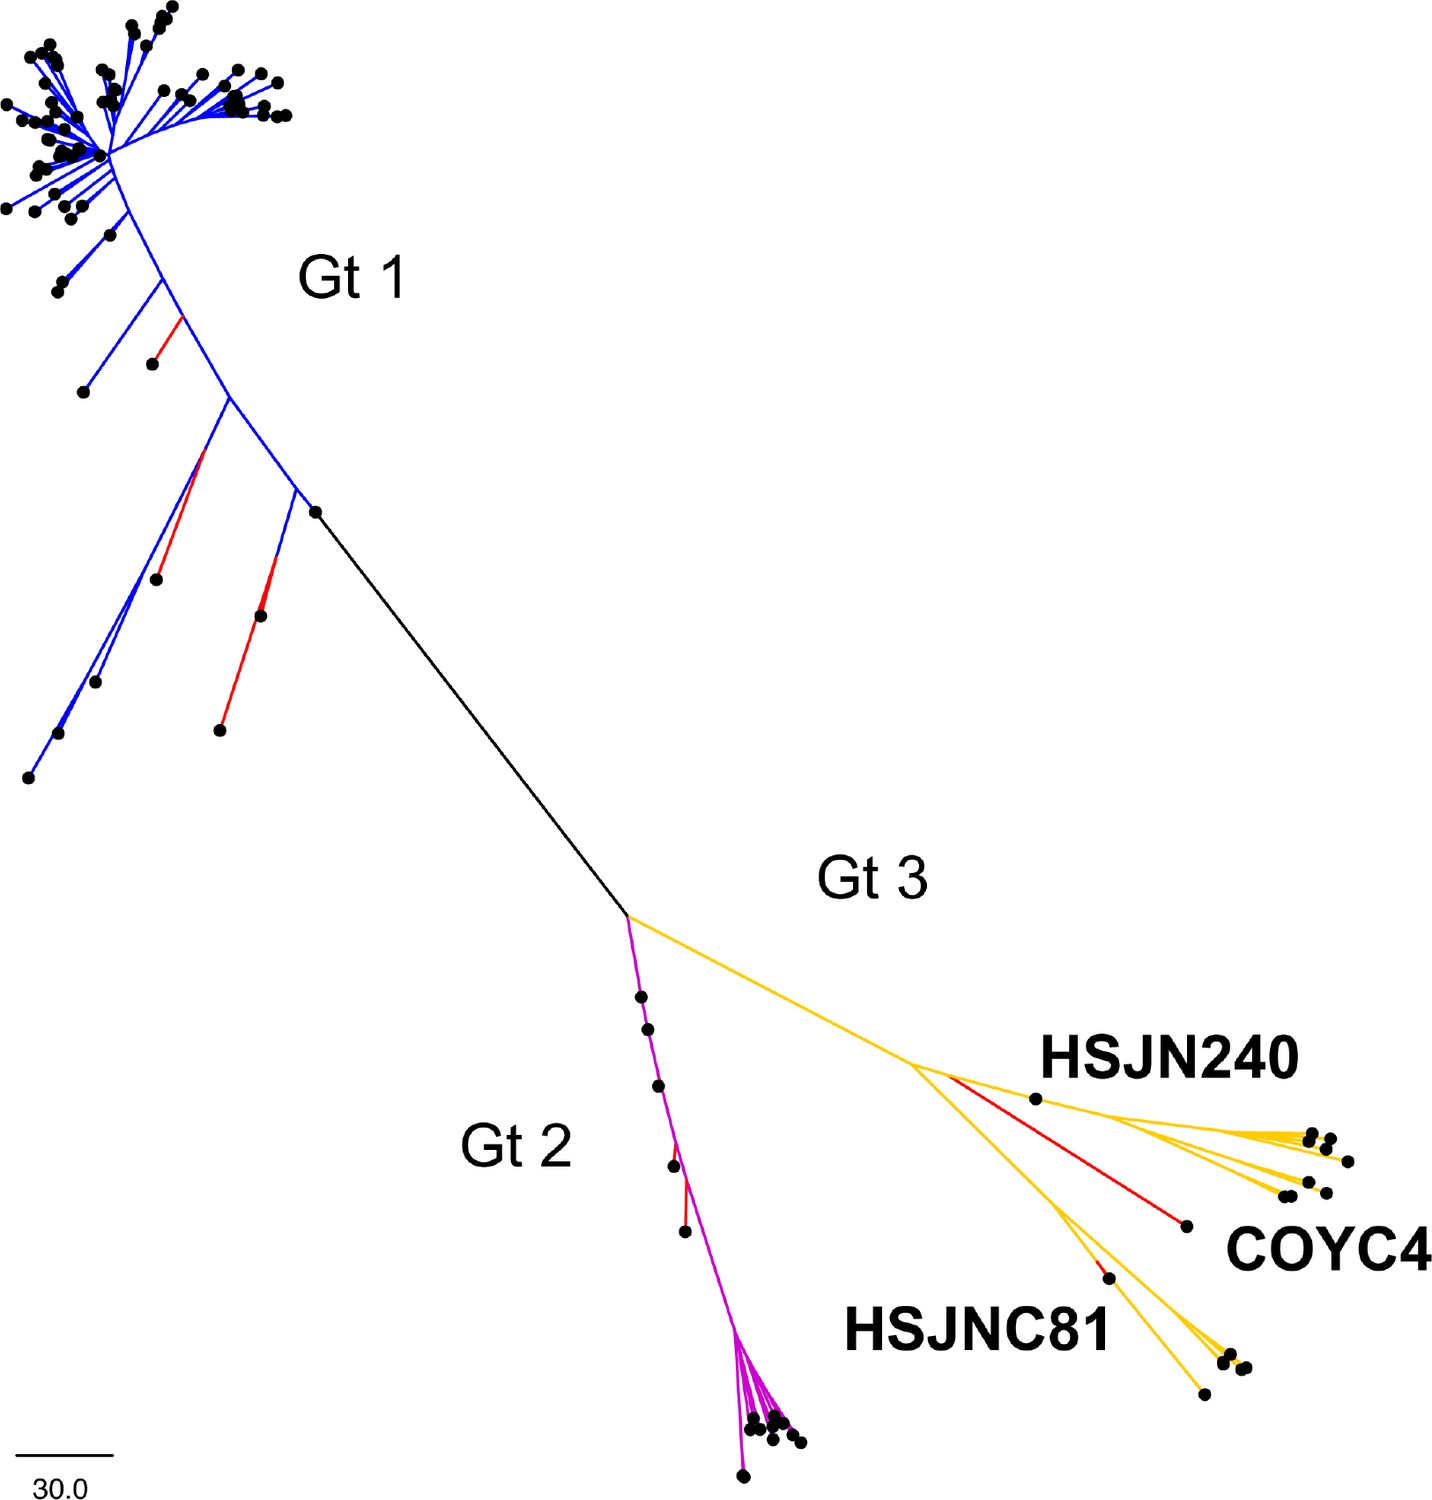
Neighbor-joining analysis of B19V.
Tree constructed with MEGA based on a number of differences model with 1000 bootstraps. Genotypes 1, 2, and 3 are shown with blue, magenta, and yellow, respectively. Ancient genomes are shown in red. Tree was formatted on FigTree 1.4.3.
Figure 3—figure supplement 3
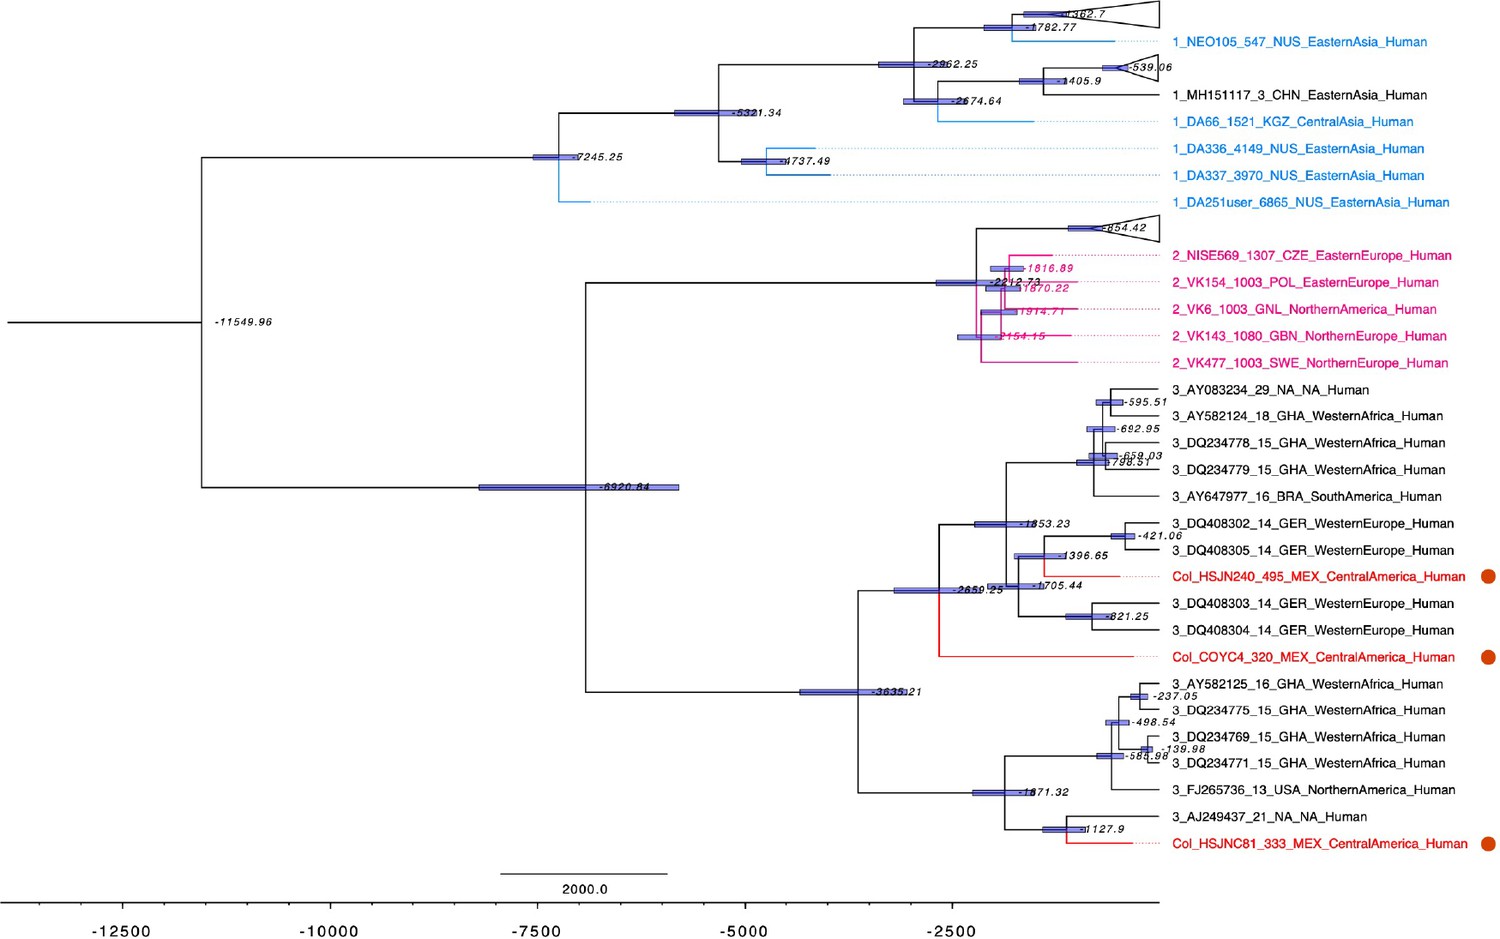
Dated coalescent phylogenetic analysis for B19V.
Dated maximum clade credibility tree constructed with BEAST 2.5.1 using a constant population prior and a strict molecular clock; median node ages are shown in italics and 95% highest posterior density shown as blue bars, modern genomes are black while ancient genomes are colored, and Colonial genomes from this study are shown in red. Y-axis is shown in ybp, and sequences from this study are highlighted with red circles. Tree was formatted on FigTree 1.4.3.
Figure 3—figure supplement 4
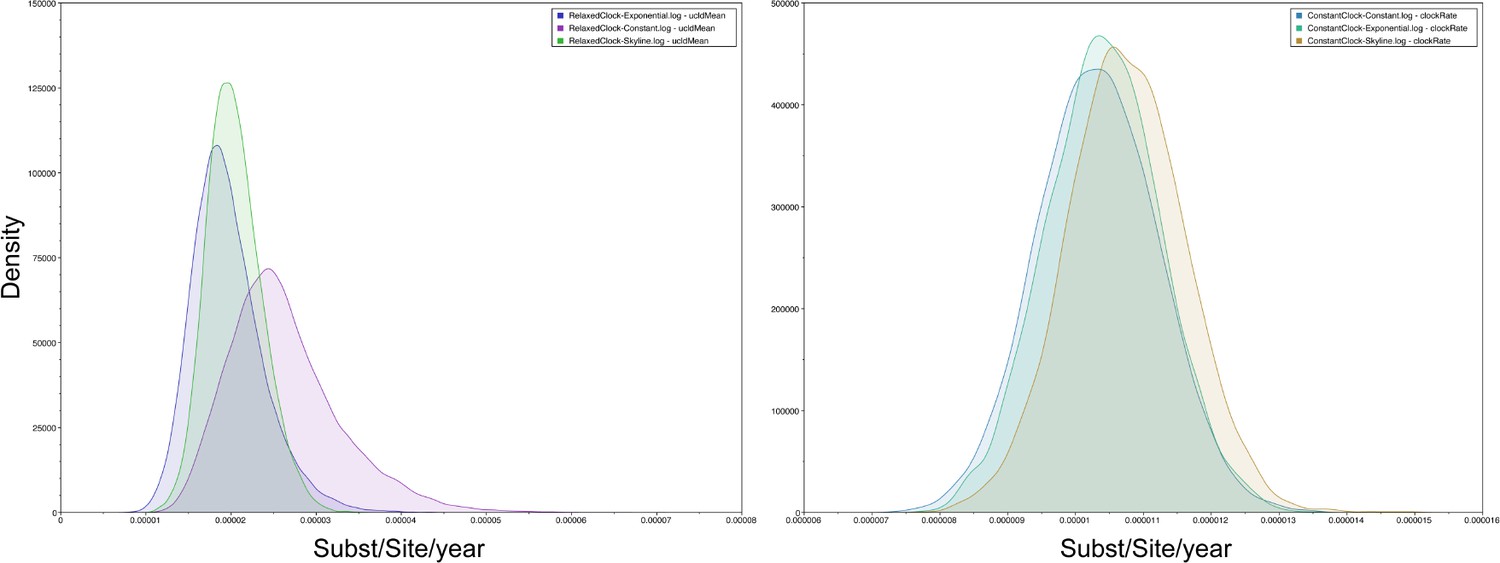
Posterior probability densities of B19V dated coalescent phylogeny.
Posterior probability densities of mean evolutionary rate estimated with constant, exponential, Bayesian skyline population priors with a strict (left) and relaxed molecular clock (right).
Figure 3—figure supplement 5
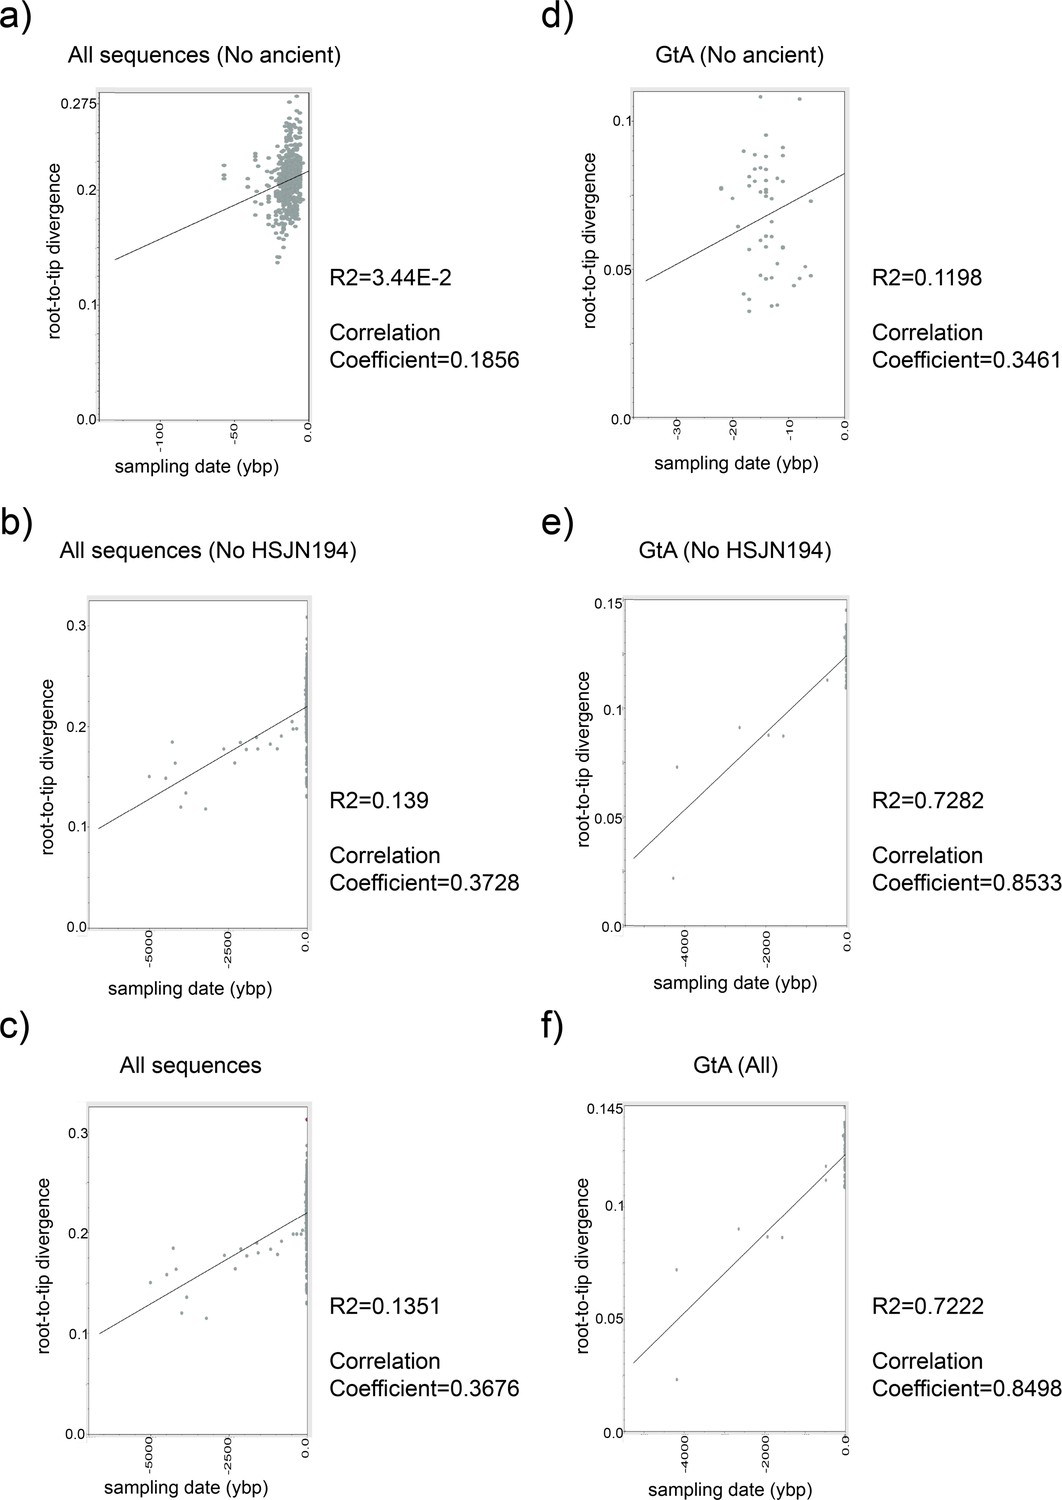
Root-to-tip regression analysis of HBV temporal structure.
Root-to-tip genetic distances on the Y-axis were plotted against sampling time on the X-axis using Tempest 1.5.3. Each dot is an HBV genome in our ML analysis, and the central line represents the regression line to which the evolution followed a clock-like pattern. Analyses performed were (a) all sequences (HBV_DS2) without ancient; (b) without Colonial samples; and (c) with all genomes (including ancient). Same approach was considered (d–f) for genotype A only.
Figure 3—figure supplement 6
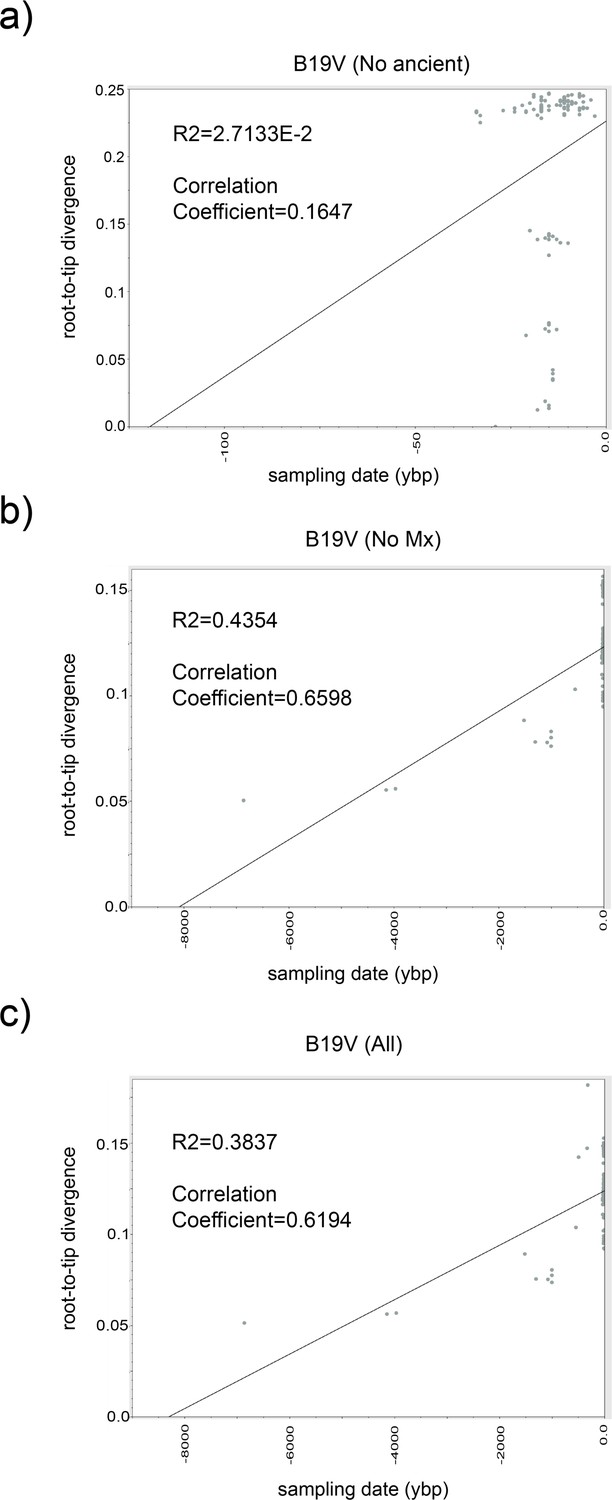
Root-to-tip regression analysis of B19V temporal structure.
Root-to-tip genetic distances were plotted against sampling time using Tempest 1.5.3. Each dot is an B19V genome in our ML analysis, and the central line represents the regression line to which the evolution followed a clock-like pattern. Analyses were performed with B19V_DS2 including (a) only modern sequences, (b) without Colonial samples, and (c) with all genomes (including ancient).
Figure 3—figure supplement 7
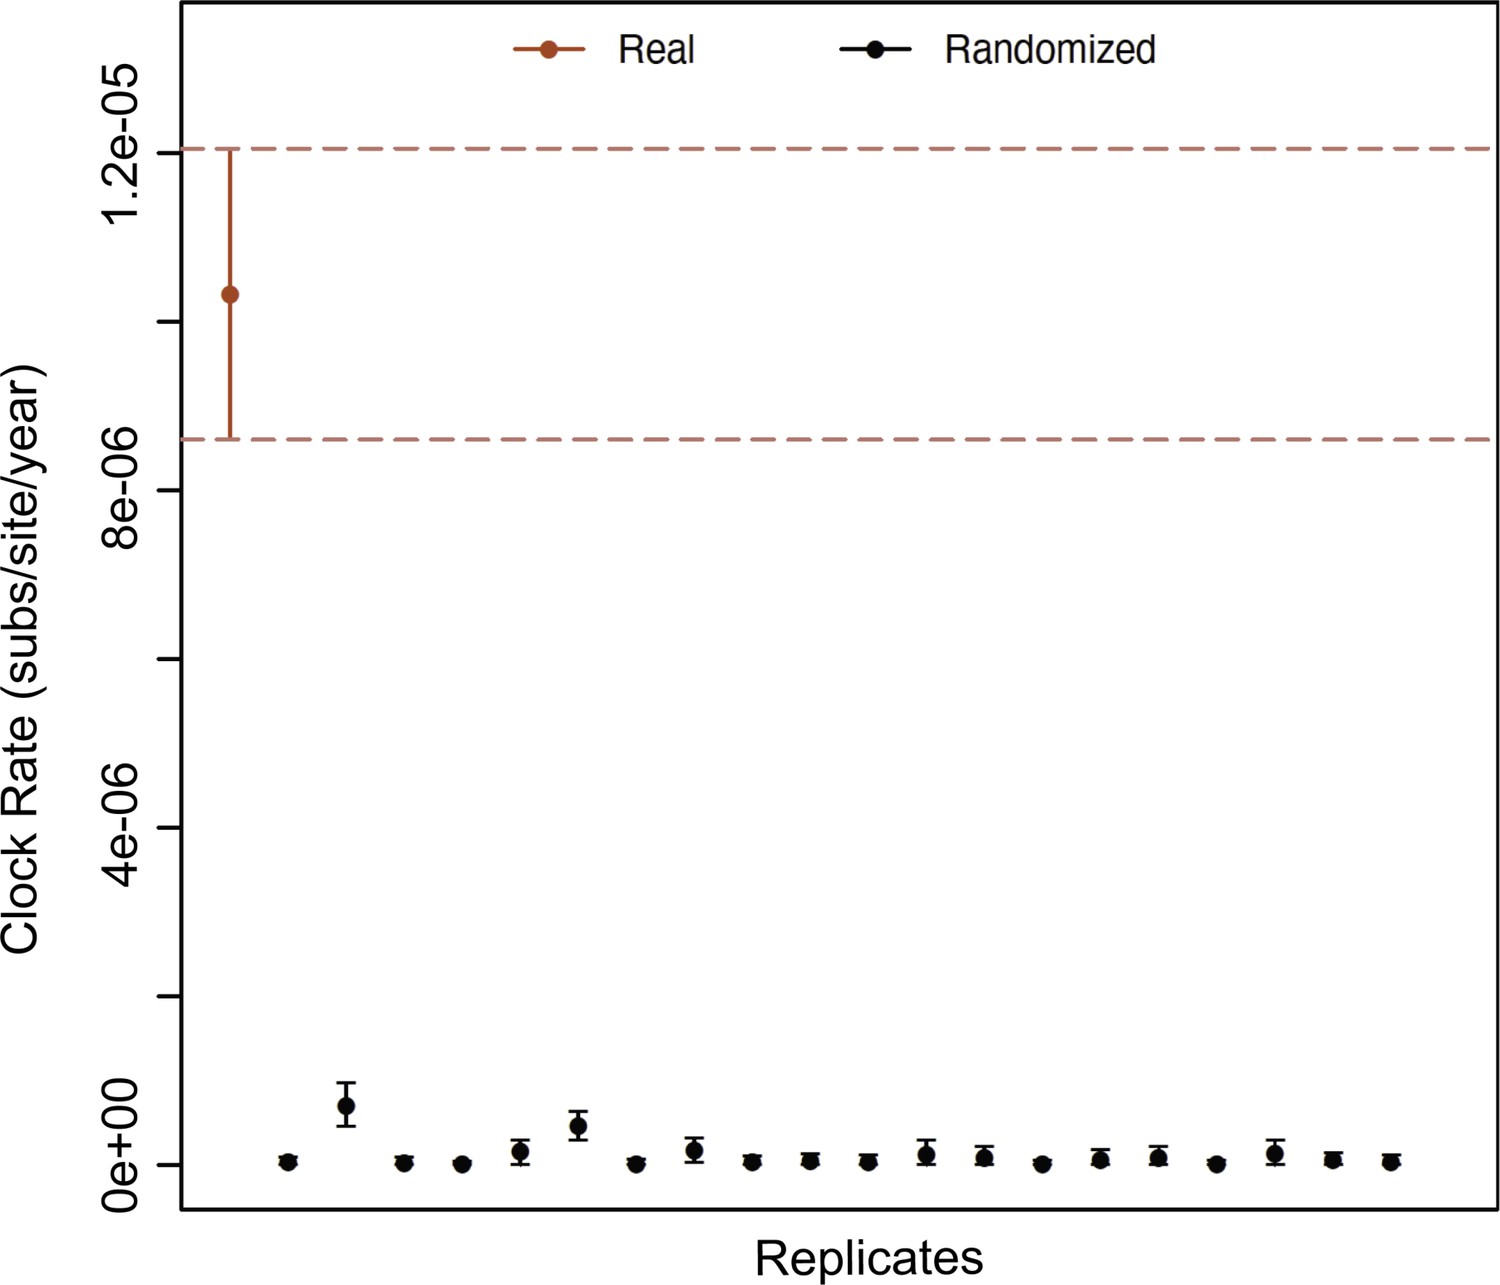
Date randomization test B19V.
Estimation of clock rates (subs/site/year) using 20 replicates with randomized dates (black dots) of the B19V_DS2 using a strict molecular clock and constant population prior. The dataset with the real sampling dates is shown as a red dot, and the 95% credible intervals are shown as error bars.
Figure 4 with 3 supplements

Human hosts are similar to modern African genetic diversity.
(a) Principal component analysis (PCA) showing genetic affinities of ancient human hosts compared to the 1000 Genomes Project reference panel. Crosses (X) show individuals from the reference panel while other shapes show human hosts from which ancient HBV (HSJN194) and B19V (HSJNC81, HSJN240, COYC4) sequences were recovered. Clusters are colored in five super populations. EUR: Europeans (IBS, CEU); EAS: East Asian (CHB); AMR: Admixed populations from the Americas (MXL, PEL); SAS: South Asians (CHS); and AFR: Africans (YRI, MSL). Three-letter code is based on the 1000 Genomes Project nomenclature. (b) ADMIXTURE analysis with COYC4 intersected sites with 1000 Genomes MEGA array, run with k = 4 for 100 replicates. Each color shows a different component using the same colors as in the PCA. In the center, a pie chart shows the proportion of Native American (green).
Figure 4—figure supplement 1
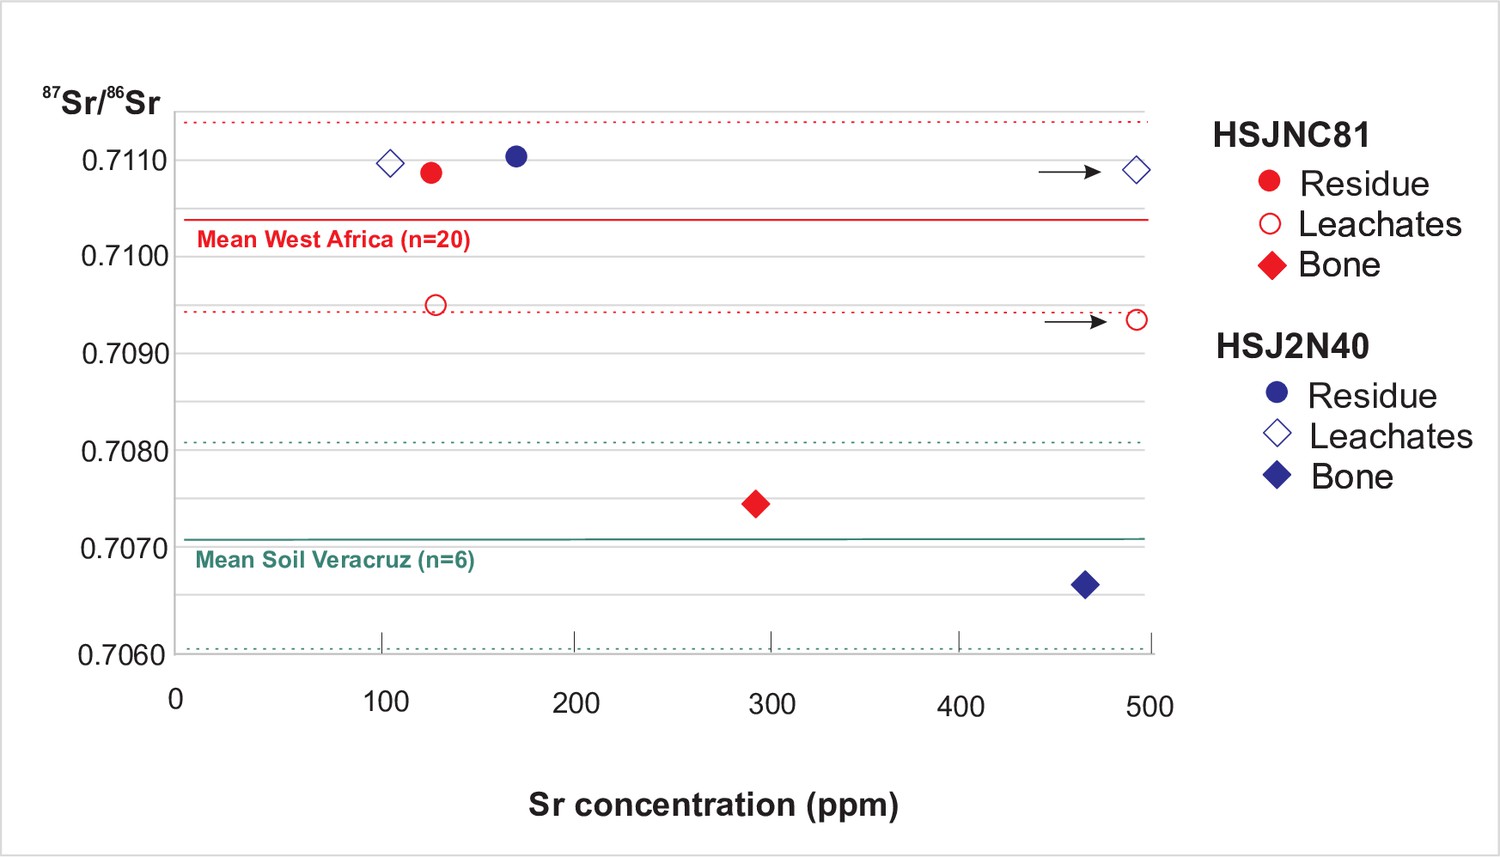
87 Sr/86 Sr and Sr concentrations from HSJN individuals.
Analytical results are given in Supplementary file 2b. Arrowhead refers to second leachate values outside the graph. Red and green lines represent average 87Sr/ 86Sr values (solid lines) and one standard deviation (dashed lines) for West Africa igneous and metamorphic rocks (0.71041 ± 0.00099, Supplementary file 2C) and eastern TMVB soils in Veracruz, Mexico (0.70703 ± 0.0011; Solís-Pichardo et al., 2017), respectively. The average 87Sr/ 86Sr of central TMVB soils (0.70449 ± 0.00025, n = 14; Solís-Pichardo et al., 2017) is not shown. Error bars are smaller than labels.
Figure 4—figure supplement 2
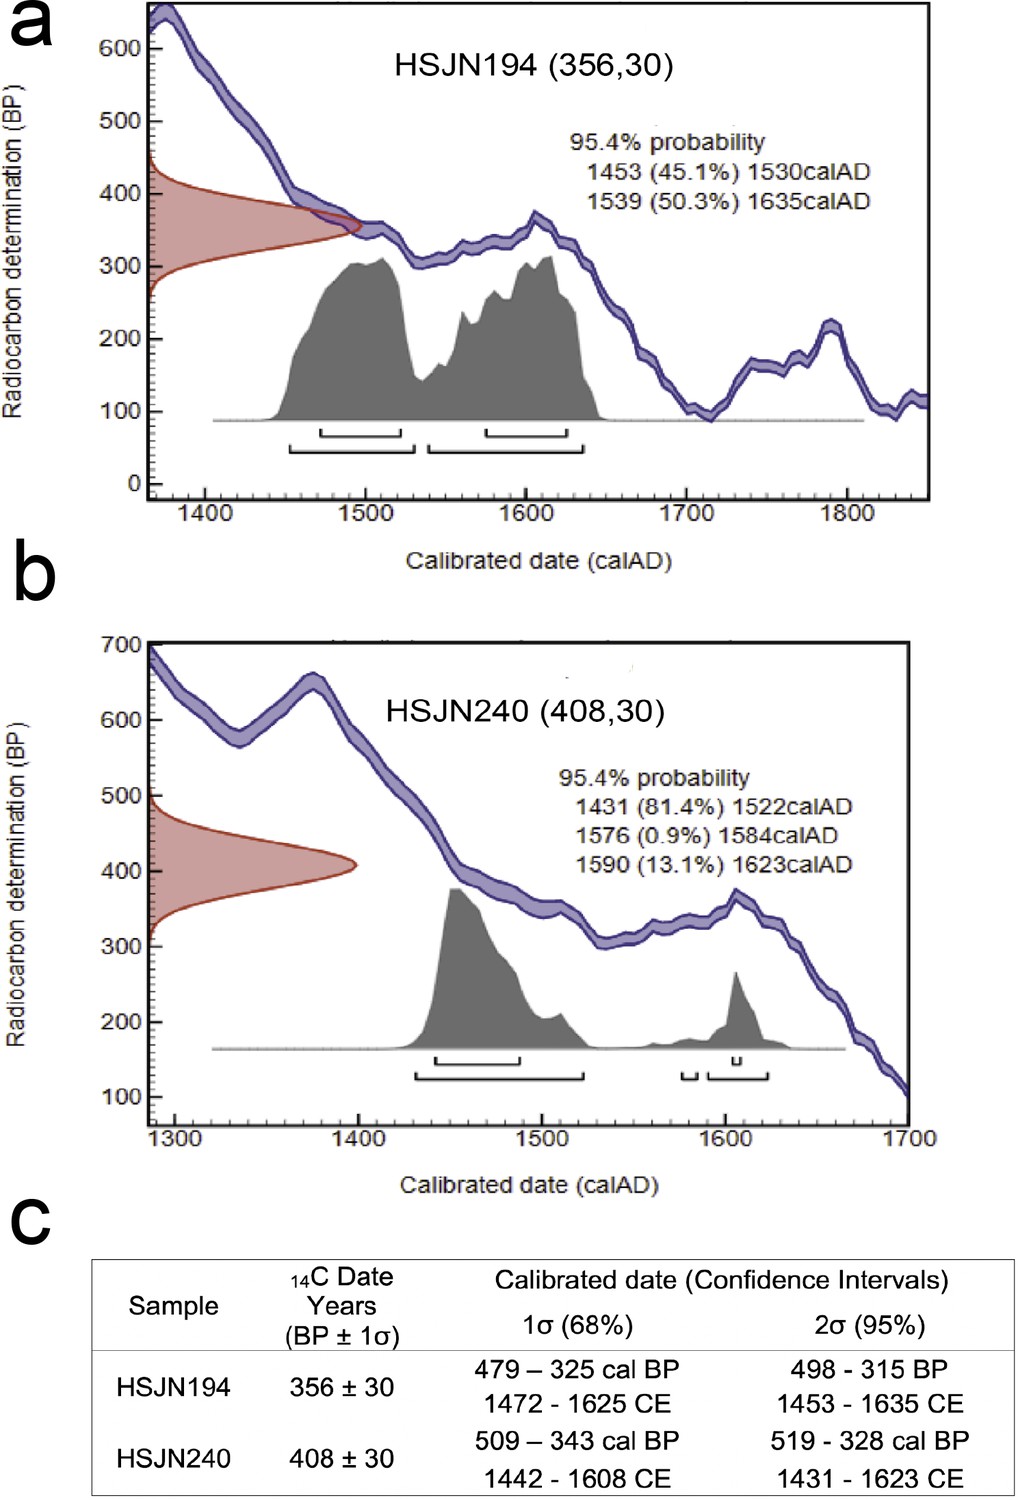
Radiocarbon dating.
Radiocarbon dating calibrated on OxCal 4.3.2, based on IntCal13 atmospheric curve for HSJN194 (a) and HSJN240 (b). The radiocarbon determination of the samples is shown on the Y-axis, while the calibration based on known standards is shown as a double blue line. The calibrated date is on the X-axis, and the likelihood age of the sample is shown as a gray solid distribution. A summary of the calibrated interval dates is shown in (c). BP is considered as 1950 CE.
Figure 4—figure supplement 3
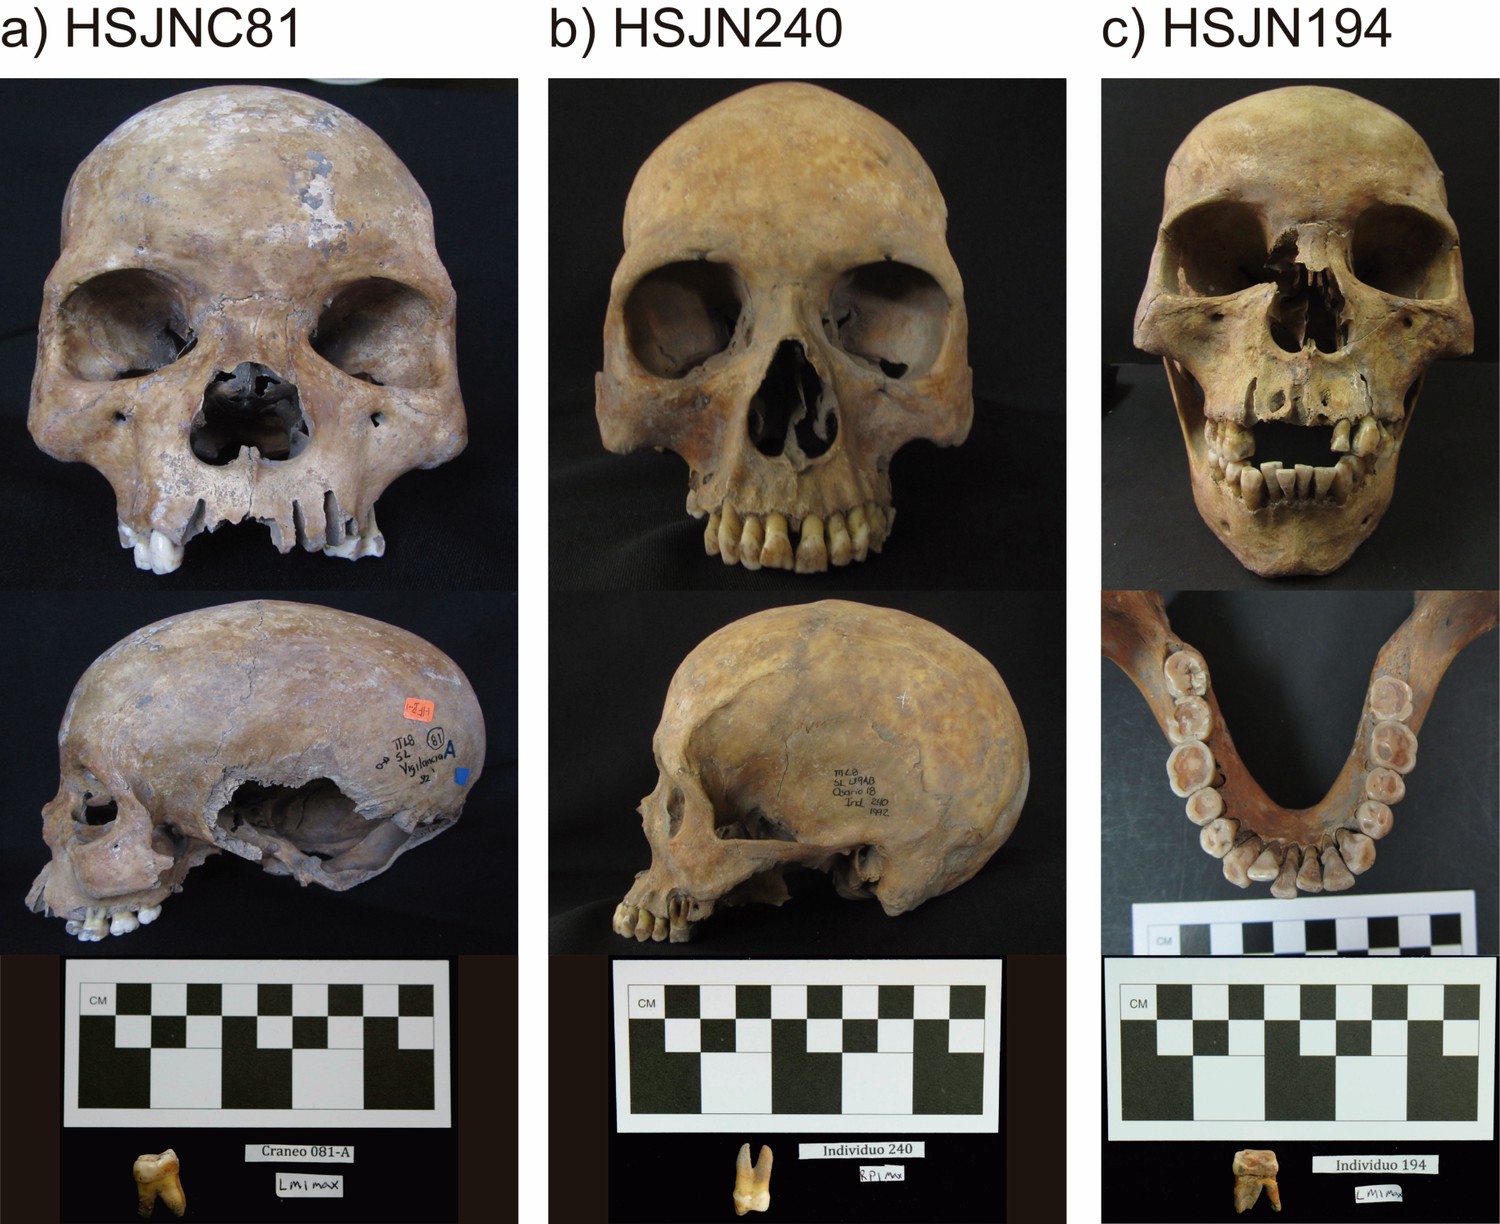
Individuals from the HSJN positive for ancient viruses.
Pictures of HSJN individuals and their respective tooth from which aDNA was extracted to reconstruct B19V ((a) HSJNC81; (b) HSJN240) and HBV ((c) HSJN194) genomes. Only one tooth is shown for HSJN240.
Additional files
-
Supplementary file 1
Viral and phylogenenic analyses.
(A) Viral families included in customized capture design. Twenty-five whole genomes from different viruses were included in our customized capture design, as well as a selection of genes from Herpesviridae and Poxviridae (VARV). Raw or consensus sequences were used as described in Materials and methods. (B). Enrichment yield of HBV-like or B19V-like hits. The metagenomic analysis was carried out with MALT 0.4.0 based on the NCBI RefSeq Viral database, hits were normalized automatically between capture assay(s) and shotgun assay(s) per sample in MEGAN 6.8.0. HSJN177 was considered a negative control for capture based on the shotgun metagenomic analysis. Fold enrichment was calculated as (normalized target capture hits/normalized target shotgun hits). *Two independent NGS libraries were constructed (and then captured) from two different tooth samples belonging to the same individual. NA: not available. (C) . Mapping statistics for ancient viral genome reconstruction. Viral enriched NGS libraries were sequenced and mapped to the human genome (hg19); unmapped reads are shown as total sequences. Number of reads kept in subsequent steps of B19V (COYC4, HSJNC81, HSJN240) and HBV (HSJN194) genome reconstruction are shown as well (Materials and methods). *A second independent round of capture was sequenced deeper in order to obtain a better coverage of the targeted viral ancient genome. **A different tooth was used to construct an independent library for the same individual. #Coverage and depth calculated based on the B19V CDS (AB550331) or whole HBV genome (GQ331046). (C). BEAST analysis of B19V evolutionary rates and MRCA. Overview of B19V Bayesian evolutionary analyses with different molecular clock and priors used. (a) Comparison of median root age and substitution rates. (b) Comparison of MRCA per genotype.
- https://cdn.elifesciences.org/articles/68612/elife-68612-supp1-v2.xlsx
-
Supplementary file 2
Human and strontium analyses.
(A) Information for the human skeletal remains from which ancient viral genomes were recovered. (B) . 87 Sr/86 Sr in teeth (enamel) and bones in individuals HSJNC81 and HSJN240. Lix1, Lix2, and Res correspond to the leaching stages. Errors during measurement are presented as one standard deviation with the last two digits (1 sd = ± 1σabs). 1 SE(M) = 1 sd/square root n. n = number of runs per analysis. Sr concentrations were determined with the Isotope Dilution technique. ppm = parts per million. The Eimer and Amend (EuA) Sr standard was analyzed during teeth and bone measurements. The certified 87Sr/ 86Sr value of this standard is 0.7080 ± 0.0004 (Fairbairn et al., 1967).(C) . 87 Sr/86 Sr sources from West Africa and Trans Mexican Volcanic Belt (TMVB) used for calibration. Compilation of 87Sr/86Sr from West Africa for groups A (Liégeois et al., 1991), B (Bernard-Griffiths et al., 1988), C (Peucat et al., 2005), D (Ferrière et al., 2010), E (Fullgraf et al., 2013), and F (Sakyi et al., 2018) while G (Solís-Pichardo et al., 2017) correspond to the TMVB for isotopic comparison.
- https://cdn.elifesciences.org/articles/68612/elife-68612-supp2-v2.xlsx
-
Transparent reporting form
- https://cdn.elifesciences.org/articles/68612/elife-68612-transrepform1-v2.docx
-
Source data 1
Multi-fasta alignment of all genomes used to perform phylogenetic analysis of B19V.
- https://cdn.elifesciences.org/articles/68612/elife-68612-supp3-v2.txt
-
Source data 2
Multi-fasta alignment of all genomes used to perform phylogenetic analysis of HBV.
- https://cdn.elifesciences.org/articles/68612/elife-68612-supp4-v2.txt
Download links
A two-part list of links to download the article, or parts of the article, in various formats.
Downloads (link to download the article as PDF)
Open citations (links to open the citations from this article in various online reference manager services)
Cite this article (links to download the citations from this article in formats compatible with various reference manager tools)
Ancient viral genomes reveal introduction of human pathogenic viruses into Mexico during the transatlantic slave trade
eLife 10:e68612.
https://doi.org/10.7554/eLife.68612


