A bidirectional corticoamygdala circuit for the encoding and retrieval of detailed reward memories
- Department of Psychology, University of California, Los Angeles, United States
- Brain Research Institute, University of California, Los Angeles, United States
- Integrative Center for Learning and Memory, University of California, Los Angeles, United States
- Intellectual and Developmental Disabilities Research Center, Semel Institute for Neuroscience and Human Behavior, David Geffen School of Medicine, University of California, Los Angeles, United States
- Integrative Center for Addictive Disorders, University of California, Los Angeles, United States
Figures
Figure 1 with 5 supplements
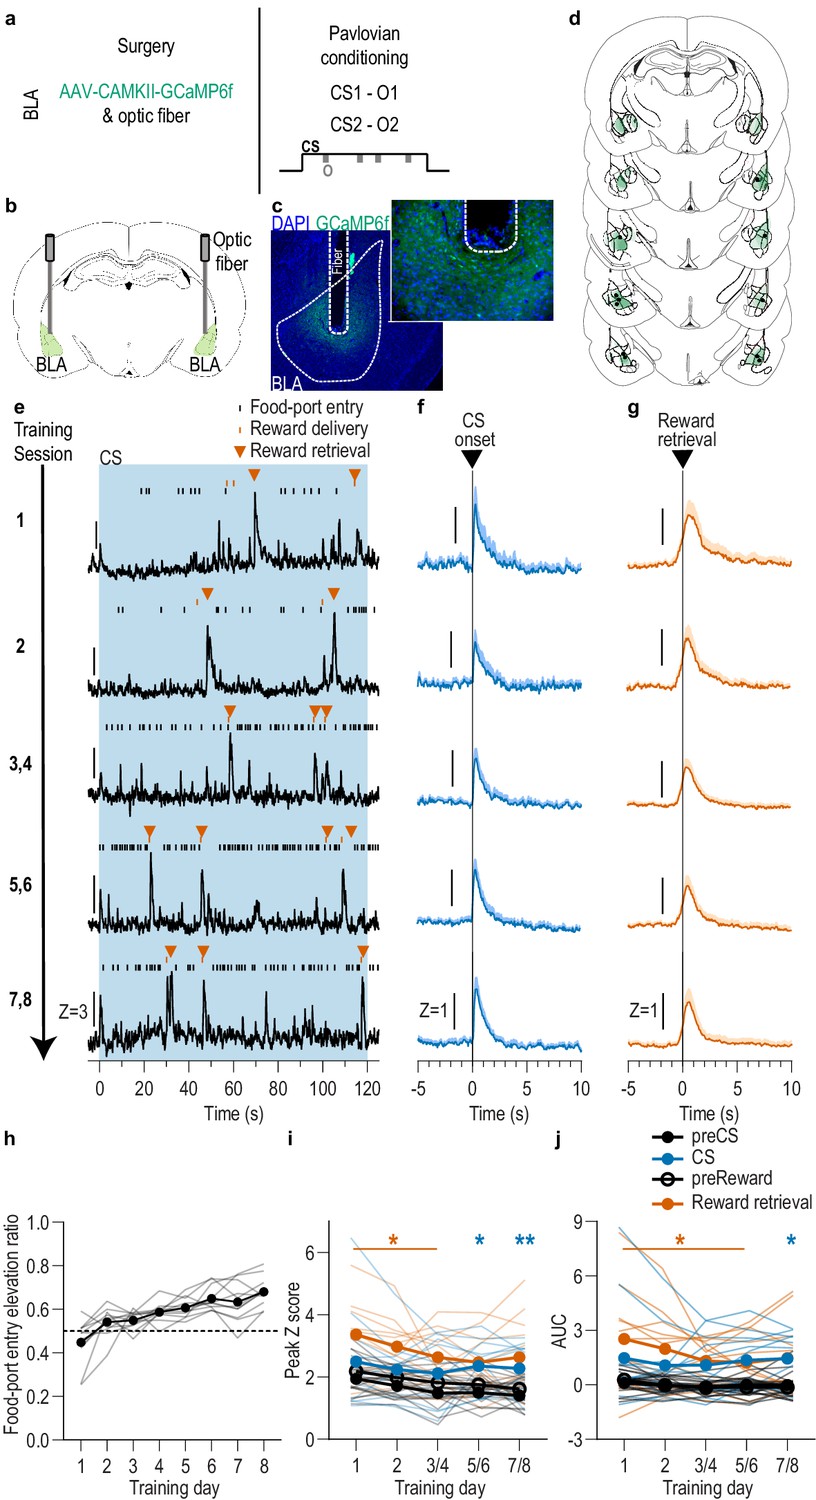
BLA neurons are activated during stimulus-outcome learning.
(a). Procedure schematic. CS, conditional stimulus (white noise or tone); O, outcome (sucrose solution or food pellet). (b) Schematic of fiber photometry approach for imaging bulk calcium activity in BLA neurons. (c) Representative fluorescent image of GCaMP6f expression and fiber placement in the BLA. (d) Schematic representation of GCaMP6f expression and placement of optical fiber tips in BLA for all subjects. Brain slides from Paxinos and Watson, 1998. (e) Representative examples of GCaMP6f fluorescence changes (Z-scored ∆F/F) in response to CS presentation (blue box), reward delivery, and reward retrieval (first food-port entry following reward delivery) across days of training. Traces from the last 6 days of training were selected from one of each two-session bin. See Figure 1—figure supplement 2 for raw GCaMP and isosbestic signal fluctuations. (f-g) Trial-averaged GCaMP6f fluorescence changes (Z-scored ∆F/F) in response to CS onset (f; blue) or reward retrieval during the CS (g; orange) across days of training. Shading reflects between-subjects s.e.m. Data from the last six sessions were averaged across two-session bins (3/4, 5/6, and 7/8). (h) Elevation [(CS probe entry rate)/(CS probe entry rate + preCS entry rate)] in food-port entries during the CS probe period (after CS onset, before first reward delivery), averaged across trials and across the 2 CSs for each day of Pavlovian conditioning. Gray lines represent individual subjects. (i-j) Trial-averaged quantification of maximal (i; peak) and area under the GCaMP Z-scored ∆F/F curve (j; AUC) during the 3 s period following CS onset or reward retrieval compared to equivalent baseline periods immediately prior to each event. Thin light lines represent individual subjects. N = 11 (see Figure 1—figure supplement 3 for data from N = 8 subjects with longitudinal data from each session). *p<0.05, **p<0.01 relative to pre-event baseline. See Figure 1—source data 1.
-
Figure 1—source data 1
Source data for Figure 1 and Figure 1—figure supplement 1–5.
- https://cdn.elifesciences.org/articles/68617/elife-68617-fig1-data1-v2.xlsx
Figure 1—figure supplement 1

Food-port entry rate during Pavlovian conditioning for BLA fiber photometry GCaMP6f imaging experiment.
Food-port entry rate (entries/min) during the CS probe period (after CS onset, before first reward delivery), averaged across trials and across the 2 CSs for each day of Pavlovian conditioning. Rats increased food-port approach responses to the CS across training (CS x Training: F(7,70) = 15.31, p<0.0001; CS: F(1,10) = 48.30, p<0.0001; Training: F(7,70) = 10.42, p<0.0001). ***p<0.0001, relative to preCS.
Figure 1—figure supplement 2

Representative examples of raw GCaMP6f and isosbestic fluorescent changes in response to cue presentation and reward delivery and retrieval across days of training.
Raw GCaMP6f (470 nm channel) fluorescence and corresponding fitted fluorescent trace from the isosbestic (415 nm) channel.
Figure 1—figure supplement 3
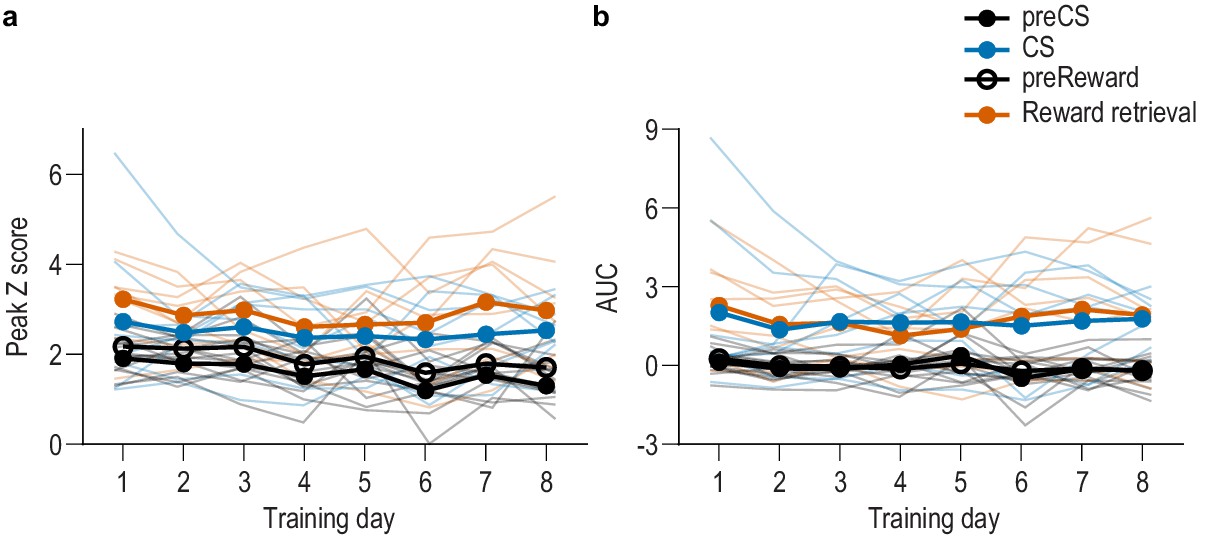
BLA neurons are activated during stimulus-outcome learning across each of the eight Pavlovian conditioning sessions.
(a–b) Trial-averaged quantification of maximal (a; peak) and area under the GCaMP Z-scored ∆F/F curve (b; AUC) during the 3 s following CS onset or reward retrieval compared to equivalent baseline periods immediately prior to each event from the N = 8 subjects for which we were able to obtain reliable recordings from each of the 8 Pavlovian conditioning sessions. Thin light lines represent individual subjects. Both CS and reward retrieval caused a similar elevation in the peak calcium response (Event v. baseline F(0.3,1.9) = 28.14, p=0.03; Training, Event type (CS/US), and all other interactions between factors, lowest p=0.12) and area under the calcium curve (AUC; Event v. baseline F(0.2,1.2) = 40.57, p=0.04, Training, Event type (CS/US), and all other interactions between factors, lowest p=0.21) across training. Analysis of each event relative to its immediately preceding baseline period confirmed that BLA neurons were robustly activated by both the onset of the CS as reflected in the peak calcium response (CS: F(1,7) = 9.95, p=0.02; Training: F(3.0,21.3) = 1.58, p=0.22; CS x Training: F(1.5,10.7) = 0.43, p=0.61) and AUC (CS: F(1,7) = 9.01, p=0.02; Training: F(2.3,16.0) = 0.56, p=0.60; CS x Training: F(1.5,10.2) = 0.30, p=0.68), as well as at reward retrieval during the CS [(Peak, Reward: F(1,7) = 12.22, p=0.01; Training: F(3.5,24.1) = 1.18, p=0.34; Reward x Training: F(2.5,17.4) = 1.75, p=0.20) AUC, Reward: F(1,7) = 13.73, p=0.008; Training: F(2.4,17.1) = 1.19, p=0.34; Reward x Training: F(3.0,21.3) = 2.46, p=0.09].
Figure 1—figure supplement 4
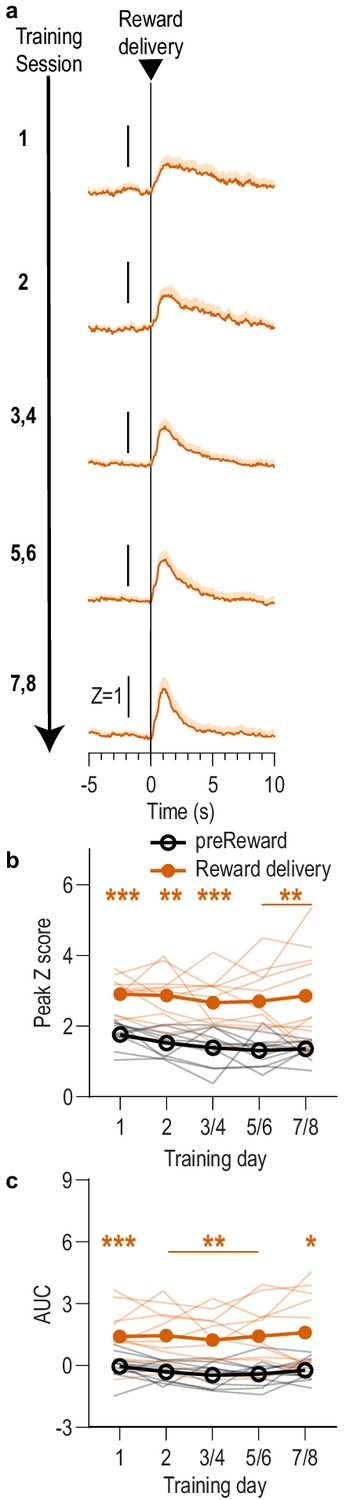
BLA reward responses aligned to reward delivery during Pavlovian conditioning.
We detected a robust BLA response to reward retrieval during CS presentation during Pavlovian conditioning. This response was also detected when the data were aligned to reward delivery, which was signaled by the subtle but audible click of the pellet dispenser or sound of the sucrose pump. After initial training, reward retrieval often immediately followed reward delivery. (a) Trial-averaged GCaMP6f fluorescence (Z-scored ∆F/F) in response to reward delivery during the CS across days of training. Shading reflects between-subjects s.e.m. Data from the last six training sessions were averaged across 2-session bins (3/4, 5/6, and 7/8). (b) Trial-averaged quantification of maximal (peak) GCaMP Z-scored ∆F/F during the 3 s period following reward delivery compared to the equivalent baseline period 3 s prior to reward delivery. Thin light lines represent individual subjects. (c) Trial-averaged quantification of area under the GCaMP Z-scored ∆F/F curve (AUC) during the 3 s period following reward delivery compared to the equivalent baseline period. Across training, reward delivery caused a robust elevation in the peak calcium response (Reward delivery: F(1,10) = 57.73, p<0.0001; Training: F(2.5, 24.8)=1.29, p=0.30; Reward delivery x Training: F(1.8, 18.1)=0.43, p=0.64) and area under the calcium curve (Reward delivery: F(1,10) = 36.44, p=0.0001; Training: F(2.0, 19.7)=0.51, p=0.60; Reward delivery x Training: F(1.8,17.7) = 0.39, p=0.66). N = 11. *p<0.05, **p<0.01, ***p<0.001 relative to pre-event baseline.
Figure 1—figure supplement 5

Food-port entries during the CS in the absence of reward do not trigger a BLA response.
We detected a robust elevation in BLA calcium activity in response to reward retrieval during CS presentation during Pavlovian conditioning. To determine the extent to which the action of entering the food-delivery port influenced this response, we examined BLA calcium activity in response to food-port entries during the CS probe period (after CS onset, before first reward delivery). Trial-averaged GCaMP6f fluorescence (Z-scored ∆F/F) in response to food-port entries during the CS across days of training. Shading reflects between-subjects s.e.m. Data plotted on the same scale as Figure 1 and 1-4 to facilitate comparison. Data from the last six training sessions were averaged across two-session bins (3/4, 5/6, and 7/8). N = 11.
Figure 2
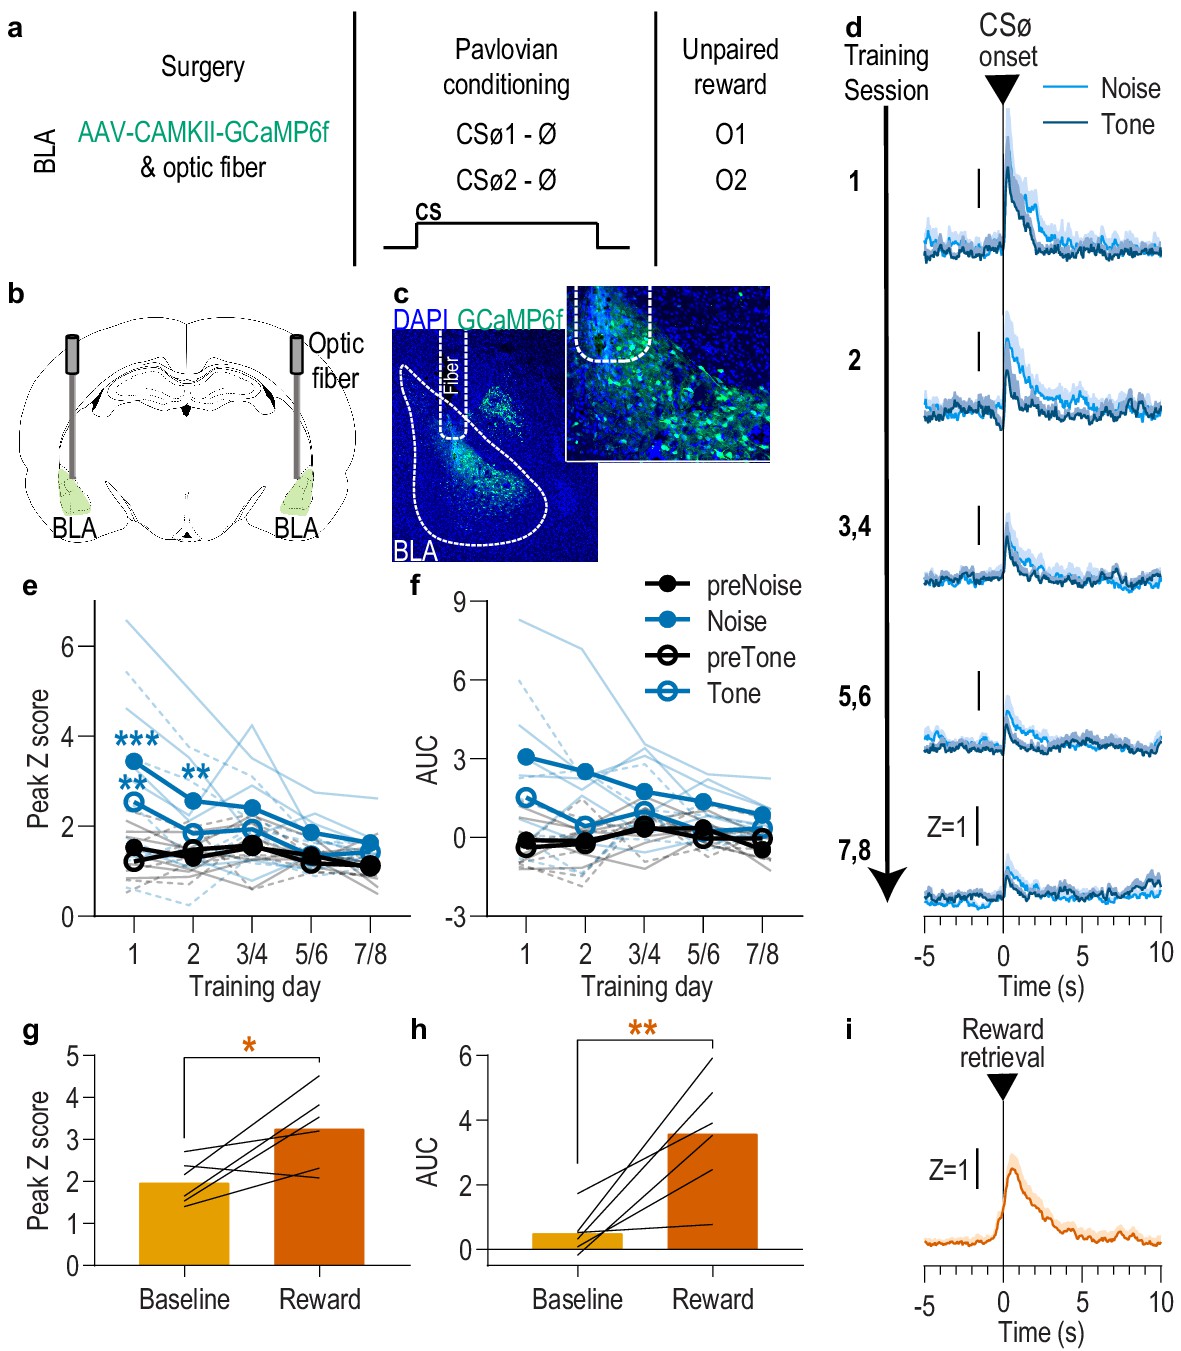
BLA neurons are only transiently activated by stimuli if they are not paired with reward.
(a). Procedure schematic. CSØ, neutral stimulus; Ø, no reward outcome; O, outcome (sucrose solution or food pellet). (b) Schematic of fiber photometry approach for imaging bulk calcium activity in BLA neurons. (c) Representative fluorescent image of GCaMP6f expression and fiber placement in the BLA. (d) Trial-averaged GCaMP6f fluorescence change (Z-scored ∆F/F) in response to noise and tone CSØ onset across days. Shading reflects between-subjects s.e.m. (e-f) Trial-averaged quantification of maximal (e; peak) and area under the GCaMP Z-scored ∆F/F curve (f; AUC) during the 3 s following noise and tone CSØ onset compared to equivalent baseline periods immediately prior to each event. Thin light lines represent individual subjects (solid = Noise, dashed = Tone). (g-h) Trial-averaged quantification of maximal (g; peak) and area under the GCaMP Z-scored ∆F/F curve (h; AUC) during the 3 s following retrieval of the unpaired reward compared to equivalent baseline period immediately prior reward retrieval. Lines represent individual subjects. (i) Trial-averaged GCaMP6f fluorescence (Z-scored ∆F/F) in response to unpaired reward, averaged across reward type. Shading reflects between-subjects s.e.m. N = 6. *p<0.05, **p<0.01 relative to pre-event baseline. See Figure 2—source data 1.
-
Figure 2—source data 1
Source data for Figure 2.
- https://cdn.elifesciences.org/articles/68617/elife-68617-fig2-data1-v2.xlsx
Figure 3 with 3 supplements
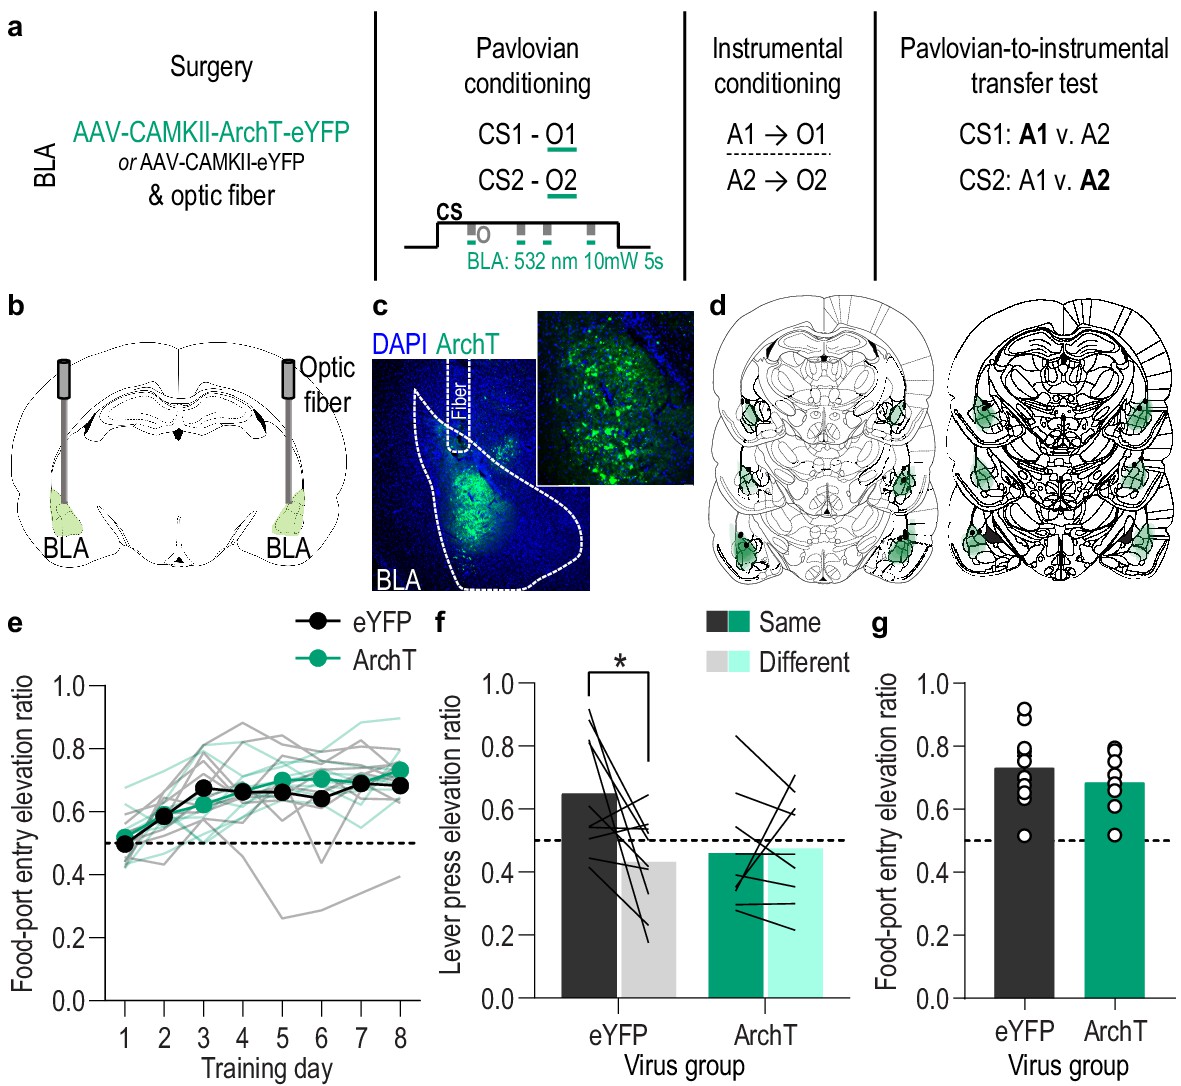
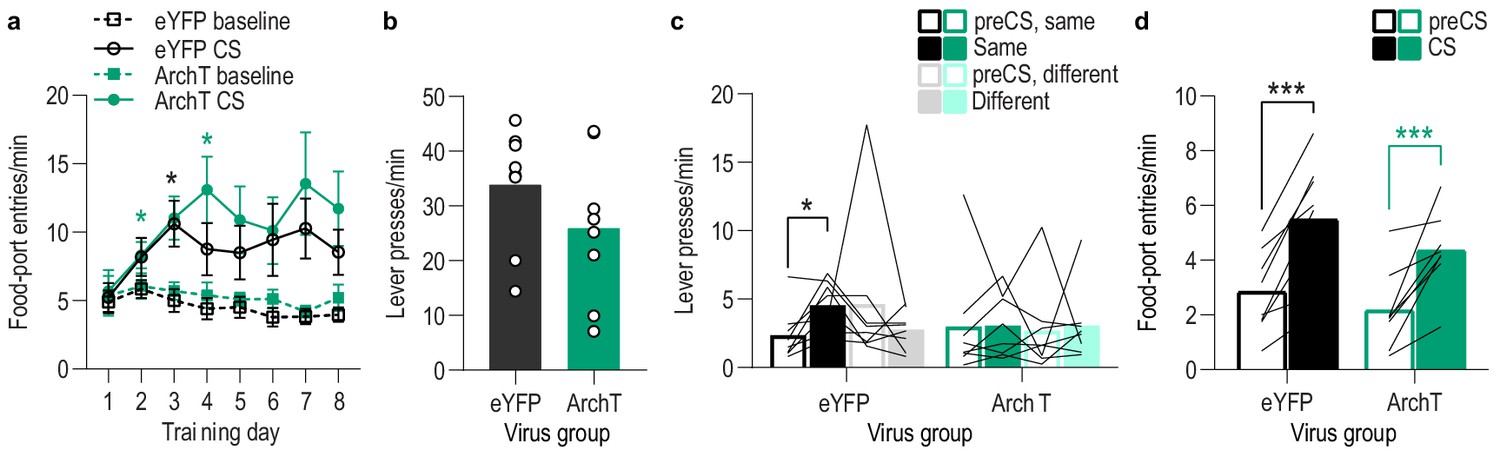
Optical inhibition of BLA neurons during stimulus-outcome pairing attenuates the encoding of stimulus-outcome memories.
(a). Procedure schematic. CS, conditional stimulus (white noise or tone); O, outcome (sucrose solution or food pellet); A, action (left or right lever press). (b) Schematic of optogenetic strategy for bilateral inhibition of BLA neurons. (c) Representative fluorescent image of ArchT-eYFP expression and fiber placement in the BLA. (d) Schematic representation of ArchT-eYFP expression and placement of optical fiber tips in BLA for all subjects. (e) Elevation [(CS probe entry rate)/(CS probe entry rate + preCS entry rate)] in food-port entries during the CS probe period (after CS onset, before first reward delivery), averaged across trials and CSs for each day of Pavlovian conditioning. Thin light lines represent individual subjects. (f) Elevation in lever presses on the lever that earned the same outcome as the presented CS (Same; [(presses on Same lever during CS)/(presses on Same lever during CS + Same presses during preCS)], averaged across trials and across CSs), relative to the elevation in responding on the alternate lever (Different; [(presses on Different lever during CS)/(presses on Different lever during CS + Different presses during preCS)], averaged across trials and across CSs) during the PIT test. Lines represent individual subjects. (g) Elevation in food-port entries to CS presentation (averaged across trials and CSs) during the PIT test. Circles represent individual subjects. ArchT, N = 9; eYFP, N = 10. *p<0.05. See Figure 3—source data 1.
-
Figure 3—source data 1
Source data for Figure 3 and Figure 3—figure supplement 1–3.
- https://cdn.elifesciences.org/articles/68617/elife-68617-fig3-data1-v2.xlsx
Figure 3—figure supplement 1

Green light activation of ArchT hyperpolarizes and attenuates the firing of BLA cells.
(a) Confocal image of biocytin-filled BLA cell (red) expressing ArchT-eYFP. (b) Current-clamp recording of an ArchT-expressing BLA cell responding to hyperpolarizing and depolarizing current injections. When illuminated with green light (535 nm, 100 ms pulse, 0.5 mW), activation of ArchT hyperpolarizes the cell membrane resulting in the absence of action potential firing at suprathreshold membrane potentials. This hyperpolarization of the cell membrane occurs only during green light luminescence. (c) Representative recordings from 2 ArchT-expressing BLA cells when injected with a suprathreshold pulse of current (165 or 375 pA 1 s; bottom) with green light off (top) or on (middle). (d) Summary of the number of action potentials recorded in ArchT-expressing BLA cells (N = 12 cells/5 subjects) injected with a suprathreshold amount of current before (Off) and during (On) green light illumination (median = 1 mW, range = 0.25–1). Current injection intensities that resulted in 8–15 action potentials were selected for recordings (median = 275 pA, range 100–800 pA, duration = 1 s). Number of action potentials was averaged across three sweeps/condition. Green light activation of ArchT in BLA cells reduced action potential firing in all cells and abolished (>97% reduction) it in most cells. The average number of action potentials recorded during green light exposure was significantly lower than the control no-light period (t11 = 9.25, p<0.0001). Lines represent individual cells. ***p<0.001.
Figure 3—figure supplement 2
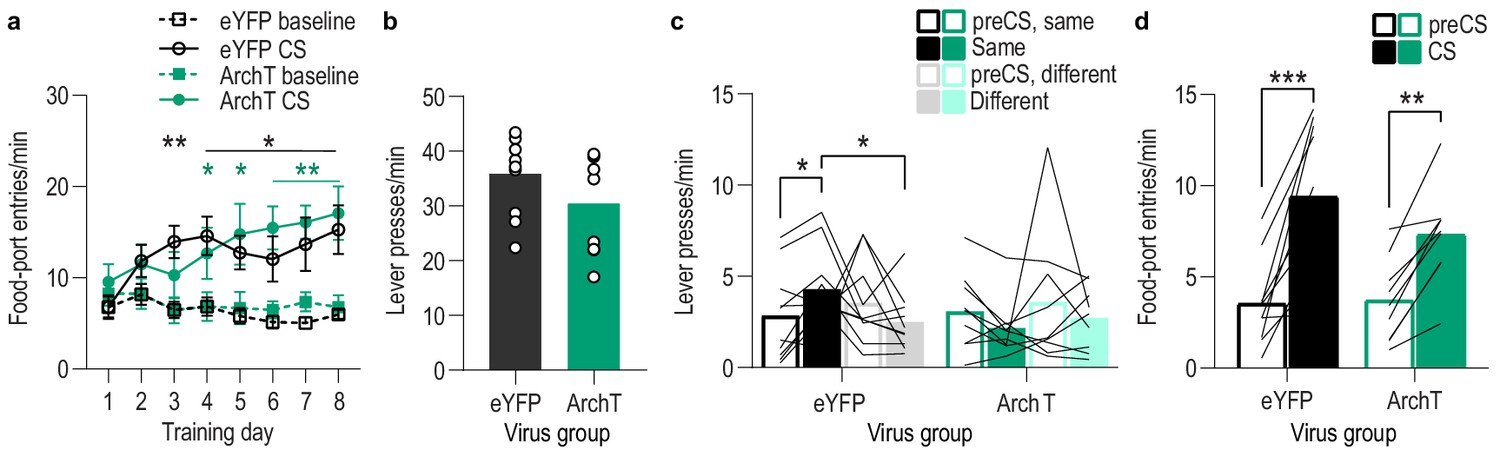
Food-port entry and press rates during Pavlovian conditioning and PIT test for BLA optical inhibition experiment.
(a) Food-port entry rate (entries/min) during CS probe period (after CS onset, before first reward delivery), averaged across trials and across CSs for each day of Pavlovian conditioning. There was no effect of BLA inhibition during reward retrieval on the development of this Pavlovian conditional goal-approach response (CS x Training: F(3.4,57.8) = 16.44, p<0.0001; CS: F(1,17) = 46.73, p<0.0001; Virus: F(1,17) = 0.17, p=0.68; Training: F(2.3,38.5) = 2.37, p=0.10; Virus x Training: F(7,119) = 1.55, p=0.16; Virus x CS: F(1, 17)=0.0009, p=0.98; Virus x Training x CS: F(7,119) = 1.63, p=0.13). *p<0.05, **p<0.01 relative to pre-CS. (b) Lever press rate (presses/min) averaged across levers and across the final 2 days of instrumental conditioning. There was no significant difference in press rate between the control group and the group that received BLA inhibition during Pavlovian conditioning (t17 = 1.44, p=0.17). Circles represent individual subjects. (c). Lever press rate (presses/min) on the lever earning the same outcome as the presented CS (averaged across trials and CSs), relative to the press rate on the alternate lever (Different) during the PIT test. Planned comparisons (Levin et al., 1994), based on the significant interaction and post hoc effect detected in Figure 3f, showed that for the eYFP control group CS presentation significantly increased responding on the lever that earned the same reward as that predicted by the presented CS relative to the preCS baseline period (t9 = 3.11, p=0.01). The CSs did not significantly alter responses on the different lever in the control group (t9 = 1.35, p=0.21). For the ArchT group, the CSs were not capable of significantly altering lever pressing relative to the baseline period (Same: t8 = 2.13, p=0.07; Different: t8 = 0.77, p=0.46). Lines represent individual subjects. (d) Food-port entry rate during CS presentation (averaged across trials and CSs) during the PIT test. For both groups CS presentation triggered a similar elevation in this goal-approach behavior (CS: F(1,17) = 59.41, p<0.0001; Virus: F(1,17) = 0.63, p=0.44; Virus x CS: F(1,17) = 3.42, p=0.08). Lines represent individual subjects. *p<0.05, ***p<0.001.
Figure 3—figure supplement 3
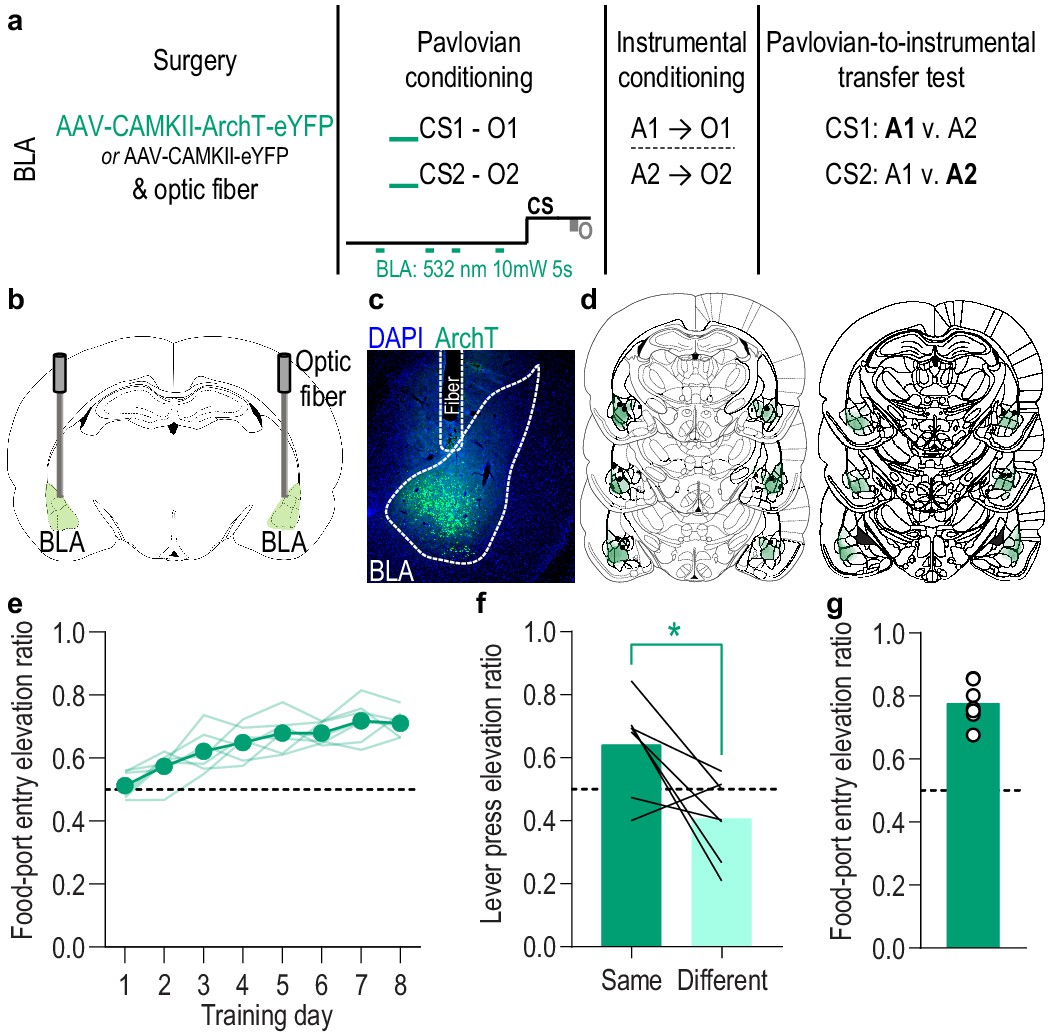
Inhibition of BLA neurons unpaired with reward delivery does not disrupt the encoding of stimulus-outcome memories.
We found that inhibition of BLA neurons specifically at the time of outcome experience during each CS during Pavlovian conditioning attenuated subjects’ encoding of the sensory-specific stimulus-outcome memories, as evidenced by their inability to later use those memories to guide choice behavior during a PIT test. To control for the total amount of BLA inhibition during Pavlovian conditioning, we repeated the BLA inhibition experiment in a separate group of subjects matching the frequency and duration of inhibition to the experimental group (Figure 3), but delivering it during the baseline, 2 min pre-CS periods. We selected this period for control inhibition to maintain proximity to the CS period but avoid inhibition during the CS at periods in which the rat might be expecting, checking for, and/or retrieving reward, events that were not possible for us to time. (a) Procedure schematic. CS, conditional stimulus; O, outcome (sucrose solution or food pellet); A, action (left or right lever press). (b) Schematic of optogenetic strategy for inhibition of BLA neurons. (c) Representative fluorescent image of ArchT-eYFP expression and fiber placement in the BLA. (d) Schematic representation of ArchT-eYFP expression and placement of optical fiber tips in BLA for all subjects. (e) Elevation [(CS probe entry rate)/(CS probe entry rate + preCS entry rate)] in food-port entries during CS probe period (after CS onset, before first reward delivery), averaged across trials and CSs for each day of Pavlovian conditioning. Optical inhibition of BLA neurons unpaired with reward delivery did not affect development of the Pavlovian conditional goal-approach response (Training: F(3.4,20.6) = 16.83, p<0.0001). Thin light lines represent individual subjects. (f) Elevation in lever presses on the lever that earned the same outcome as the presented CS (Same; [(presses on Same lever during CS)/(presses on Same lever during CS + Same presses during preCS)], averaged across trials and across CSs), relative to the elevation in responding on the alternate lever (Different; [(presses on Different lever during CS)/(presses on Different lever during CS + Different presses during preCS)], averaged across trials and CSs) during the PIT test. Inhibition of BLA neurons unpaired with reward delivery during the Pavlovian conditioning sessions did not affect the subsequent ability of the CSs to bias instrumental choice behavior during the PIT test (t6 = 2.88, p=0.03). Lines represent individual subjects. (g) Elevation in food-port entries to CS presentation (averaged across trials and CSs) during the PIT test. The CSs were also capable of elevating food-port entries above baseline during the PIT test. Circles represent individual subjects. N = 7. *p<0.05, corrected post hoc comparison.
Figure 4 with 2 supplements
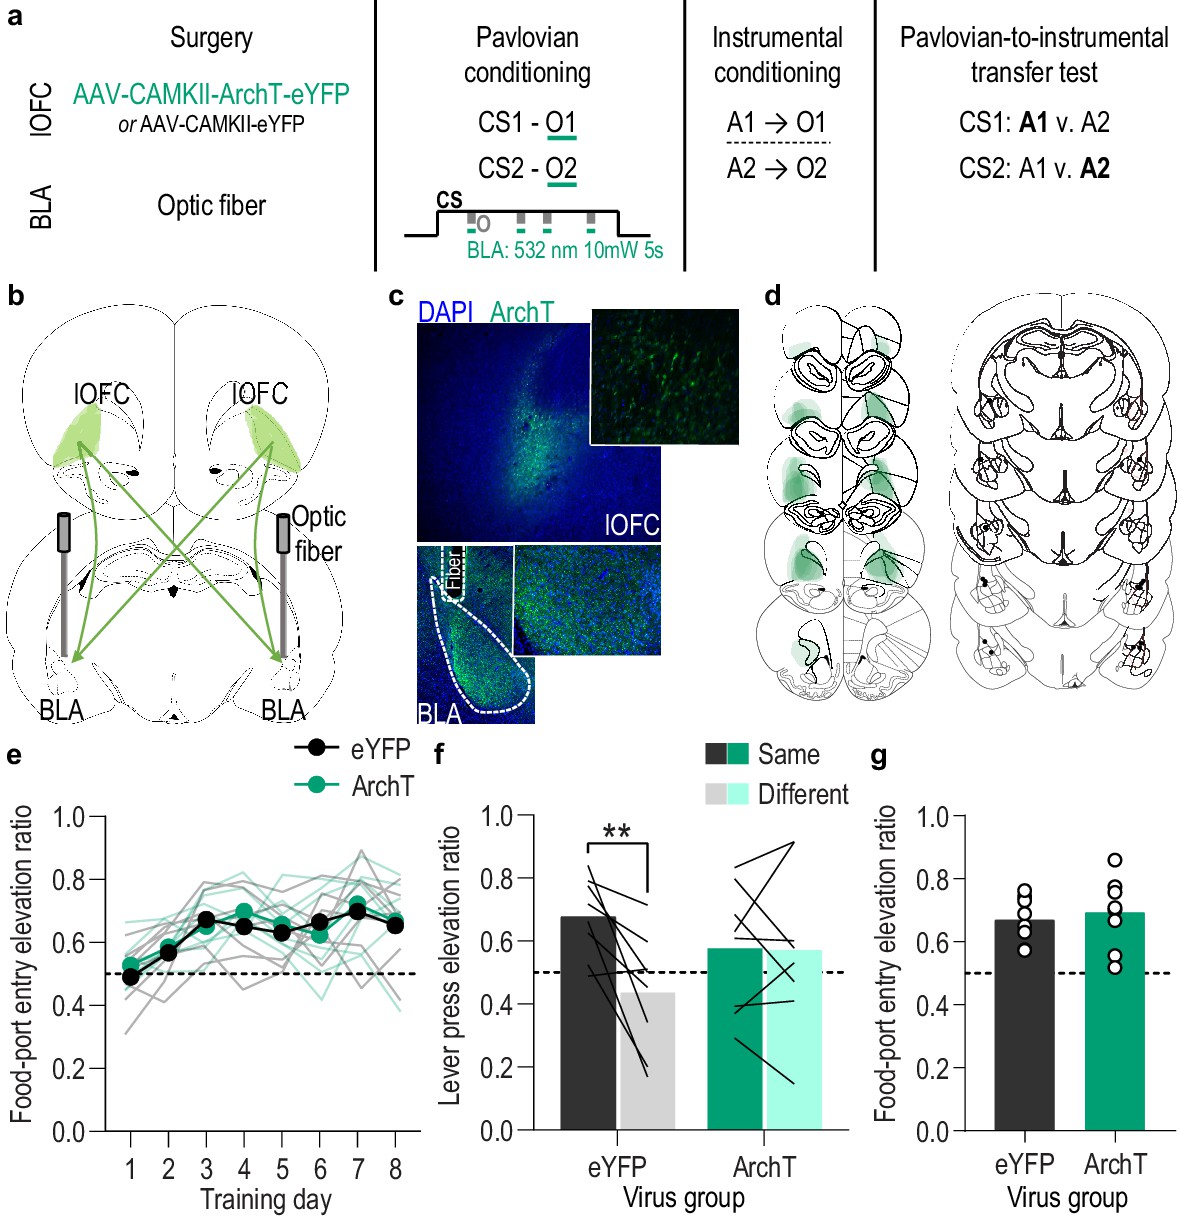
Optical inhibition of lOFC terminals in the BLA during stimulus-outcome pairing attenuates the encoding of stimulus-outcome memories.
(a). Procedure schematic. CS, conditional stimulus (white noise or tone); O, outcome (sucrose solution or food pellet); A, action (left or right lever press). (b) Schematic of optogenetic strategy for bilateral inhibition of lOFC axons and terminals in the BLA. (c) Top: Representative fluorescent image of ArchT-eYFP expression in lOFC cell bodies. Bottom: Representative image of fiber placement in the vicinity of immunofluorescent ArchT-eYFP-expressing lOFC axons and terminals in the BLA. (d) Schematic representation of ArchT-eYFP expression in lOFC and placement of optical fiber tips in BLA for all subjects. (e) Elevation [(CS probe entry rate)/(CS probe entry rate + preCS entry rate)] in food-port entries during the CS probe period (after CS onset, before first reward delivery), averaged across trials and CSs for each day of Pavlovian conditioning. Thin light lines represent individual subjects. (f) Elevation in lever presses on the lever that earned the same outcome as the presented CS (Same; [(presses on Same lever during CS)/(presses on Same lever during CS + Same presses during preCS)], averaged across trials and across CSs), relative to the elevation in responding on the alternate lever (Different; [(presses on Different lever during CS)/(presses on Different lever during CS + Different presses during preCS)], averaged across trials and across CSs) during the PIT test. Lines represent individual subjects. (g) Elevation in food-port entries to CS presentation (averaged across trials and CSs) during the PIT test. Circles represent individual subjects. ArchT, N = 8; eYFP, N = 8. **p<0.01. See Figure 4—source data 1.
-
Figure 4—source data 1
Source data for Figure 4 and Figure 4—figure supplement 1–2.
- https://cdn.elifesciences.org/articles/68617/elife-68617-fig4-data1-v2.xlsx
Figure 4—figure supplement 1

Green light activation of ArchT-expressing lOFC terminals reduces spontaneous activity in BLA neurons.
(a) Confocal image of biocytin-filled BLA neuron (red) in the vicinity of ArchT-eYFP-expressing lOFC axons and terminals. (b) Representative recording of spontaneous excitatory postsynatic currents (sEPSCs) in a BLA neuron before and during green light (535 nm, 0.5 mW, 15 s; green bar) activation of ArchT in lOFC axonal processes. (c) Average change in sEPSC frequency in BLA cells induced by green light activation of ArchT-expressing lOFC axons and terminals in the BLA for the subset (N = 8 cells/4 subjects) of total cells (N = 12) that displayed a reduction in sEPSC frequency during light. Of the remaining four cells, two showed no change in sEPSC frequency during light and two show an increase in frequency. Optical inhibition of lOFC terminals in the BLA resulted in a reduction in the spontaneous activity of these BLA cells (t7 = 2.92, p=0.02). Lines represent individual cells. *p<0.05.
Figure 4—figure supplement 2
Food-port entry and press rates during Pavlovian conditioning and PIT test for lOFC→BLA optical inhibition experiment.
(a) Food-port entry rate (entries/min) during CS probe period (after CS onset, before first reward delivery), averaged across trials and CSs for each day of Pavlovian conditioning. There was no effect of inhibition of lOFC→BLA projection activity during reward delivery on the development of this Pavlovian conditional goal-approach response (CS x Training: F(3.5,49.1) = 5.50, p=0.002; CS: F(1,14) = 27.94, p=0.0001; Virus: F(1,14) = 0.82, p=0.38; Training: F(2.0,28.3) = 1.88, p=0.17; Virus x Training: F(7,98) = 0.48, p=0.85; Virus x CS: F(1, 14)=0.40, p=0.54; Virus x Training x CS: F(7,98) = 0.62, p=0.74). *p<0.05, **p<0.01 relative to pre-CS. (b) Lever press rate (presses/min) averaged across levers and across the final 2 days of instrumental conditioning. There was no significant difference in press rate between the control group and the group that received inhibition of lOFC→BLA projection activity during Pavlovian conditioning (t14 = 1.29, p=0.22). Circles represent individual subjects. (c). Lever press rate (presses/min) on the lever that earned the same outcome as the presented CS (averaged across trials and across CSs), relative to the press rate on the alternate lever (Different) during the PIT test. Planned comparisons, based on the significant interaction and post hoc effect detected in Figure 4f, showed that for the eYFP group CS presentation significantly increased responding on the lever that earned the same reward as that predicted by the presented CS relative to the preCS baseline period (t7 = 3.16, p=0.02). The CSs did not significantly alter responses on the different lever in the control group (t7 = 1.05, p=0.33). For the ArchT group, the CSs were not capable of significantly altering lever pressing relative to the baseline period (Same: t7 = 0.07, p=0.95; Different: t7 = 0.22, p=0.83). Lines represent individual subjects. (d) Food-port entry rate during CS presentation (averaged across trials and across CSs) during the PIT test. For both groups CS presentation triggered a similar significant elevation in this goal-approach behavior (CS: F(1,14) = 49.96, p<0.0001; Virus: F(1,14) = 1.35, p=0.26; Virus x CS: F(1,14) = 0.44, p=0.52). Lines represent individual subjects. *p<0.05, ***p<0.001.
Figure 5 with 2 supplements

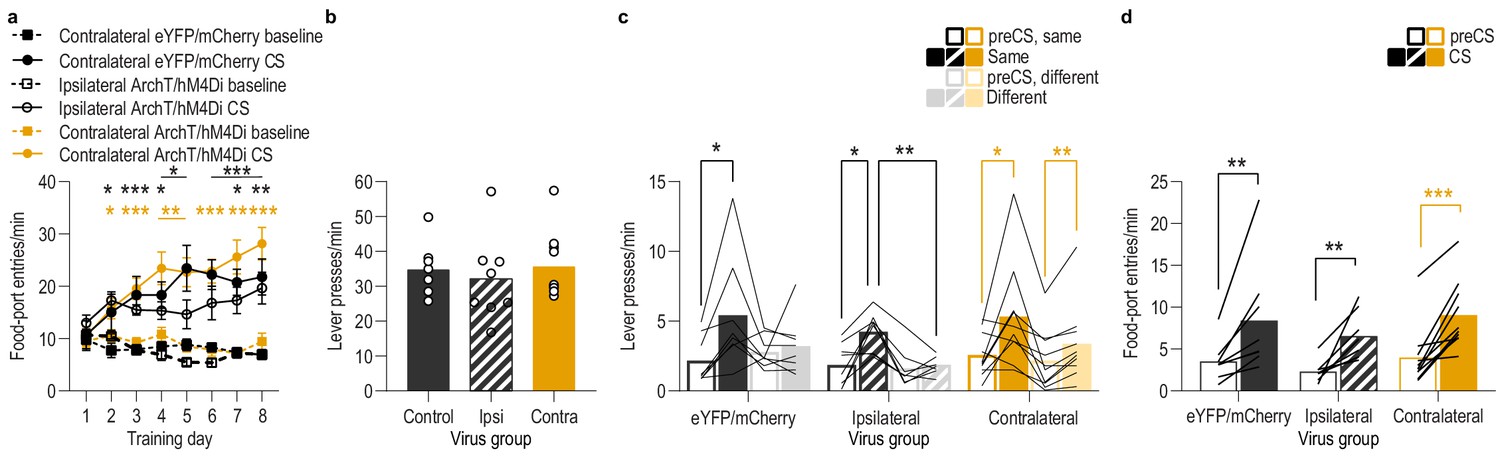
Serial disconnection of lOFC→BLA projections during stimulus-outcome pairing from BLA→lOFC projections during Pavlovian-to-instrumental transfer test disrupts stimulus-outcome memory.
(a) Procedure schematic. CS, conditional stimulus (white noise or tone); O, outcome (sucrose solution or food pellet); A, action (left or right lever press); CNO, clozapine-n-oxide. (b) Schematic of multiplexed optogenetic/chemogenetic inhibition strategy for unilateral optical inhibition of lOFC→BLA projections during Pavlovian conditioning and contralateral, unilateral, chemogenetic inhibition of BLA→lOFC projections during the PIT test. (c) Top: Representative fluorescent image of bilateral ArchT-eYFP expression in lOFC cells bodies and unilateral expression of hM4Di-mCherry in BLA axons and terminals in the lOFC in the vicinity of implanted guide cannula. Bottom: Representative image of unilateral BLA fiber placement in the vicinity of immunofluorescent ArchT-eYFP expressing lOFC axons and terminals (right) and unilateral expression of hM4Di-mCherry in BLA cell bodies in the contralateral hemisphere (left). (d) Schematic representation of bilateral ArchT-eYFP expression and unilateral cannula placement in lOFC and unilateral hM4Di expression and placement of optical fiber tips in the contralateral BLA for all Contralateral group subjects. Fibers are shown in left and cannula placement in the right hemisphere, but fiber/cannula hemisphere arrangement was counterbalanced across subjects. See Figure 5—figure supplement 1 for histological verification of ipsilateral control. (e) Elevation [(CS probe entry rate)/(CS probe entry rate + preCS entry rate)] in food-port entries during the CS probe period (after CS onset, before first reward delivery), averaged across trials and CSs for each day of Pavlovian conditioning. Thin light lines represent individual subjects (Contralateral eYFP/mCherry (solid lines) and Ipsilateral ArchT/hM4Di (dashed lines) collapsed into a single control group). (f) Elevation in lever presses on the lever that earned the same outcome as the presented CS (Same; [(presses on Same lever during CS)/(presses on Same lever during CS + Same presses during preCS)], averaged across trials and across CSs), relative to the elevation in responding on the alternate lever (Different; [(presses on Different lever during CS)/(presses on Different lever during CS + Different presses during preCS)], averaged across trials and across CSs) during the PIT test. Lines represent individual subjects. (g) Elevation in food-port entries to CS presentation (averaged across trials and CSs) during the PIT test. Data points represent individual subjects, triangles indicate ipsilateral control subjects. Control, N = 16; Contralateral disconnection group, N = 10. **p<0.01. See Figure 5—source data 1.
-
Figure 5—source data 1
Source data for Figure 5 and Figure 5—figure supplement 1–2.
- https://cdn.elifesciences.org/articles/68617/elife-68617-fig5-data1-v2.xlsx
Figure 5—figure supplement 1

Histological verification for unilateral, ipsilateral lOFC→BLA/BLA→lOFC inhibition subjects.
(a) Schematic of multiplexed optogenetic/chemogenetic inhibition strategy for unilateral optical inhibition of lOFC→BLA projections during Pavlovian conditioning and ipsilateral, unilateral, chemogenetic inhibition of BLA→lOFC projections during the PIT test. (b) Top: Representative fluorescent image of ArchT-eYFP expression in lOFC cells bodies and unilateral expression of hM4Di-mCherry in BLA axons and terminals in the lOFC in the vicinity of implanted guide cannula. Bottom: Representative image of fiber placements in the vicinity of immunofluorescent ArchT-eYFP expression in lOFC axons and terminals in the BLA and unilateral expression of hM4Di-mCherry in BLA cell bodies in that same hemisphere. (c) Schematic representation of bilateral ArchT-eYFP expression and unilateral cannula placement in lOFC and unilateral, ipsilateral hM4Di expression and placement of optical fiber tips in BLA for all subjects. All fibers and cannula are shown in left hemisphere, but inhibited hemisphere was counterbalanced across subjects.
Figure 5—figure supplement 2
Food-port entry and press rates during Pavlovian conditioning and PIT test for lOFC→BLA/BLA→lOFC serial disconnection experiment.
(a) Food-port entry rate (entries/min) during CS probe period (after CS onset, before first reward delivery), averaged across trials and CSs for each day of Pavlovian conditioning. There was no effect of unilateral lOFC→BLA inhibition during reward delivery on the development of this Pavlovian conditional goal-approach response in either the disconnection or ipsilateral control group (CS x Training: F(3.4,78.6) = 23.07, p<0.0001; CS: F(1,23) = 131.7, p<0.0001; Virus group: F(2,23) = 1.42, p=0.26; Training: F(3.7,85.4) = 3.95, p=0.007; Virus x Training: F(7.4,85.43) = 2.24, p=0.04; Virus x CS: F(2,23) = 1.19, p=0.32; Virus x Training x CS: F(6.8,78.6) = 1.36, p=0.24). **<0.05, **p<0.01, ***p<0.001, relative to preCS (top, eYFP/mCherry; middle, ipsilateral ArchT/hM4Di; bottom, contralateral ArchT/hM4Di). (b) Lever press rate (presses/min) averaged across levers and across the final 2 days of instrumental conditioning. There was no significant difference in press rate between the control groups and the disconnection group (F(2,23) = 0.30, p=0.75). Circles represent individual subjects. (c). Lever press rate (presses/min) on the lever that earned the same outcome as the presented CS (averaged across trials and across CSs), relative to the press rate on the alternate lever (Different) during the PIT test. Planned comparisons, based on the results detected in Figure 5f, showed that for the contralateral eYFP/mCherry control subjects CS presentation significantly increased responding on the action earning the same reward as that predicted by the presented cue relative to the preCS baseline period (t7 = 3.30, p=0.01). The CSs did not significantly alter responses on the different lever in this group (t7 = 0.58, p=0.58). For the ipsilateral ArchT/hM4Di control subjects, CS presentation increased responding on the Same action relative to both the preCS baseline period (t7 = 3.43, p=0.01) and to the different action during the CS (t7 = 4.51, p=0.003). The CSs also did not significantly alter responses on the different lever in this control group (t7 = 0.67, p=0.52). For the Disconnection (contralateral ArchT/hM4Di) group, the CSs caused a non-discriminate increase in lever pressing relative to the baseline period on both levers (Same: t9 = 2.54, p=0.03; Different: t9 = 3.92, p=0.004). Lines represent individual subjects. (d) Food-port entry rate during CS presentation (averaged across trials and across CSs) during the PIT test. For all groups, CS presentation triggered a similar significant elevation in this goal-approach behavior (CS: F(1,23) = 47.67, p<0.0001; Virus: F(2,23) = 0.86, p=0.44; Virus x CS: F(2,23) = 0.14, p=0.87). Lines represent individual subjects. Contra, contralateral. *p<0.05, **p<0.01, ***p<0.001.
Tables
Key resources table
| Reagent type (species) or resource | Designation | Source or reference | Identifiers | Additional information |
|---|---|---|---|---|
| Recombinant DNA reagent | pENN.AAV5.CAMKII.GCaMP6f.WPRE.SV40 | Addgene | Cat: 100834-AAV5 RRID:Addgene_100834 | Lot # v59618 |
| Recombinant DNA reagent | rAAV5-CAMKIIa-eArchT3.0-eYFP | UNC-CH vector core | Deisseroth | Lot # V4883D |
| Recombinant DNA reagent | rAAV5-CAMKIIa-eYFP | UNC-CH vector core | Deisseroth | Lot # AV4808I |
| Recombinant DNA reagent | pAAV8-hSyn-hM4D(Gi)-mCherry | Addgene | Cat: 50475-AAV8 RRID:Addgene_50475 | Lot # v5483 |
| Recombinant DNA reagent | pAAV8-hSyn-mCherry | Addgene | Cat: 114472-AAV8 RRID:Addgene_114472 | |
| Other | Optical fiber (photometry) | Neurophotometrics | Diameter: 200 µm; NA: 0.37; Length: 8–8.5 mm | |
| Other | Optical fiber (manipulation) | Thorlabs | Cat: FT200UMT | Core: 200 µm; NA: 0.39; Length: 8–8.5 mm |
| Other | Optical ferrules | Kientec | Cat: FAZI-LC-230 | |
| Other | Guide cannula | Plastics One | Cat: C313G/SPC | Length: cut to 4 mm below pedestal |
| Chemical compound, drug | Clozapine N-oxide | Tocris | Cat: 4936/10 CAS: 34233-69-7 | |
| Other | Dustless precision Chocolate-flavored purified pellets | Bio-Serv | Cat: F0299 | 45 mg |
| Other | Sucrose | Ralphs | UPC: 0001111083805 | |
| Antibody | Chicken polyclonal anti-GFP antibody | Abcam | Cat: ab13970 | (1:1000) |
| Antibody | Goat polyclonal anti-chicken IgG, Alexa Fluor 488 conjugate | Abcam | Cat: ab150169 RRID:AB_2636803 | (1:500) |
| Antibody | Rabbit polyclonal anti-DsRed antibody | Takara Bio | Cat: 632496 RRID:AB_10013483 | (1:1000) |
| Antibody | Goat polyclonal anti-rabbit IgG, Alexa Fluor 594 conjugate | Invitrogen | Cat: A-11012 RRID:AB_253407 | (1:500) |
| Other | ProLong Gold Antifade Mountant with DAPI | Invitrogen | Cat: P36931 | |
| Chemical compound, drug | Paraformaldehyde | Sigma | Cat: P6148 | |
| Software, algorithm | MED-PC IV | Med Associates, Inc | RRID:SCR_012156 | |
| Software, algorithm | GraphPad Prism | GraphPad Software | RRID:SCR_002798 | Version: 8 |
| Software, algorithm | MatLab | MathWorks | RRID:SCR_001622 | Version: 2019a |
| Software, algorithm | SPSS | IBM | RRID:SCR_019096 | Version: 26 |
| Software, algorithm | Bonsai | Bonsai | RRID:SCR_017218 | Version: 2.3 |
| Software, algorithm | Minianalysis | Synaptosoft | RRID:SCR_002184 | Version 6 |
| Software, algorithm | BZ-X Analyze software | Keyence | RRID:SCR_017205 | |
| Software, algorithm | Zeiss Zen Blue software | Zeiss | RRID:SCR_013672 | |
| Software, algorithm | Illustrator | Adobe | RRID:SCR_010279 | |
| Software, algorithm | ImageJ | NIH | RRID:SCR_003070 | |
| Software, algorithm | Excel | Microsoft | RRID:SCR_016137 |
Additional files
-
Source code 1
Source code for fiber photometry data analysis in Figures 1 and 2.
- https://cdn.elifesciences.org/articles/68617/elife-68617-code1-v2.zip
-
Transparent reporting form
- https://cdn.elifesciences.org/articles/68617/elife-68617-transrepform-v2.elifetransrepform.pdf
Download links
A two-part list of links to download the article, or parts of the article, in various formats.
Downloads (link to download the article as PDF)
Open citations (links to open the citations from this article in various online reference manager services)
Cite this article (links to download the citations from this article in formats compatible with various reference manager tools)
A bidirectional corticoamygdala circuit for the encoding and retrieval of detailed reward memories
eLife 10:e68617.
https://doi.org/10.7554/eLife.68617


