Phosphoproteomics of ATR signaling in mouse testes
- Department of Molecular Biology and Genetics, Weill Institute for Cell and Molecular Biology, Cornell University, United States
- Department of Biochemistry and Immunology, Ribeirão Preto Medical School, University of São Paulo, Brazil
- Department of Biomedical Sciences, Cornell University, United States
- Unidad de Investigación, Hospital Universitario de Canarias, Spain
- Instituto de Tecnologías Biomédicas, Universidad de La Laguna, Spain
- Universidad Fernando Pessoa Canarias, Spain
Figures
Figure 1 with 1 supplement
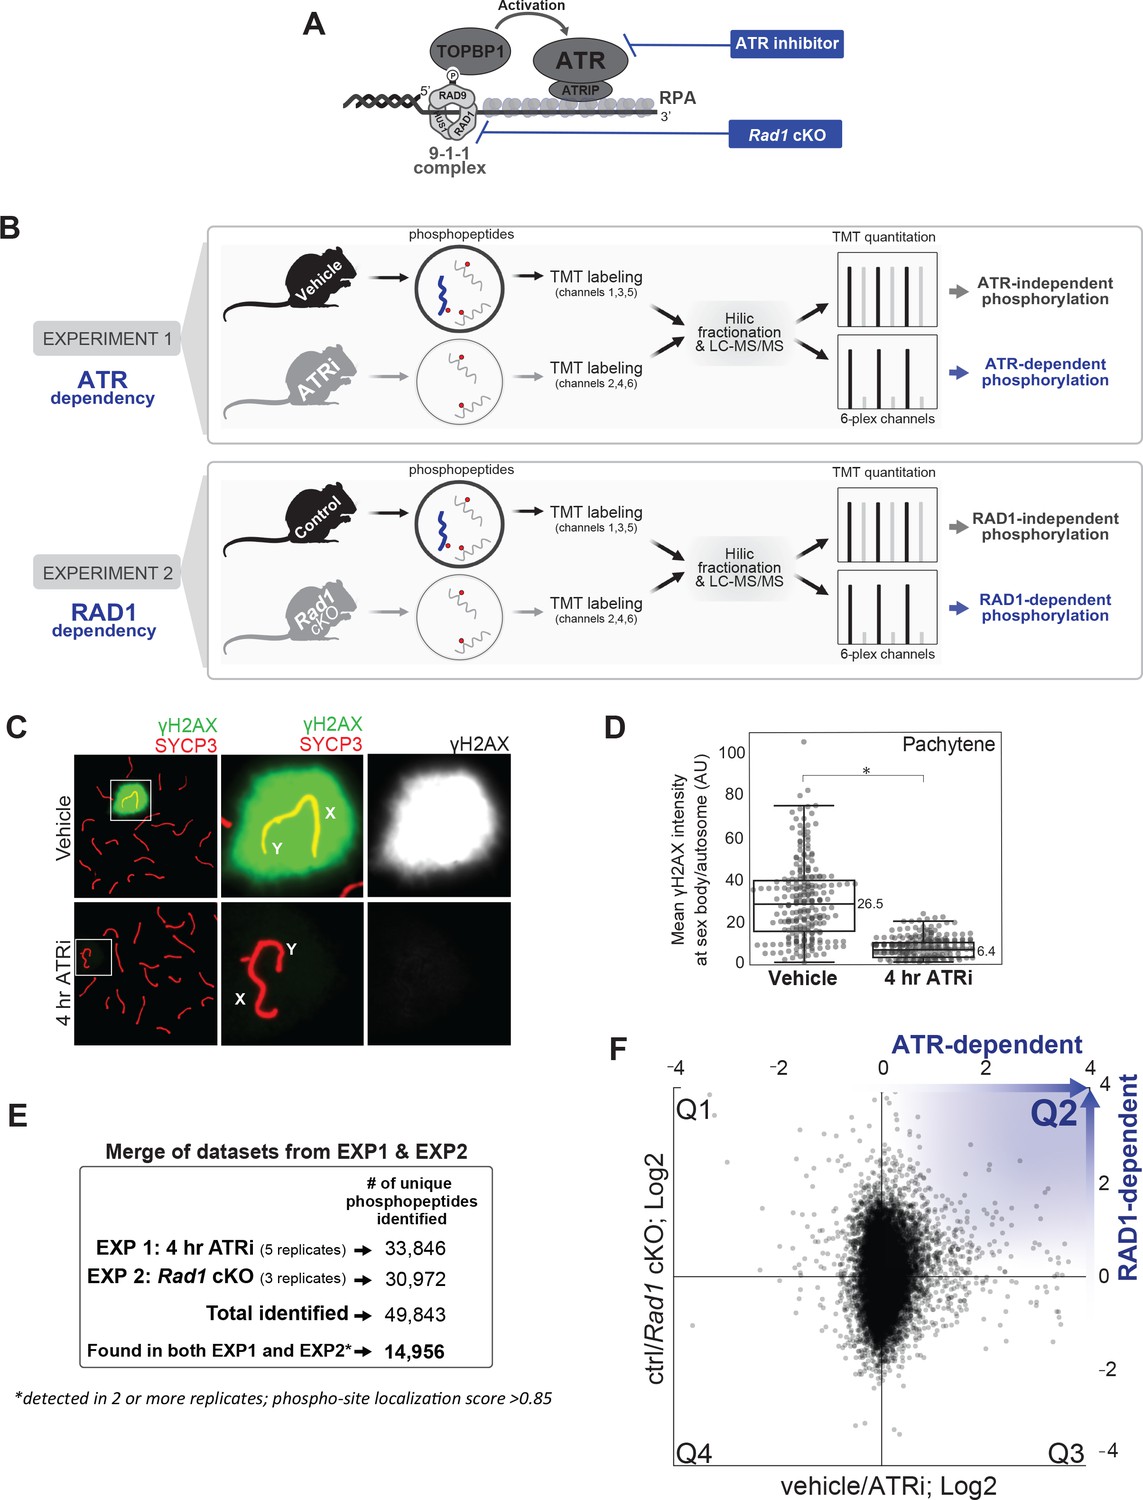
Experimental approach for identifying ATR-dependent phosphorylation events in meiosis.
(A) Schematics depicting the mechanism of ATR activation at a 5’ recessed DNA end via the 9-1-1 complex and TOPBP1, and strategies for chemical and genetic impairment of ATR signaling. (B) Whole, decapsulated testes were collected from vehicle and AZ20-treated mice (top) or Rad1 cKO and control litter mates (bottom) and subjected to quantitative phosphoproteomic analysis to identify ATR-dependent and RAD1-dependent phosphorylation events (see Materials and methods for details). (C) Immunofluorescence staining of meiotic spreads from ATRi or vehicle-treated mice collected 4 hr after 50 mg/kg treatment with AZ20. (D) Quantification of γH2AX intensity (four vehicle mice, n = 246 cells; four ATRi mice, n = 309 cells p=0.019 measured by Student’s t-test) (see Materials and methods for more details). (E) Description of overall number of replicates and phosphopeptides identified. (F) Scatter plot of the final consolidated phosphoproteomic dataset corresponding to the 4 hr ATRi treatment and Rad1 cKO. Blue in Q2 highlights directionality of ATR and RAD1-dependent phosphorylation events.
Figure 1—figure supplement 1
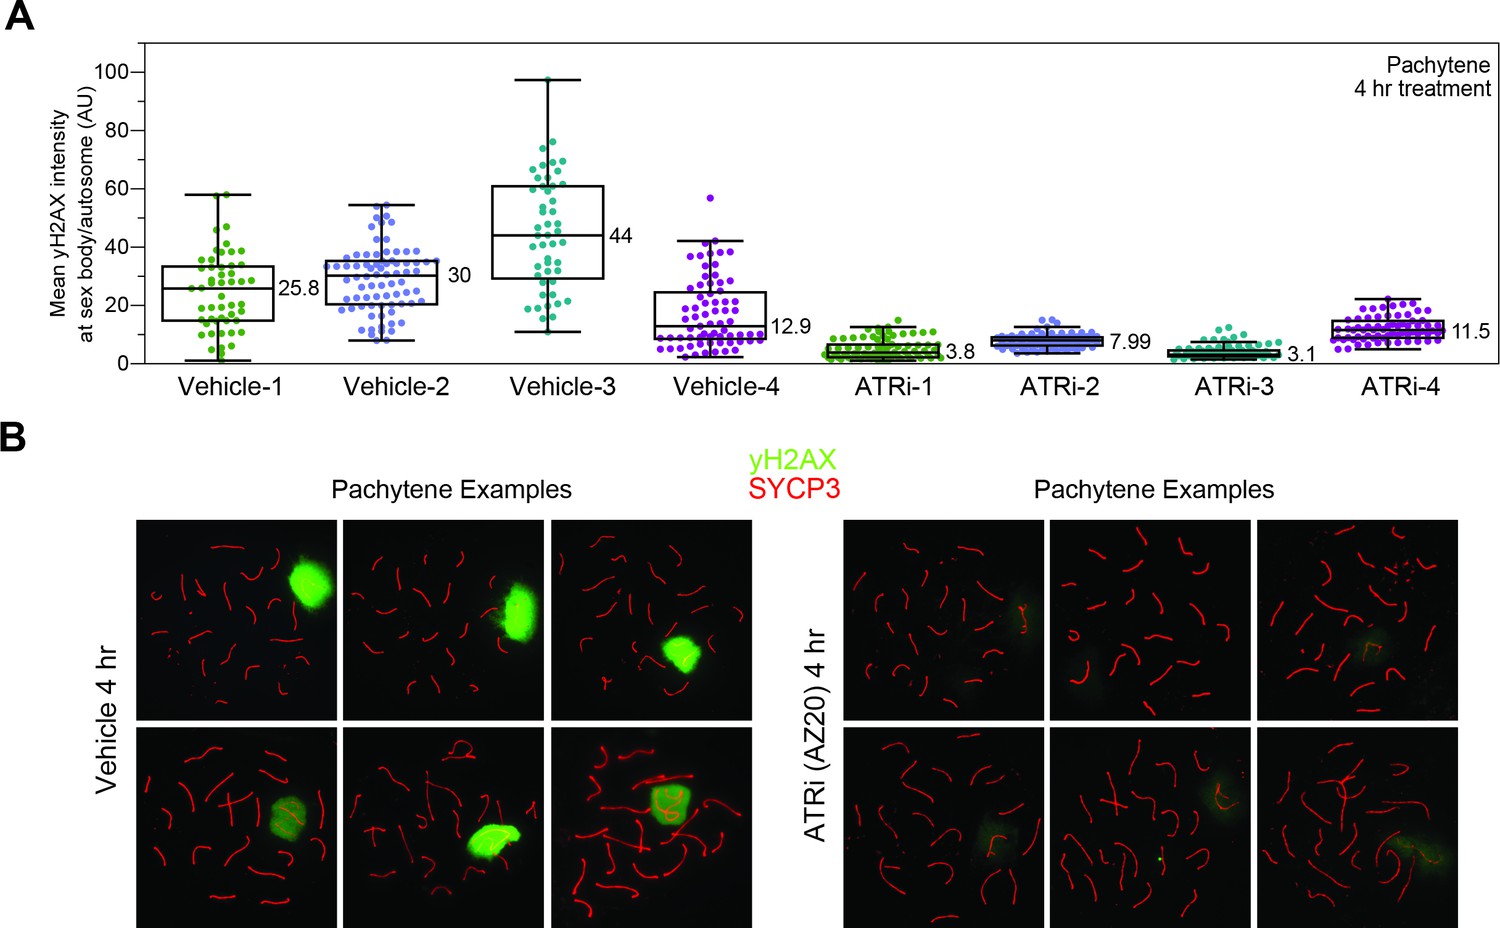
Imaging γH2AX on meiotic spreads from vehicle or ATRi-treated mice.
(A) Quantification of mean intensities for the ratio of γH2AX signal as depicted in Figure 1D, separated by individual animal replicates. γH2AX intensity is measured as described in Materials and methods. Data points indicate the ratio of signal intensity across sex body to average of intensity across two autosomes for an individual pachytene-stage meiotic spread. (B) Example pachytene spreads showing variation in signal intensity and pattern from quantification in A with γH2AX (green) and SYCP3 (red).
Figure 2 with 4 supplements
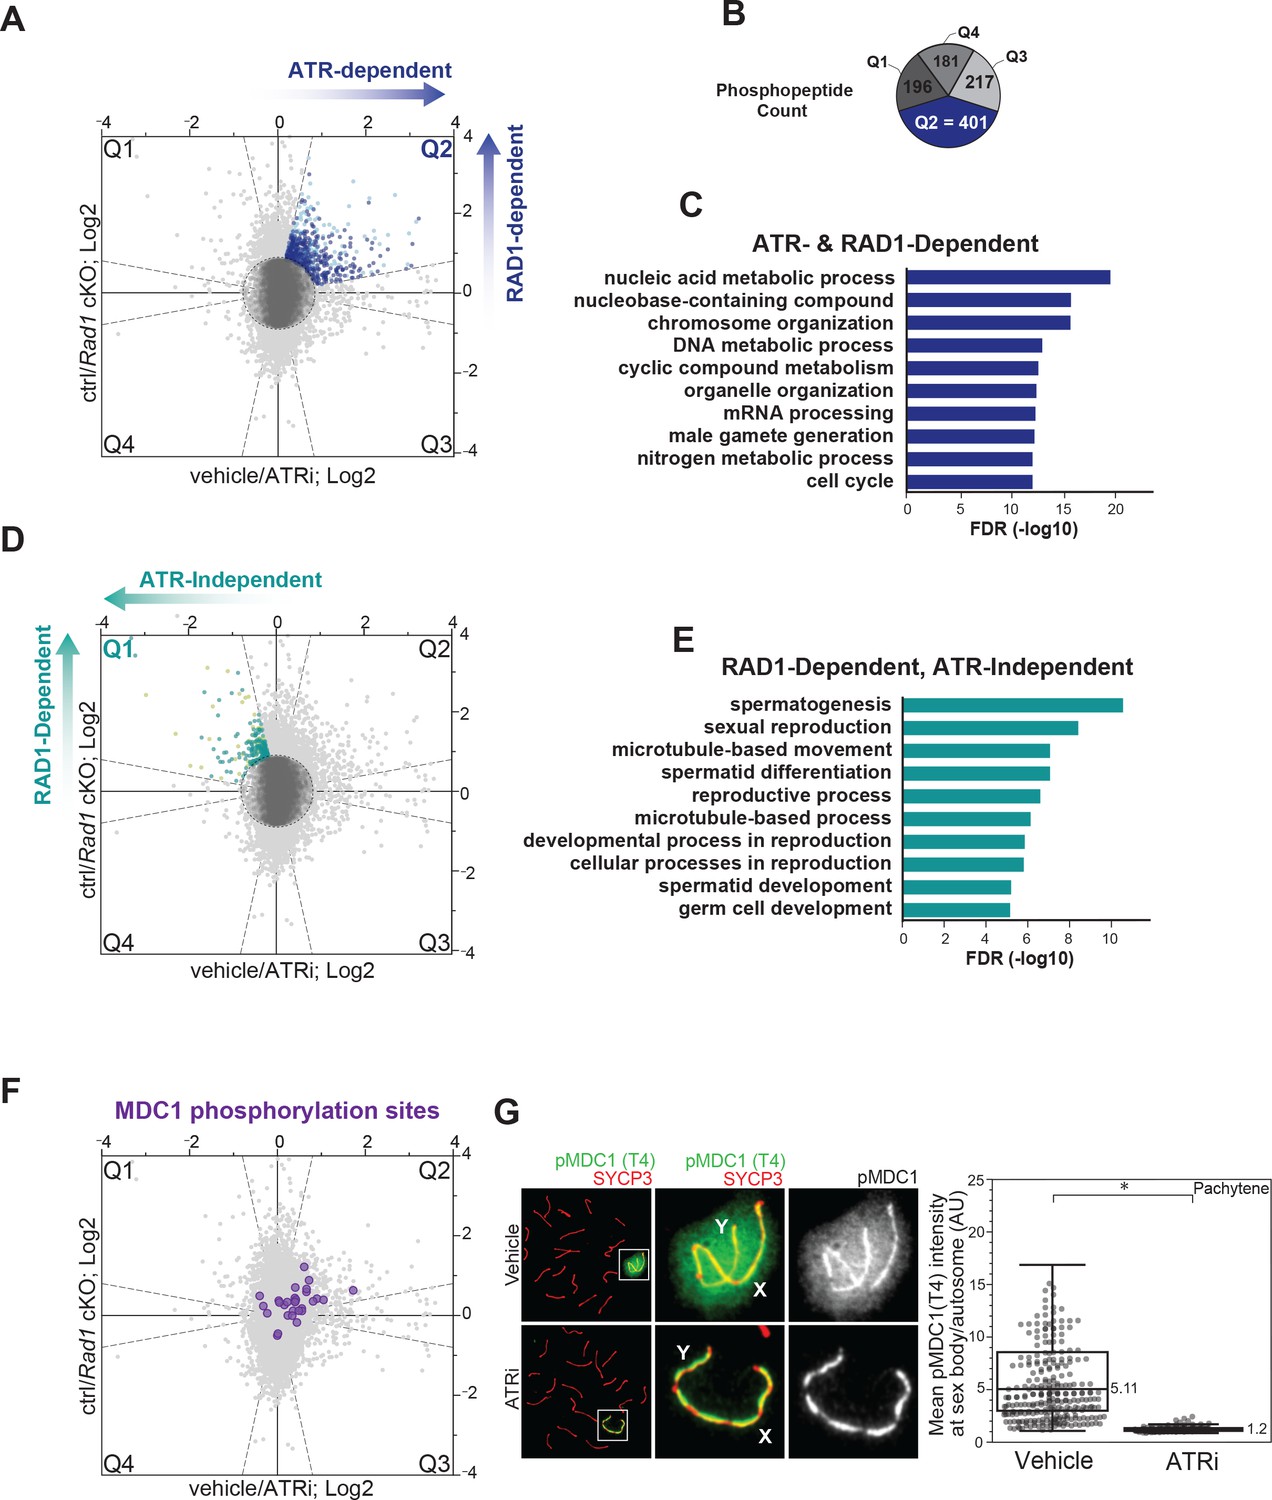
ATR and RAD1-dependent signaling events in phosphoproteomic dataset corresponding to 4 hr ATRi treatment and Rad1 cKO.
(A) Scatter plot with assignment of phosphopeptides into quadrants delineated by dashed lines (‘bow-tie’ filter thresholds) and laying outside of a central region (‘center’ circle) comprised of phosphopeptides considered unchanged in both ATRi and Rad1 cKO experiments. Quadrant 2 (Q2; blue dots) indicates designated set of ATR and RAD1-dependent phosphopeptides. Phosphorylation sites in each quadrant were also subjected to a filtering step to remove inconsistent ratios between replicates of each experiment (see Materials and methods for details). Dark blue dots in Q2 indicate phosphopeptides passing the filter and used for (B) and (C). Sites that did not pass the filter in Q2 are displayed in light blue. (B) Phosphopeptide count per quadrant. (C) Curated gene ontology (GO) list of proteins with ATR and RAD1-dependent phosphorylation identified in Q2 from STRING analysis. Full list of GO terms in Supplementary file 2 Table S3. (D) Similar to (A), but indicating RAD1-dependent and ATR-independent phosphopeptides in Q1 (pale green) and Q1 sites that passed filtering (teal). (E) GO of proteins with RAD1-dependent, ATR-independent phosphorylation from STRING analysis. Full list of GO terms in Table S3 Supplementary file 2. (F) Scatter plot highlighting the detected MDC1 phosphopeptides. (G) Immunofluorescence of meiotic spreads from mice treated with vehicle or 50 mg/kg AZ20 for 4 hr and stained for pMDC1 (MDC1 phosphorylated at threonine 4; green) and SYCP3 (red) with quantification of pachytene-staged cells (four vehicle mice, n = 360 cells; four ATRi mice, n = 282 cells p=0.0268 measured by Student’s t-test) (see Materials and methods for more details).
Figure 2—figure supplement 1
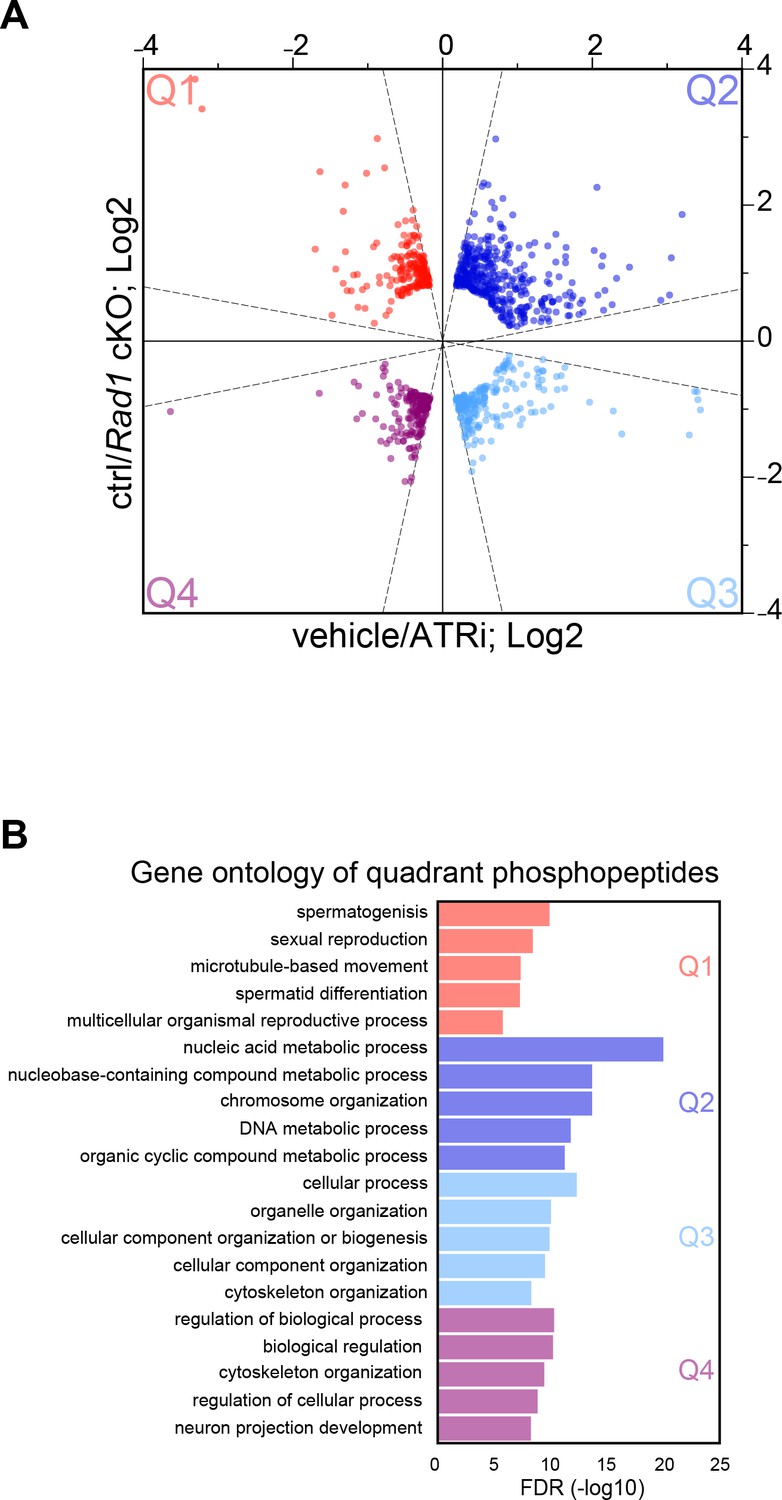
Quadrant gene ontology of phosphoproteomic dataset from 4 hr ATRi treatment and Rad1 cKO.
(A) Scatter plot of phosphopeptides after ‘bow-tie’ filtering (dashed lines) and variability filtering (as described in Materials and methods) with colors indicating quadrant location for those sites that passed an additional filter for the absolute value of variation <0.25; Q1 = red, Q2 = dark blue, Q3 = light blue, Q4 = maroon. Only points that passed filtering are displayed, all others have been removed for simplicity. (B) Top 5 GO terms from STRING analysis for each quadrant. A complete list of gene ontology terms for each quadrant can be found in Supplementary file 2.
Figure 2—figure supplement 2
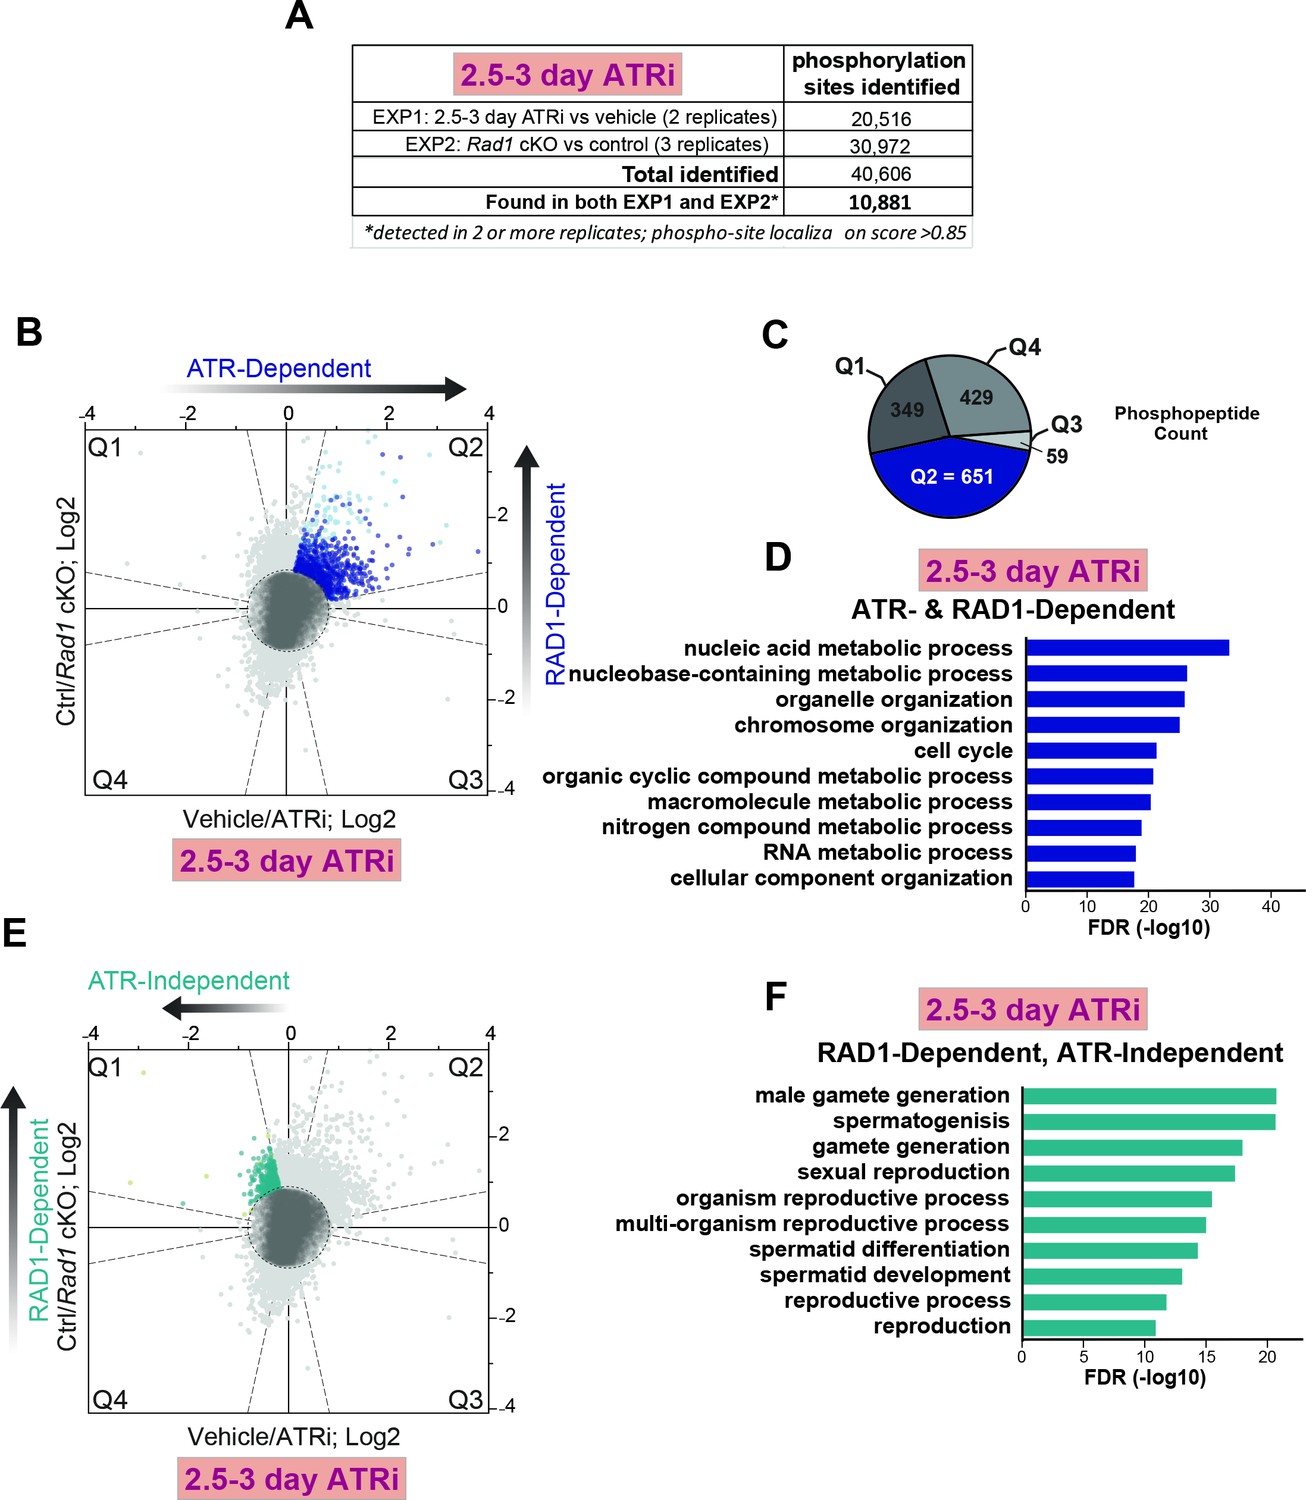
ATR and RAD1-dependent signaling events in phosphoproteomic dataset of 2.5–3-day ATRi treatment and Rad1 cKO.
(A) Description of overall number of replicates and phosphopeptides identified. Full dataset can be found in Supplementary file 3. (B) Scatter plot with assignment of phosphopeptides into quadrants delineated by dashed lines (‘bow-tie’ filter thresholds) and laying outside of a central region (‘center’ circle) comprised of phosphopeptides considered unchanged in both ATRi and Rad1 cKO experiments. Quadrant 2 (Q2; with blue dots) indicates designated set of ATR and RAD1-dependent phosphopeptides. Phosphorylation sites in each quadrant were also subjected to a filtering step to remove inconsistent ratios between replicates of each experiment (see Materials and methods for details). Dark blue dots in Q2 indicate phosphopeptides passing the filter and used in panels (C) and (D). Light blue dots indicate phosphopeptides that failed to pass the filter. (C) Phosphopeptide count per quadrant. (D) Curated gene ontology list of proteins with ATR and RAD1-dependent phosphorylation identified in Q2 from STRING analysis. (E) RAD1-dependent and ATR-independent phosphopeptides in Q1 (teal). Sites that failed to pass the filter are displayed in pale green. (F) Gene ontology of proteins with RAD1-dependent, ATR-independent phosphorylation from STRING analysis that passed the filter as shown in (E).
Figure 2—figure supplement 3
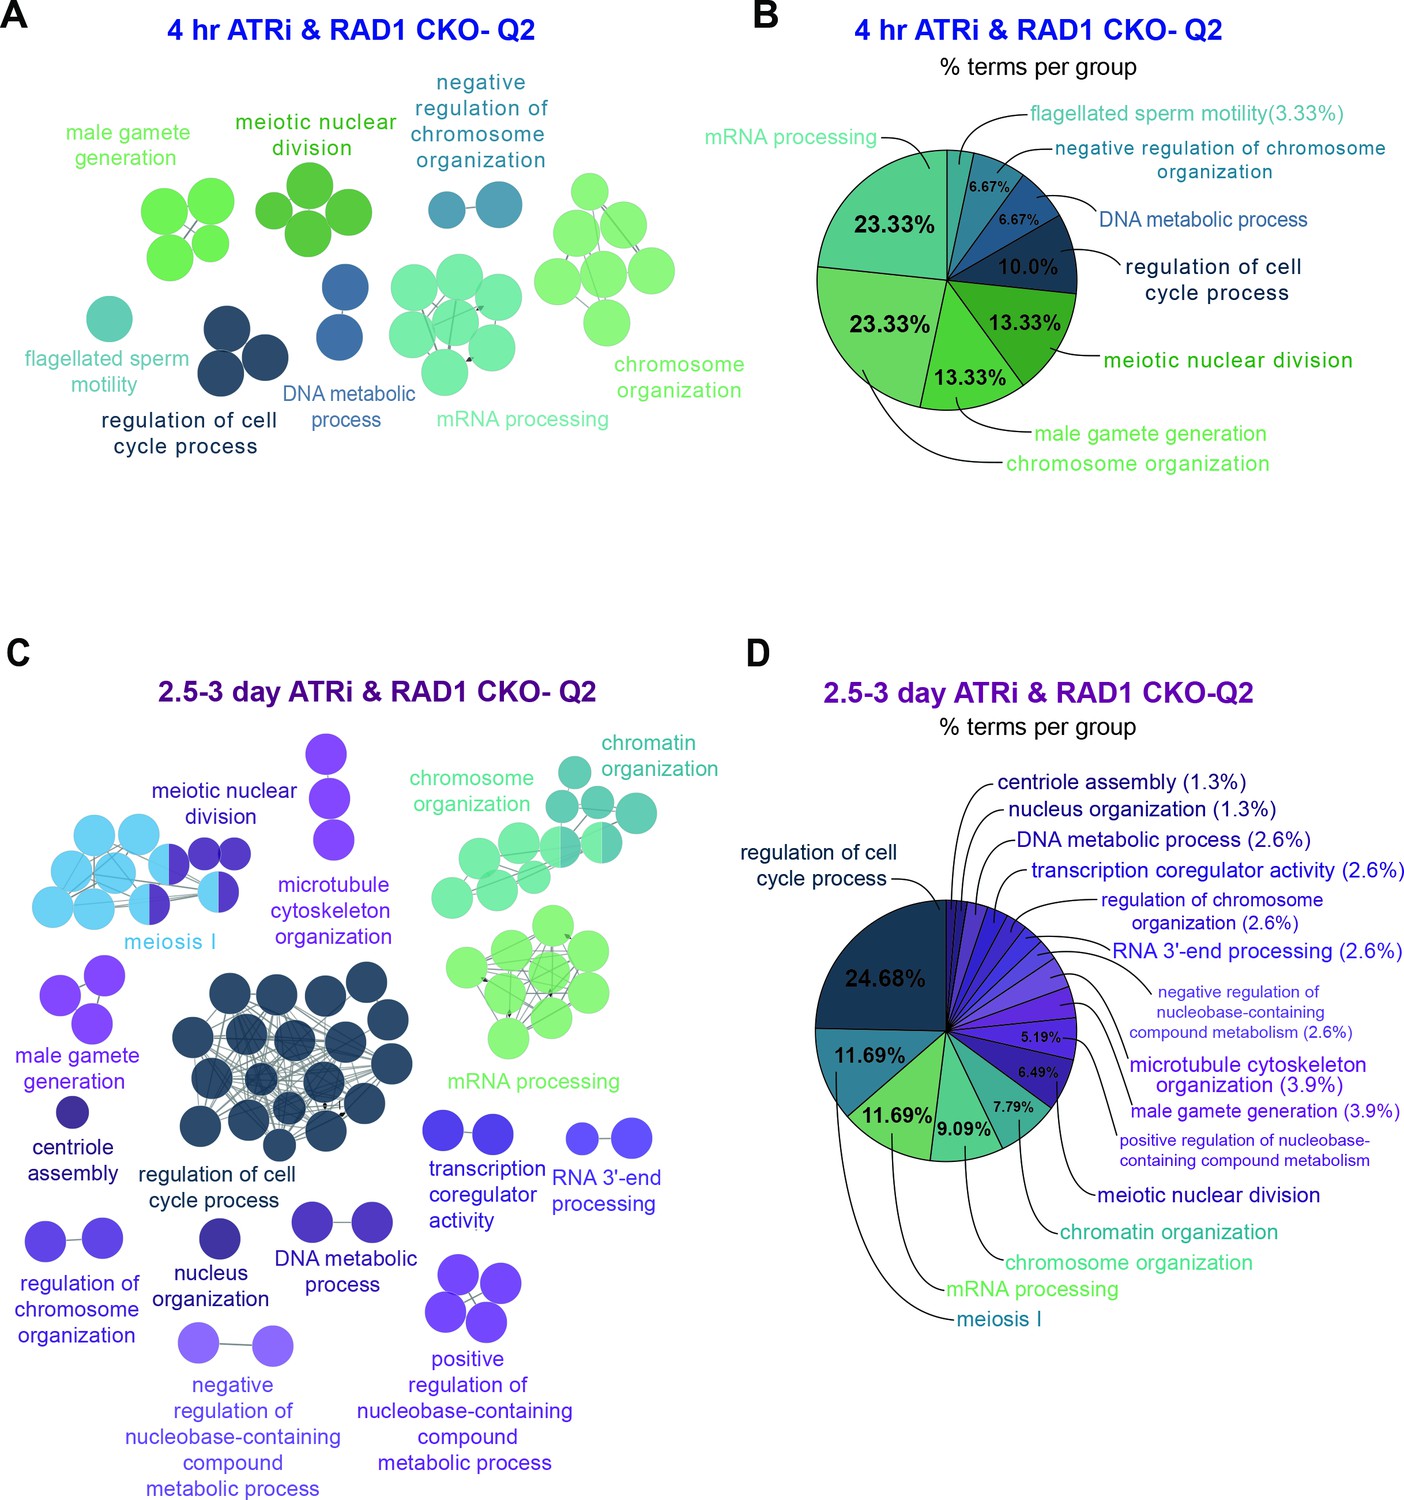
ClueGO analysis of ATR and RAD1-dependent events in Q2.
(A) Functional GO network generated using the ClueGO plugin for Cytoscape. Analysis of RAD1 and ATR-dependent phosphopeptides in Q2 after 4 hr treatment with ATR inhibitor. GO functional groups are separated by color and colored text where nodes with multiple colors belong to multiple GO functional groups. Each node represents a GO term with a p-value of <0.05. (B) Display of the percentage of proteins per group displayed as a pie chart for the 4 hr ATRi treatment vs. Rad1 cKO. (C) Functional GO network generated by ClueGO analysis of RAD1 and ATR-dependent phosphopeptides in Q2 after 2.5–3-day treatment with ATR inhibitor. (D) Display of the percentage of proteins per group displayed as a pie chart for the 2.5–3-day ATRi treatment vs. Rad1 cKO.
Figure 2—figure supplement 4
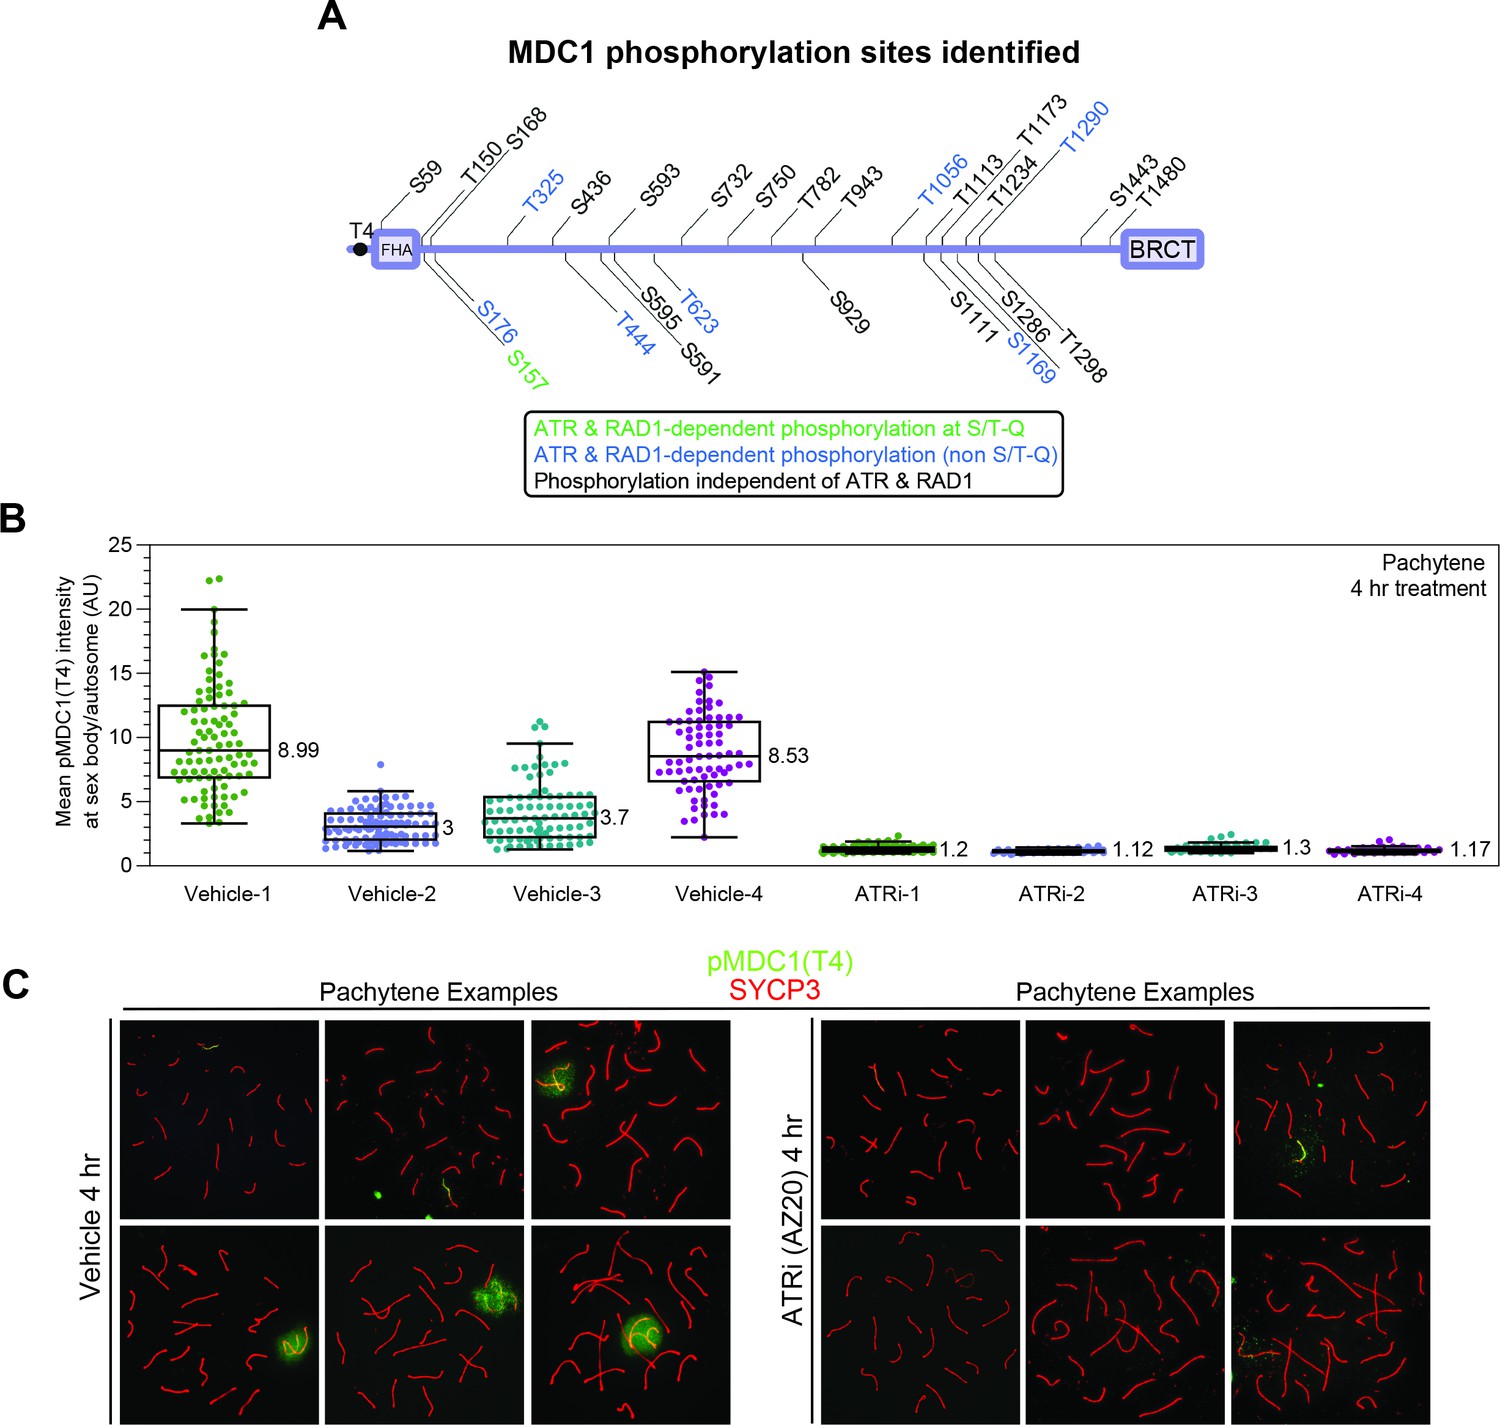
MDC1 phosphorylation events after ATR inhibition.
(A) Related to Figure 2F: schematics displaying the 29 MDC1 phosphorylation sites detected. (B) Related to Figure 2G: quantification of pMDC1 (MDC1 phosphorylated at threonine 4) intensities separated by individual mice after treatment with vehicle or ATR inhibitor for 4 hr as indicated. Quantification was done as described in Materials and methods. (C) Example meiotic spreads depicting variation in signal intensity and pattern for pMDC1 (green) and SYCP3 (red) for ATRi and vehicle-treated mice.
Figure 3 with 2 supplements
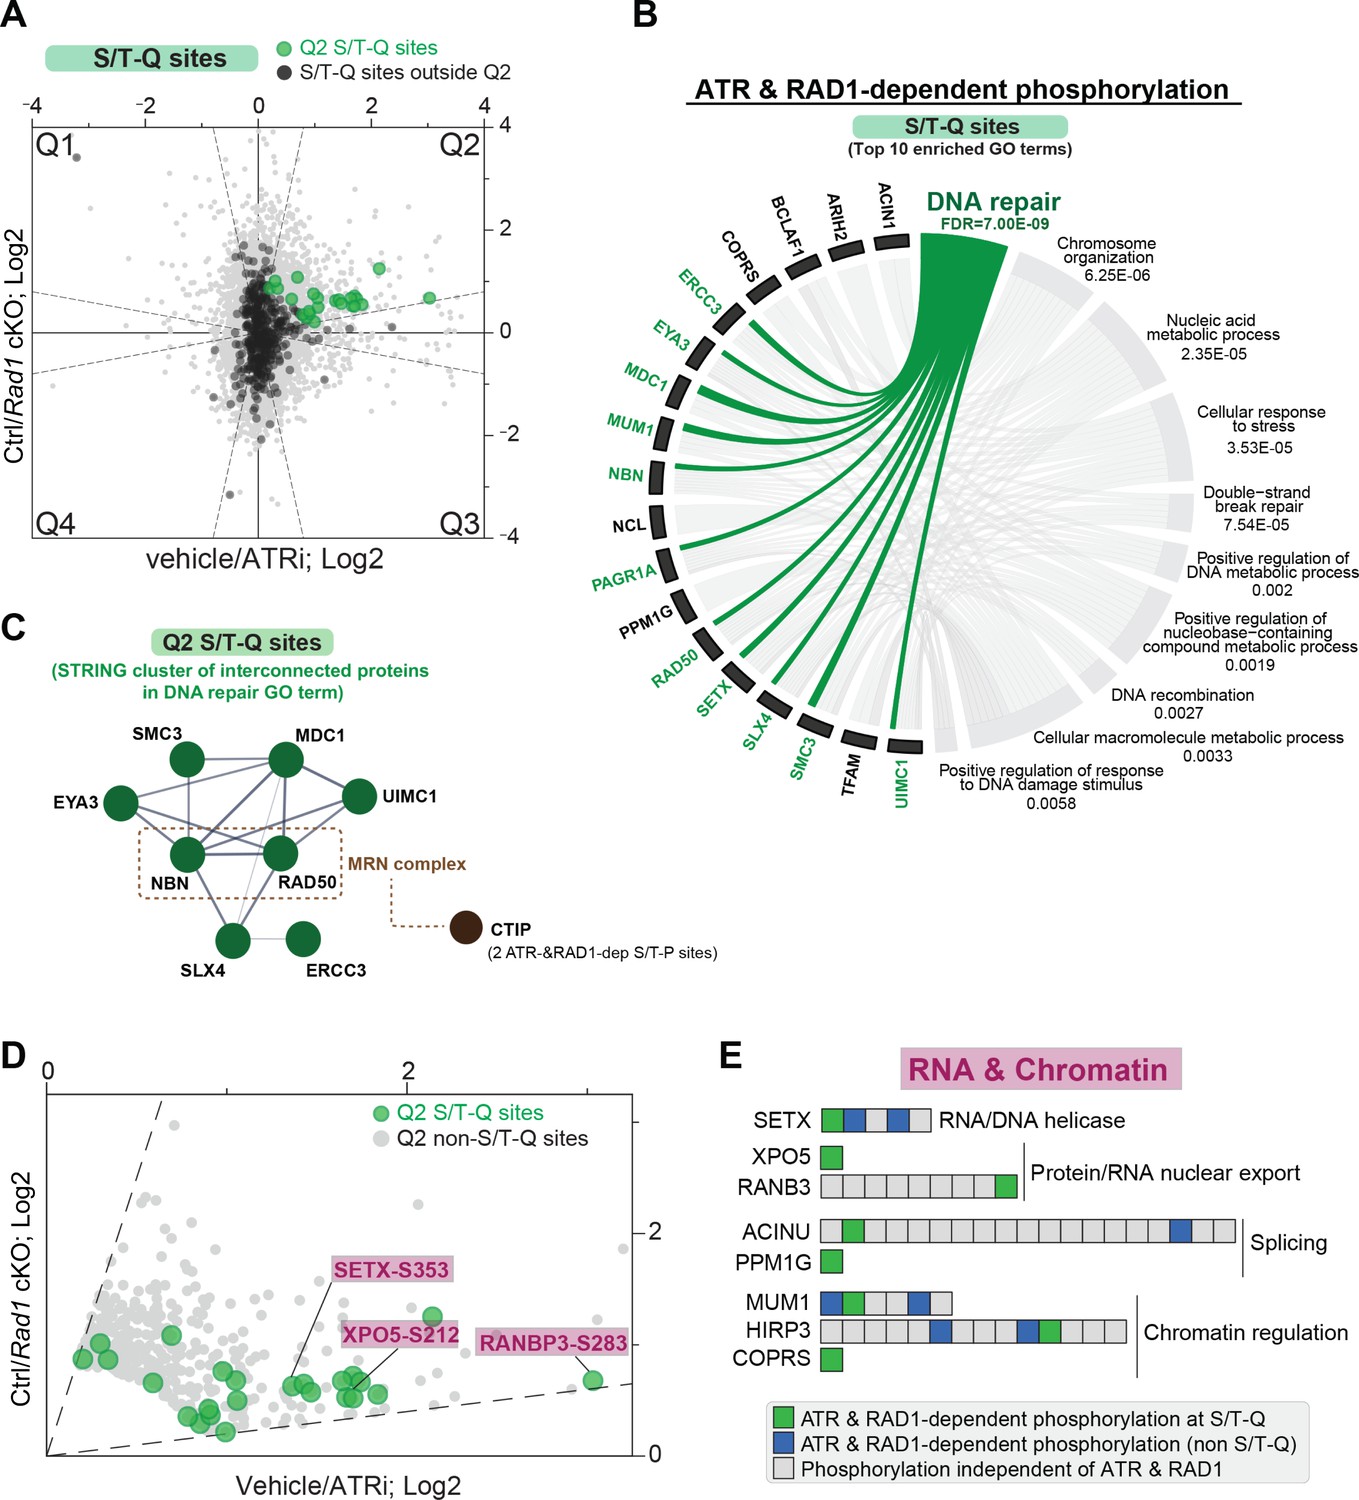
RAD1 and ATR-dependent phosphorylation at the S/T-Q motif.
(A) Scatter plot highlighting all S/T-Q phosphorylation outside Q2 (dark gray) and S/T-Q phosphorylation inside Q2 (green). (B) Chord diagram of gene ontology of ATR and RAD1-dependent S/T-Q phosphorylation events was done using STRING-db network functional enrichment analysis. The top 10 significantly enriched biological processes GO terms were selected and represented as a chord diagram. GO terms are shown on the right and proteins found for each term on the left. False discovery rate (FDR) for GO term enrichment is shown below each term. (C) STRING network of interconnected DNA repair proteins with Q2 S/T-Q phosphorylation. Non-S/T-Q sites for the MRN-related protein CTIP were also present in Q2, suggesting that it is under regulation by a proline-directed kinase controlled by ATR. (D) Scatter plot of data shown in (A) highlighting Q2 S/T-Q phosphopeptides in proteins involved in RNA metabolism. (E) Selected set of proteins involved in chromatin modification and RNA metabolic processes with all identified phosphorylation sites ordered sequentially from the n-terminus to the c-terminus of each protein.
Figure 3—figure supplement 1
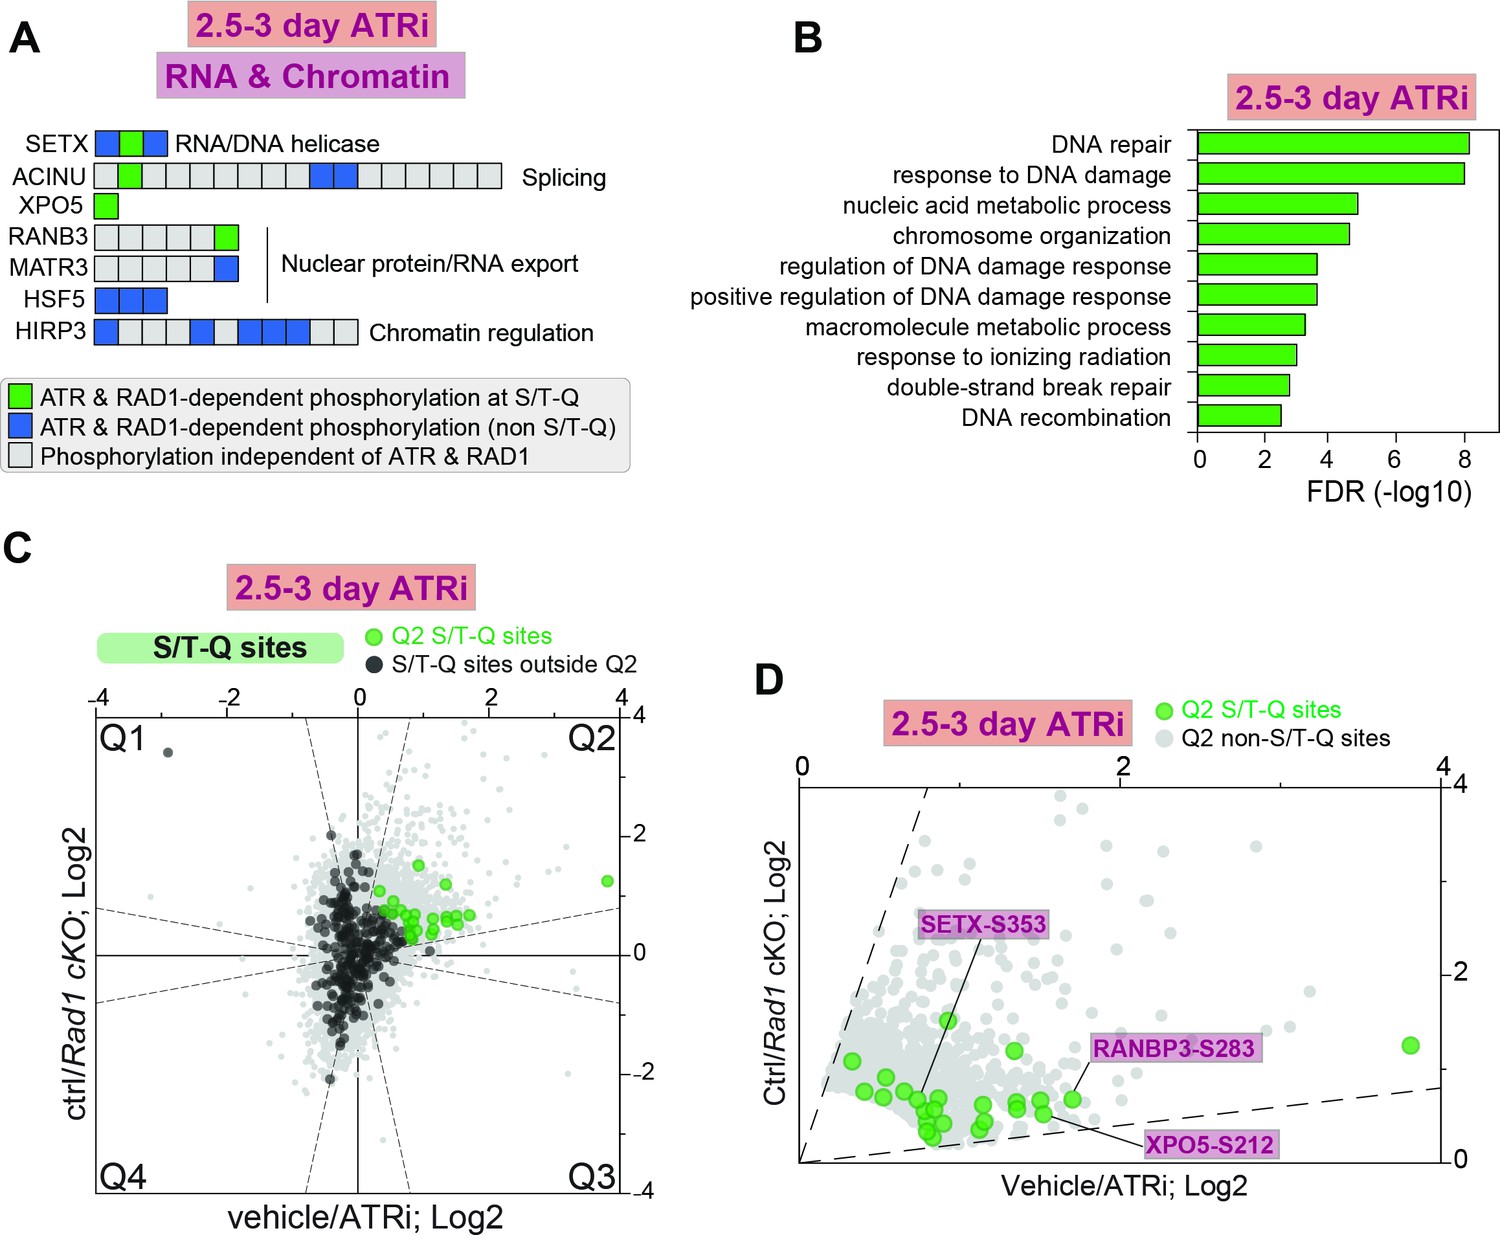
RAD1 and ATR-dependent phosphorylation at the S/T-Q motif in the 2.5–3-day ATRi vs. Rad1 cKO dataset.
(A) Selected set of proteins involved in chromatin modification and RNA metabolic processes with all identified phosphorylation sites ordered sequentially from the n-terminus to the c-terminus of each protein. (B) Gene ontology analysis of ATR and RAD1-dependent S/T-Q phosphorylation events was done using STRING. (C) Scatter plot highlighting all S/T-Q phosphorylation outside Q2 (dark gray) and S/T-Q phosphorylation inside Q2 (green). (D) Scatter plot highlighting Q2 S/T-Q phosphopeptides in proteins involved in DNA repair (purple) and RNA metabolism (maroon).
Figure 3—figure supplement 2
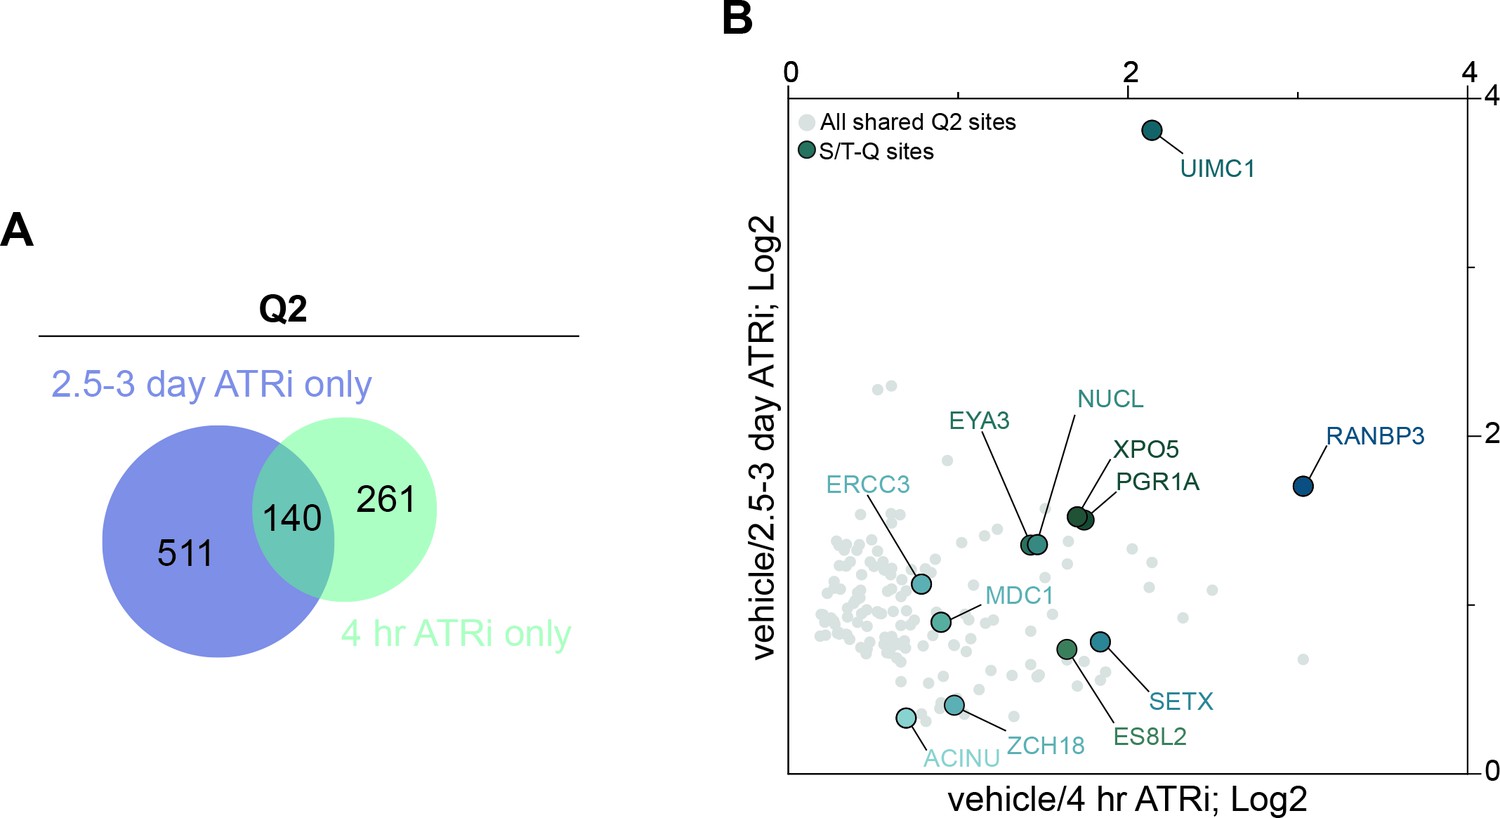
Comparison of 2.5–3-day ATRi and 4 hr ATRi treatment Q2 datasets.
(A) Venn diagram of the number of Q2 peptides identified in the 2.5–3-day ATRi vs. Rad1 cKO dataset only (511 peptides, blue), the 4 hr ATRi vs. Rad1 cKO dataset only (261 peptides, green), and peptides shared between both datasets (140 peptides). (B) Scatter plot of the 140 peptides identified in both the 4 hr and 2.5–3-day ATRi Q2 datasets (gray) with S/T-Q phosphorylated sites marked in blue.
Figure 4 with 2 supplements

Senataxin (SETX) and RANBP3 localization in meiotic spreads after ATR inhibition.
(A) Immunofluorescence of meiotic chromosome spreads with SETX (green) and SYCP3 (red) from mice collected 4 hr after 50 mg/kg treatment with AZ20 or vehicle. (B) Quantification of pachytene spreads in a (four vehicle mice; n = 237 cells; four ATRi mice; n = 283 cells p=0.00435 measured by Student’s t-test). (C) Rad1 cKO and control spreads stained as in (A). (D) Quantification of pachytene or pachytene-like spreads in (C) (four control mice, n = 64 cells; four RAD1 cKO mice, n = 72 cells p=0.00286 measured by Student’s t-test). (E) Immunofluorescence of meiotic chromosome spreads with RANBP3 (green) and SYCP3 (red) from mice collected 4 hr after 50 mg/kg treatment with AZ20 or vehicle. (F) Quantification of pachytene spreads in e (three vehicle mice, n = 174 cells; three ATRi mice, n = 167 cells p=0.048 measured by Student’s t-test). (G) Rad1 cKO and control spreads stained as in (E). (H) Quantification of pachytene or pachytene-like spreads in (G) (four control mice, n = 96 cells; four cKO mice, n = 99 cells p=0.0039 measured by Student’s t-test).
Figure 4—figure supplement 1
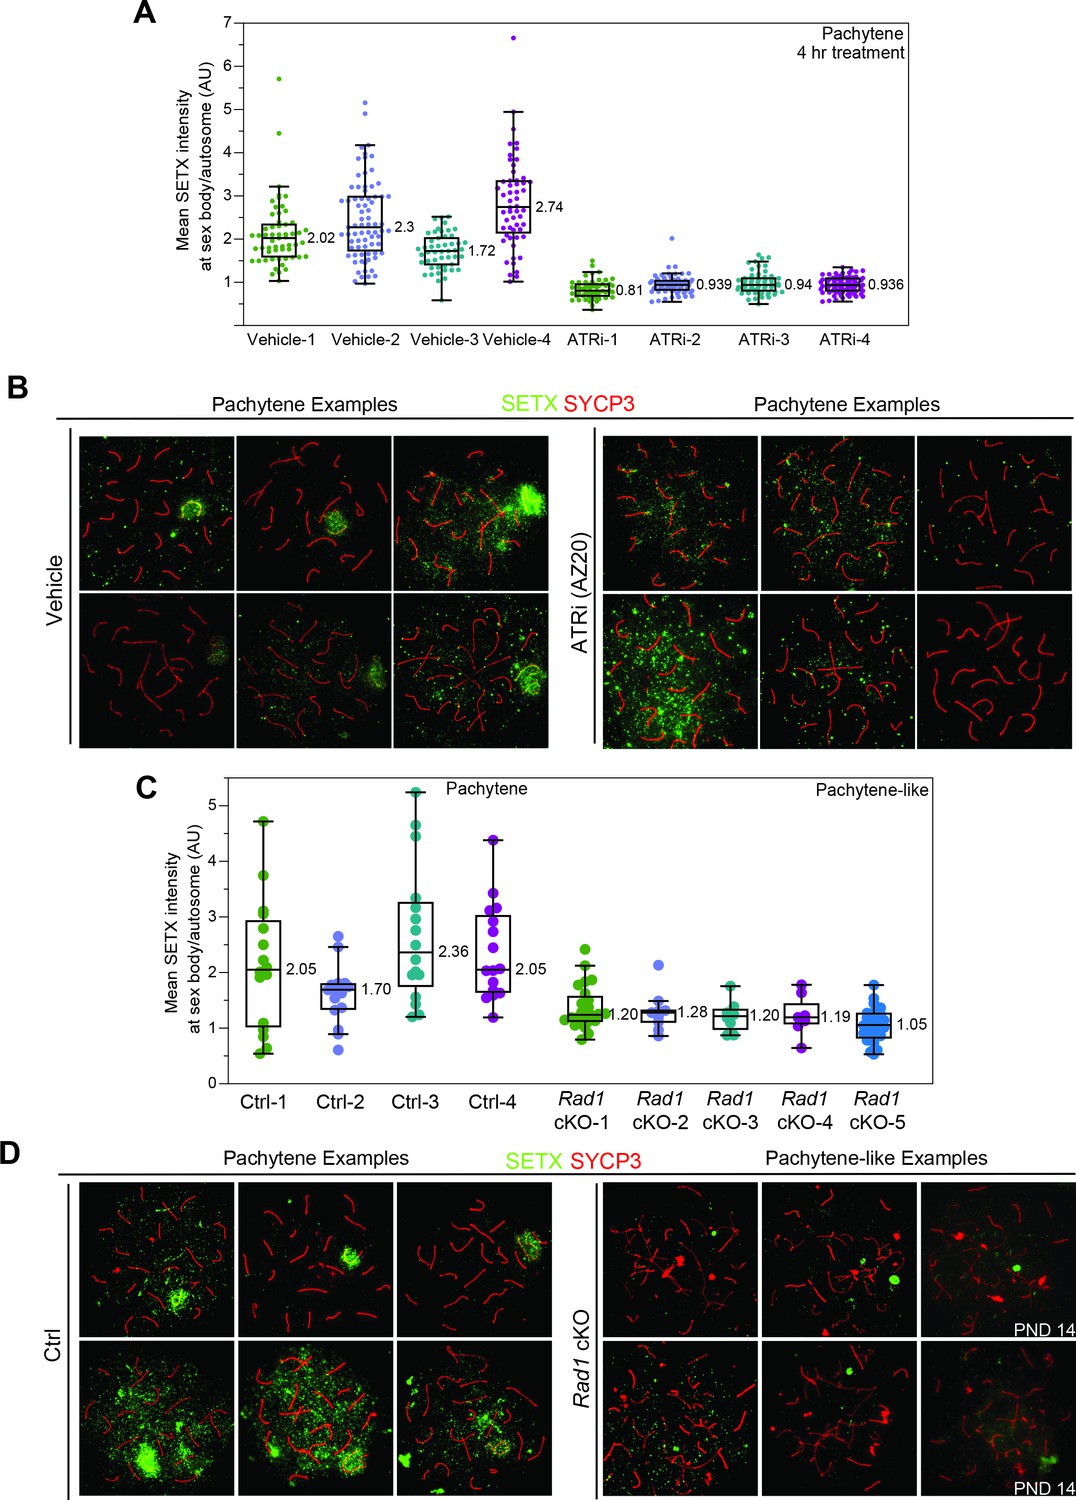
Effect of ATR inhibition on Senataxin (SETX) localization in meiotic spreads.
(A) Quantification of SETX signal at the sex body separated by individual mice. (B) Example images from vehicle or ATR inhibitor-treated mice collected 4 hr after 50 mg/kg treatment with AZ20 or vehicle. (C) Quantification of SETX at sex body or sex chromosomes of control or Rad1 cKO mice, respectively. (D) Example spreads of SETX (green) and SYCP3 (red) staining. Rad1 cKO ‘pachytene-like’ stage was defined as having three or more fully synapsed autosomes. See Materials and methods for more details on quantification. Data derived from 8- to 12-week-old animals, except when noted by postnatal day 14 (PND14).
Figure 4—figure supplement 2
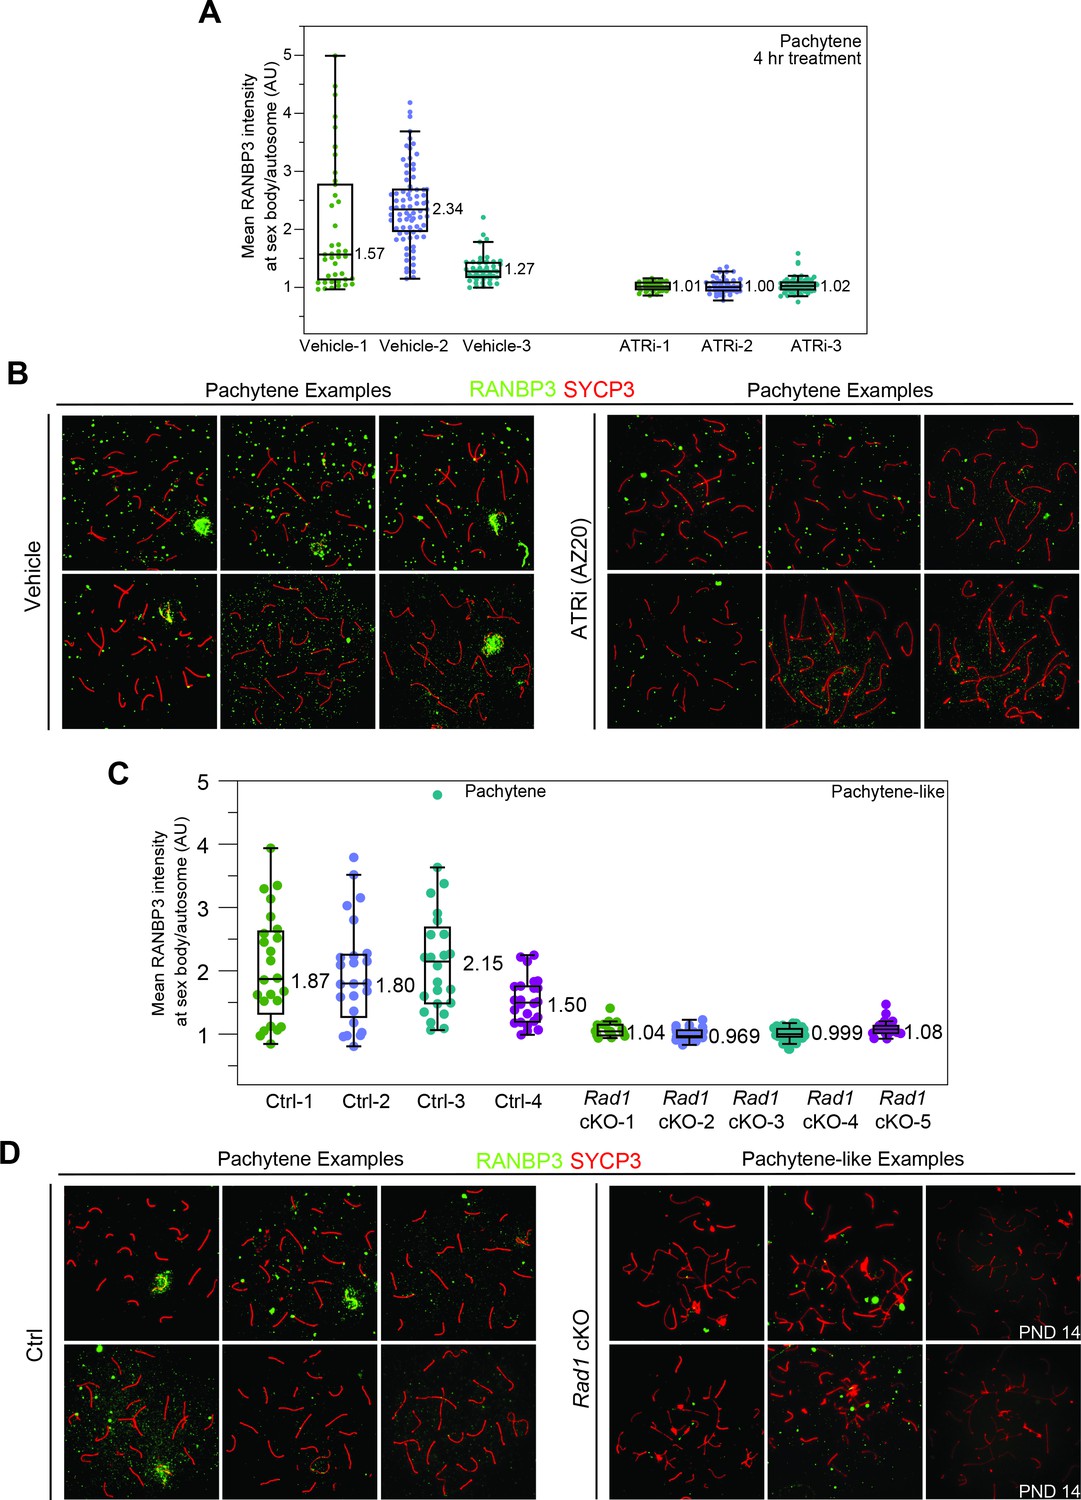
Effect of ATR inhibition on RANBP3 localization in meiotic spreads.
(A) Quantification of RANBP3 intensity from meiotic spreads separated by animal. (B) Example spreads from mice collected 4 hr after 50 mg/kg treatment with AZ20 or vehicle. (C) Quantification of RANBP3 at the sex body or sex chromosomes body of control or Rad1 cKO meiotic spreads, respectively. (D) Example images. See Materials and methods for more details on quantification. Data derived from 8- to 12-week-old animals, except when noted by postnatal day 14 (PND14).
Figure 5 with 3 supplements
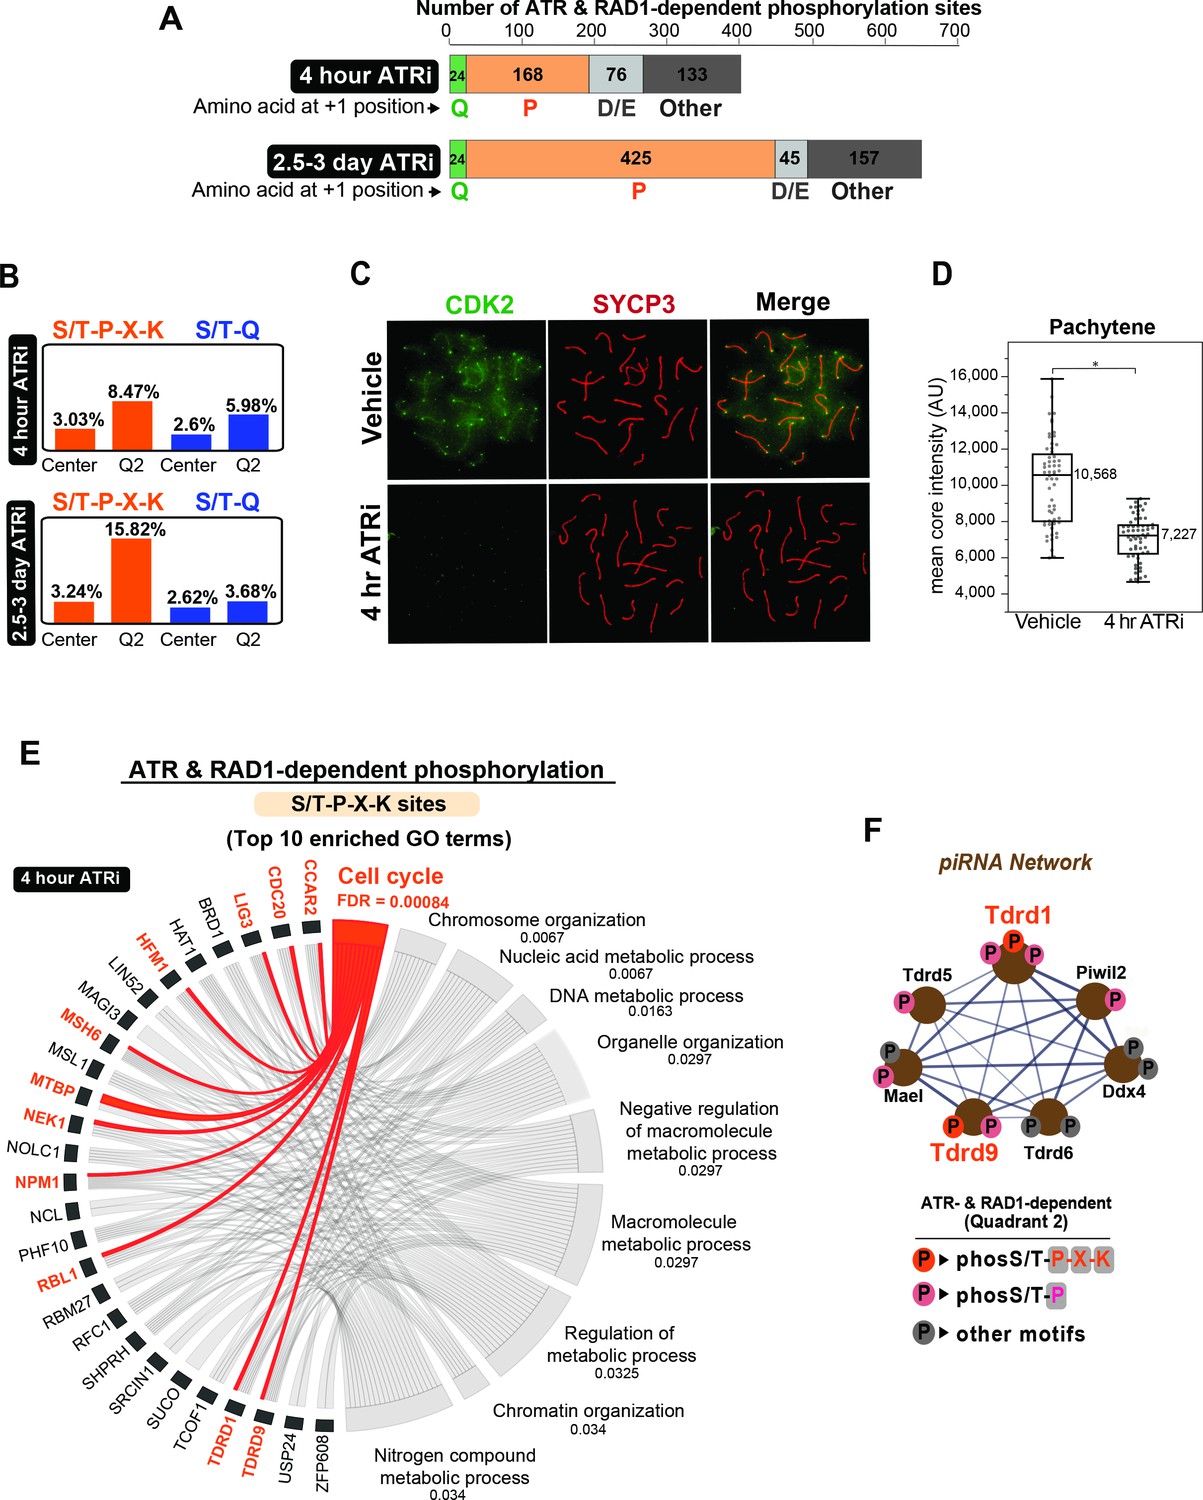
Enrichment of S/T-P-X-K phosphorylation motif in the set of ATR and RAD1-dependent signaling events.
(A) Bar graph depicting the count of Q2 phosphopeptides with the indicated amino acids at the +1 position. (B) Bar graph of the percentage of indicated phospho-motifs in the center (unchanged events) and Q2. (C) Immunofluorescence of meiotic spreads from mice treated with vehicle or 50 mg/kg AZ20 for 4 hr and stained for CDK2 (green) and SYCP3 (red). (D) Quantification of CDK2 signal intensity of pachytene-staged cells in (C) (three vehicle mice, n = 60 cells; three ATRi mice, n = 60 cells p=0.0368 measured by Student’s t-test) (see Materials and methods for more details). (E) Chord plot of gene ontology (GO) analysis of ATR and RAD1-dependent S/T-P-X-K phosphorylation events using STRING. The top 10 significantly enriched biological processes GO terms were selected. False discovery rate (FDR) for GO term enrichment is shown below each term. GO terms are shown on the right and proteins found for each term on the left. (F) STRING analysis cluster of piRNA-related proteins with Q2 phosphorylation.
Figure 5—figure supplement 1
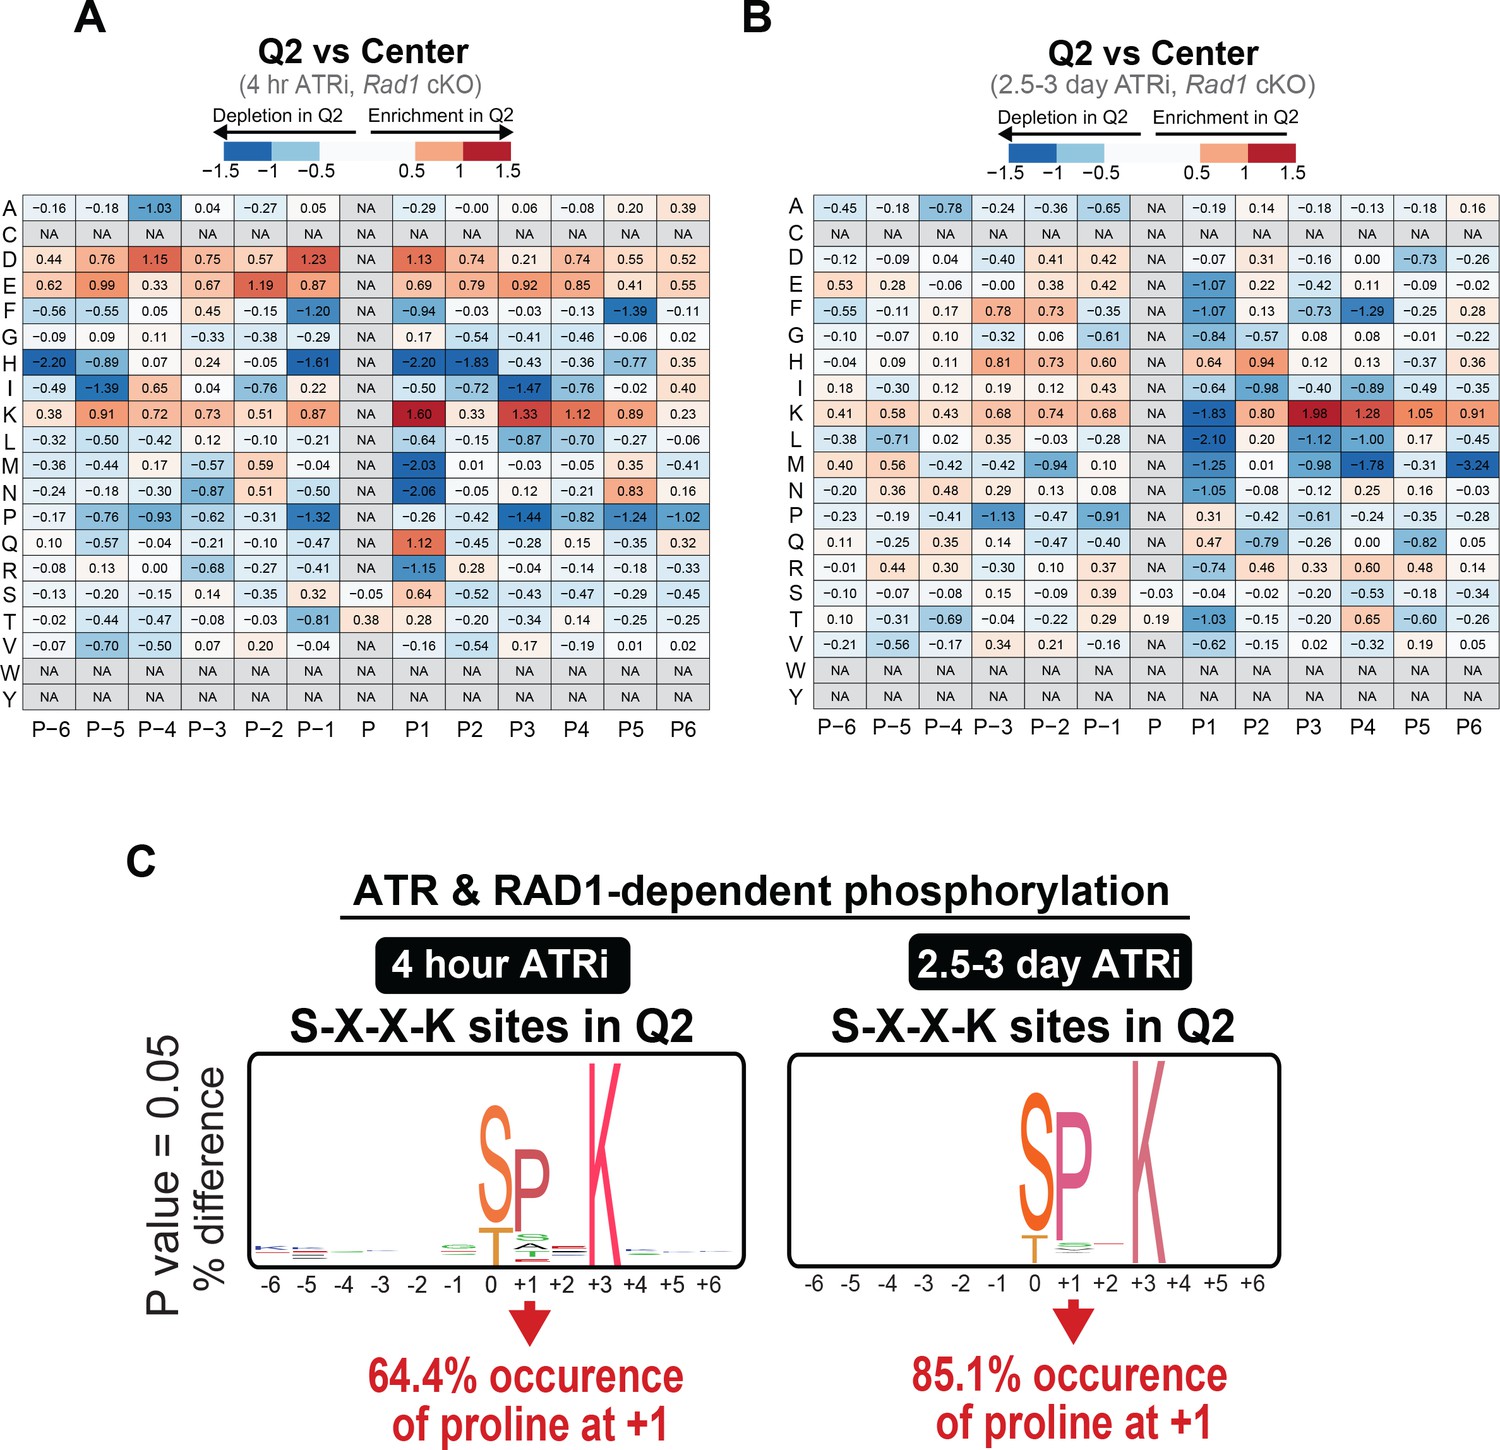
RAD1- and ATR-dependent signaling is enriched for phosphorylation events at the S/T-X-X-K motif.
(A) Heat map for the prevalence of amino acids at positions surrounding the phosphorylation sites (P: phosphorylation site position) comparing Q2 phosphopeptides to phosphopeptides found in the center dataset. Amino acids (y axis) were plotted against position (x axis) with fold depletion in Q2 represented by blue and fold enrichment in Q2 represented by red for the 4 hr ATRi treatment. (B) Same as in (A) but for the 2.5–3-day ATRi treatment dataset. (C) Logo graph for relative prevalence of different amino acids in Q2 phosphosites containing a fixed lysine (K) at +3 position.
Figure 5—figure supplement 2
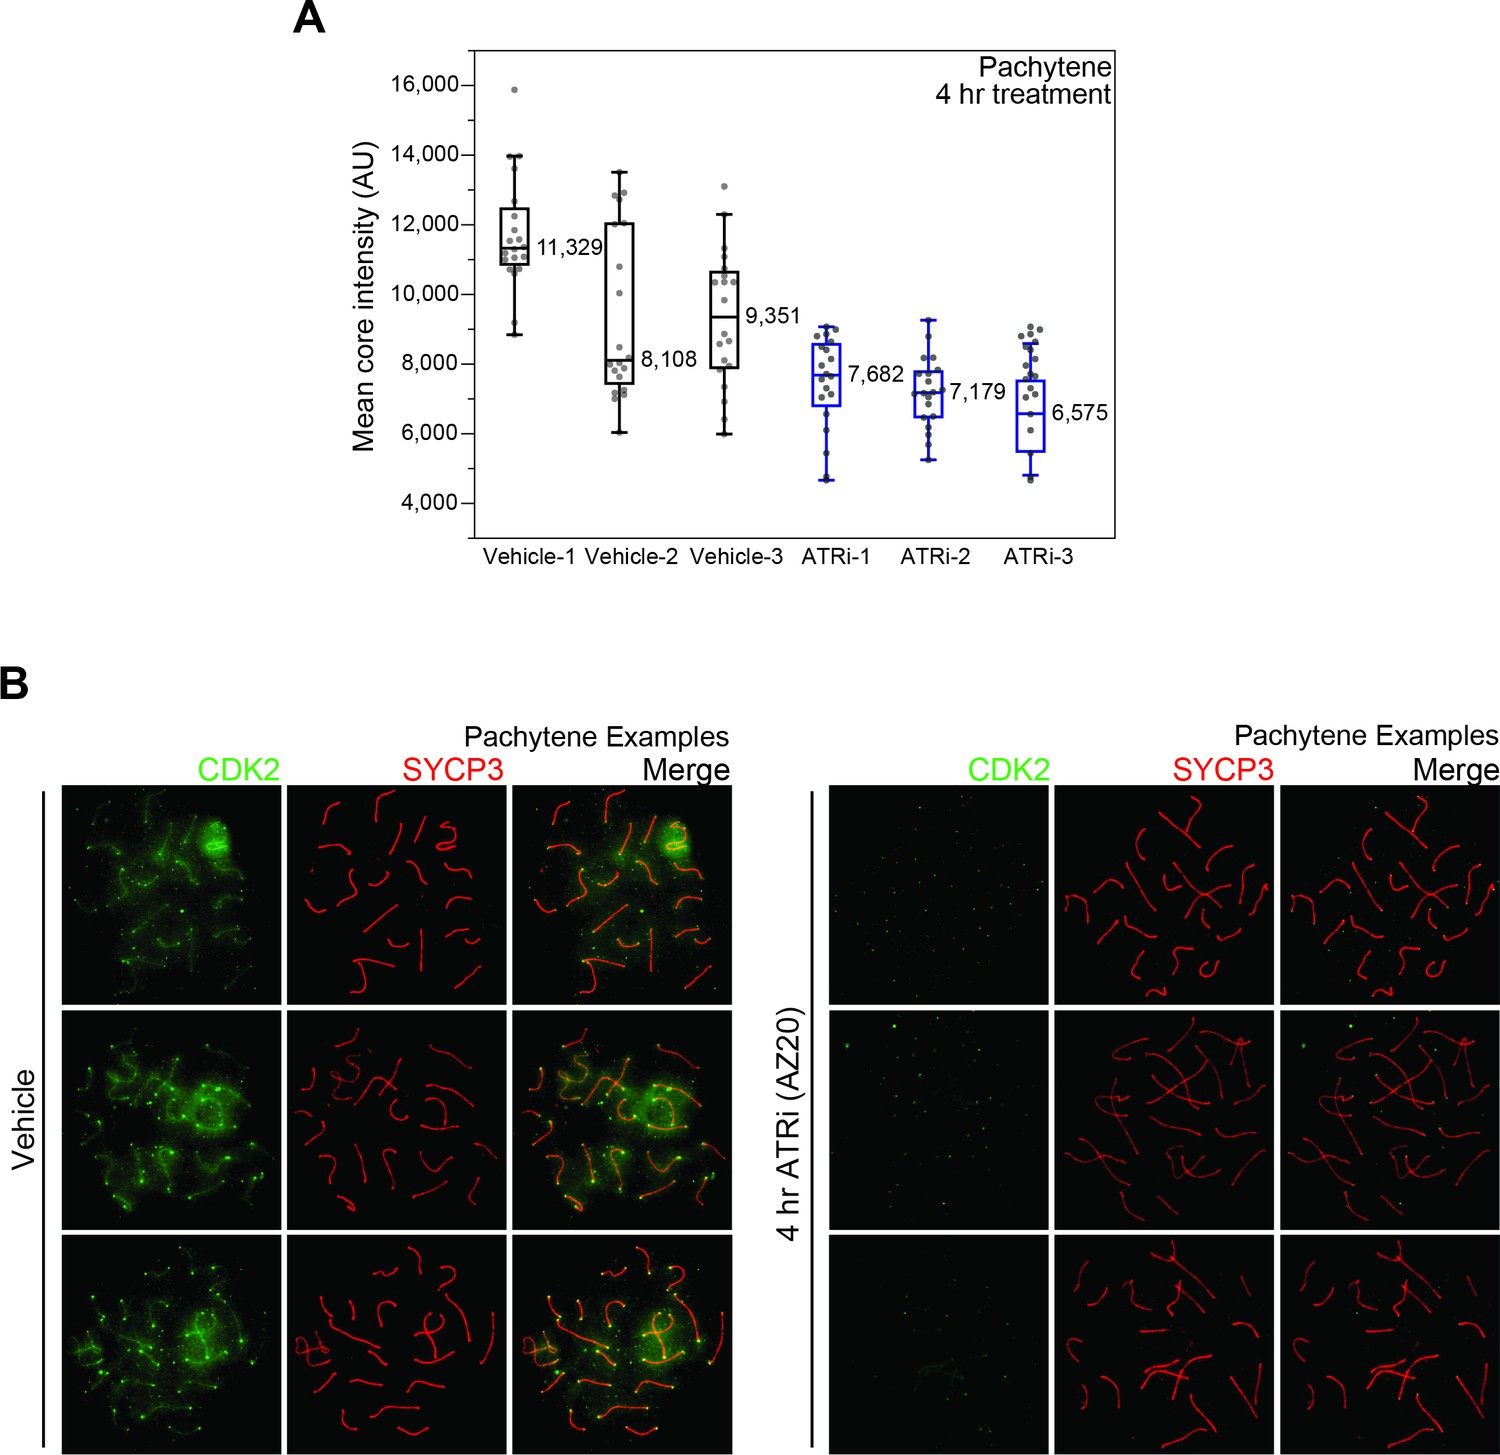
Effect of ATRi treatment on the localization of CDK2 in meiotic spreads.
(A) Quantification of autosomal core intensity of CDK2 as shown in Figure 5D, but separated by individual animal replicates. (B) Example pachynema images from vehicle or 4 hr ATRi-treated animals stained with CDK2 (green) and SYCP3 (red).
Figure 5—figure supplement 3
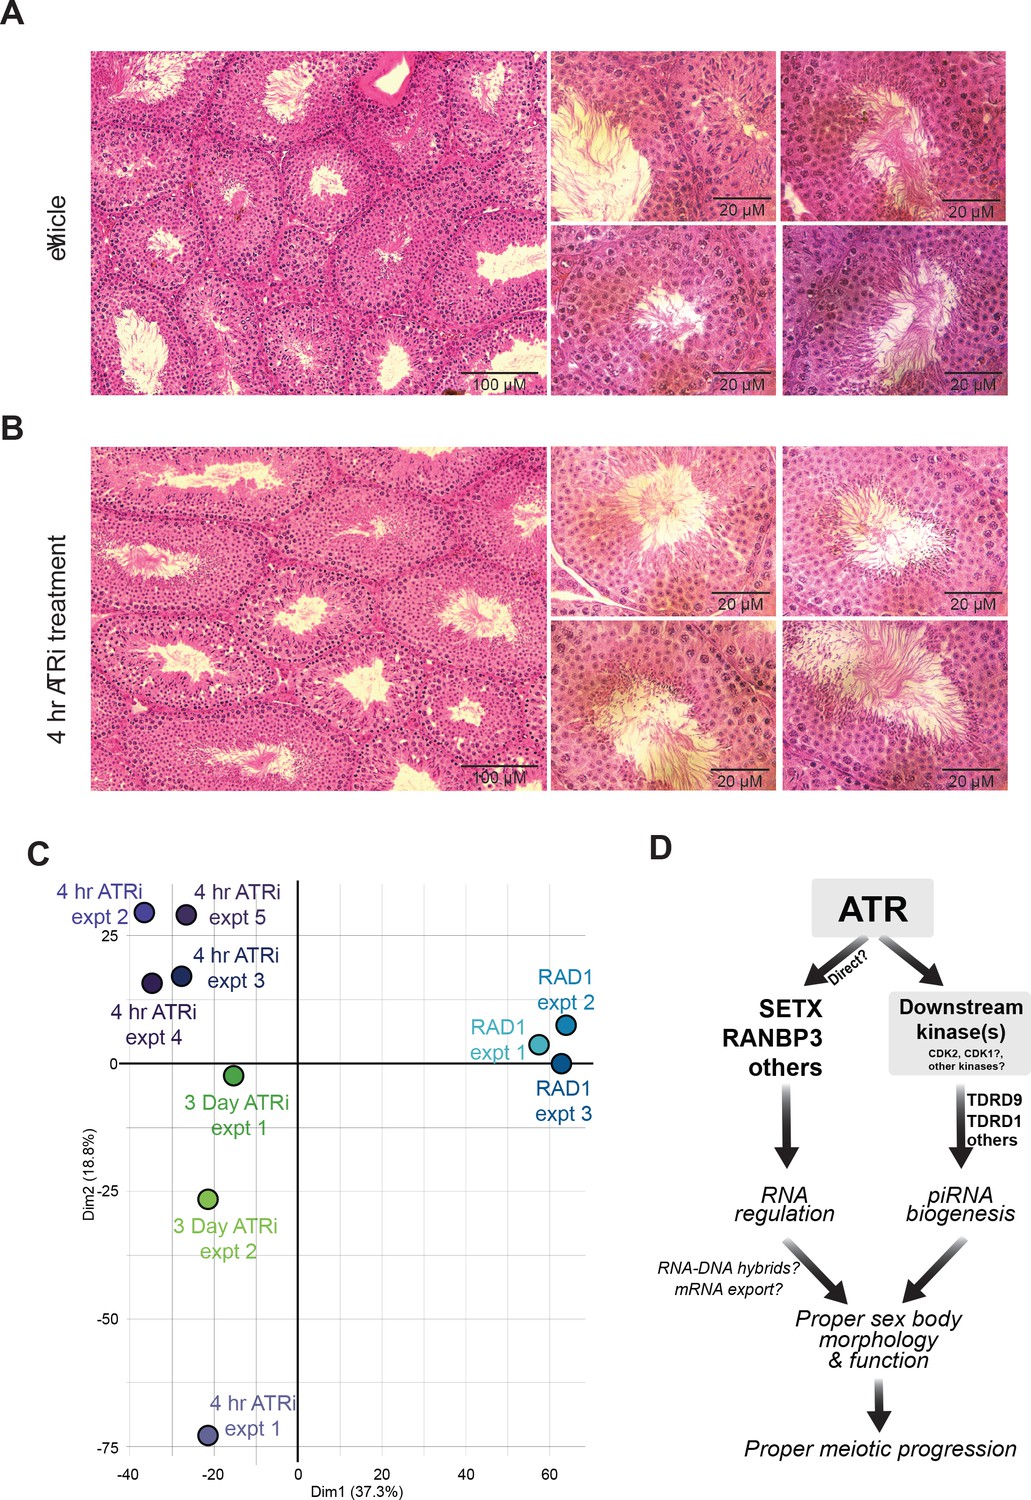
Histological and PCA analysis of ATRi treated mice.
(A) Hematoxylin and eosin stained testes tissue sections from vehicle and (B) 50 mg/kg AZ20 (ATRi)-treated mice. (C) Principal component analysis for experimental replicates and conditions. 4 hr ATRi treatments are in purple, 2.5–3-day ATRi experiments in green and Rad1 cKO mice are in blue. (D) Speculative model for the role of ATR signaling in the control of RNA processes and promotion of meiotic progression.
Additional files
-
Supplementary file 1
Complete phosphoproteomic dataset of the 4 hr ATRi vs. Rad1 cKO experiments.
Complete list of phosphopeptides identified in each biological replicate for mice treated with ATRi for 4 hr and the Rad1 cKO conditions. Column header definitions can be found in sheet 1. See Materials and methods for details on data processing and filtering. Phosphosites removed by filtering can be found in the last tab.
- https://cdn.elifesciences.org/articles/68648/elife-68648-supp1-v1.xlsx
-
Supplementary file 2
Gene ontology STRING analysis output.
Gene ontology information from STRING-db for subsets of data from the 4 hr or 2.5–3-day ATRi treatment combined to Rad1 cKO. Each quadrant or type of filter applied is indicated on the tab name.
- https://cdn.elifesciences.org/articles/68648/elife-68648-supp2-v1.xlsx
-
Supplementary file 3
Complete phosphoproteomic database of the 2.5–3-day ATRi vs. Rad1 cKO experiments.
Complete list of phosphopeptides identified in each biological replicate for mice treated with ATRi 2.5 and 3 days hours and the Rad1 cKO conditions. Rad1 cKO phosphopeptides are the same presented in Supplementary file 1. Column header definitions can be found in sheet 1. See Materials and methods for details on data processing and filtering. Phosphosites removed by filtering can be found in the last tab.
- https://cdn.elifesciences.org/articles/68648/elife-68648-supp3-v1.xlsx
-
Supplementary file 4
Phosphoproteomic database comparison of Q2 4 hr ATRi and 2.5–3-day ATRi.
Comparison of the Q2 phosphopeptides found in the 4 hr and/or 2.5–3-day ATRi treatment conditions. Data is separated into Q2 sites exclusively found in the 4 hr ATRi treatment, 2.5–3 hr ATRi treatment or sites common between both datasets, separated into different sheets.
- https://cdn.elifesciences.org/articles/68648/elife-68648-supp4-v1.xlsx
-
Supplementary file 5
Gene ontology chord analysis output.
Gene ontology output from chord diagrams. See Materials and methods for more details.
- https://cdn.elifesciences.org/articles/68648/elife-68648-supp5-v1.xlsx
-
Transparent reporting form
- https://cdn.elifesciences.org/articles/68648/elife-68648-transrepform1-v1.pdf
Download links
A two-part list of links to download the article, or parts of the article, in various formats.
Downloads (link to download the article as PDF)
Open citations (links to open the citations from this article in various online reference manager services)
Cite this article (links to download the citations from this article in formats compatible with various reference manager tools)
Phosphoproteomics of ATR signaling in mouse testes
eLife 11:e68648.
https://doi.org/10.7554/eLife.68648


