Src activates retrograde membrane traffic through phosphorylation of GBF1
- Institute of Molecular and Cell Biology, Singapore
- Institute of Bioengineering and Bioimaging, Singapore
- Bioinformatics Institute, Singapore
- Department of Biological Sciences, National University of Singapore, Singapore
- School of Biological Sciences, Nanyang Technological University, Singapore
Figures
Figure 1 with 2 supplements
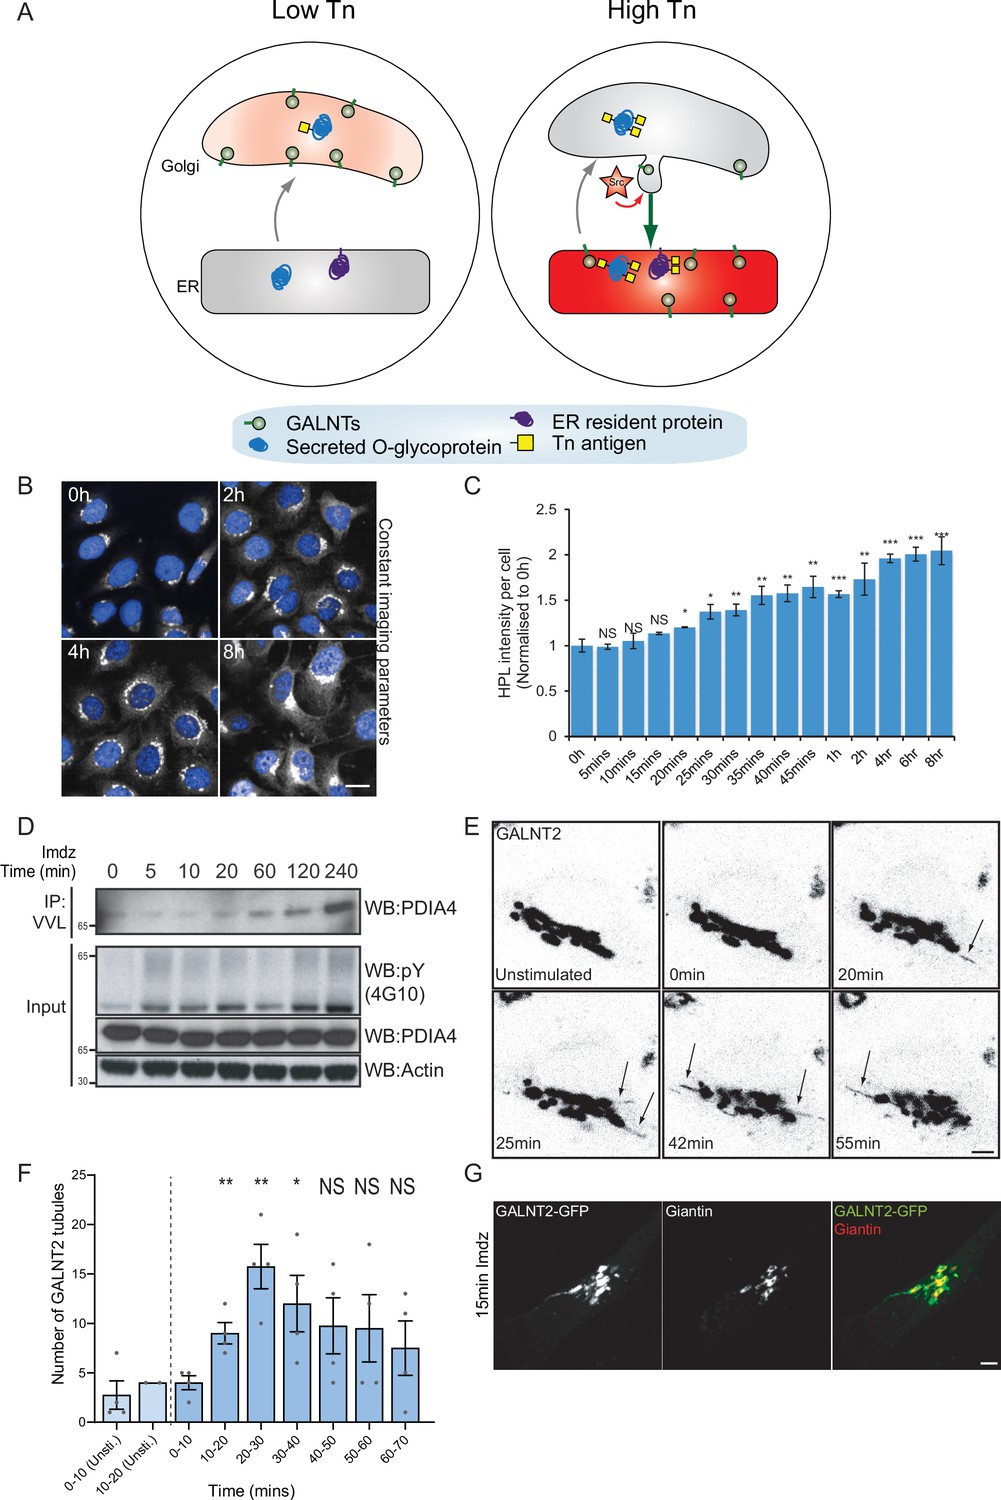
Src8A7F chemical activation induces GALNTs relocation to the endoplasmic reticulum (ER) in tubular carriers.
(A) Schematic of the GALA pathway, the red coloring represents the anti-Tn lectin staining. (B) Representative images of Helix pomatia lectin (HPL) staining of Tn in HeLa-IS cells after 5 mM imidazole (imdz) stimulation. Scale bar: 20 μm. (C) HPL staining intensity per cell normalized to untreated control cells (0 hr). Three replicate wells per experiment were quantified. (D) Representative immunoblot analysis of Vicia villosa lectin (VVL) immunoprecipitation of cell lysate after 5 mM imdz treatment of HEK-IS cells. (E) Still images of time-course analysis of GALNT2-GFP-expressing HeLa-IS cells stimulated with 5 mM imdz. (See Figure 1—video 1 for time-lapse movie.) Scale bar: 5 μm. (F) Quantification of the number of GALNT2 tubules emanating from the Golgi over various time pre-imdz (light blue bars) and post-imdz treatment (dark blue bars). Tubules were counted manually over 10 min windows in four independent cells. (G) Fixed GALNT2-expressing HeLa-IS cells were stained for the Golgin Giantin. Values on graphs indicate the mean ± SD. Statistical significance (p) was measured by two-tailed paired t-test. *p<0.05, **p<0.01, ***p<0.001 relative to untreated cells.
Figure 1—figure supplement 1
Src activation promotes GALNT tubules at the Golgi.
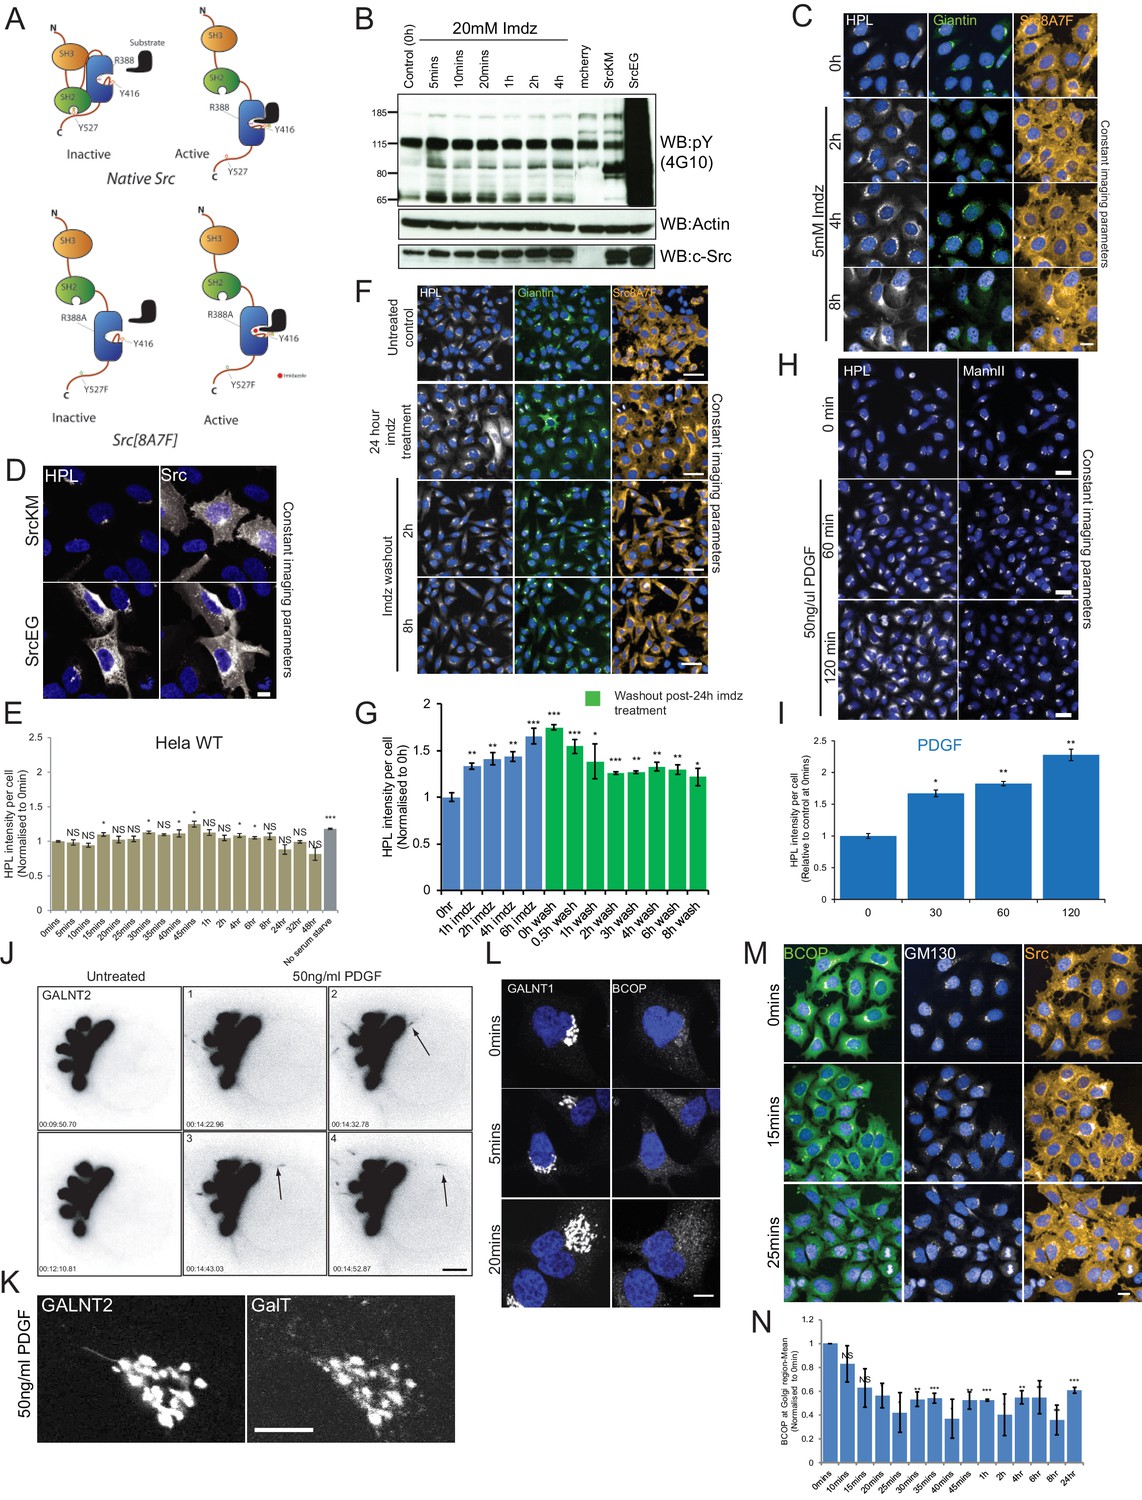
(A) Schematic of imidazole (imdz) rescue of Src8A7F mutant in comparison to wild-type Src. (B) SDS-PAGE comparison of the total phosphotyrosine levels of imdz-treated HeLa-IS cells over time and cells expressing empty mCherry vector, SrcKM and SrcEG mutants. (C) Images of Src8A7F expression as well as Helix pomatia lectin (HPL) and Golgi marker Giantin staining of the cells shown in Figure 1B over time of imdz stimulation. Images were acquired under constant acquisition settings using an automated confocal microscope. Scale bar: 20 μm. (D) HPL staining of HeLa cells expressing inactive SrcKM and active SrcEG mutants. (E) Quantification of HPL levels over duration of 5 mM imdz stimulation in wild-type HeLa cells. Values were normalized with respect to untreated cells (0 hr). (F) HPL staining of HeLa-IS stable cell line over time of imdz washout. Cells were treated with 5 mM imdz for 24 hr prior to washout. Scale bar: 50 μm. (G) Quantification of HPL levels over duration of imdz treatment (blue bars) and washout of imdz and fixed over various durations after 24 hr of imdz treatment (green bars). Values were normalized with respect to untreated cells (0 hr). (H) HPL staining of HeLa cells after 50 ng/ml platelet-derived growth factor (PDGF) stimulation. Scale bar: 10 μm. (I) Quantification of HPL levels after PDGF stimulation normalized with respect to untreated cells (0 hr). (J) Stills of the movie demonstrating GALNT2 tubule formation in HeLa cells stimulated with 50 ng/ml PDGF. Scale bar: 5 μm. (K) The Golgi glycosyltransferase GALT was not observed in the GALNT2 tubules. Scale bar: 10 μm. (L) Images of BCOP localization of HeLa-IS cells over time with imdz treatment. (M) Images of BCOP localization acquired from automated microscope and used for quantification. GM130 is a Golgi marker. Scale bar: 20 μm. (N) Quantification of levels BCOP at the Golgi over time of imdz treatment. Values on graphs indicate the mean ± SD. Statistical significance (p) was measured by two-tailed paired t-test. *p<0.05, **p<0.01, ***p<0.001 relative to untreated cells. NS, nonsignificant.
Figure 1—video 1
Video of tubule formation in GALNT2-GFP-expressing HeLa-IS cells stimulated with 5 mM imidazole (imdz).
Scale bar: 5 μm.
Figure 2 with 1 supplement

Src activation stimulates GTP loading and membrane recruitment of Arf1.
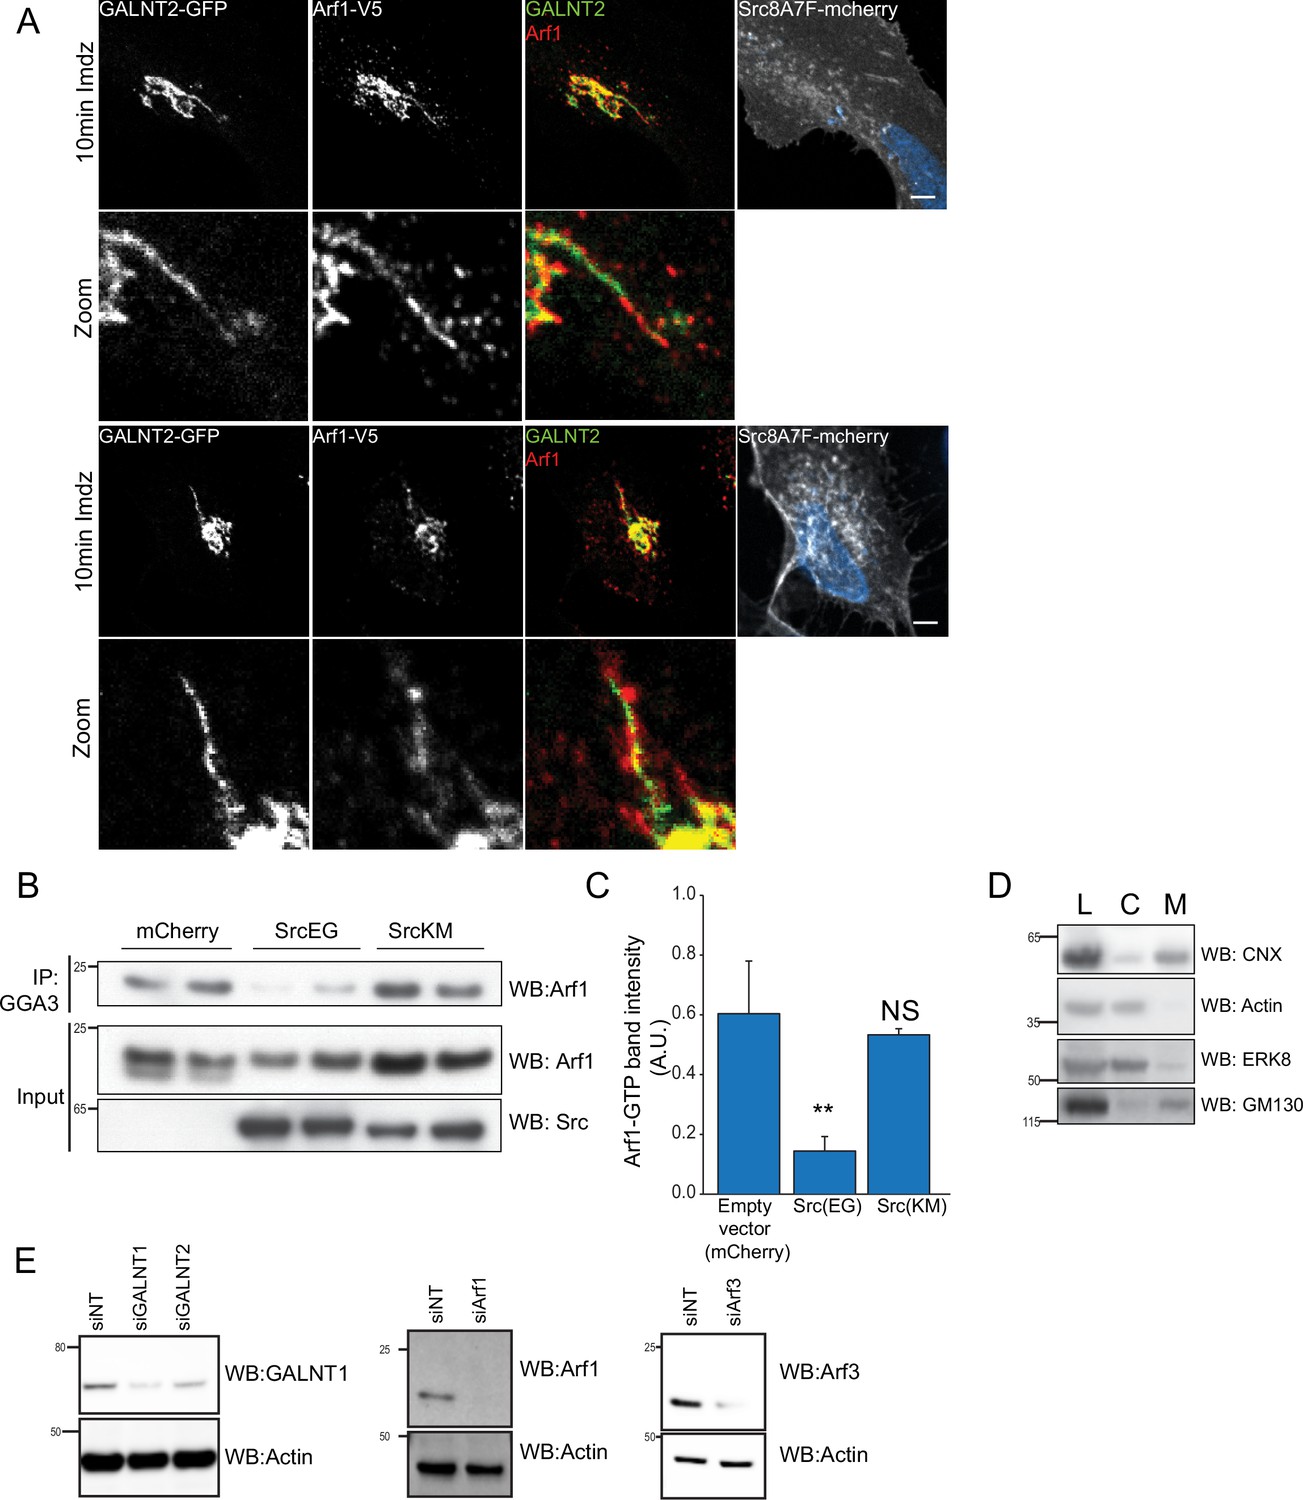
(A) Representative images of Helix pomatia lectin (HPL) staining in HeLa-IS treated with various siRNA before and after 4 hr of imidazole (imdz) treatment. siNT refers to non-targeting siRNA, and siGALNT1 + T2 refers to co-transfection of GALNT1 and GALNT2 siRNAs. Images were acquired under constant acquisition settings. Scale bar: 50 μm. (B) Quantification of HPL staining intensity per cell normalized to the respective untreated cells (0 hr) for each siRNA treatment. Three replicate wells per experiment were measured. (C) Representative images of GALNT2-expressing HeLa-IS cells stained for Arf1 before and after 10 min of stimulation with 5 mM imdz. Images were acquired at ×100 magnification. Scale bar: 5 μm. (D) SDS-PAGE analysis of cytoplasmic and membrane levels of Arf1 after imdz stimulation. CANX refers to blotting for endoplasmic reticulum (ER)-resident Calnexin. The blots were generated with the same exposure and repeated twice. (E) SDS-PAGE analysis of GTP-loaded Arf1 after pulldown with GGA3 beads after imdz treatment in HEK-IS cells. (F) Quantification of Arf1-GTP levels in (E). Two experimental replicates were measured and values were normalized to untreated cells (0 hr). Values on graphs indicate the mean ± SD. Statistical significance (p) was measured by two-tailed paired t-test. *p<0.05, **p<0.01, ***p<0.001 relative to untreated cells. NS, nonsignificant.
Figure 2—figure supplement 1
Active Src transiently stimulates nucleotide exchange and membrane recruitment of Arf.
(A) Additional representative images of Arf1 on GALNT2 tubules emanating from the Golgi upon 10 min stimulation of 20 mM imidazole (imdz). Images were acquired at ×100 magnification under Immersol oil. Scale bar: 5 μm. (B) SDS-PAGE analysis of the levels of Arf1-GTP immunoprecipitation (IP) using GGA3 beads in HEK293T cells expressing empty mCherry vector, SrcKM and SrcEG mutants. (C) Quantification of the levels of Arf1-GTP in (B). Three experimental replicates were measured. (D) SDS-PAGE analysis of total lysate (L), cytoplasmic (C), and membrane (M) levels of various proteins after subcellular fractionation. Endoplasmic reticulum (ER)-resident Calnexin (CANX), Golgi marker GM130 as well as cytoplasmic actin and MAP kinase ERK8 are shown. (E) siRNA knockdown efficiencies of various proteins assayed. siNT refers to non-targeting siRNA. Values on graphs indicate the mean ± SD. Statistical significance (p) was measured by two-tailed paired t-test. *p<0.05 and **p<0.001 relative to untreated cells. NS, nonsignificant.
Figure 3 with 3 supplements
Src activates the ARF-GEF GBF1.
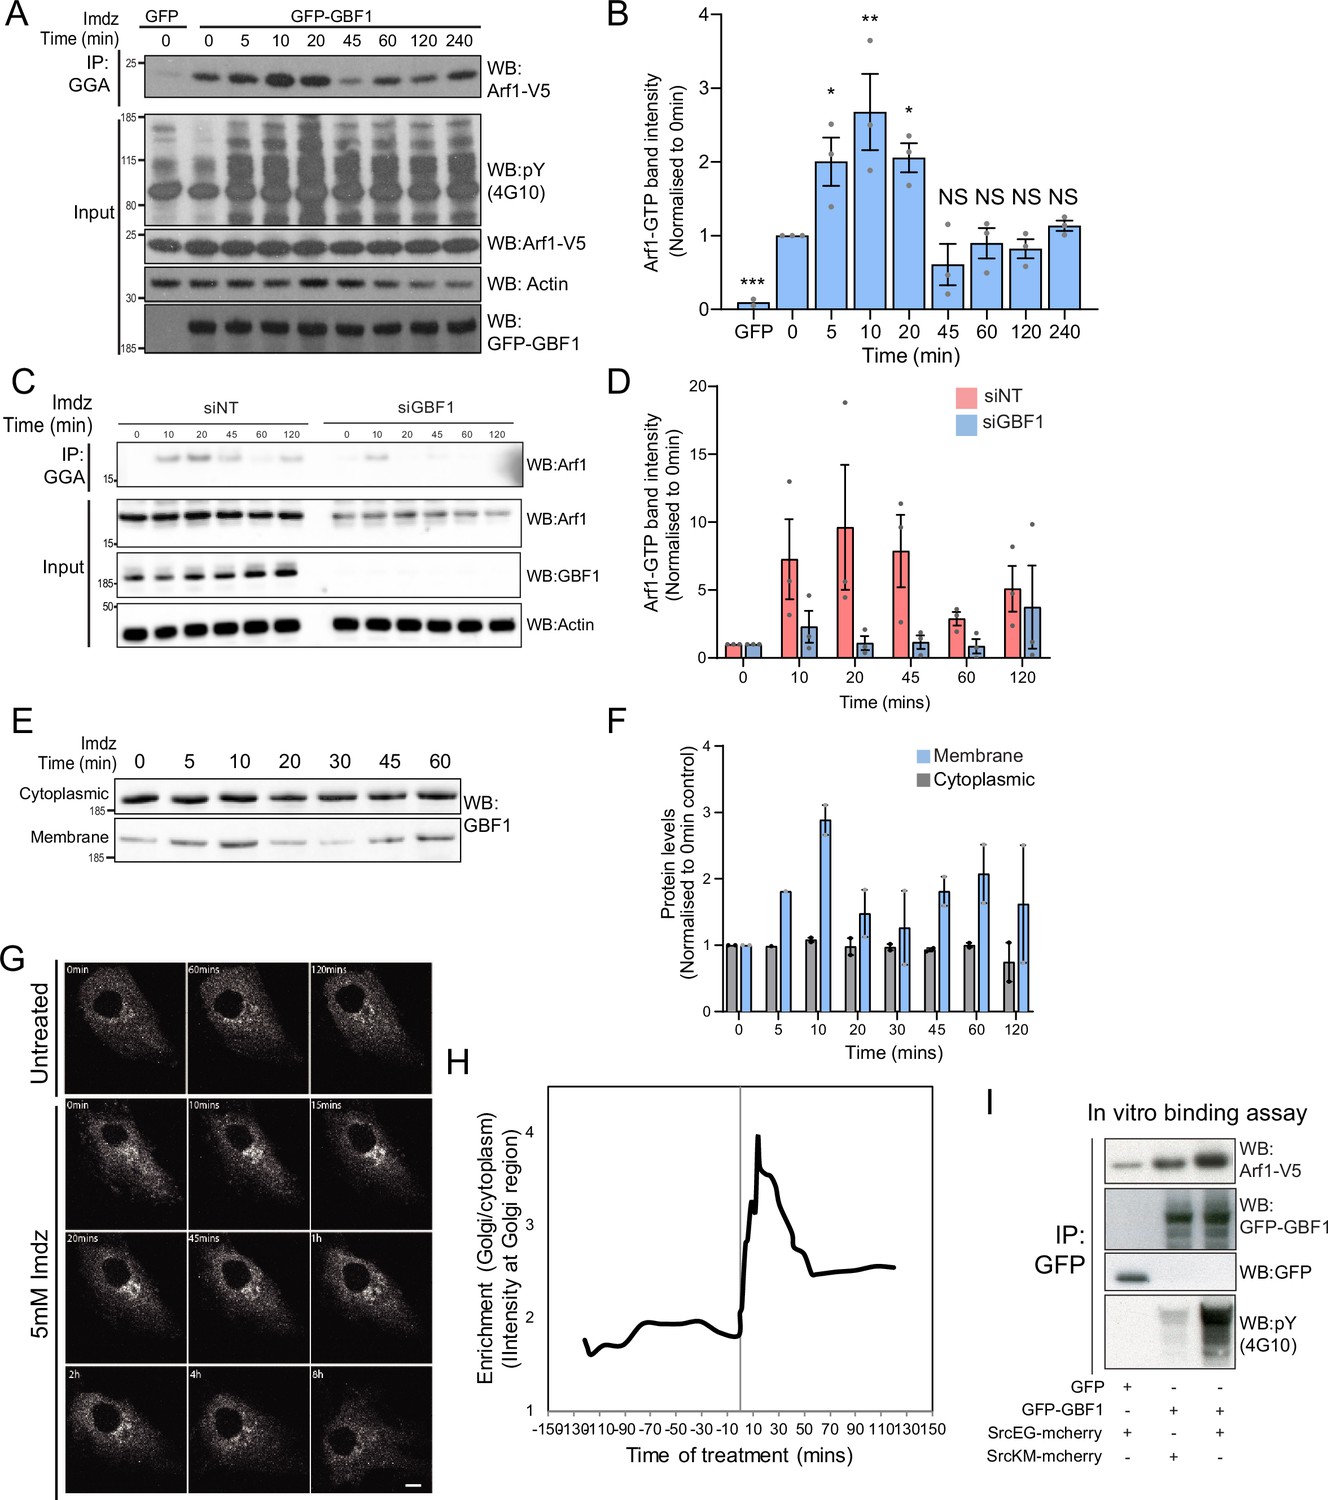
(A) Representative SDS-PAGE analysis of Arf1-GTP levels in HEK-IS cells expressing GFP or GFP-GBF1. GGA pulldown was performed as in Figure 2E. (B) Quantification of Arf1-GTP levels in three independent experiments in (A). (C) SDS-PAGE analysis of Arf1-GTP levels in HEK-IS cells treated with siGBF1 and siNT siRNA. (D) Quantification of the Arf1-GTP levels in three independent experiments in (C). (E) SDS-PAGE analysis of cytoplasmic and membrane levels of GBF1 after imidazole (imdz) stimulation. (F) Quantification of two independent experiments shown in (E). Values presented were normalized to untreated cells (0 hr).(G) Still images of the time-lapse movie of GBF1-GFP in HeLa-IS cells stimulated with 5 mM imdz. Scale bar: 10 μm. (H) Quantification of the ratio of Golgi to total cytoplasmic levels of GBF1 before and after imdz treatment in time lapse shown in (G). (I) SDS-PAGE analysis of the levels of Arf1-V5 bound to GFP or GFP-GBF1 immunoprecipitation (IP) from cells expressing inactive SrcKM or active SrcEG in an in vitro binding assay. Two experimental replicates were tested and quantified in Figure 3—figure supplement 1E.
Figure 3—figure supplement 1
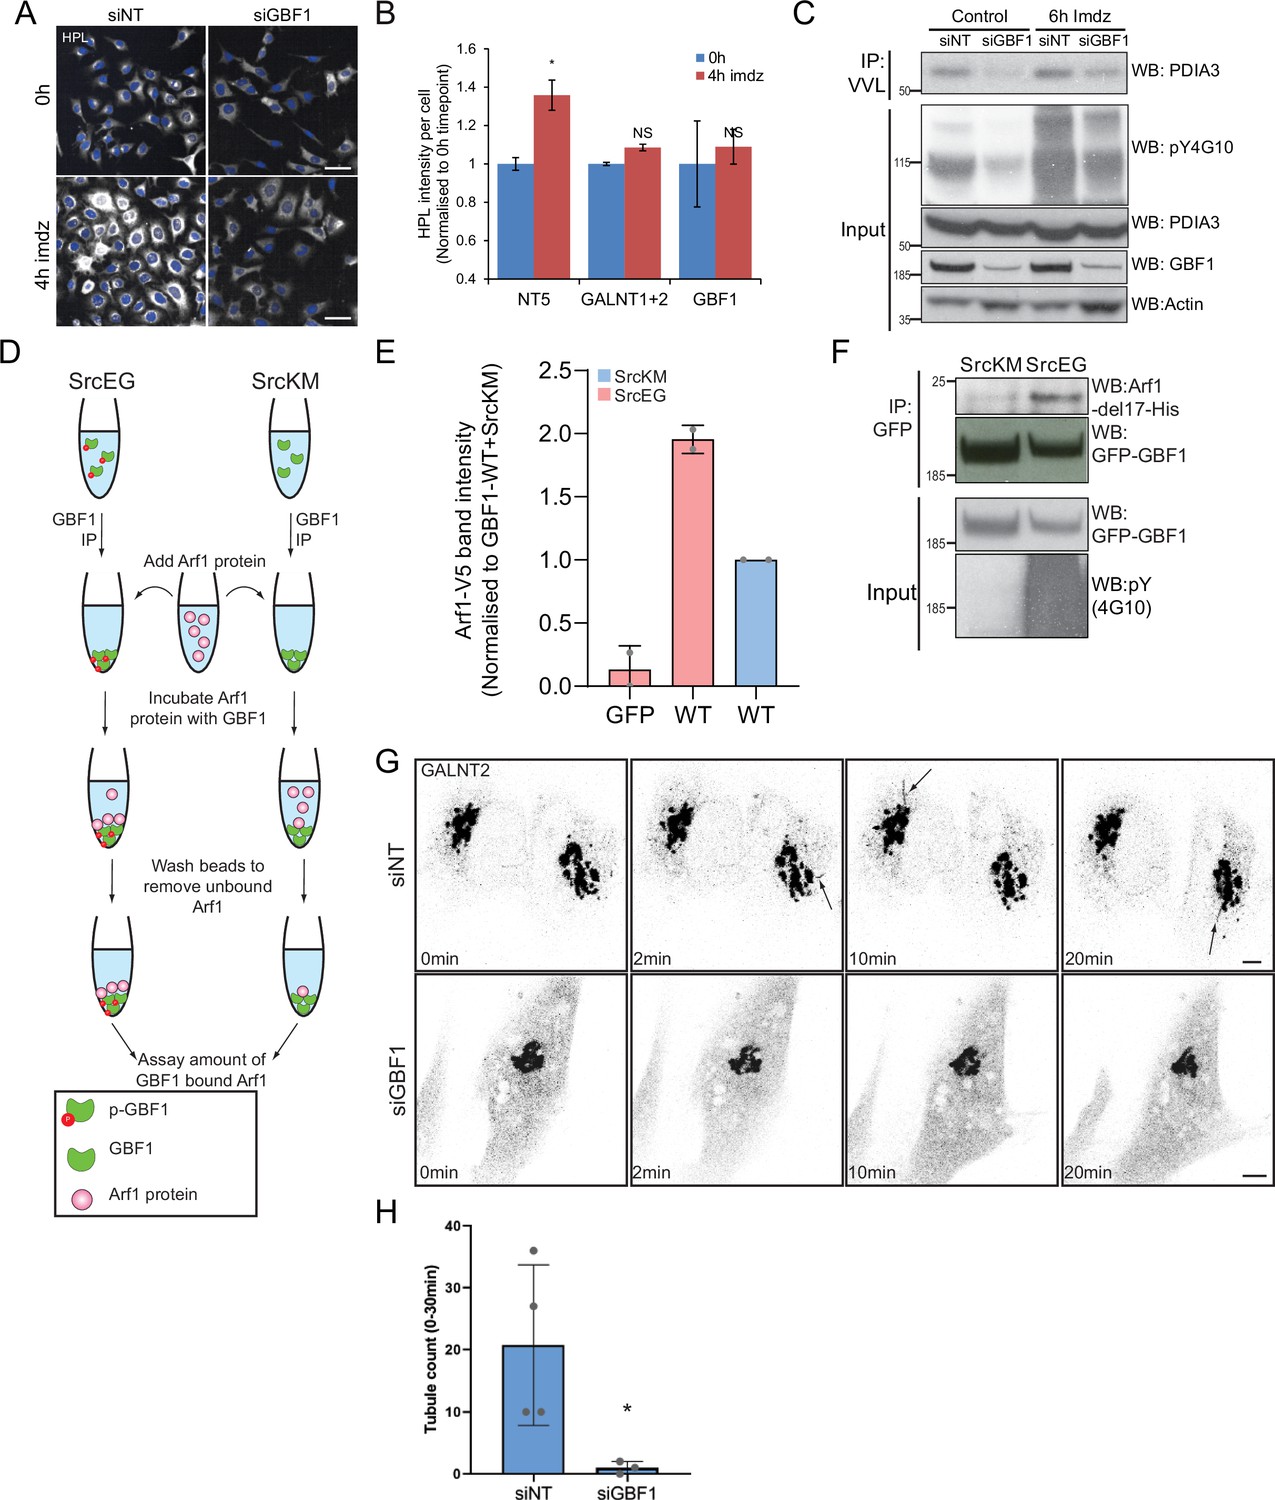
GBF1 is required for GALNT tubule formation.
(A) Helix pomatia lectin (HPL) staining of HeLa-IS stable cell line treated with siRNA targeting GBF1 before and after 4 hr of imidazole (imdz) treatment. siNT refers to non-targeting siRNA, and siGALNT1 + T2 refers to co-transfection of GALNT1 and GALNT2 siRNAs. Images were acquired under constant acquisition settings using an automated confocal microscope. Scale bar: 50 μm. (B) Quantification of HPL staining intensity per cell normalized to the respective untreated cells (0 hr) for each siRNA treatment. (C) Immunoblot analysis of the levels of Tn-modified endoplasmic reticulum (ER)-resident PDIA3 from Vicia villosa lectin (VVL) immunoprecipitation (IP) in HEK-IS cell line upon GBF1 siRNA knockdown. Cells were untreated or treated with 5 mM imdz for 6 hr. (D) Schematic illustrating the workflow of the in vitro Arf1 binding assay. (E) Quantification of the levels of bound Arf1-V5 to GFP and GFP-GBF1 (WT) IP from cells expressing inactive SrcKM or active SrcEG in the in vitro binding assay shown in Figure 3G. Results representative of two experimental replicates. (F) SDS-PAGE analysis of the levels of recombinant protein Arf1-del17-His bound to GFP-GBF1 IP from inactive SrcKM or active SrcEG-expressing cells in an in vitro binding assay. (G) Images from time-lapse imaging of GALNT2-GFP in HeLa-IS cells that were either treated with siRNA targeting GBF1 (siGBF1) or siNT stimulated with 5 mM imdz. (See Figure 3—videos 1 and 2 for time-lapse movies.) Scale bar: 5 μm. (H) Quantification of the number of tubules observed in the first 30 min upon imidazole treatment. Values on graphs indicate the mean ± SD. Statistical significance (p) was measured by two-tailed paired t-test. *p<0.05 and **p<0.01 relative to untreated (0 hr) or GFP-expressing cells. NS, nonsignificant.
Figure 3—video 1
Video of tubule formation in siNT-treated HeLa-IS cells expressing GALNT2-GFP stimulated with 5 mM imidazole (imdz).
Scale bar: 5 μm.
Figure 3—video 2
Video of tubule formation in siGBF1-treated HeLa-IS cells expressing GALNT2-GFP stimulated with 5 mM imidazole (imdz).
Scale bar: 10 μm.
Figure 4 with 1 supplement
Src phosphorylates two tyrosines Y876 and Y898 at the C-terminus of the GBF1 Sec7d.
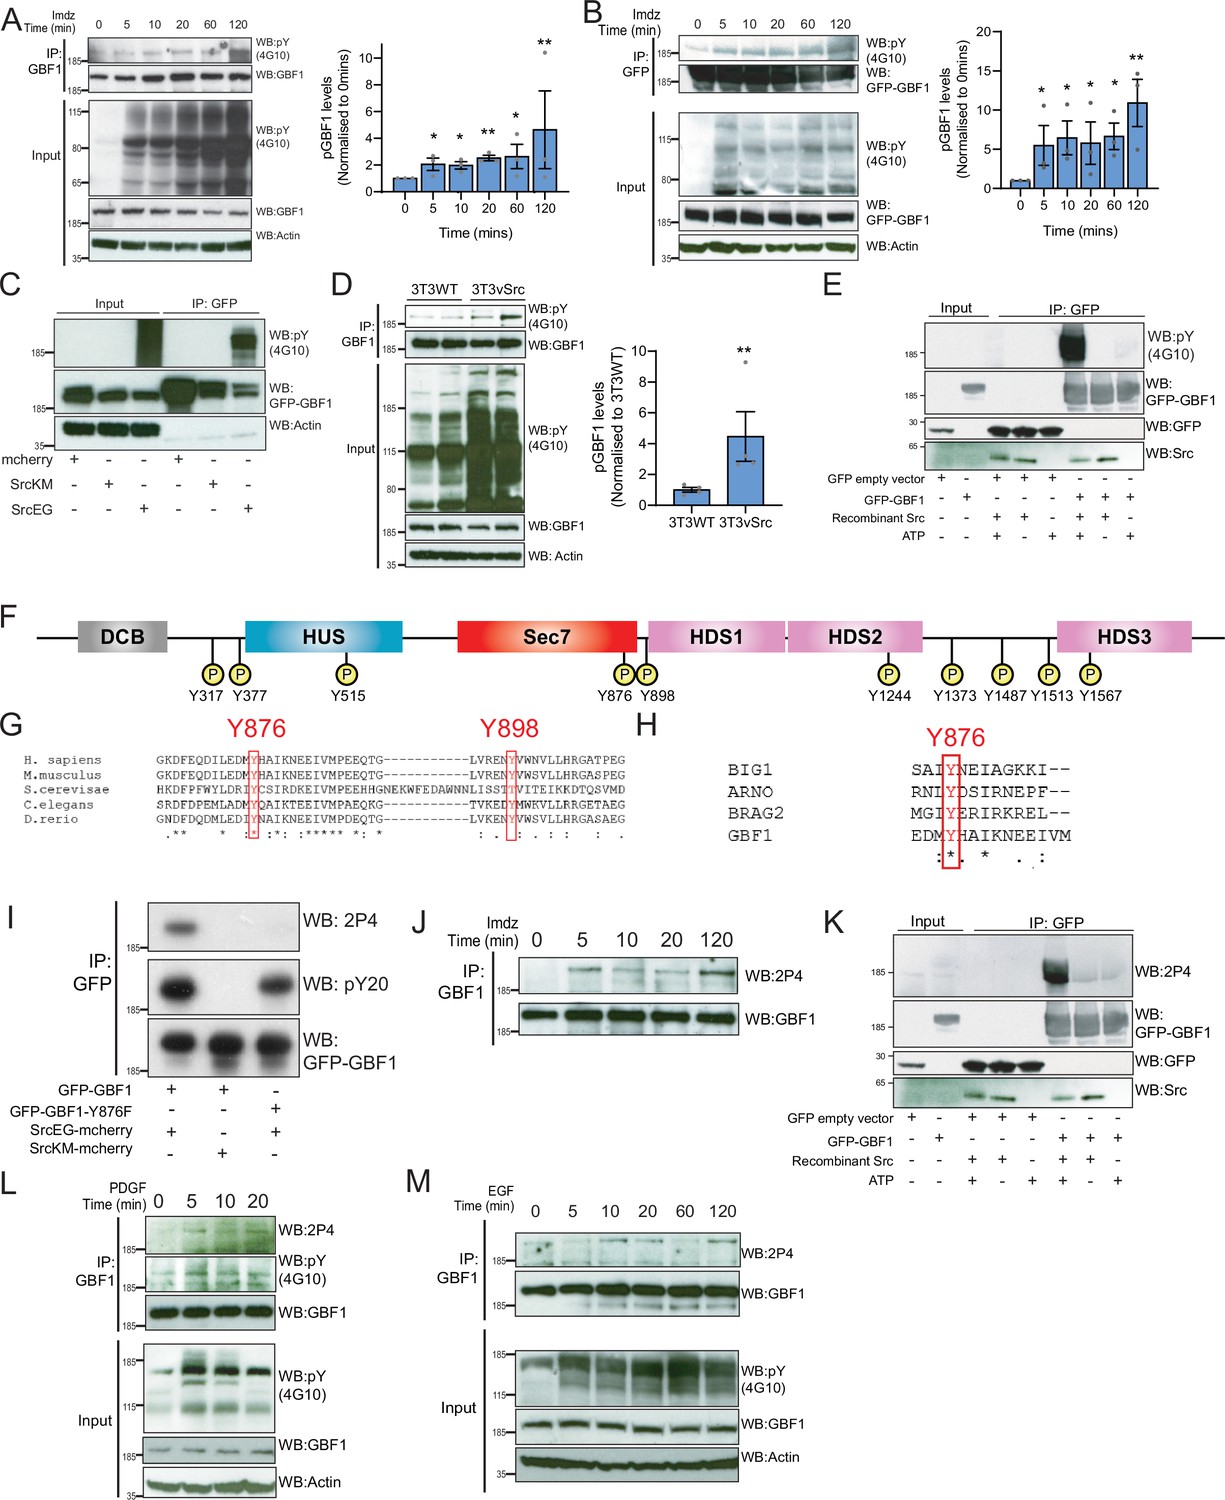
(A) SDS-PAGE analysis of phosphotyrosine (pY) levels in endogenous GBF1 using HEK-IS cells after imidazole (imdz) treatment. Quantification of pY-GBF1 in three replicates shown on the graph (right). (B) SDS-PAGE analysis of pY levels on GFP-GBF1 immunoprecipitation (IP) from HEK-IS cell line after imdz treatment. Quantification of pY-GBF1 in three replicates shown on the graph (right). (C) SDS-PAGE analysis of pY in GBF1 in HEK293T cells expressing either inactive SrcKM or active SrcEG. (D) SDS-PAGE analysis of pY levels on endogenous GBF1 IP from wild-type and vSrc transformed NIH3T3 cell lines. Quantification of pY-GBF1 in four replicates from two independent experiments shown on the graph (right). (E) Quantification of pY in GBF1 after in vitro phosphorylation. Immunoprecipitated GFP or GFP-GBF1 was incubated with recombinant Src protein in the presence or absence of nucleotide ATP. (F) Schematic of the 10 tyrosine residues in GBF1 that were identified by targeted mass spectrometry after exposure to Src. (G) Amino acid sequence alignment of GBF1 from various species. The sequences of GBF1 at Y876 and Y898 of Homo sapiens (NP_004184) was aligned with that of Mus musculus (NP_849261), Saccharomyces cerevisiae (NP_010892), Caenorhabditis elegans (NP_001255140), and Danio rerio (XP_009305378), revealing conservation of both residues. (H) Y876 is conserved and observed to be phosphorylated in other GEFs BRAG2, ARNO, and BIG1 based on the PhosphoSitePlus database. (I) SDS-PAGE analysis of wild-type GFP-GBF1 or GFP-GBF1-Y876F mutant immunoprecipitated from HEK293T cells expressing inactive SrcKM or active SrcEG. Phosphorylation at Y876 was marked by the 2P4 antibody. (J) SDS-PAGE analysis of Y876 phosphorylation on endogenous GBF1 IP from HEK-IS cell line over various durations of imdz treatment. (K) Y876 phosphorylation of GBF1 in an in vitro phosphorylation assay. (L) SDS-PAGE analysis of the total and Y876 phosphorylation on endogenous GBF1 in HeLa cells over the duration of 50 ng/ml platelet-derived growth factor (PDGF) stimulation. (M) SDS-PAGE analysis of Y876 phosphorylation on endogenous GBF1 in A431 cells over time of 100 ng/ml EGF stimulation. Values on graphs indicate the mean ± SD. Statistical significance (p) was measured by two-tailed paired t-test. *p<0.05, **p<0.01, ***p<0.001 relative to untreated cells. NS, nonsignificant.
Figure 4—figure supplement 1
High cross-species conservation of tyrosine residues phosphorlated in GBF1.
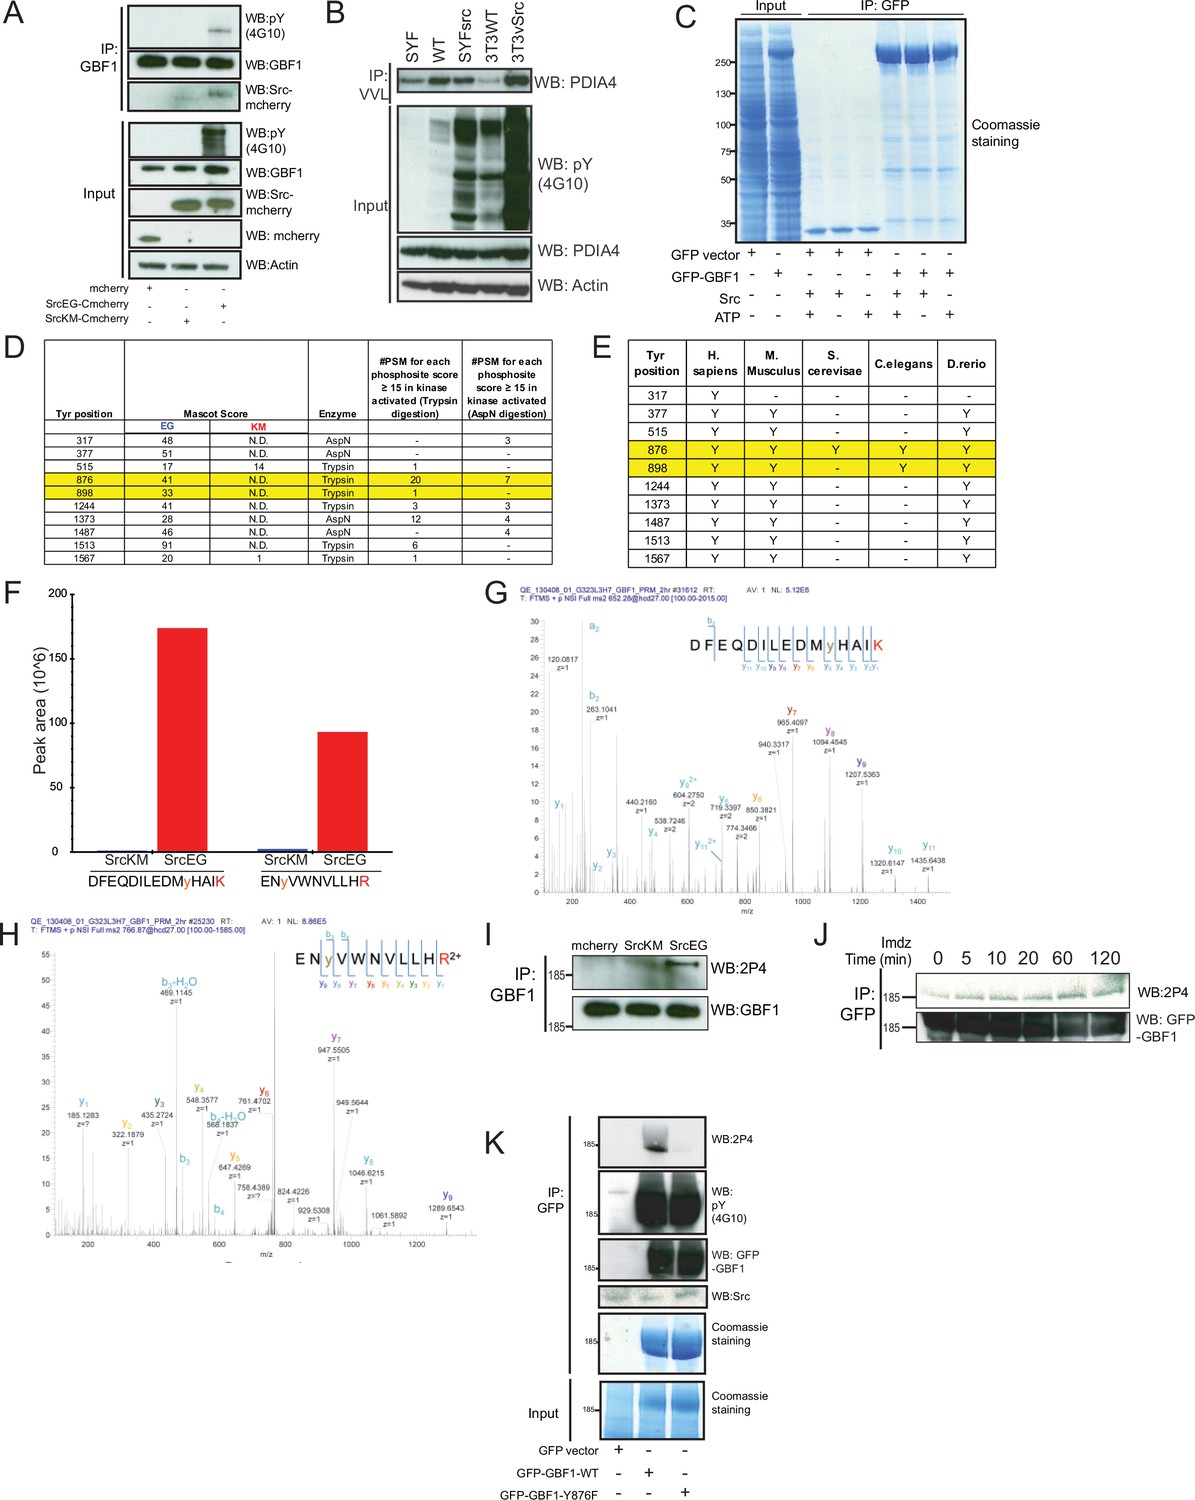
(A) SDS-PAGE analysis of Y876 phosphorylation levels in endogenous GBF1 in cells expressing empty mCherry vector, inactive SrcKM, or active SrcEG. (B) Immunoblot analysis of the levels of Tn-modified PDIA4 from Vicia villosa lectin (VVL) immunoprecipitation (IP) in mouse embryonic fibroblasts WT, SYF, and SYFsrc as well as mouse fibroblasts NIH3T3 WT and 3T3vSrc. SYF cells are knockout of Src, Yes, and Fyn while SYFsrc cells are SYF cells with stable transfection of c-Src. 3T3vsrc cells are v-Src transformed 3T3 cells. (C) Corresponding Coomassie staining of immunoprecipitated GFP and GFP-GBF1 purified from HEK293T cells that were used for in vitro Src kinase assay. The purified proteins on the beads were incubated with recombinant Src protein in the presence or absence of nucleotide ATP. (D) Table of the mascot scores and the frequencies of peptide-spectrum matches (PSM) that are more than or equal to 15 for each phosphosite on GBF1 that is coexpressed with SrcKM (KM) or SrcEG (EG). GBF1 was cleaved with either trypsin or endoproteinase AspN for analysis. (E) Table illustrating the conservation of each identified tyrosine residues that were found to be phosphorylated by Src. (F) Quantification of the peak area of the SILAC mass spectral of the peptides containing Y876 (DFEQDILEDMyHAIK) and Y898 (ENyVWNVLLHR) phosphorylation in SrcKM (blue bars) or SrcEG (red bars). (G) Mass spectra of Y876 phosphopeptide. (H) Mass spectra of Y898 phosphopeptide. (I) SDS-PAGE analysis of total pY levels on endogenous GBF1 in HeLa cells expressing empty mCherry vector, inactive SrcKM or active SrcEG. GBF1 was IP with an antibody targeting the N-terminus of the protein. (J) SDS-PAGE analysis of Y876 phosphorylation on GFP-GBF1 IP from HEK-IS cell line over various durations of imidazole treatment. (K) In vitro phosphorylation assay of GFP and GFP-GBF1 wild-type or mutant with recombinant Src protein. Total phosphorylation and phosphorylation of GBF1 at Y876 are detected by pY(4G10) and 2P4 antibodies, respectively.
Figure 5 with 3 supplements
Phosphorylation at Y876 and Y898 regulates GEF activity of GBF1.
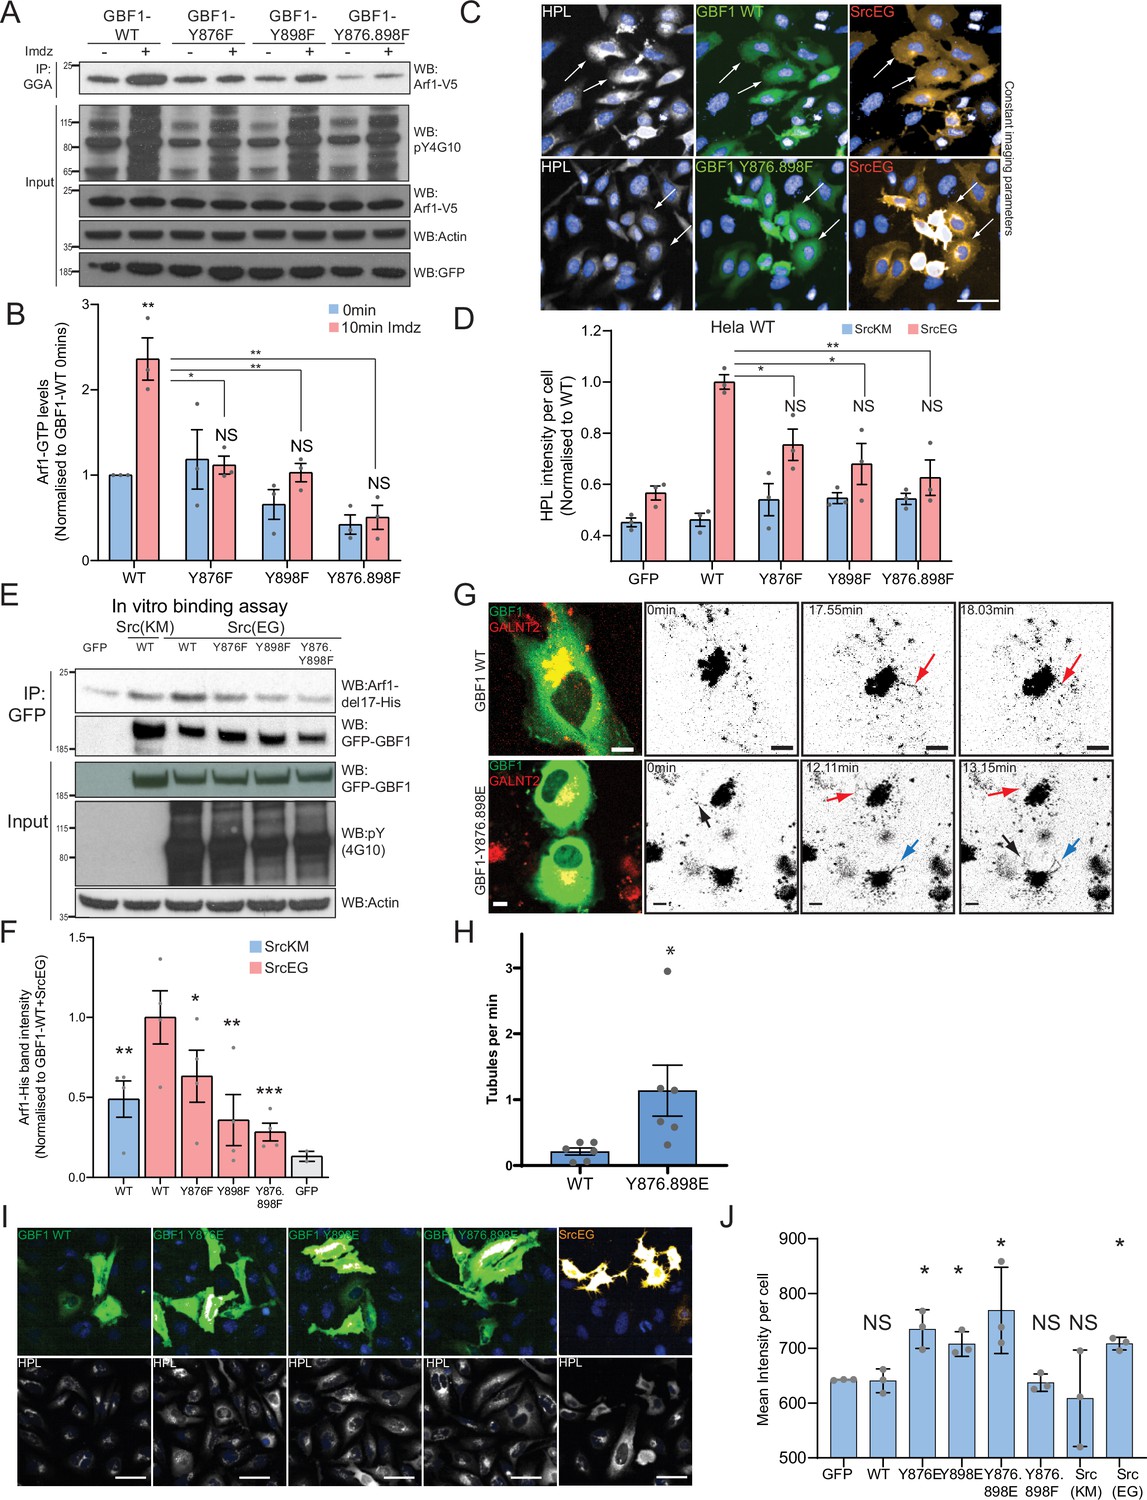
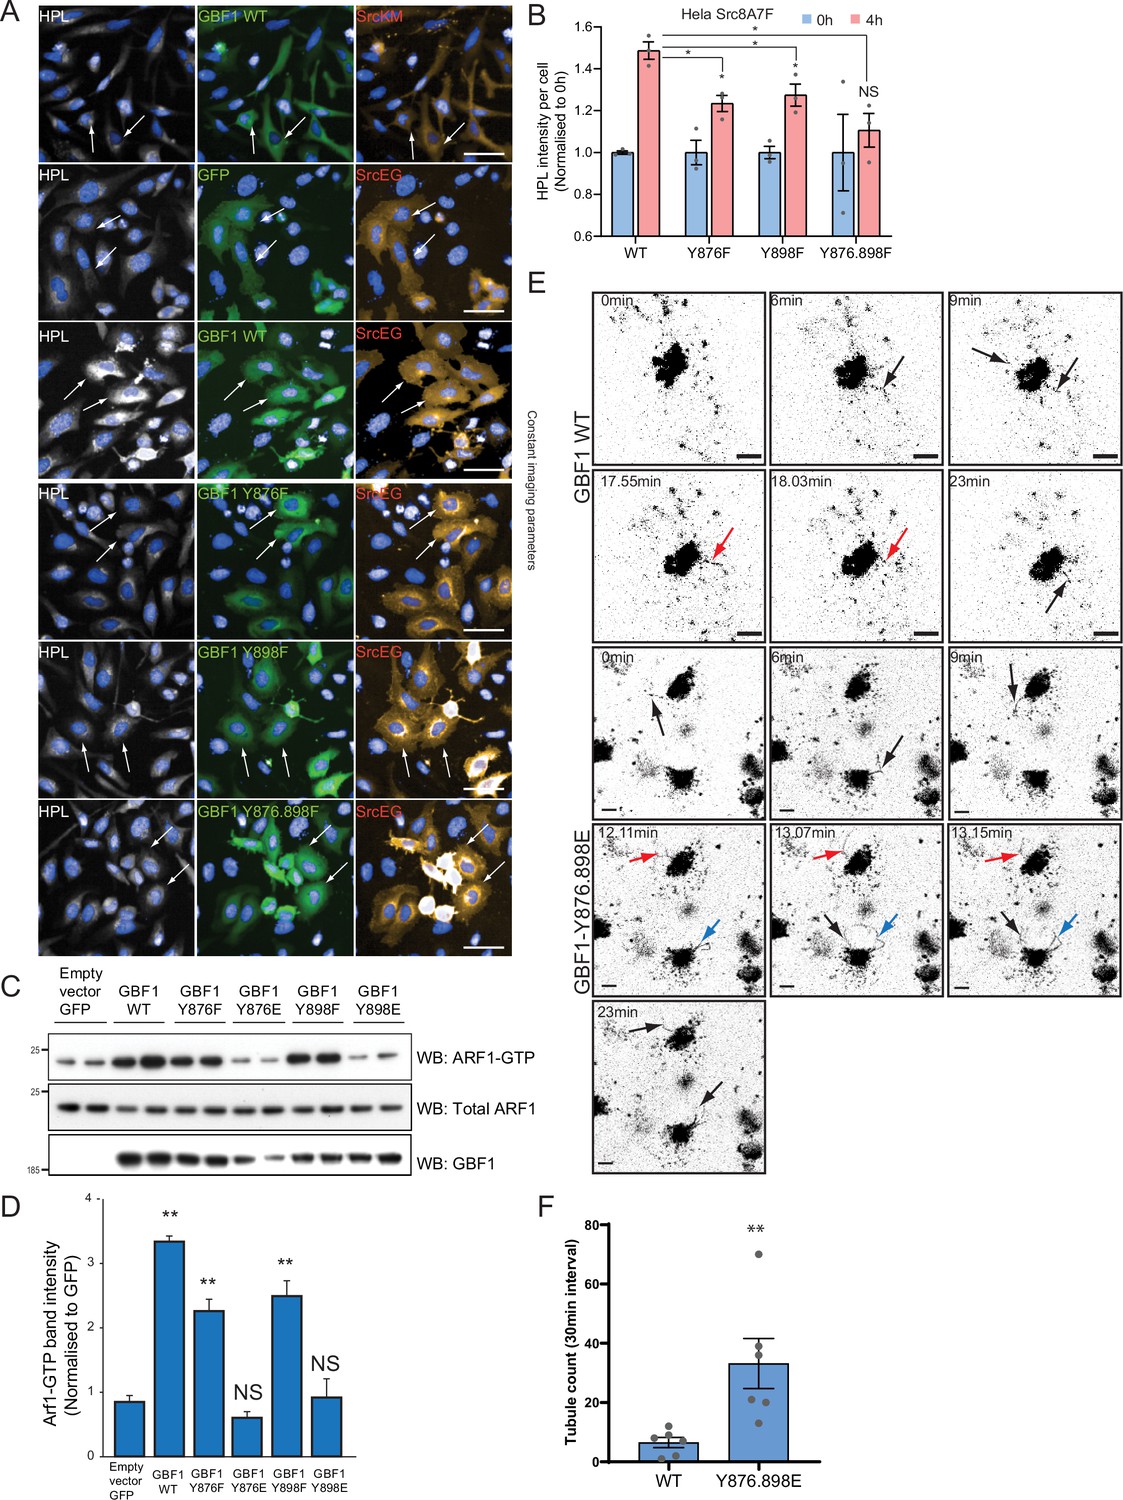
(A) SDS-PAGE analysis of GTP-loaded Arf1 at 0 min (-) and 10 min (+) imidazole treatment in HEK-IS cells expressing wild-type GBF1 and phospho-defective mutants GBF1-Y876F, GBF1-Y898F, or GBF1-Y876.898F. (B) Quantification of Arf1-GTP loading levels in (A) from three independent experiments. Values were normalized to untreated cells (-) expressing wild-type GBF1. (C) Representative images of Helix pomatia lectin (HPL) staining in HeLa cells coexpressing wild-type GBF1 or GBF1-Y876.898F mutant with active SrcEG. Scale bar: 50 μm. (D) Quantification of HPL staining levels of cells coexpressing wild-type or mutant GBF1 with inactive SrcKM (blue bars) or active SrcEG (pink bars). Values were from three replicates. (E) SDS-PAGE analysis of the levels of recombinant Arf1-His bound to wild-type or phospho-defective GBF1 mutants immunoprecipitated (IP) from cells expressing inactive SrcKM or active SrcEG in an in vitro binding assay. (F) Quantification of the levels of bound Arf1-His. Values were from four experimental replicates and normalized to wild-type GBF1 IP from cells expressing active SrcEG from each experiment. IP’ed GFP protein used as a negative control for nonspecific binding with GFP (gray bar). (G) Still images from time-lapse imaging of GALNT2-mCherry in HeLa cells that were either transfected with wild-type GBF1 (GBF1 WT) or phosphomimetic mutant (GBF1 Y876.898E). Arrows indicate tubule formation. Scale bar: 5 μm. (H) Quantification of the number of tubules per minute of acquisition. (I) Representative images of HPL staining in HeLa cells expressing phosphomimetic (Y-to-E) mutants 4 hr post transfection. (J) Quantification of HPL staining levels in (I). Values on graphs indicate the mean ± SD. Statistical significance (p) was measured by two-tailed paired t-test. *p<0.05, **p<0.01, ***p<0.001 relative to untreated cells or to 10 min imidazole (imdz)-treated cells expressing wild-type GBF1. NS, nonsignificant.
Figure 5—figure supplement 1
Phosphomimetic mutants at Y876 and Y898 recapitulate the effects of active Src.
(A) Representative images of Helix pomatia lectin (HPL) staining in HeLa cells coexpressing wild-type GBF1 or phospho-defective mutants with active SrcEG or inactive SrcKM shown in Figure 5C. Scale bar: 50 μm. (B) Quantification of HPL staining levels of HeLa-IS cells coexpressing with wild-type or phospho-defective mutant GBF1 without (blue bars) or with 4 hr imidazole (imdz) treatment (pink bars). Values were from three experimental replicates. (C) SDS-PAGE analysis of total Arf1 and GTP-loaded Arf1 in HEK293T cells expressing phospho-defective and phosphomimetic mutants of GBF1. Two experimental replicates for each condition are shown in the blot. (D) Quantification of Arf1-GTP loading in (C). (E) An extension of images from time-lapse imaging of GALNT2-mCherry in HeLa cells that were either transfected with wild-type GBF1 (GBF1 WT) or phosphomimetic mutant (GBF1 Y876.898E) shown in Figure 5G. Arrows indicate tubule formation. Scale bar: 5 μm. (F) Quantification of the number of tubules observed in the first 30 min of acquisition. Values on graphs indicate the mean ± SD. Statistical significance (p) was measured by two-tailed paired t-test. *p<0.05 and **p<0.001 relative to untreated (0 hr) or GFP-expressing cells. NS, nonsignificant.
Figure 5—video 1
Video of tubule formation in GALNT2-mCherry-expressing HeLa cells transfected with wild-type GBF1 (GBF1 WT).
Scale bar: 5 μm.
Figure 5—video 2
Video of tubule formation in GALNT2-mCherry-expressing HeLa cells transfected with phosphomimetic GBF1 mutant (GBF1 Y876.898E).
Scale bar: 5 μm.
Figure 6 with 4 supplements
Phosphorylation on Y876 increases GBF1 Sec7d affinity for Arf1.
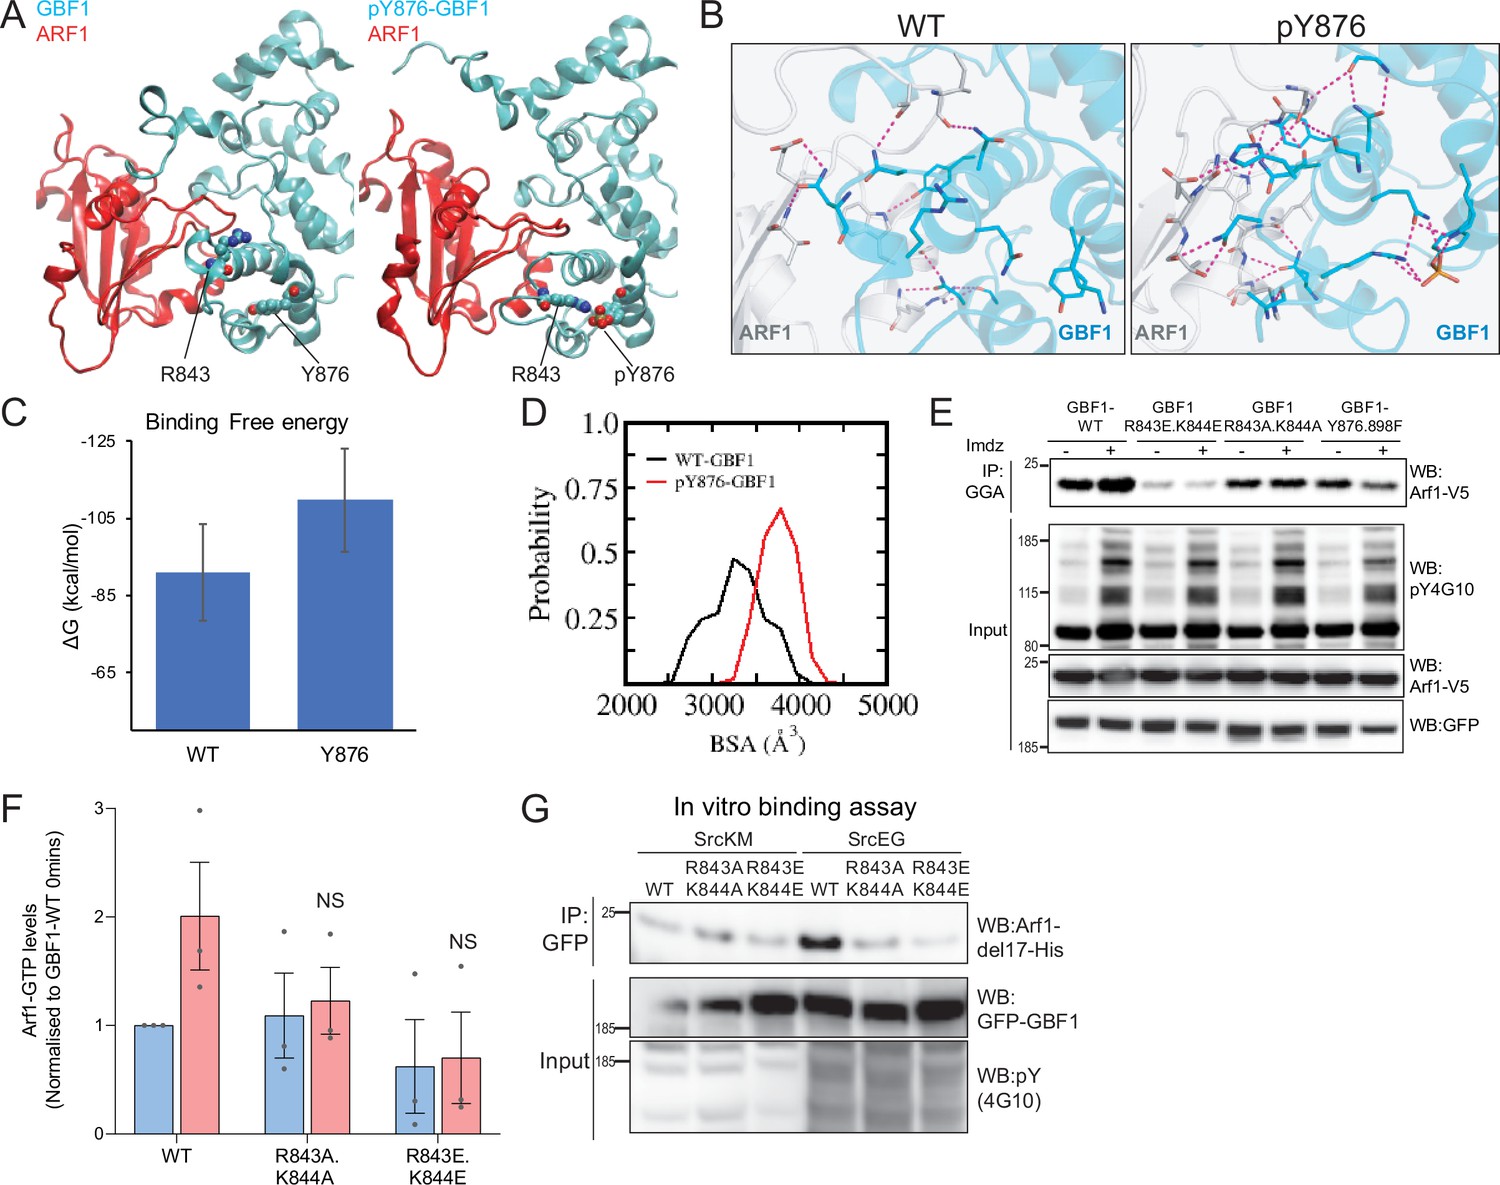
(A) Structural basis for the binding of unphosphorylated GBF1 Sec7d and Y876-phosphorylated GBF1 Sec7d with Arf1. Cartoon representations of conformations extracted from the molecular dynamics (MD) simulations of the unphosphorylated GBF1 Sec7d (left of panel A; cyan) and Y876-phosphorylated GBF1 Sec7d (right of panel A; cyan) bound to Arf1 (red color). MD suggests the unwinding of the helix H to form an extended loop between helices H and I through increased attractions between positive charges on R843 and K844 on the loop with the negative charges on phosphorylated Y876 (see Figure 6—video 2). The Sec7d of GBF1 (blue), in turn, interacts more with Arf1 (red). (B) Residues involved in GBF1:Arf1 interprotein are shown as sticks, and the H-bonds highlighted as black dashed lines. The Sec7d is shown in blue while Arf1 protein is in gray. Refer to Figure 6—figure supplement 2 for the identities of the residues. (C) Estimation of the free energies (ΔG) of the interactions between the unphosphorylated GBF1 Sec7d and Arf1 and between the Y876-phosphorylated GBF1 Sec7d and Arf1. Calculations carried out using the MMPBSA approximations averaged over the conformations generated from MD simulations of the complexes; larger negative values represent higher affinities. GBF1 Sec7d has a higher affinity for Arf1 when it is phosphorylated at Y876. (D) Probability distributions of the buried surface area (BSA) between GBF1 Sec7d and Arf1. (E) SDS-PAGE analysis of GTP-loaded Arf1 at 0 min (-) and 10 min (+) imidazole treatment in HEK-IS cells expressing wild-type GBF1, Y876.898F, and the HI loop mutants. (F) Quantification of Arf1-GTP loading levels in (E) in three experimental replicates. Values were normalized to untreated cells (-) expressing wild-type GBF1. (G) SDS-PAGE analysis of the levels of recombinant Arf1-His bound to wild-type or the HI loop mutants GFP-GBF1 immunoprecipitation (IP) from cells expressing inactive SrcKM or active SrcEG in an in vitro binding assay. Values on graphs indicate the mean ± SD. Statistical significance (p) was measured by two-tailed paired t-test. NS, nonsignificant.
Figure 6—figure supplement 1
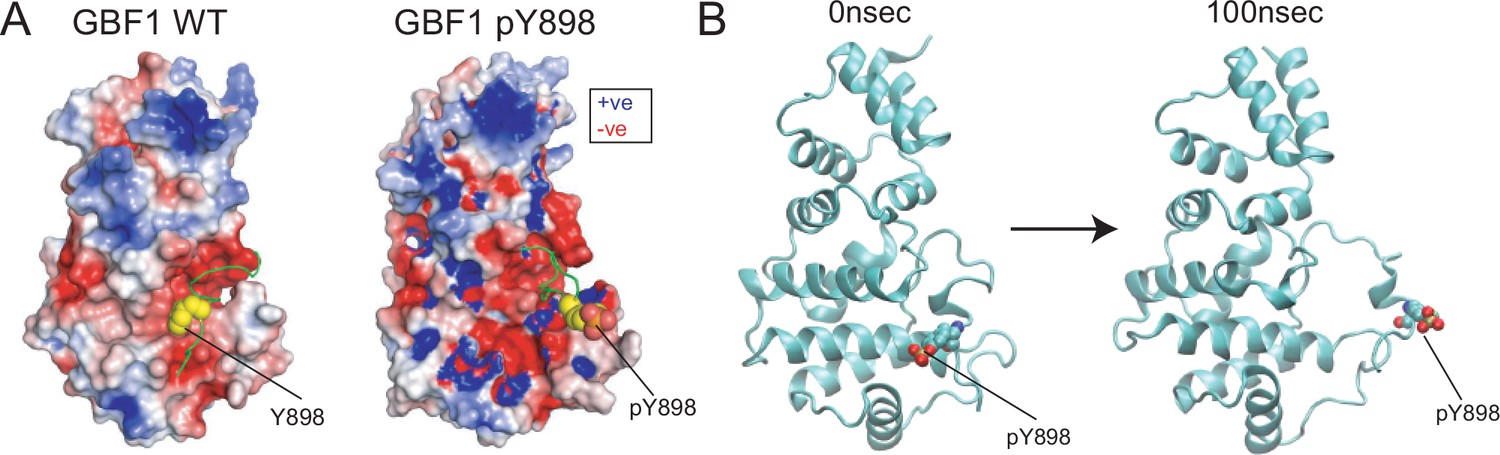
Phosphorylation at Y898 appears to release an intramolecular interaction between Sec7d and HDS1 domain.
(A) Electrostatic map of the charged residues on GBF1 Sec7d in the presence (right) and absence (left) of phosphorylation on Y898 on the C-terminal linker. (B) Molecular dynamics (MD) snapshot of the release of the C-terminal linker from the main body of the Sec7d when Y898 is phosphorylated (see Figure 6—video 1). Values on graphs indicate the mean ± SD. Statistical significance (p) was measured by two-tailed paired t-test. *p<0.05 and **p<0.001 relative to untreated cells or to 10 min imidazole (imdz)-treated cells expressing wild-type GBF1. NS, nonsignificant.
Figure 6—figure supplement 2
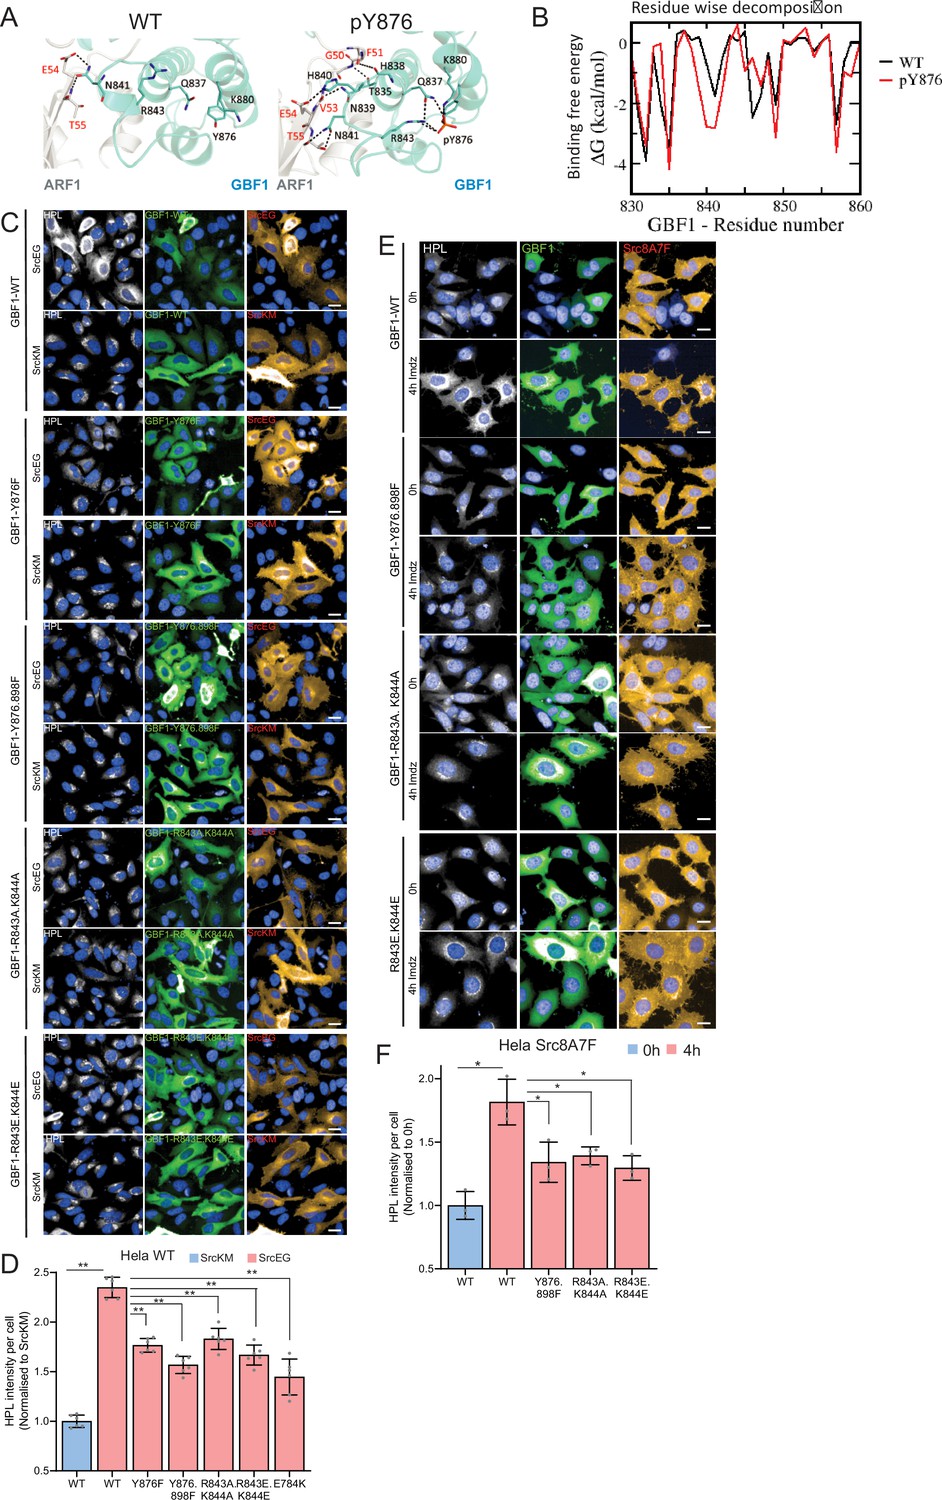
Positive-charged residues R843 and K844 are required for the Y876 phosphorylation effect.
(A) Representation of the predicted electrostatic bonds between the GBF1:Arf1 complex in the unphosphorylated (WT) and Y876-phosphorylated states. The Sec7d is shown in blue while Arf1 protein is in gray. Residues involved in interprotein interactions are shown as sticks, with interprotein H-bonds highlighted as black dashed lines. (B) Per-residue decompositions of the binding free energies of interactions between the Y876-phosphorylated GBF1 Sec7d and Arf1 and between unphosphorylated GBF1 Sec7d and Arf1 using the MMGBSA approximations averaged over the conformations generated from molecular dynamics (MD) simulations of the complexes. (C) Representative images of Helix pomatia lectin (HPL) staining in HeLa cells coexpressing wild-type or HI loop mutants with active SrcEG. Scale bar: 50 μm. (D) Quantification of HPL staining levels of cells coexpressing wild-type or mutant GBF1 with inactive SrcKM (blue bar) or active SrcEG (pink bars). Values were from six replicates from two independent experiments. (E) Representative images of HPL staining in HeLa-IS cells coexpressing wild-type or HI loop mutants. Scale bar: 50 μm. (F) Quantification of HPL staining levels of HeLa-IS cells coexpressing wild-type or mutant GBF1 that were unstimulated (0 hr, blue bar) or stimulated with 5 mM imidazole (imdz) (4 hr, pink bars). Values were from three replicates. Values on graphs indicate the mean ± SEM. Statistical significance (p) was measured by two-tailed paired t-test. *p<0.05 and **p<0.001 relative to control cells. NS, nonsignificant.
Figure 6—video 1
Molecular dynamics (MD) simulation of the Sec7d and C-terminal linker of wild-type GBF1 (GBF1-WT, left) and when Y898 is phosphorylated (GBF1-pY898, right).
Figure 6—video 2
Molecular dynamics (MD) simulation of unphosphorylated GBF1 Sec7d (GBF1-WT, left panel, cyan) and Y876-phosphorylated GBF1 Sec7d (GBF1-pY876, right panel, cyan) with Arf1 (in red).
H refers to helix H of GBF1 Sec7 domain. Positive charges on R843 are as indicated.
Figure 7
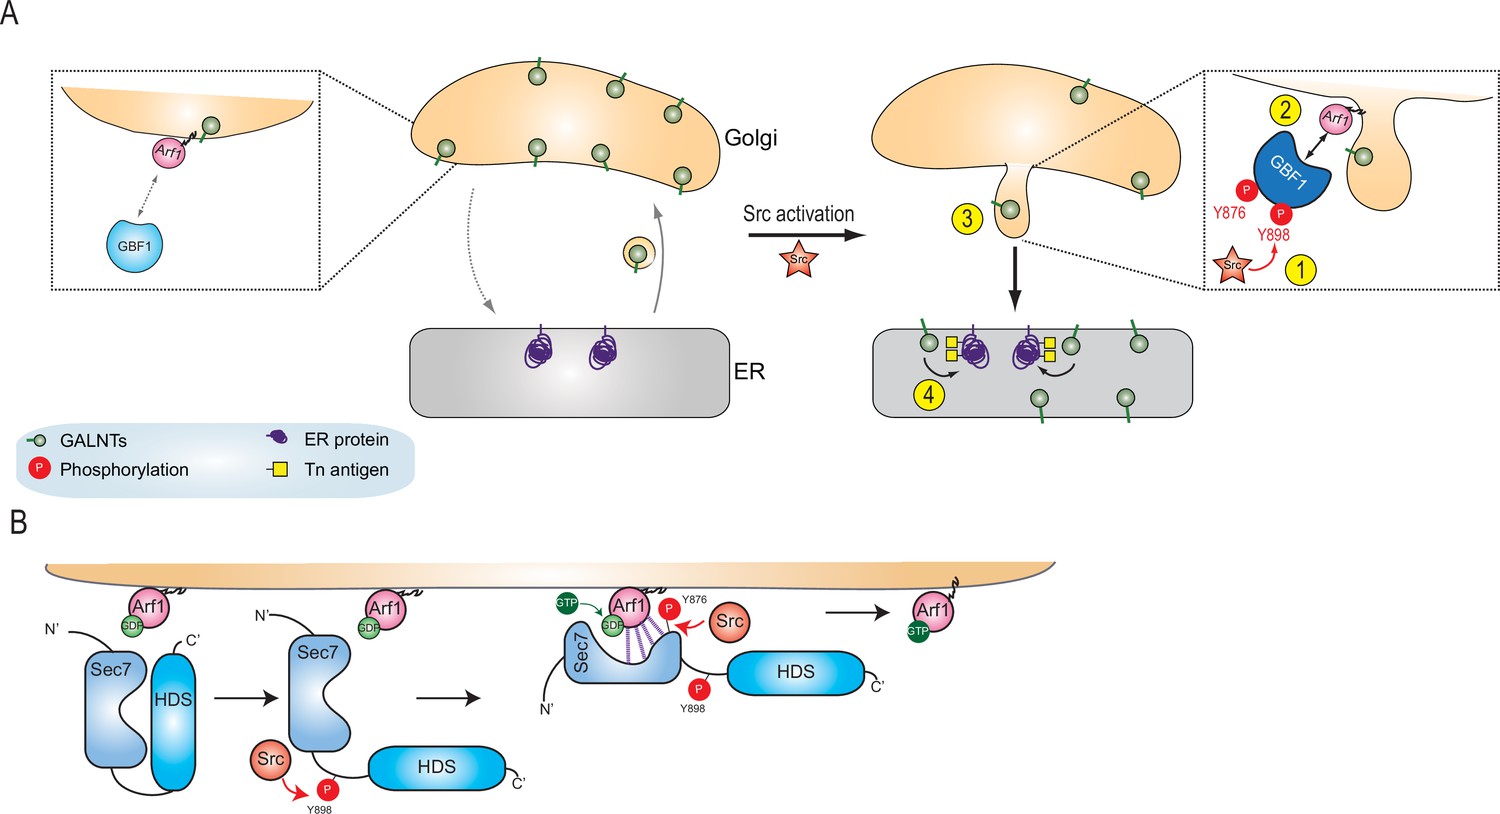
Models of GBF1 phosphorylation effects on binding to Arf1 and on the formation of tubules.
(A) In normal cells, GBF1 and Arf interaction are limited and retrograde traffic rate is moderate. Upon Src activation, GBF1 is phosphorylated on at least two tyrosines, Y876 and Y898 (step 1), which results in increased affinity for Arf-GDP on Golgi membranes (step 2). These reactions ultimately yield the formation of tubules containing GALNTs (step 3) and the enzymes’ relocation to the endoplasmic reticulum (ER) where they glycosylate resident and neo-synthesized substrates (step 4). (B) Detailed representation of GBF1 phosphorylation: we hypothesize an interaction between Sec7 and HDS1, which is released by Y898 phosphorylation. Y876 phosphorylation affects the fold of the Sec7 domain itself, apparently inducing a partial melting and favoring binding to the Arf protein. This enhanced interaction leads to increased production of Arf-GTP.
Author response image 1
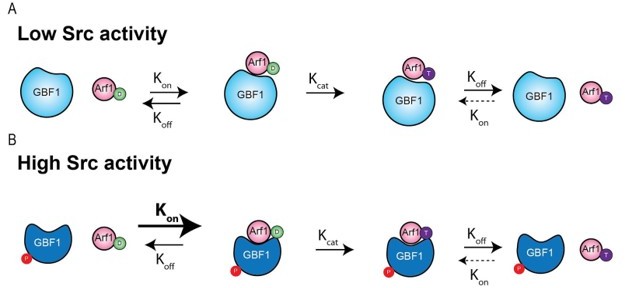
Author response image 2
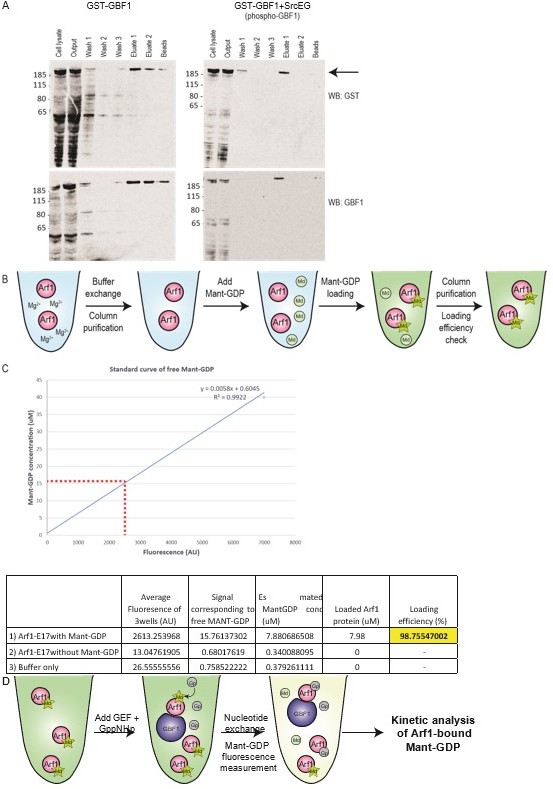
Measuring purified GBF1 GEF activity using fluorescent Mant-GDP.
(A) Purification of full length GST-GBF1 and phosphorylated GST-GBF1 (”GST-GBF1+SrcEG”) from Expi293T cells (See arrow for 206kDa protein). Cells were allowed to express the protein for 2 days before harvesting for purification. Gluthathione agarose beads was used to purify GST-GBF1 before 3 washes, followed by elution with 10mM Gluthaione in wash buffer. Full length GBF1 protein was eluted in eluate 1 and 2 with little or no contaminants. The protein was further washed and concentrated in an Amicon ultra centrifuge filter. (B) Schematic of Mant-GDP loading on Arf1-E17 protein as described in Kanie T. et al., 2018, Guanine Nucleotide Exchange Assay Using Fluorescent MANT-GDP. Bio Protoc. 2018 Apr 5; 8(7): e2795. (C) Loading efficiency of Mant-GDP on Arf1-E17 was ~99% efficient. The fluoescence levels of loaded Arf1 was calculated against a standard curve of free Mant-GDP fluoresence. (D) Schematic of Mant-GDP GEF activity assay as described in Kanie T. et al., 2018.
Author response image 3
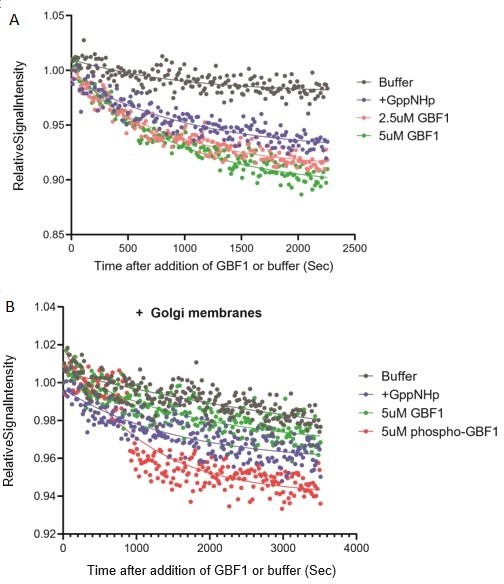
Measuring purified GBF1 GEF activity using fluorescent Mant-GDP.
(A) Arf1-Mant-GDP GEF assay with purified wildtype GBF1. The rate of Mant-GDP exchange i.e. fluorescence decline of Arf1-Mant-GDP in presence of GBF1 or in control with non-hydrolyzable GTP analog GppNHp (”+GppNHp”) were similar. (B) Arf1-Mant-GDP GEF assay in presence of purified Golgi membranes. Golgi membranes were purified from HEK293FT cells using the Minute Golgi Apparatus Enrichment Kit (Invent Biotechnologies inc). There was no difference in the rate of Mant-GDP exchange between wells containing control non-hydrolyzable GTP analog GppNHp (”+GppNHp”) buffer and purified GBF1. There is miminal difference in GDP exchange between GBF1 and phospho-GBF1. The results altogether indicate the lack of functional GEF activity in the purified GBF1 protein.
Additional files
-
Transparent reporting form
- https://cdn.elifesciences.org/articles/68678/elife-68678-transrepform1-v2.docx
-
Source data 1
Original full raw unedited gels or blots in all figures and figure supplements.
The red boxes indicate the regions of the blot presented in the figures of the article.
- https://cdn.elifesciences.org/articles/68678/elife-68678-supp1-v2.pdf
-
Source data 2
Raw quantification data and statistical tests performed in all figures and figure supplements.
- https://cdn.elifesciences.org/articles/68678/elife-68678-supp2-v2.xlsx
Download links
A two-part list of links to download the article, or parts of the article, in various formats.
Downloads (link to download the article as PDF)
Open citations (links to open the citations from this article in various online reference manager services)
Cite this article (links to download the citations from this article in formats compatible with various reference manager tools)
Src activates retrograde membrane traffic through phosphorylation of GBF1
eLife 10:e68678.
https://doi.org/10.7554/eLife.68678


