Structure of Escherichia coli respiratory complex I reconstituted into lipid nanodiscs reveals an uncoupled conformation
- Center for Structural Biology, Vlaams Instituut voor Biotechnologie, Belgium
- Structural Biology Brussels, Department of Bioengineering Sciences, Vrije Universiteit Brussel, Belgium
Figures
Figure 1 with 6 supplements
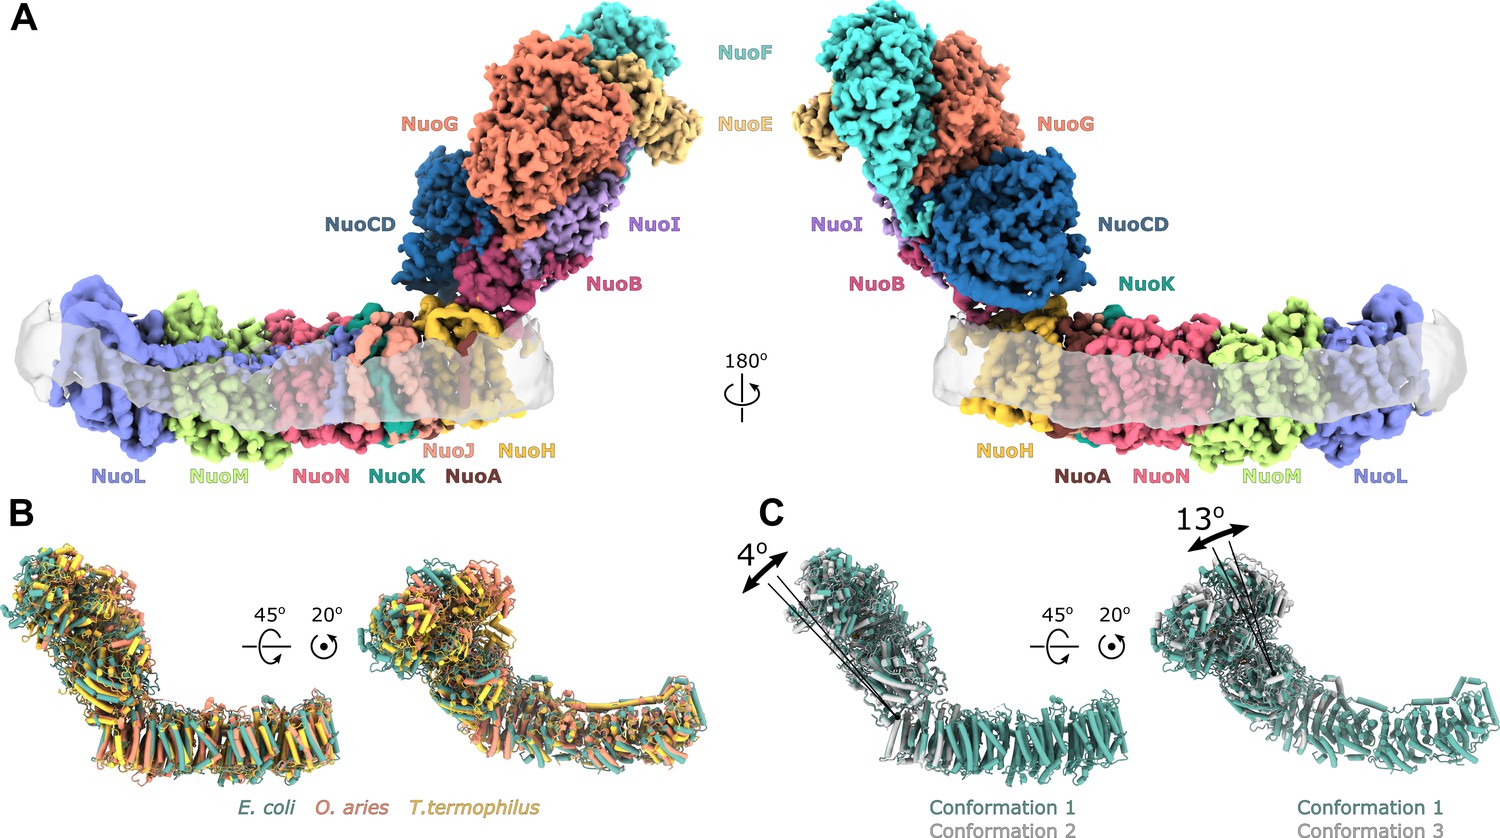
Architecture of Escherichia coli respiratory complex I.
(A) Segmented density map of the complete complex I shown together with the nanodisc density (transparent gray). (B) Comparison of the structures of the E. coli (green), Thermus thermophilus (PDB ID: 4HEA, yellow), and the core subunits of ovine (PDB ID: 6ZKD, orange) complex I. (C) Conformational differences between three conformations resolved at high resolution. The structures are aligned on the membrane arm. The rotation axes and angles are indicated.
Figure 1—figure supplement 1
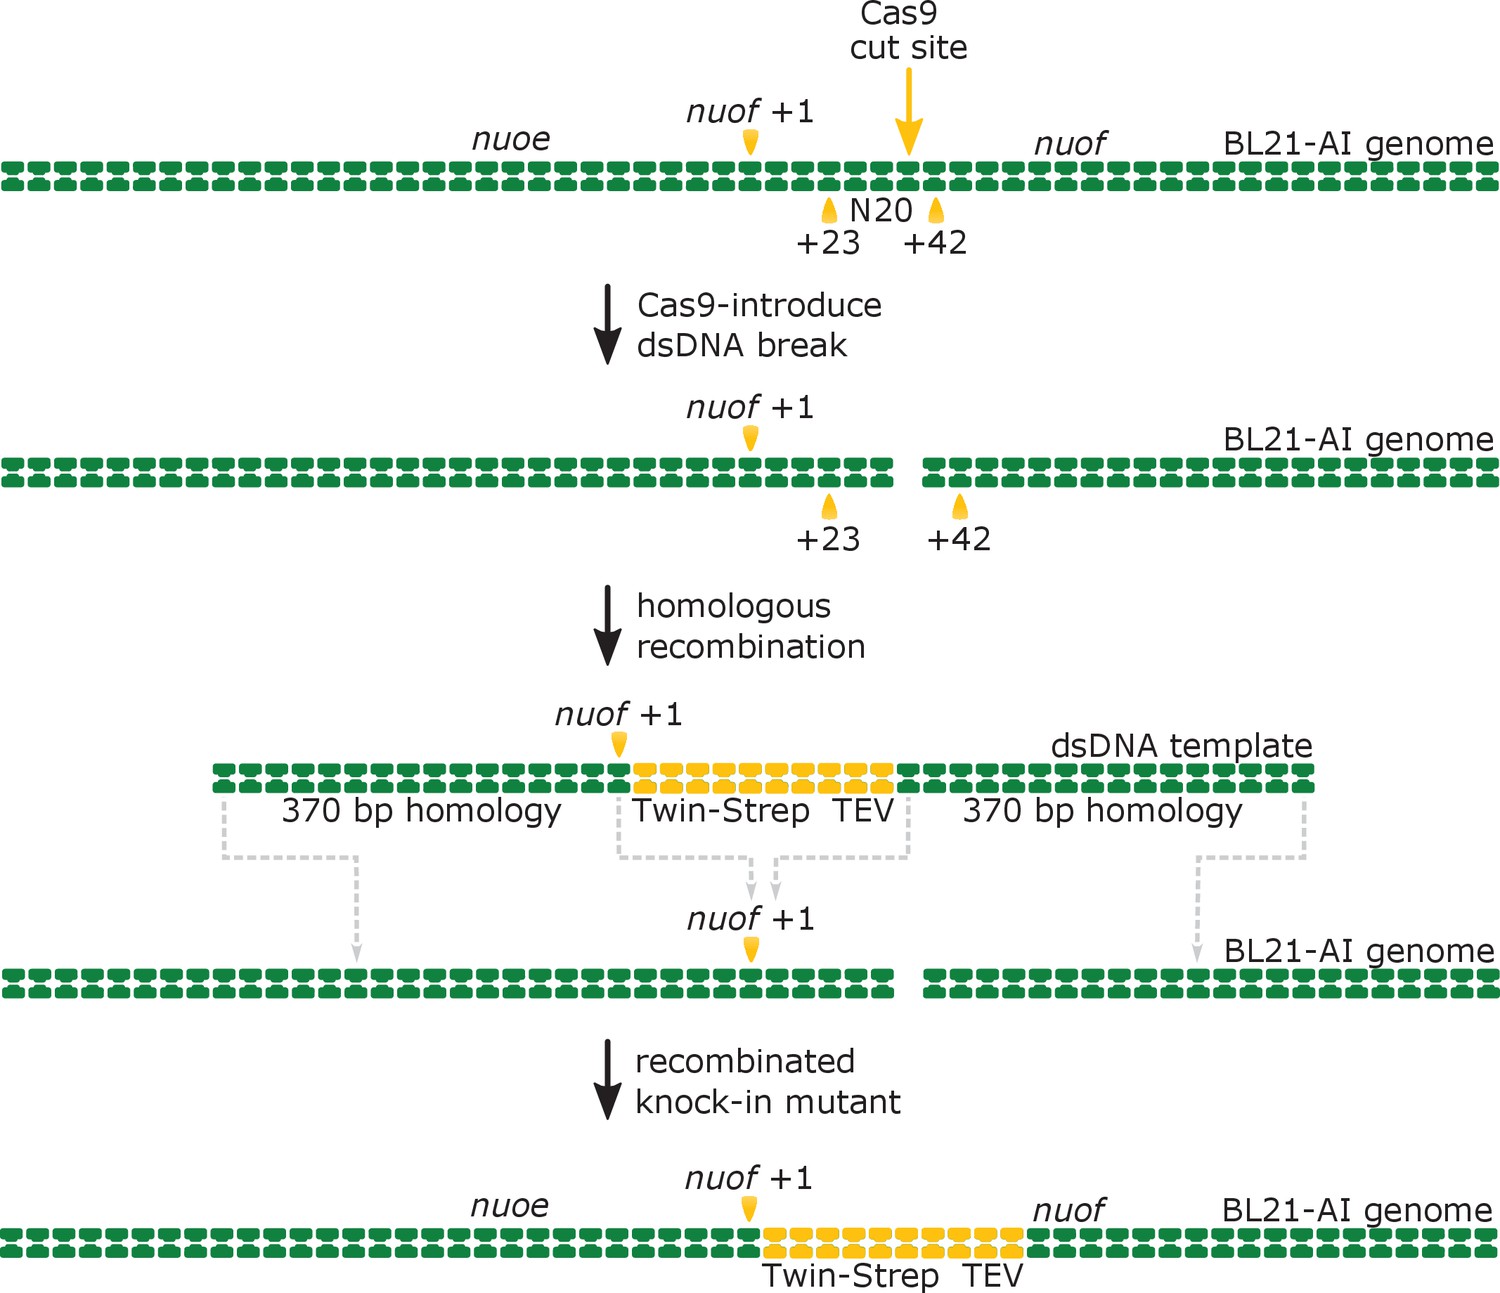
Schematic representation of Crispr-Cas9-enabled incorporation of the twin-strep tag into the N-terminus of the genomically encoded NuoF subunit.
The Cas9 enzyme introduces a double-stranded DNA (dsDNA) break into the nuof locus within the E. coli BL21-AI genome at the 20-nucleotide target sequence (N20), located 23 base-pairs (bp) downstream of the nuof +1 site. Subsequently, the λ-Red mediated homologous DNA recombination incorporates the supplied dsDNA template comprising the knock-in cassette flanked by 370 bp long homologous regions into the genome. The recombination results in insertion of sequences coding for the Twin-Strep tag and TEV protease recognition site right after the nuof transcription start site.
Figure 1—figure supplement 2
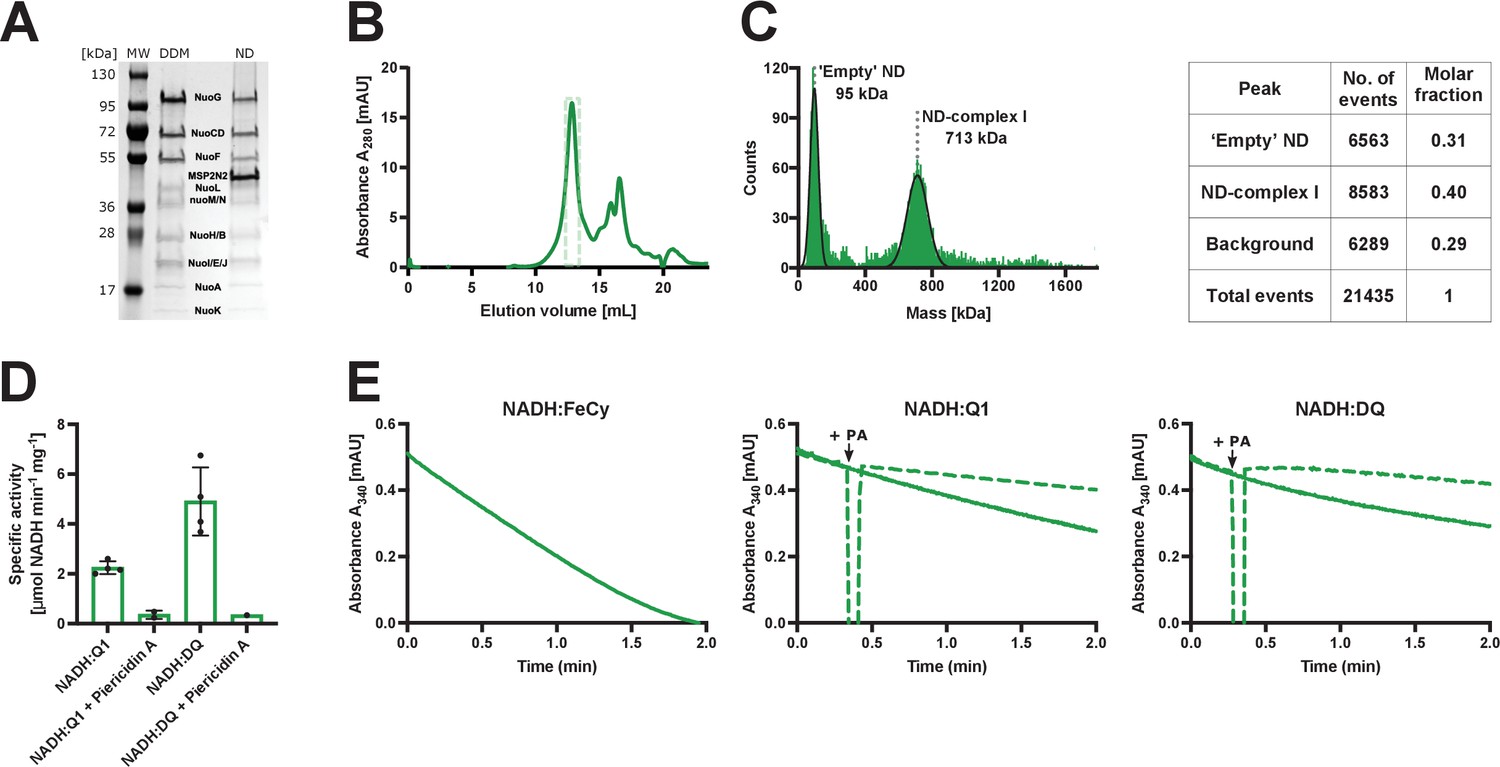
Purification and biochemical characterization of E.coli complex I reconstituted into lipid nanodiscs.
(A) SDS-PAGE depicting the sample solubilized in detergent after affinity chromatography (DDM) and the sample reconstituted into lipid nanodiscs after size-exclusion chromatography (ND). (B) Size-exclusion chromatography profile after complex I reconstitution into lipid nanodiscs. The main peak at 13 mL consists mostly of the intact reconstituted complex I. Fractions marked by the green, dashed rectangle were pooled, concentrated, and used for cryo-EM and activity assays. The second peak (retention volume 15 mL and higher) contains empty nanodiscs and the dissociated peripheral arm. (C) Mass photometry of the reconstituted complex I pooled form the main gel filtration peak. Left: a representative mass histogram showing two main peaks: ‘Empty’ nanodiscs at 95 kDa that co-elutes with complex I during size-exclusion chromatography and the nanodisc-reconstituted complex I at 713 kDa. (D) Values of Vmax for the spectrophotometric activity assays: NADH:Q1 (2.2±0.2 µmol NADH min−1 mg−1), NADH:Q1 inhibited with 20 µM piericidin A (0.4±0.1 µmol NADH min−1 mg−1), NADH:DQ (5±1 µmol NADH min−1 mg−1) and NADH:DQ inhibited with piericidin A (0.3 µmol NADH min−1 mg−1). The NADH:FeCy Vmax is not shown (117±7 µmol NADH min−1 mg−1). The graph shows mean ± SD. Results of individual measurement are shown by dots. (E) Representative traces of the NADH:FeCy (left), NADH:Q1 (middle, solid line), and NADH:DQ (right, solid line) activities. The NADH:Q1 and NADH:DQ inhibition assays are shown as dashed lines. Piericidin A addition point is marked as ‘+PA’. The concentration of complex I was 10 times lower for NADH:FeCy compared to that of NADH:Q1 and NADH:DQ assays.
Figure 1—figure supplement 3
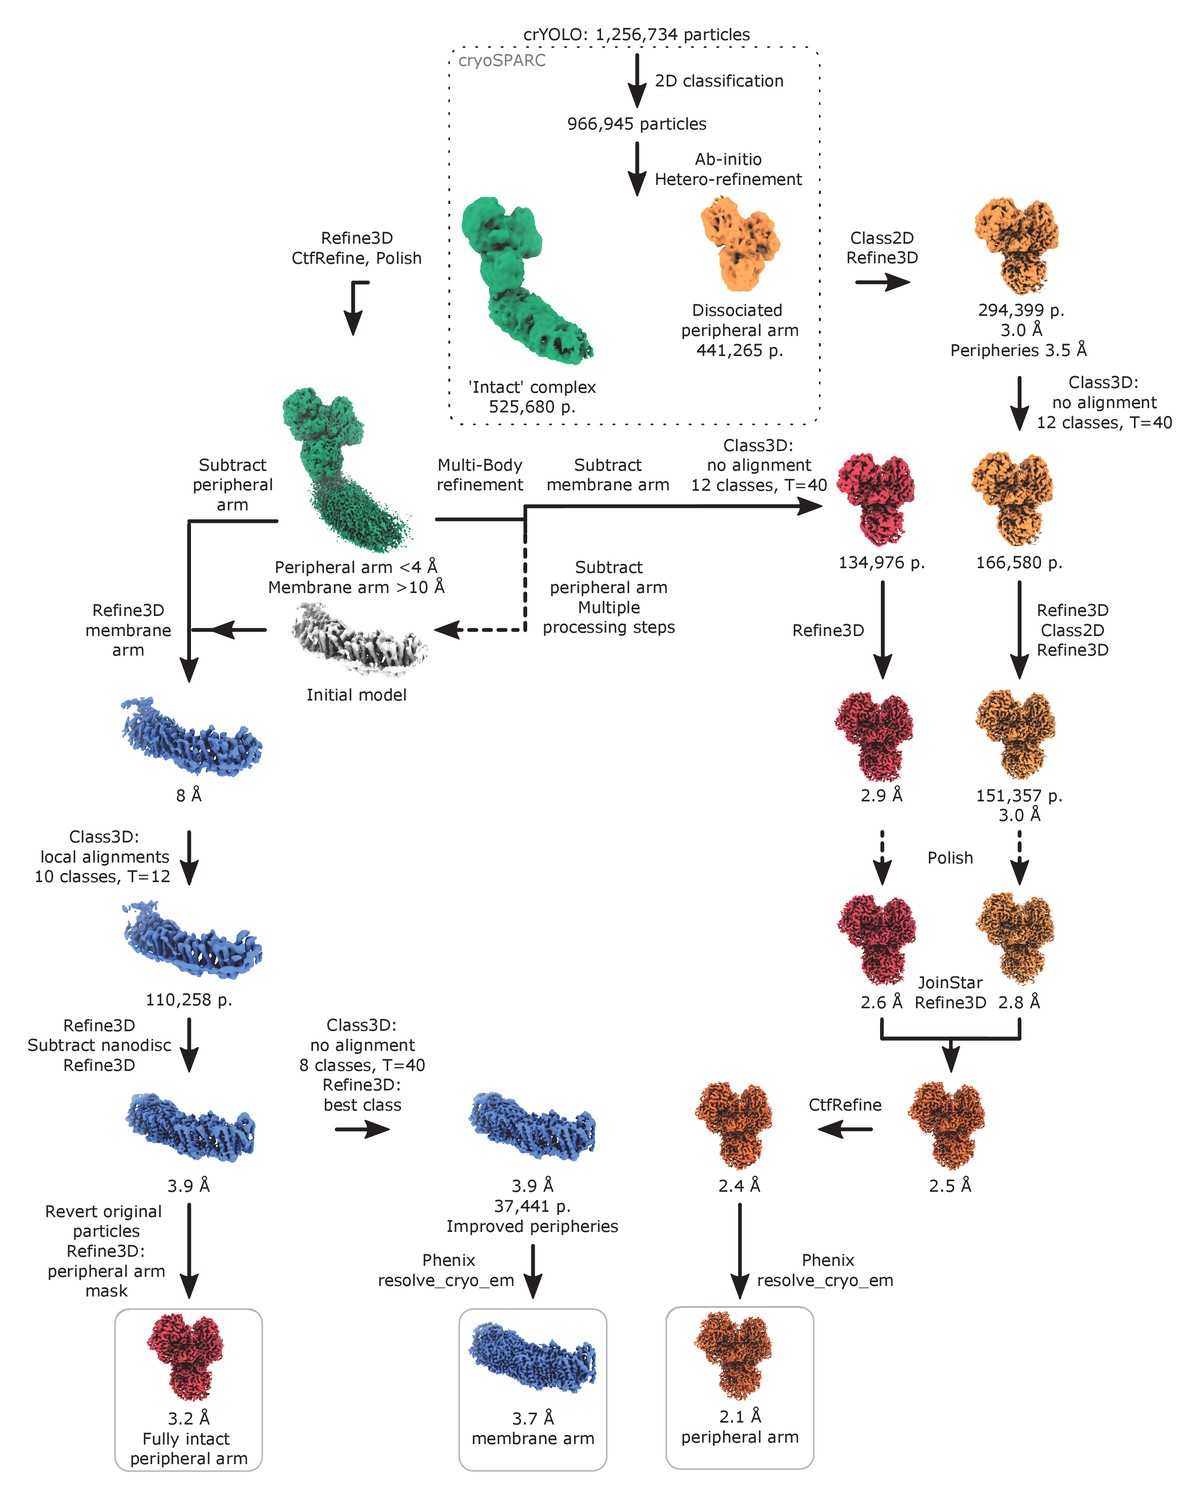
Image processing diagram of the complex I in lipid nanodiscs.
The scheme indicates the principal steps during image processing that resulted in reconstructions of the peripheral and membrane arms.
Figure 1—figure supplement 4
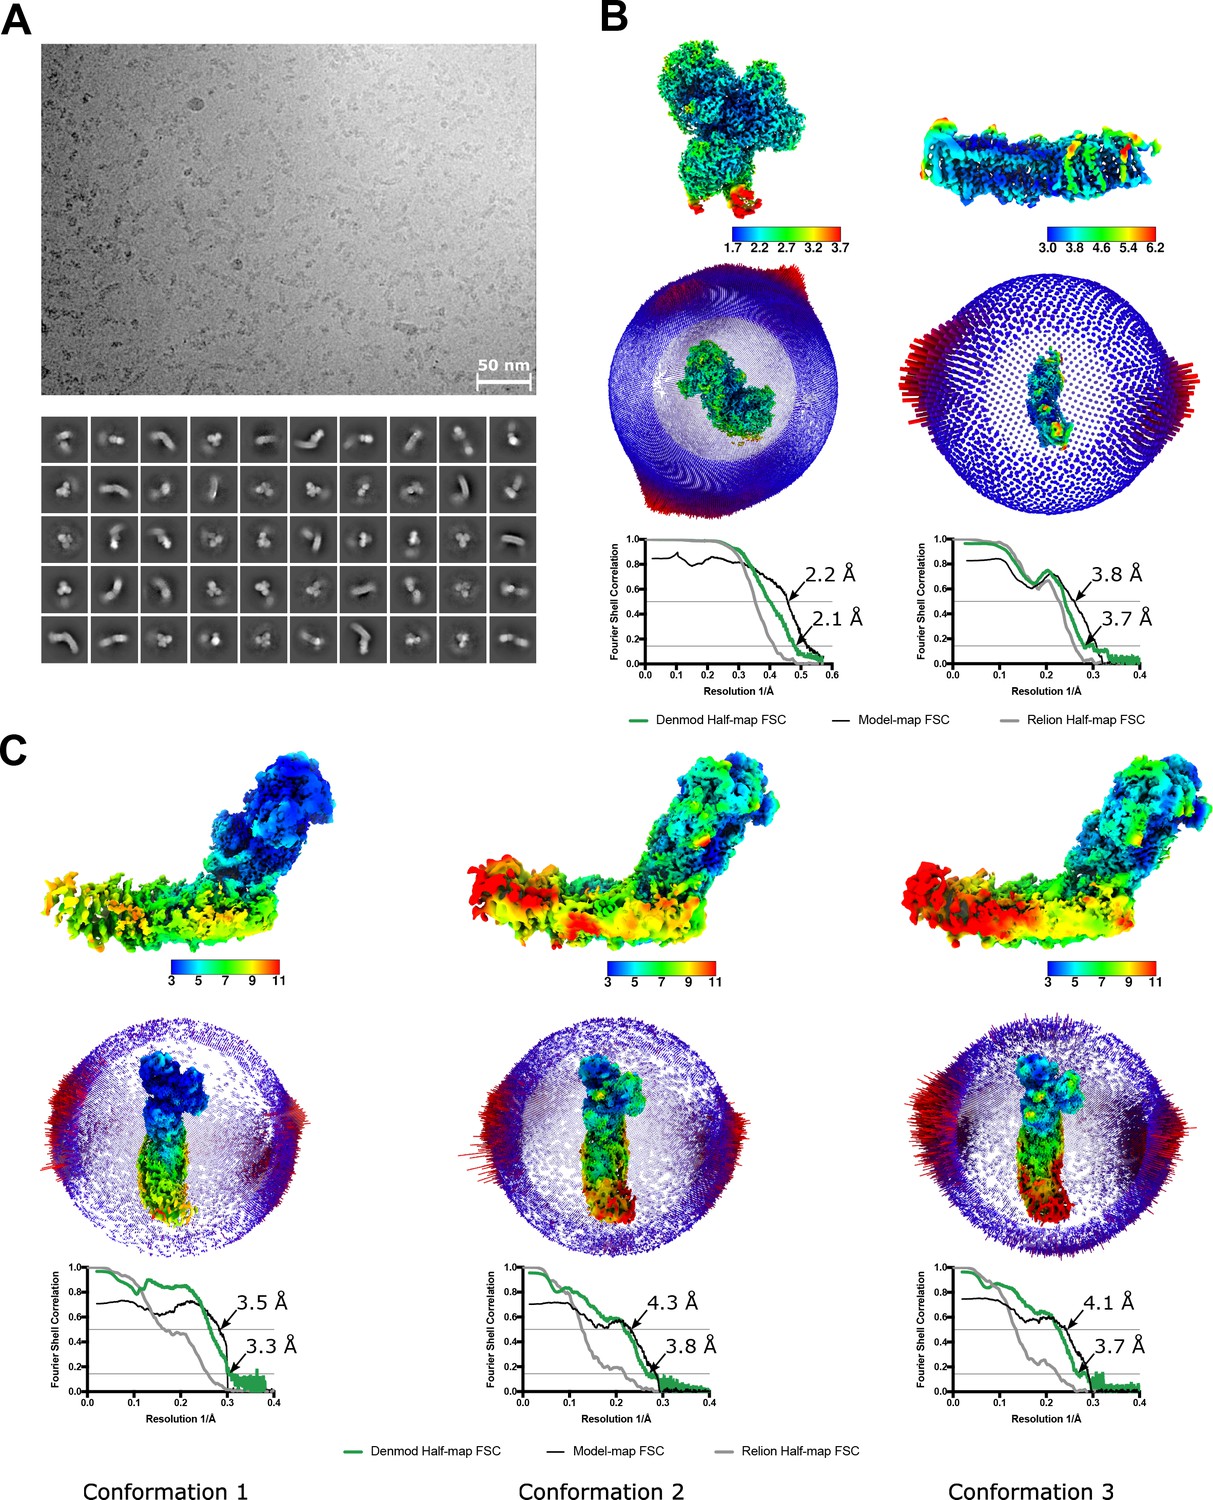
Properties of the nanodisc-reconstituted cryo-EM sample and the final reconstructions.
(A) A representative micrograph (top) and 2D classes of the entire complex I (bottom). (B,C) Local resolution maps, angular distribution, and FSC plots for the peripheral (B, left) membrane arm (B, right) and for the three conformations of the intact complex I (C). FSC curves are shown for the RELION half-maps, density-modified half maps as well as between models and density-modified maps.
Figure 1—figure supplement 5
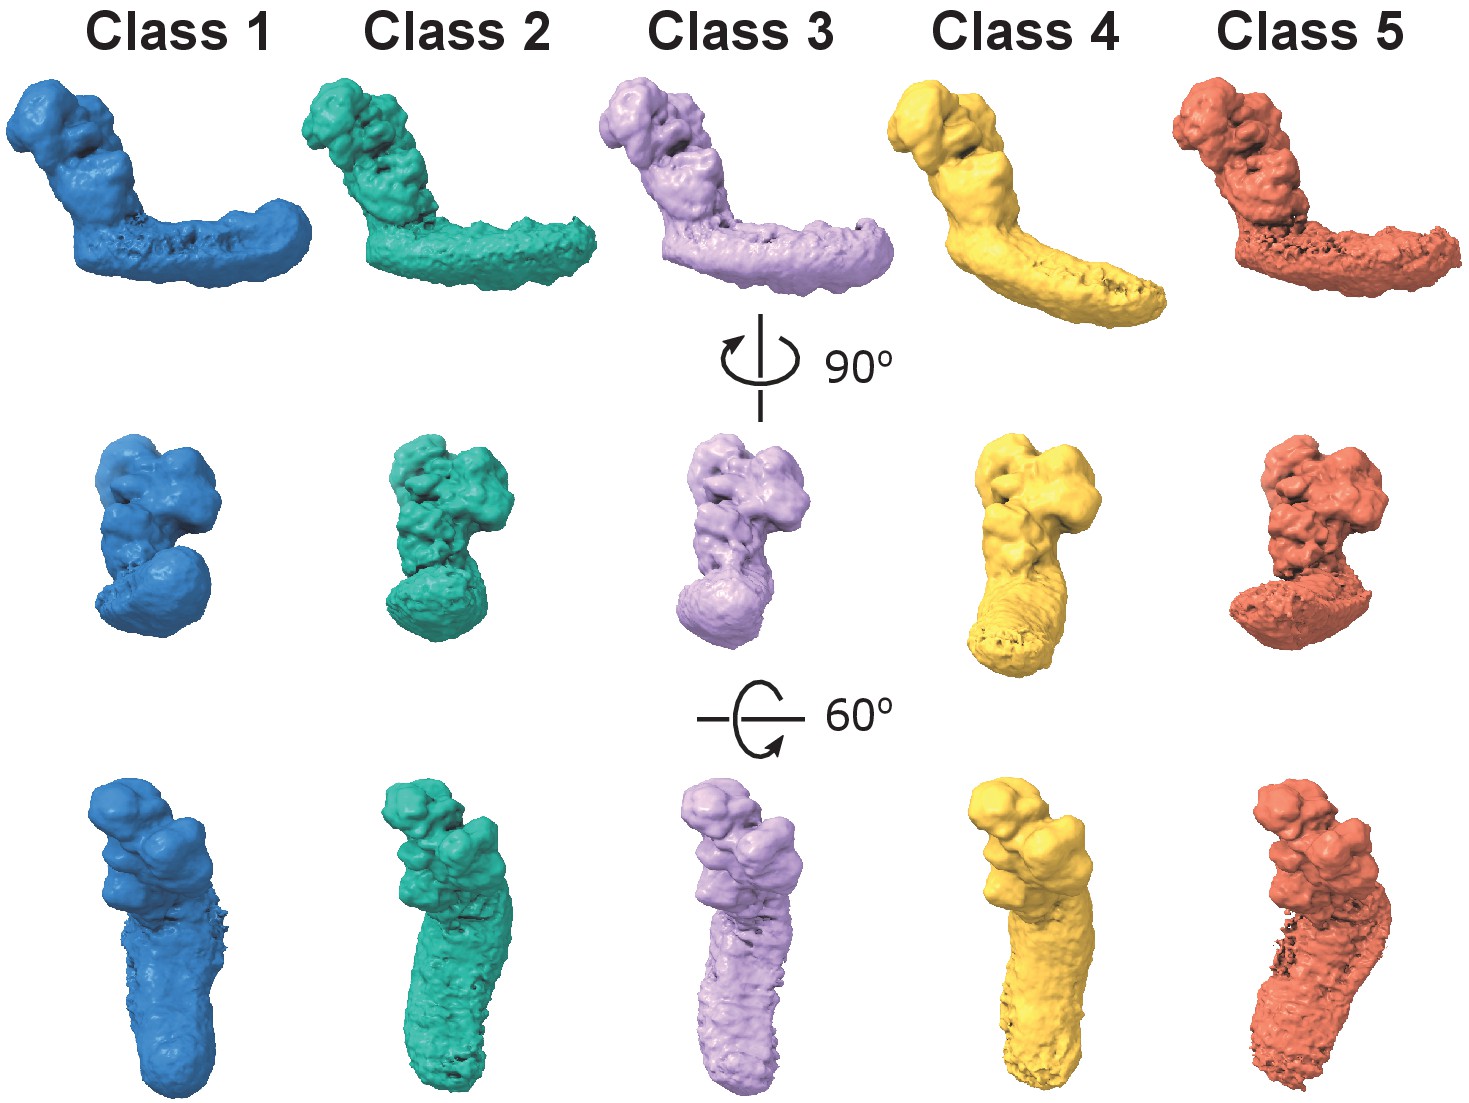
Dynamic connection between peripheral and membrane arms.
Representative 3D classes show flexibility between the arms in the E. coli complex. The conformations were obtained by 3D classification of all intact complex I particles aligned to the peripheral arm.
Figure 1—figure supplement 6
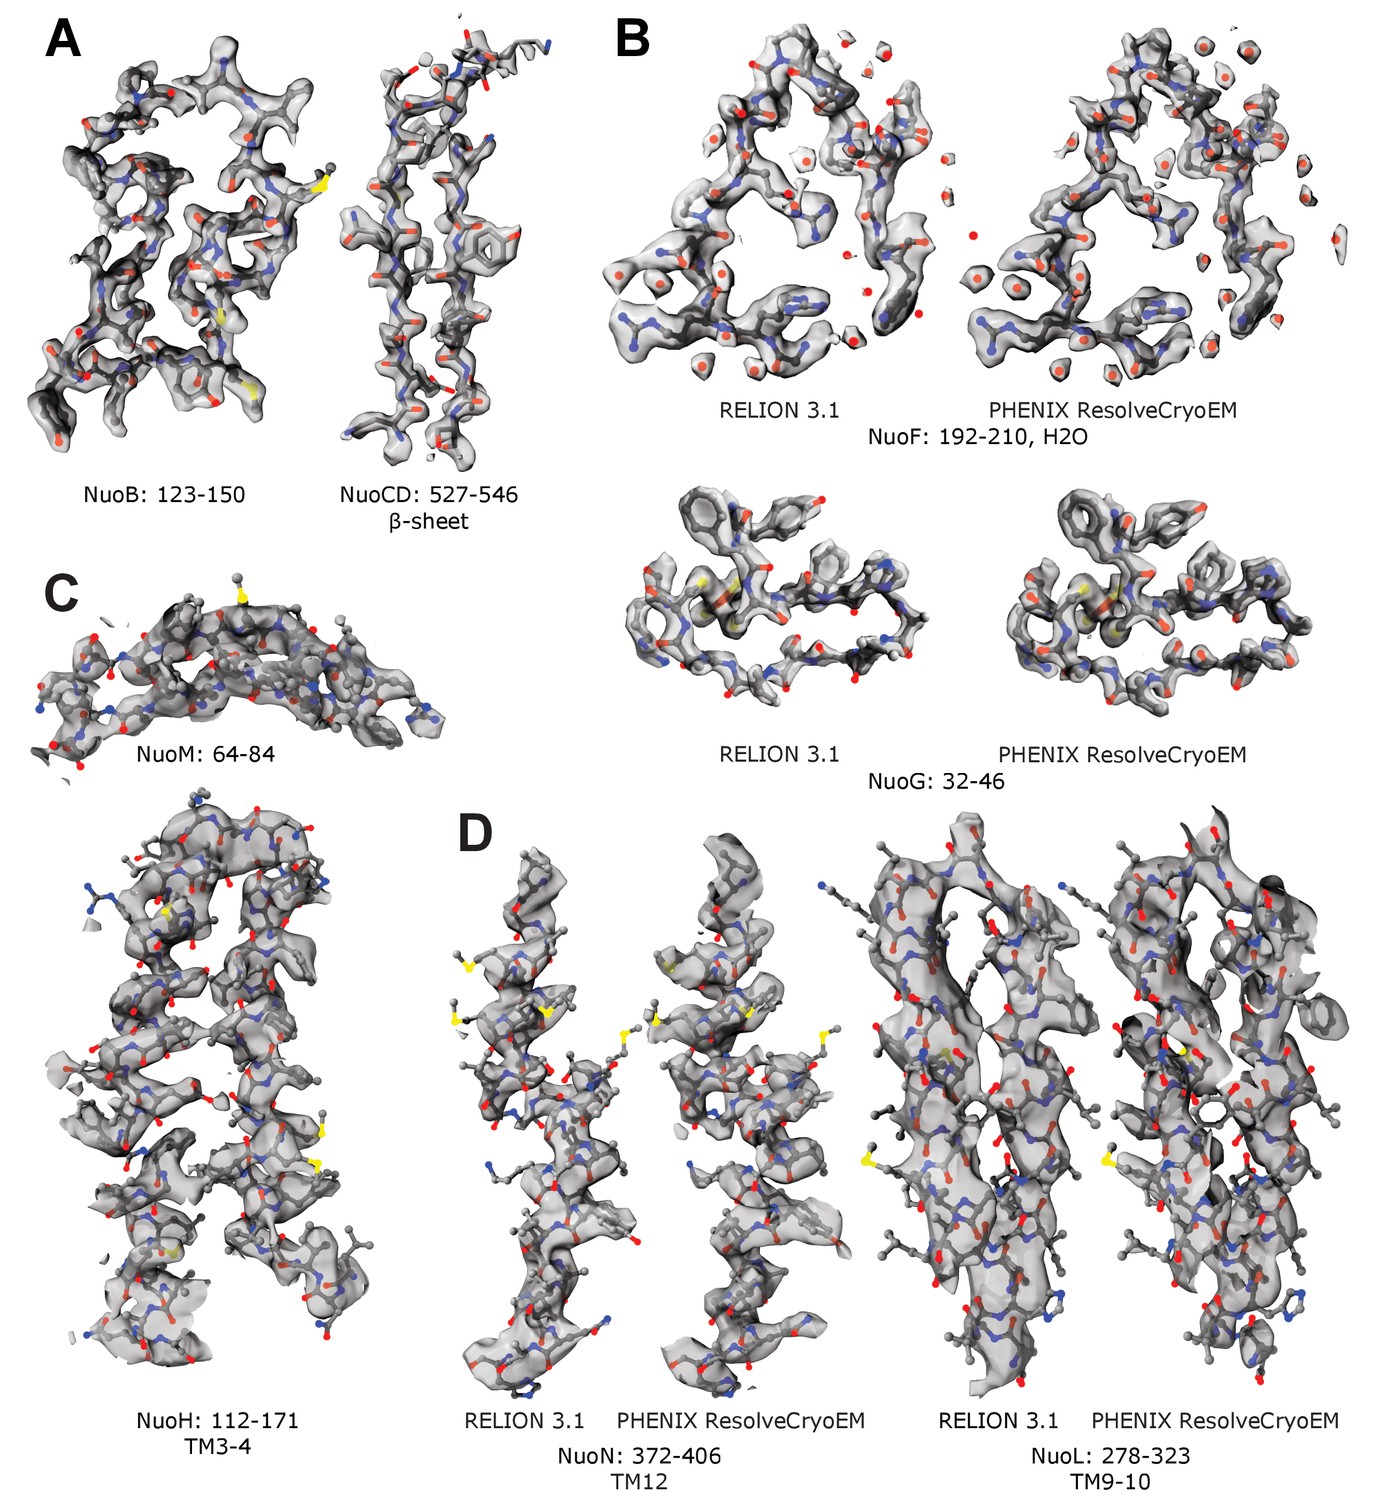
Representative cryo-EM density maps.
Examples of the density maps for reconstructions of (A,B) peripheral and (C,D) membrane arm. Panels A and C show density-modified (denmod) volumes. Panels B and D compare the denmod maps (PHENIX ResolveCryoEM) with maps locally sharpened in RELION 3.1.
Figure 2 with 1 supplement
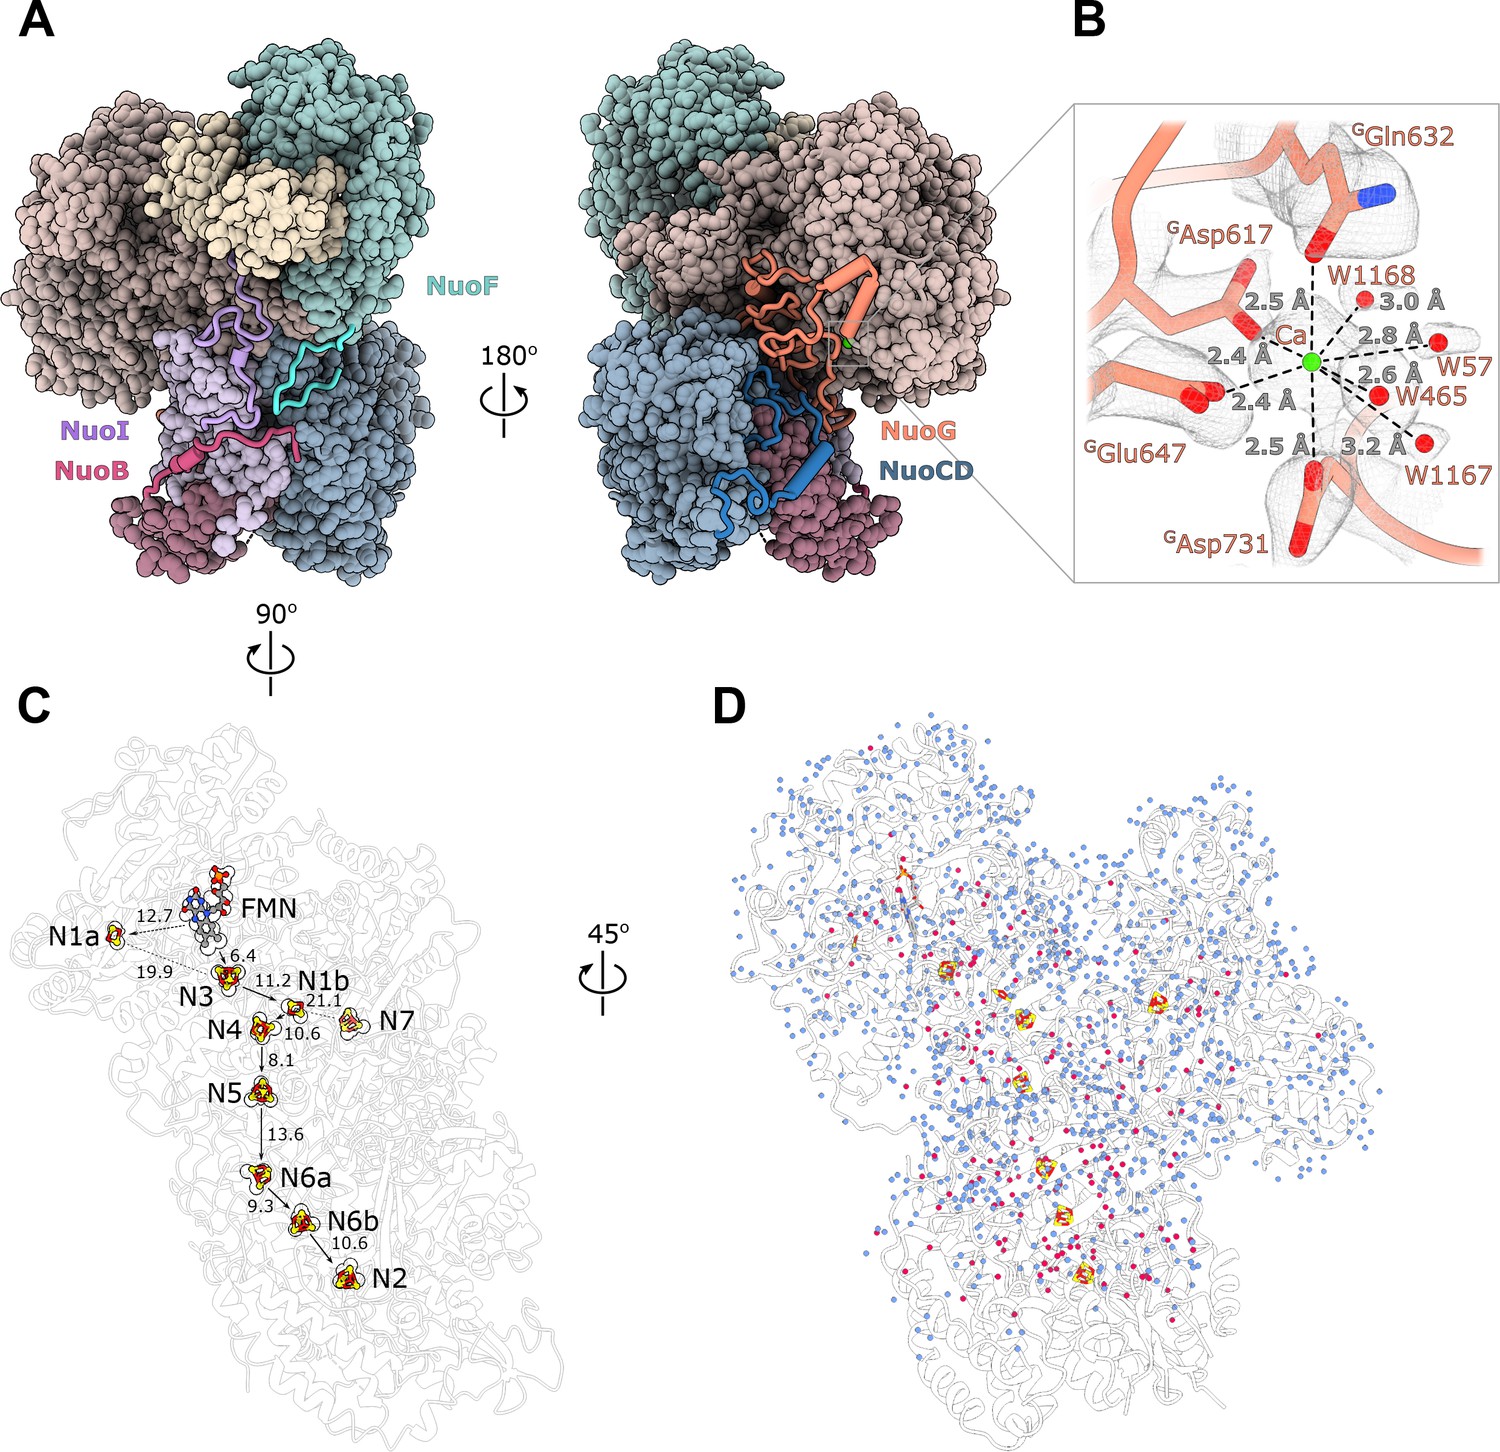
Structure of the peripheral arm.
(A) The Escherichia coli - specific extensions in the peripheral arm subunits: C-termini of NuoI (violet), NuoB (pink), NuoF (turquoise), NuoG insertion (orange), and NuoCD linker (blue). (B) Structural details of the calcium-binding site. (C) Comparison of the FMN and Fe-S clusters positions in E. coli (shown as atoms) and Thermus thermophilus (shown as outline around E. coli atoms). Edge-to-edge distances and the electron pathway are indicated. (D) Water molecules modeled into the 2.1 Å resolution density map of the peripheral arm are show in blue. Water molecules conserved with the peripheral arm of ovine complex I (PDB ID: 6ZK9, red) are shown as red spheres. FMN and iron-sulfur (Fe-S) clusters are shown as spheres.
Figure 2—figure supplement 1
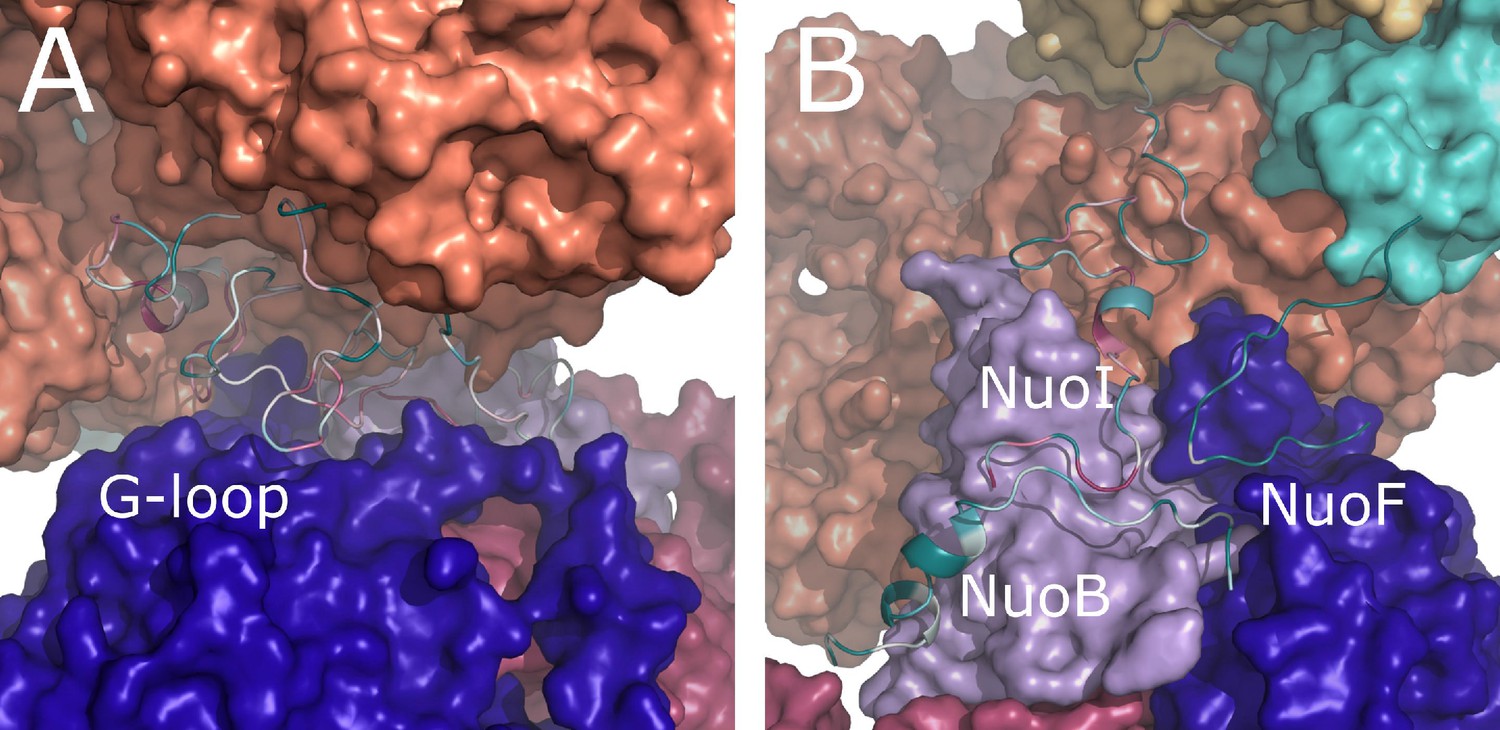
Conservation of E. coli-specific tails in the peripheral arm subunits.
(A) Insertion into subunit NuoG, the G-loop. (B) C-terminal tails in subunits NuoF, NuoI and NuoB. Color coding of the subunits is the same as in Figure 1. Conservation was calculated using ConSurf server and is color coded from green to white to purple as the degree of conservation increases.
Figure 3 with 1 supplement
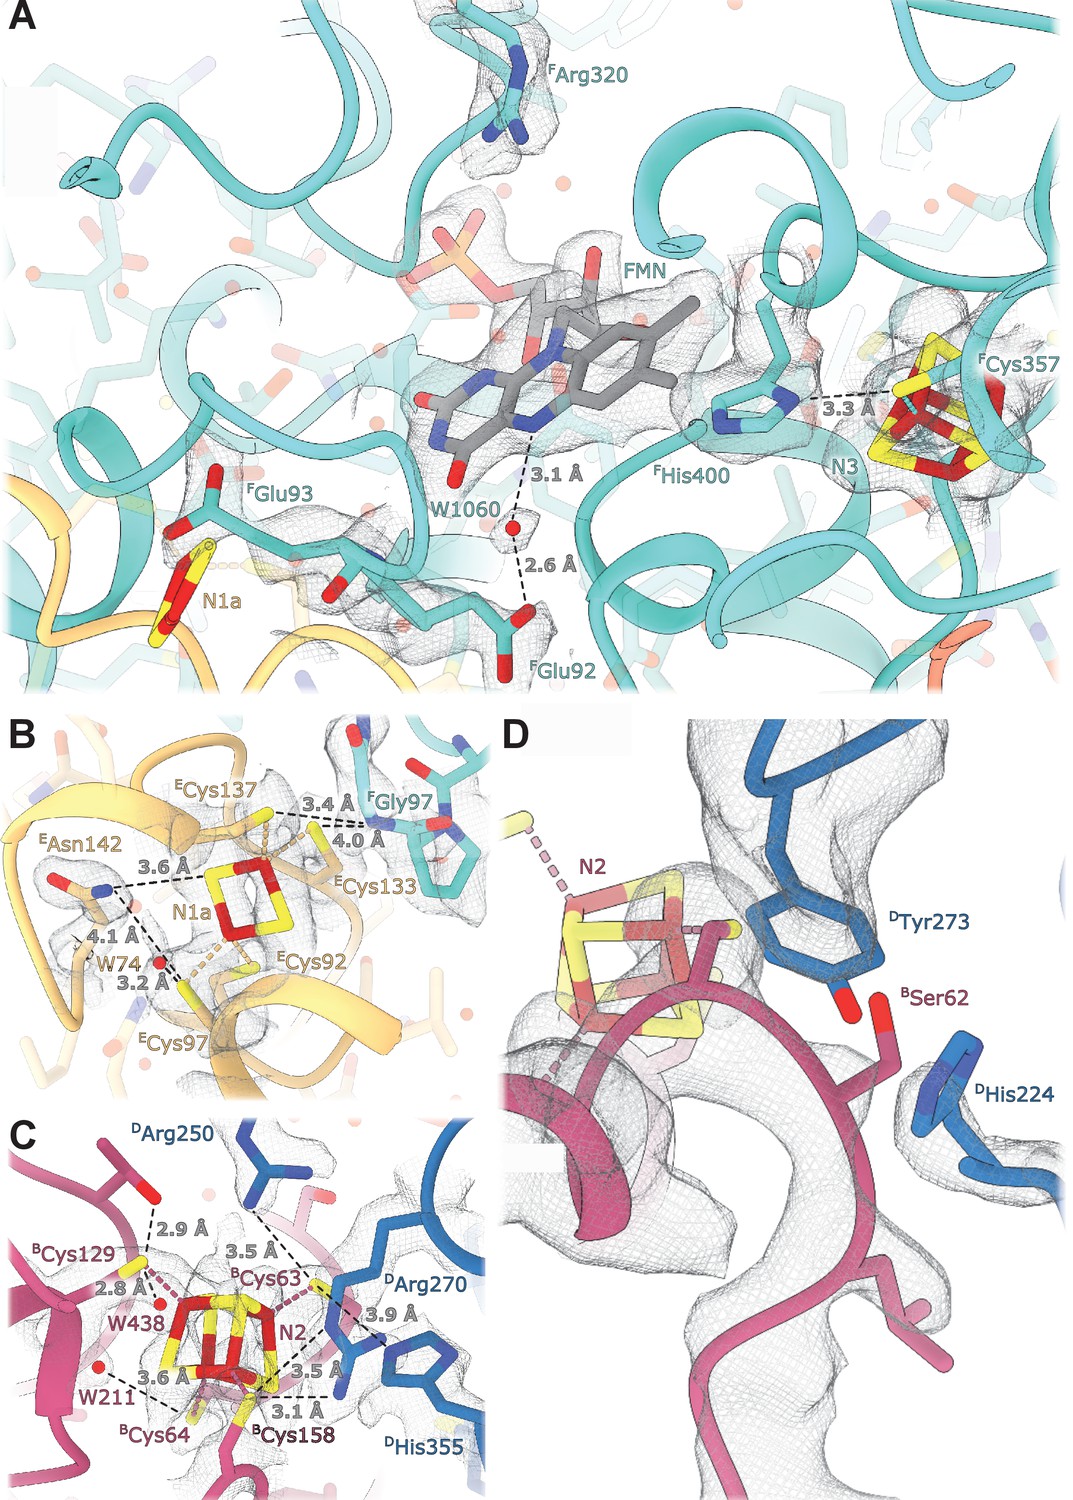
Details of the electron transport chain.
(A) The NADH-binding pocket and environment of the Fe-S cluster N3. (B, C) Environment of the Fe-S clusters N1a and N2. (D) The ubiquinone binding-site.
Figure 3—figure supplement 1
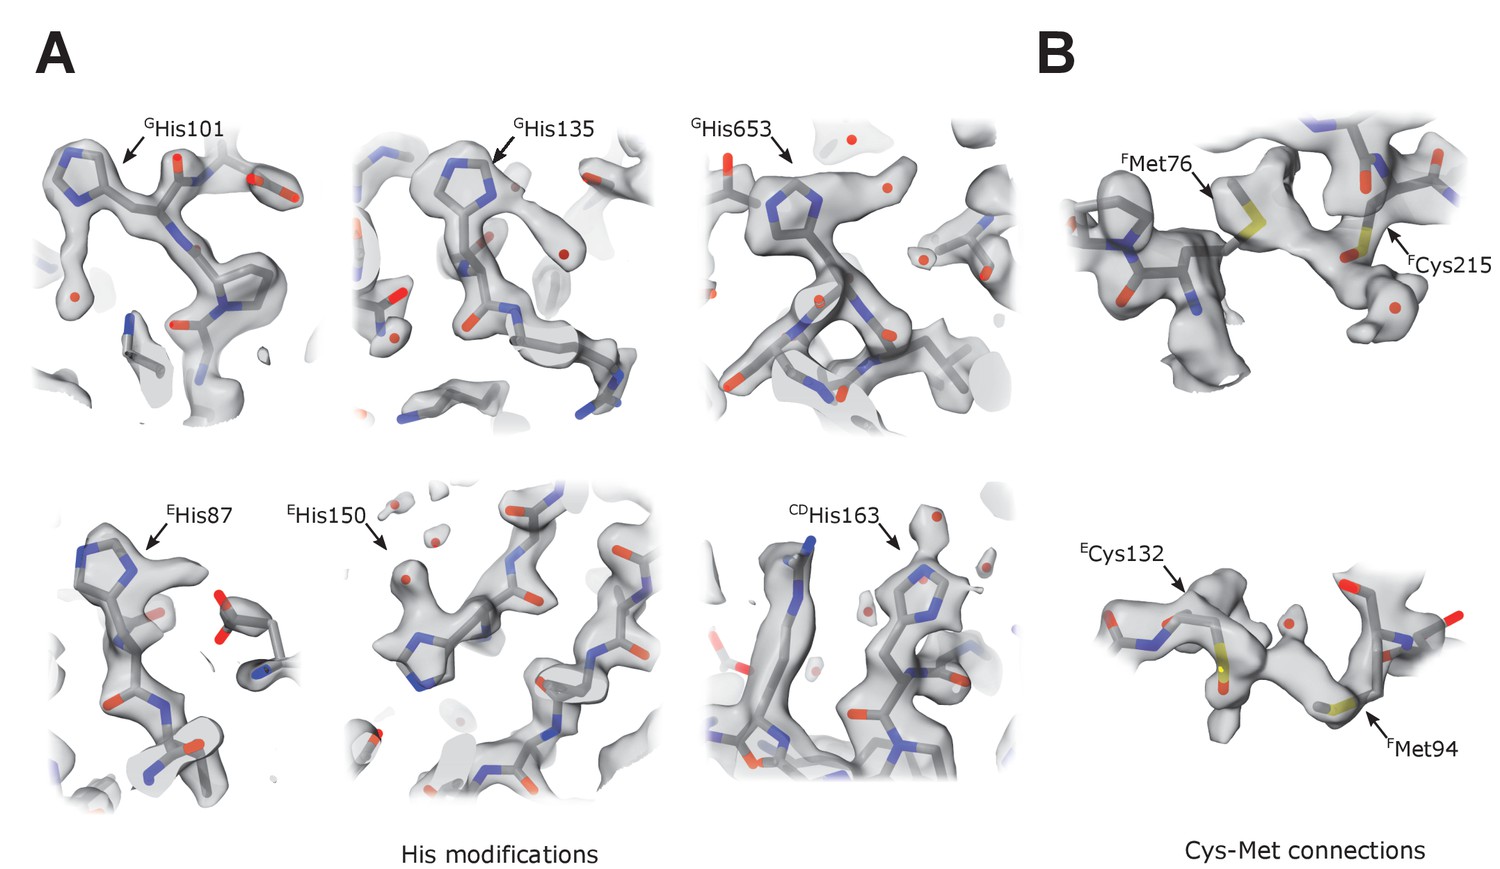
Unusual density features.
(A) Several surface-exposed histidines (Table 6) have extended density protruding from the imidazole ring in the plane of the ring. These extensions may represent a tightly bound heavy atom, but these features are heterogeneous (length between 2 and 4 Å) and have a very heterogeneous chemical environment; therefore, they cannot be attributed to a single type of bound atom or modification. We tentatively modeled them as water molecules. (B) In three locations, sulfur atoms of surface-exposed and closely positioned cysteine-methionine couples are bridged by density with reproducible elongated features (Cys-Met: FMet76-FCys215, FMet94-ECys132, BMet106-BCys102). We could not assign the density to any known modification or tightly bound chemical present in the protein purification buffer. Because complex I was purified without reducing agents, the corresponding Cys residues were tentatively modeled as cysteines oxidized to sulfenic acid.
Figure 4 with 2 supplements
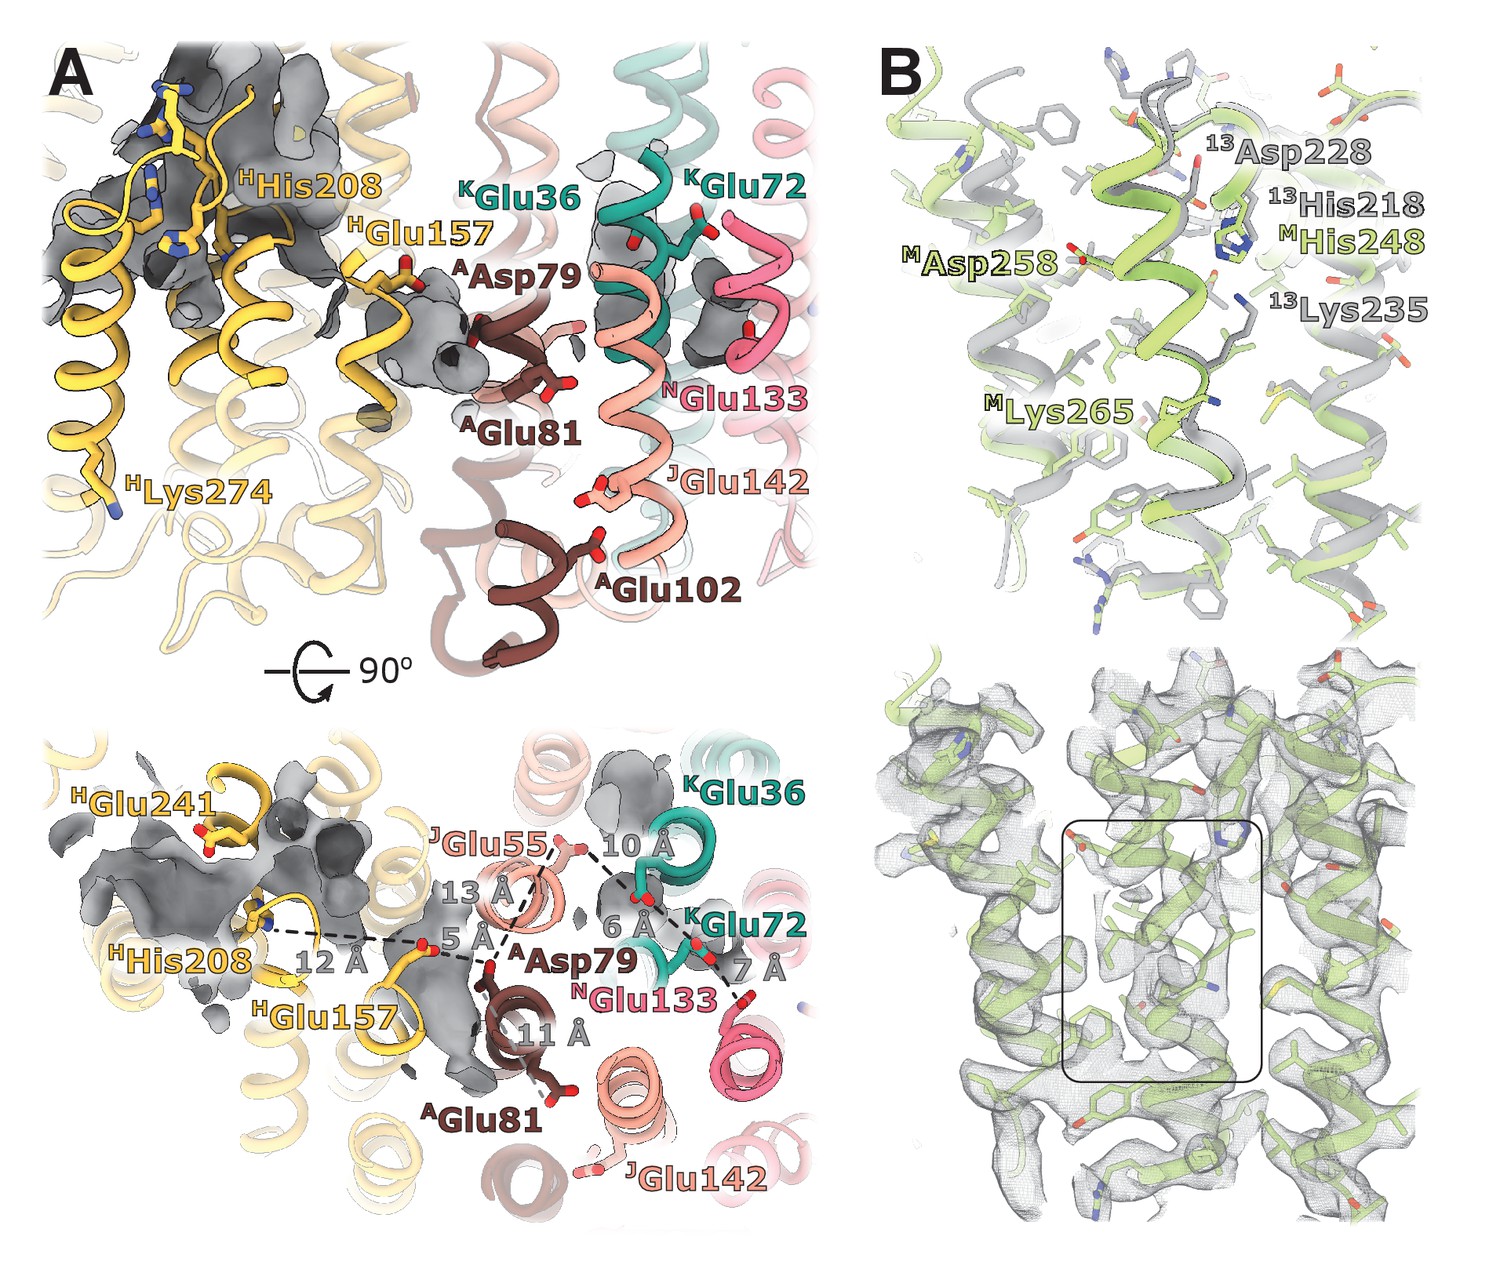
Structural details of the membrane arm.
(A) The E-channel. Top: Side view, bottom: view from the cytoplasm. Charged residues between NuoH and NuoN subunits are indicated along with the distances between them. The cavities allowing entrance of ions and water molecules are shown as gray surfaces. (B) Conformational heterogeneity within the NuoM subunit. Top: Comparison of the conformation of MTMH8 in E. coli (green) with 13TMH8 in T. thermophilus (gray). Bottom: density of NuoM subunit displays heterogeneity within MTMH8 region, marked by a black rectangle.
Figure 4—figure supplement 1

Comparison of X-ray and cryo-EM structures of the membrane domain.
The cryo-EM structure is colored as in Figure 1, the X-ray model is shown in black. Significant shifts in the cytoplasmic loop of NuoM and the shift of ATM1 are indicated with red arrows. Part of the β-hairpin observed in the crystal structure forms an extension of MTM6a in the cryo-EM structure. This happens despite this loop not being involved in direct crystal contact.
Figure 4—figure supplement 2
Conserved chain of ionizable residues.
Comparison of the chains of ionizable residues lining the Q-cavity and positioned in the hydrophobic region of the lipid membrane in (A) E. coli, (B) T. thermophilus, (C) Yarrowia lipolytica, and (D) Ovis aries complex I. In C and D, only the core subunits are shown.
Figure 5 with 2 supplements
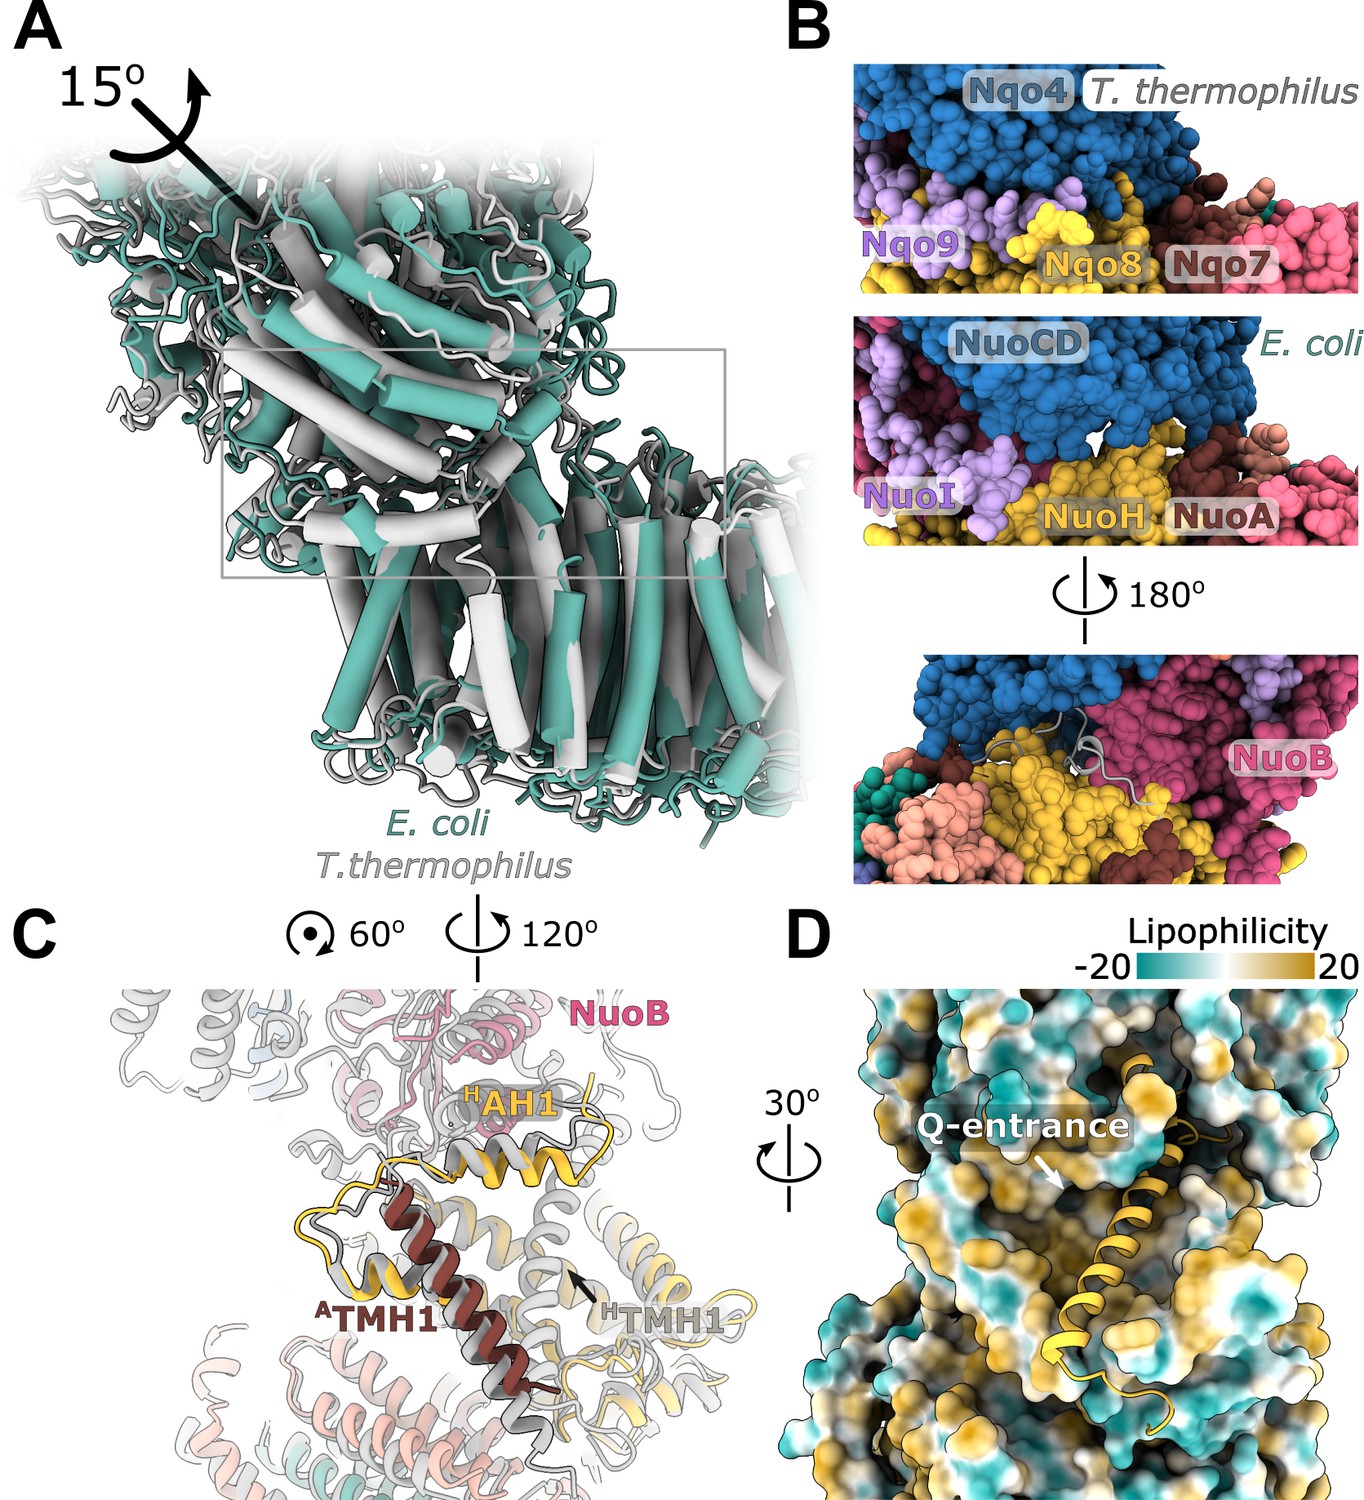
Interface between the peripheral and membrane arms.
(A) Comparison of the interface between E. coli (green) and T. thermophilus (PDB ID:4HEA, gray) complex I. Structures were aligned on the subunit NuoH/Nqo8. The rotation axis of the subunits NuoB/D module relative to Nqo6/4 is indicated. (B) Interfacial contacts between the peripheral and membrane arms in T. thermophilus (upper panel) and E. coli (middle and bottom panel). A gap in the subunit interface is apparent in the absence of the conserved ATMH1-2 loop fragment. The corresponding loop from T. thermophilus is shown in gray in the cartoon representation (bottom panel). (C) Differences in the structures of NuoH and NuoA subunits between E. coli (color coded as in Figure 1) and T. thermophilus (gray). (D) View from the membrane on the entrance to the Q-cavity. Homology model of HTM1, absent in the E. coli structure, is shown in the cartoon representation. The protein surface is colored by lipophilicity.
Figure 5—figure supplement 1
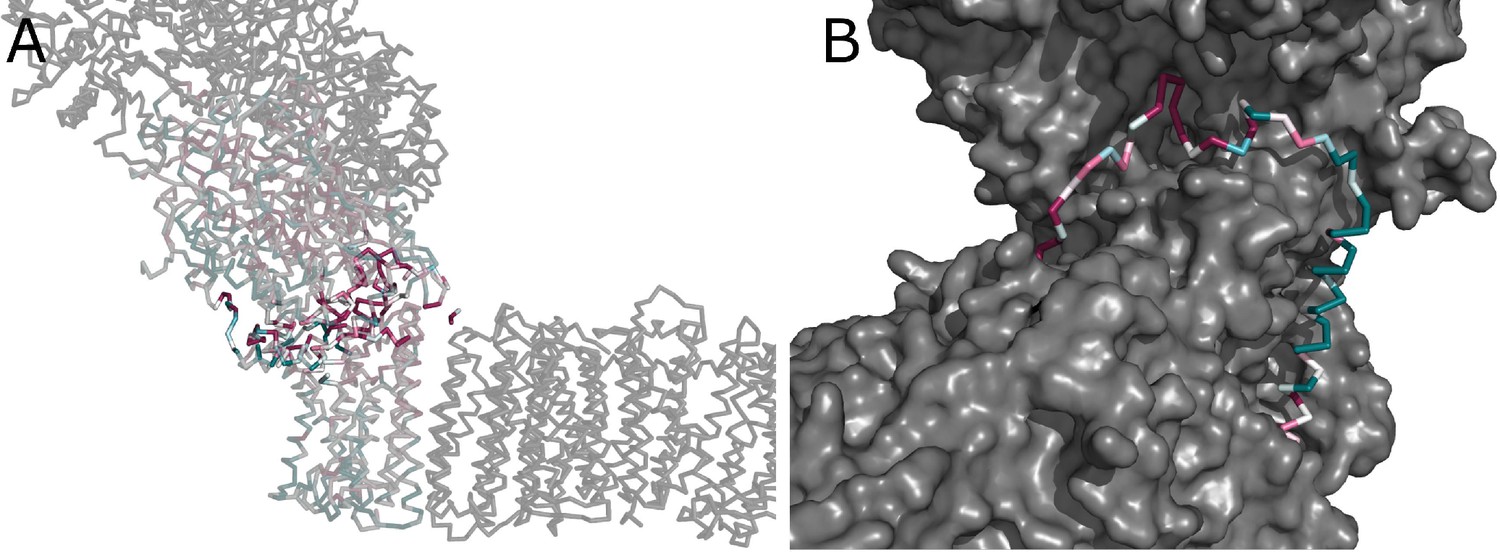
Conserved interface between the arms.
(A) Conservation of subunits contributing to the interface between the peripheral and membrane arms, calculated in ConSurf and color-coded from green to white to purple as the degree of conservation increases. Residues directly contributing to the interaction between arms are highlighted. (B) The conserved region of the NuoA TMH1-TMH2 loop forms a plug, which fills a crevice between the subunits NuoD, NuoB, and NuoH.
Figure 5—figure supplement 2
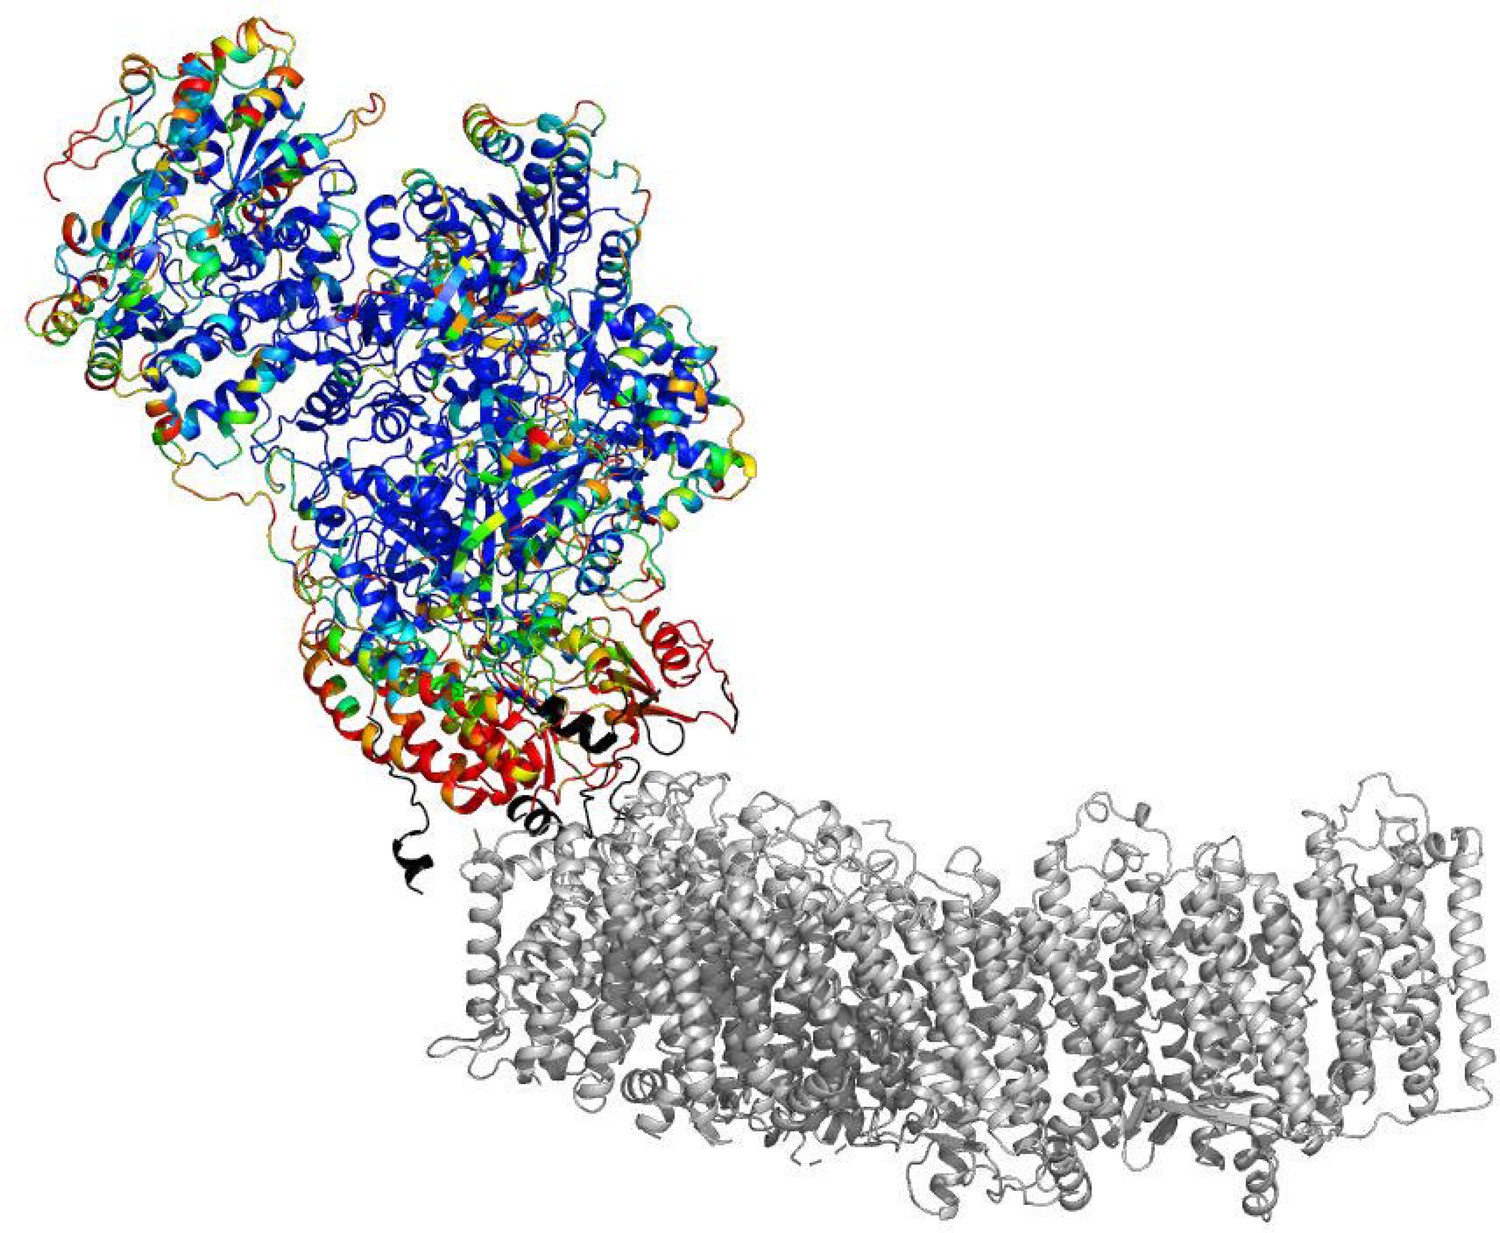
B-factors of the peripheral arm show higher mobility at the arms interface.
The cartoon representation is shown. The peripheral arm is colored by B-factors. The rainbow color palette scales from 5 Å2 - blue to 100 Å2- red. Regions completely disordered in the map of focused reconstruction of the peripheral arm but showing density in the reconstructions of the intact complex are colored in black. The membrane arm is shown in gray for reference.
Figure 6 with 3 supplements
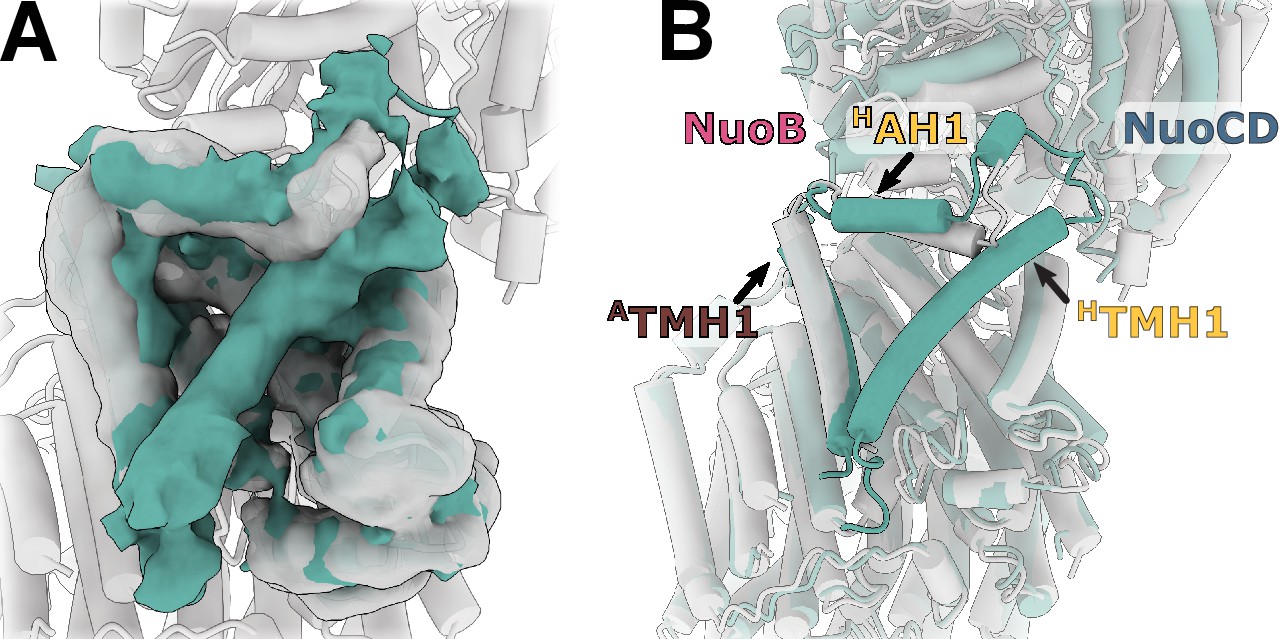
Reconstruction of E. coli complex I solubilized in detergent reveals uncoupled conformation with resolved HTMH1.
(A) Comparison of the density in the HTMH1 region between the focused reconstruction of membrane arm in lipid nanodisc filtered to 7 Å (gray) and LMNG-solubilized entire complex map (green). (B) Overlay of the conformation 1 solved in nanodiscs (gray) and the model fitted into the LMNG-solubilized reconstruction.
Figure 6—figure supplement 1
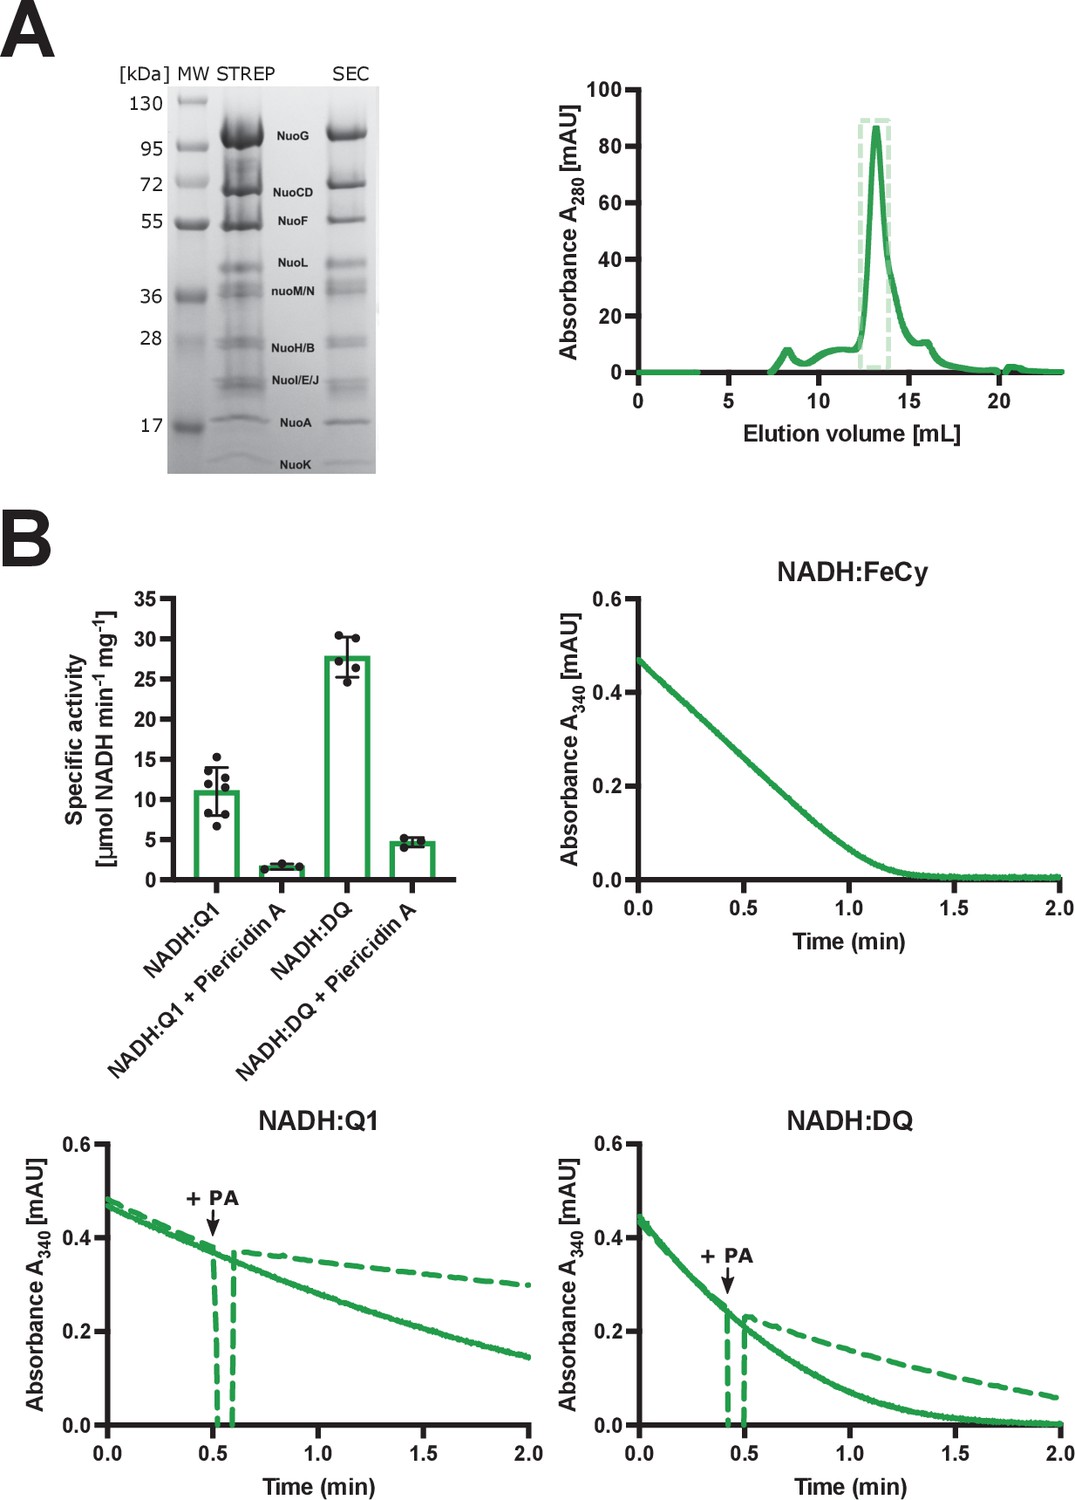
Purification and biochemical characterization of E. coli complex I in LMNG.
(A) Left: SDS-PAGE depicting the sample solubilized in detergent after affinity chromatography (STREP) and after size-exclusion chromatography (SEC). Right: size-exclusion chromatography profile. Fractions marked by the green, dashed rectangle were pooled, concentrated, and used for cryo-EM and activity assays. (B) The spectrophotometric activity assays. Top left: Vmax for NADH:Q1 (11±3 µmol NADH min−1 mg−1), NADH:Q1 inhibited with 20 µM piericidin A (1.6±0.3 µmol NADH min−1 mg−1), NADH:DQ (28±2 µmol NADH min−1 mg−1) and NADH:DQ inhibited with piericidin A (4.7±0.5 µmol NADH min−1 mg−1) is plotted. The NADH:FeCy Vmax (117±9 µmol NADH min−1 mg−1) is not shown. The graph shows mean ± SD. Individual measurement results are shown as dots. Top right and bottom: representative traces of the NADH:FeCy (top right), NADH:Q1 (bottom left, solid line), and NADH:DQ (bottom right, solid line) activities. The NADH:Q1 and NADH:DQ inhibition assays are shown by dashed lines. Piericidin A addition point is marked as ‘+PA’. The concentration of complex I was five times lower for the NADH:FeCy compared to that for the NADH:Q1 and NADH:DQ assays.
Figure 6—figure supplement 2
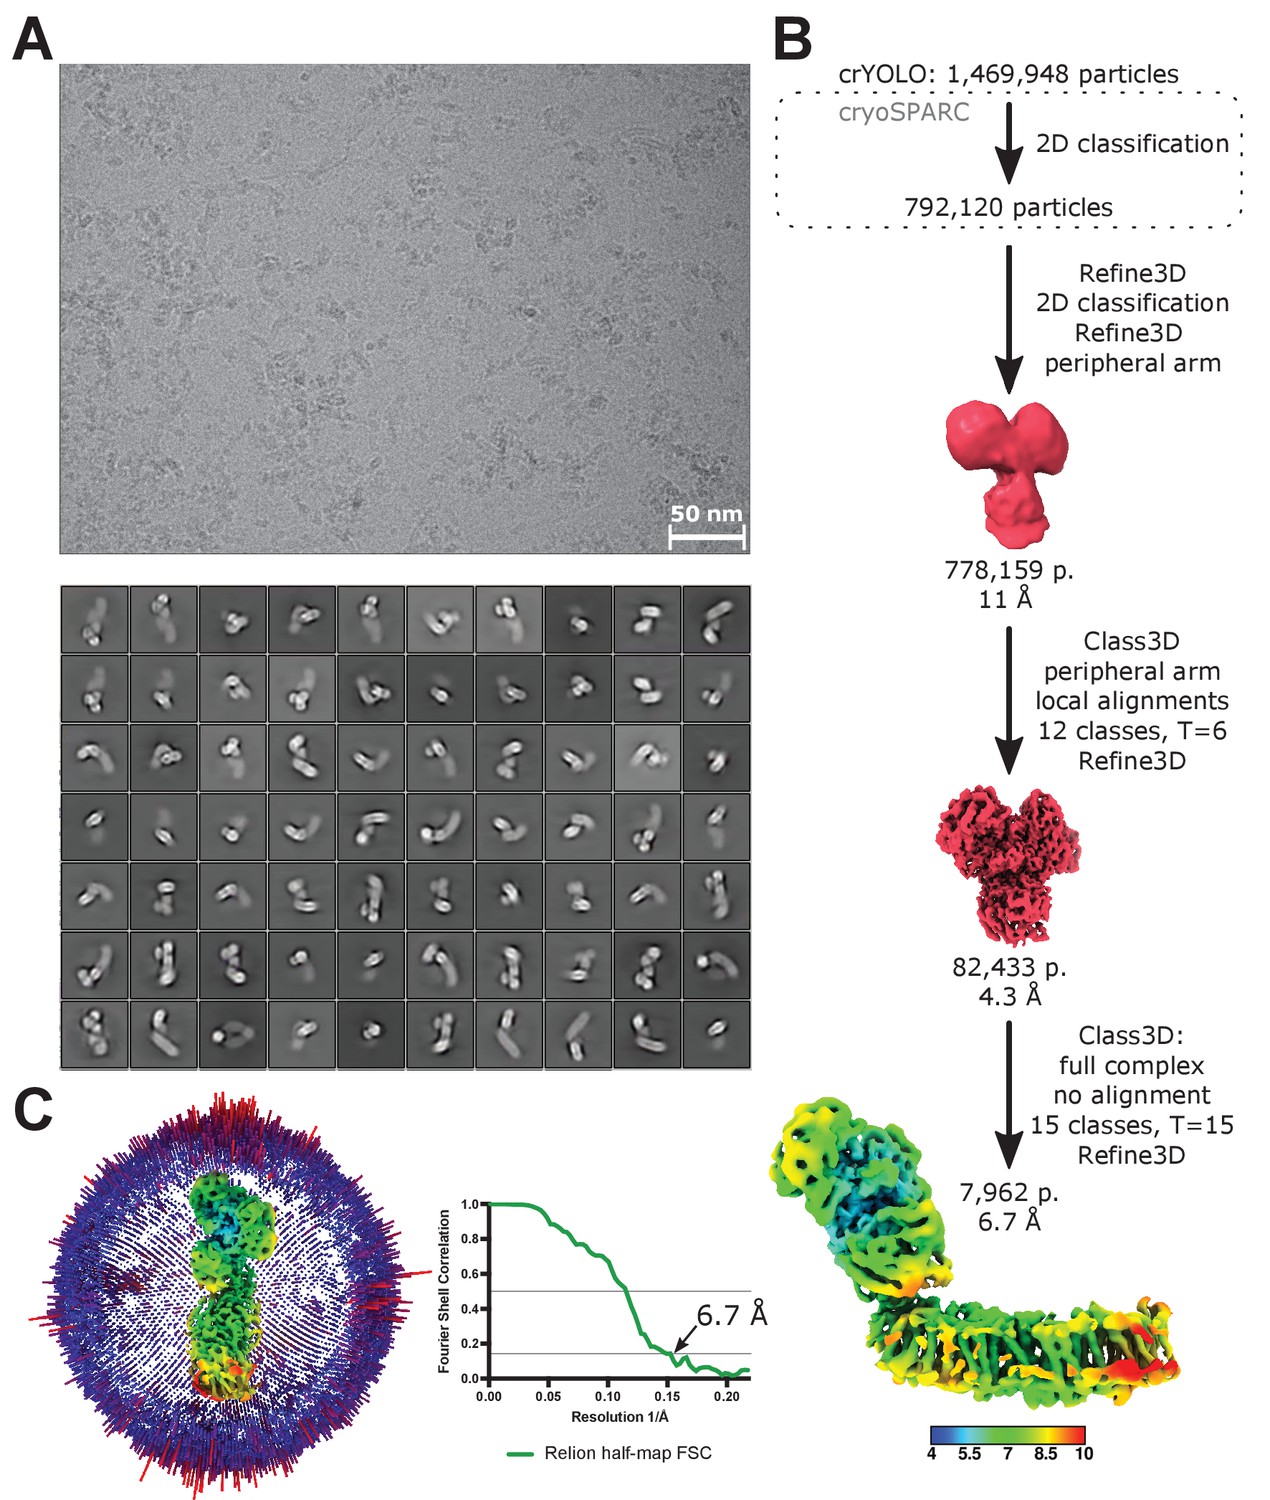
Processing of LMNG-solubilized cryo-EM data.
(A) A representative micrograph (top) and 2D classes of the entire complex I (bottom). (B) Image processing diagram. The scheme indicates the principal steps during image processing. The final reconstruction is colored according to local resolution. (C) Angular distribution and FSC plot for the reconstruction of the full complex in LMNG.
Figure 6—figure supplement 3
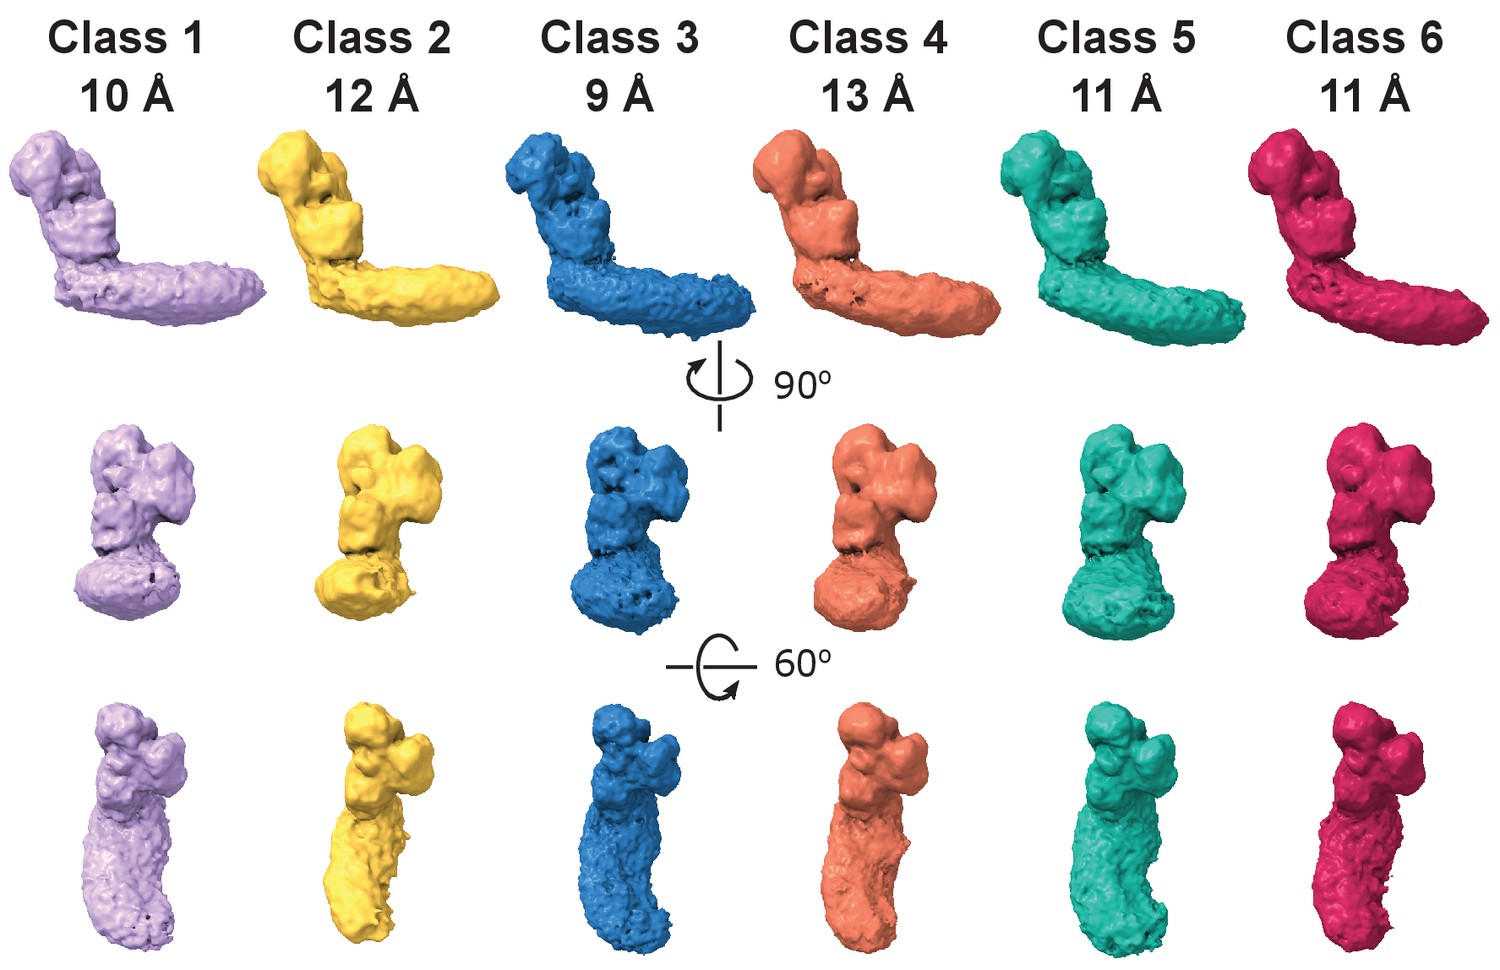
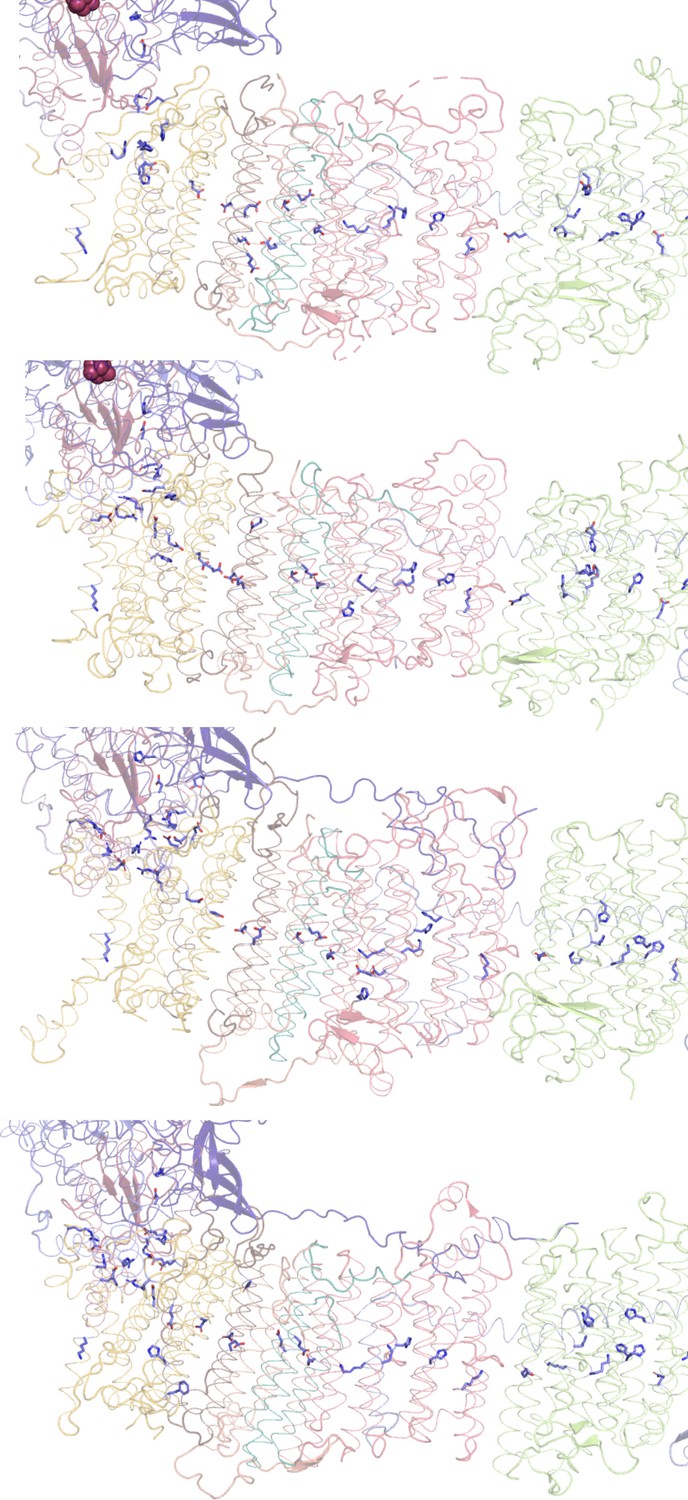
Dynamic connection between peripheral and membrane arms in the LMNG – solubilized complex I.
Representative 3D classes show relative movements of the arms. The resolution for each class is indicated.
Figure 7
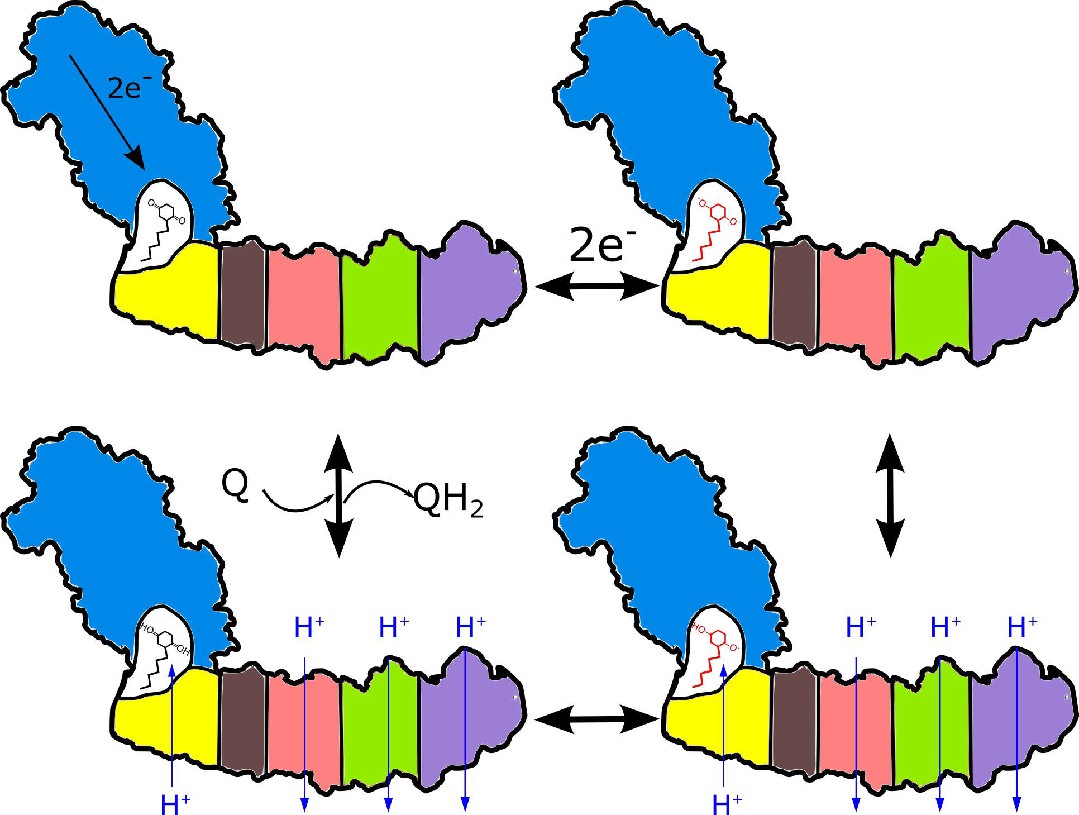
Proposed coupling mechanism in respiratory complex I.
Ubiquinone reduction decreases the proton potential in the Q-cavity, generating/enhancing potential difference between the Q-cavity and periplasmic space. It is subsequently neutralized by protons translocated through NuoH from the periplasm into the Q-cavity and this translocation is coupled with the reversible translocation of three protons into the periplasm. Color coding of the schematic subunits in the membrane arm is similar to that described in Figure 1, negatively charged states of ubiquinone are shown in red.
Author response image 1
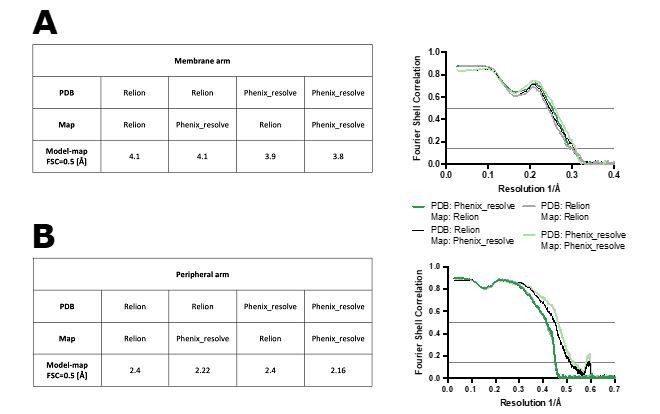
Figure shows model-map FSC curves between the models refined against RELION-sharpened or density-modified maps (PDB: Relion or Phenix_resolve, respectively) and maps sharpened in RELION or density-modified (Map: Relion or Phenix_resolve, respectively).
The FSC curves are shown for the membrane arm (A) and peripheral arm (B) models.
Videos
Video 1
Composite density map of E. coli complex I is shown along with density of the lipid nanodisc.
The homology model of TMH1 is shown in ribbon representation.
Video 2
The fragmented density of the NuoM TM8 is surrounded by well-resolved TMHs.
Tables
Table 1
Statistics of cryo-EM data collection, data processing, and model refinement.
| Data collection | ||||||
|---|---|---|---|---|---|---|
| Nanodiscs | LMNG | |||||
| Microscope | JEOL CRYOARM300 | |||||
| Acceleration voltage [kV] | 300 | |||||
| Energy filter | In-column Omega energy filter | |||||
| Energy filter slit width [eV] | 20 | |||||
| Magnification | 60 000 x | |||||
| Detector | Gatan K3 | |||||
| Physical pixel size [Å] | 0.771 | 0.766 | ||||
| Exposure time [s] | 3 | 3 | ||||
| Number of frames | 61 | 60 | ||||
| Total electron dose [e-/Å2] | 65 | 60 | ||||
| Defocus range [µm] | 0.9–2.2 | 1.0–2.0 | ||||
| Number of micrographs collected | 9122 | 13,084 | ||||
| Total number of particles extracted | 1,256,734 | 1,469,948 | ||||
| Data processing | ||||||
| Entire complex in nanodiscs | Membrane domain | Peripheral domain | Entire complex in LMNG | |||
| Conformation 1 | Conformation 2 | Conformation 3 | ||||
| PDB ID: | 7NYR | 7NYU | 7NYV | 7NYH | 7NZ1 | - |
| EMDB ID: | EMD-12653 | EMD-12654 | EMD-12655 | EMD-12652 | EMD-12661 | EMD-13291 |
| Imposed symmetry | C1 | C1 | C1 | C1 | C1 | C1 |
| Final number of particles | 23,445 | 21,620 | 21,234 | 37,441 | 286,384 | 7,962 |
| Final resolution, RELION, FSC=0.143 | 3.9 | 4.6 | 4.5 | 3.9 | 2.4 | 6.7 |
| Final resolution, RELION, FSC=0.5 | 6.0 | 7.9 | 7.4 | 4.4 | 2.8 | 8.7 |
| Sharpening B-factor, RELION [Å2] | −67 | −126 | −116 | −70 | −52 | −195 |
| Final resolution, PHENIX resolve_cryo_em, FSC=0.143 | 3.3 | 3.8 | 3.7 | 3.7 | 2.1 | - |
| Final resolution, PHENIX resolve_cryo_em, FSC=0.5 | 3.8 | 4.6 | 4.4 | 4.2 | 2.5 | - |
| Local resolution range (Å) | 2.9–11 | 3.2–15 | 3.1–13 | 3.0–6.2 | 1.8–3.8 | 4.8–12 |
| Model refinement | ||||||
| Initial model | 4HEA, 3RKO | 4HEA, 3RKO | 4HEA, 3RKO | 4HEA, 3RKO | 4HEA | - |
| Refinement package | PHENIX 1.19.2, Real-space refinement | - | ||||
| Model resolution at FSC=0.5 (Å) | 3.5 | 4.3 | 4.1 | 3.8 | 2.2 | - |
| Cross-correlation | ||||||
| Mask | 0.69 | 0.58 | 0.62 | 0.70 | 0.80 | - |
| Volume | 0.67 | 0.57 | 0.60 | 0.68 | 0.75 | - |
| Model composition | ||||||
| Non-hydrogen atoms | 35229 | 35229 | 35229 | 16167 | 19773 | - |
| Protein residues | 4618 | 4618 | 4618 | 2195 | 2361 | - |
| Waters | 0 | 0 | 0 | 0 | 1170 | - |
| Ligands | 11 | 11 | 11 | 0 | 11 | - |
| B-factors mean (A2) | ||||||
| Protein | 50 | 93 | 93 | 75 | 31 | - |
| Ligand | 32 | 67 | 74 | - | 33 | - |
| Waters | - | - | - | - | 21 | - |
| R.M.S. deviations | ||||||
| Bond lengths (Å) | 0.005 | 0.000 | 0.005 | 0.006 | 0.006 | - |
| Bond angles (o) | 0.875 | 0.860 | 0.850 | 0.943 | 0.937 | - |
| Validation | ||||||
| MolProbity score | 1.38 | 1.45 | 1.52 | 1.35 | 0.91 | - |
| Clashscore | 3.81 | 4.73 | 5.73 | 2.33 | 1.36 | - |
| Poor rotamers (%) | 0.82 | 0.82 | 0.85 | 1.10 | 0.98 | - |
| C-beta outliers (%) | 0 | 0 | 0 | 0 | 0 | - |
| CaBLAM outliers (%) | 2.02 | 1.96 | 2.07 | 2.05 | 1.60 | - |
| Ramachandran plot (%) | ||||||
| Favored | 96.63 | 96.72 | 96.68 | 95.54 | 97.81 | - |
| Allowed | 3.37 | 3.28 | 3.32 | 4.46 | 2.19 | - |
| Outliers | 0.00 | 0.00 | 0.00 | 0.00 | 0.00 | - |
Table 2
Residues built in the models.
| Subunit | Total number of residues | Built residues | Co-factors | Fragments build in entire complex only | ||
|---|---|---|---|---|---|---|
| Entire complex | Membrane arm | Peripheral arm | ||||
| NuoF | 445 | 1–441 | 1–441 | FMN, N3 | ||
| NuoE | 166 | 11–166 | 11–166 | N1a | ||
| NouG | 908 | 1–907 | 1–907 | N1b, N4, N7 | ||
| NuoI | 180 | 23–180 | 39–180 | N6a, N6b | 23–38 | |
| NuoB | 220 | 43–76, 86–179, 190–220 | 53–71, 90–179, 190–220 | N2 | 43–53, 71–76, 86–90: | |
| NuoCD | 596: C 1–172 D 212–596 | 9–596 | 9–205, 210–218, 224–233, 238–596 | - | 206–209, 219–223, 234–237 | |
| NuoH | 325 | 52–321 | 52–214, 223–321 | - | 215–222 | |
| NuoA | 147 | 15–38, 60–127 | 15–38, 66–127 | - | 61–66 | |
| NuoJ | 184 | 1–164 | 1–164 | - | ||
| NuoK | 100 | 1–100 | 1–100 | - | ||
| NuoN | 485 | 1–191, 199–437, 447–483 | 1–191, 199–437, 447–483 | - | ||
| NuoM | 509 | 1–504 | 1–504 | - | ||
| NuoL | 613 | 1–612 | 1–612 | - | ||
Table 3
Properties of E. coli peripheral arm extensions (analyzed in PIZA).
| Subunit | Extension residues numbers | Interacts with subunit | Interaction surface [Å2] | Secondary structure | Specific interactions | Spatial overlap with subunits in other species |
|---|---|---|---|---|---|---|
| NuoF | C-term 424–445 | NuoI, NuoD NuoB | 254 557 118 | no | Nb 8 Sb 0 Hb 0 Sb 1 Hb 0 Sb 0 | Nqo15 T. Therophilus NUIM,NUZM,NUMM*, Y. Lipolytica Ndufs6, Ndufs8, mouse |
| NouG | Insertion 687–781 | NuoCD NuoI | 1080 585 | two helical turns | Hb 12 Sb 5 Hb 13 Sb 4 | Nqo5 T. Therophilus NUGM, NUYM Y. Lipolytica Ndufs3, Ndufs4 mouse |
| NuoI | C-term 139–180 | NuoG NuoB NuoF NuoD NuoE | 805 348 292 122 421 | one helical turn | Nb 8 Sb 5 Nb 1 Sb 0 Nb 3 Sb 0 Nb 0 Sb 1 Nb 1 Sb 0 | Nqo15 T. Therophilus NUMM Y. Lipolytica Ndufs6 mouse |
| NuoB | C-term 196–220 | NuoI NuoD NuoF | 1095 216 117 | two helical turns | Nb 16 Sb 4 Nb 1 Sb 3 Ng 0 Sb 0 | NUIM, N7BM Y. Lipolytica Ndufs8, Ndufa12 mouse |
-
*Subunits in bold are homologs of NuoI.
Table 4
Comparison of hydrogen bond networks surrounding the N1a cluster in complex I structures solved at high resolution.
| Cluster | Hb acceptor | Hb donor | ||
|---|---|---|---|---|
| E. coli this work | A. aeolicus [pdb: 6hla] | O. aries [pdb: 6zk9] | ||
| N1a | N1a S1 | NH Asn136 3.5 Å | NH Ala130 3.6 Å | NH Ala147 3.3 Å |
| NH Leu134 3.1 Å | NH Leu128 3.5 Å | NH Leu145 3.3 Å | ||
| NδH Asn142 3.6 Å | ||||
| N1a S2 | NH CyS87 4.0 Å | NH Cys91 3.5 Å | NH Cys108 3.7 Å | |
| OγH Thr105 2.4 Å | ||||
| Sγ, Cys92 (86,103)* | NH Ser94 3.5 Å | NH Ser88 3.5 Å | NH Thr 105 3.7 Å | |
| Sγ, Cys97 (91,108) | Nδ2H Asn142 4.1 Å | NH Val136 3.4 Å | NH Met153 4.3 Å | |
| NH Asn 142 3.7 Å | ||||
| OH W74 3.2 Å | ||||
| Sγ, Cys133 (127,144) | OH W127 3.3 Å | OH W794 3.2 Å | OH W649 3.2 Å | |
| NH Gly97F4.0 Å | N GLy99F3.7 Å | NH GLy103F4.5 Å | ||
| NH Gly135 3.3 Å | N Gly129 3.5 Å | NH Gly146 3.3 Å | ||
| Sγ, Cys137 (131,148) | N GLy97F 3.4 Å | N Gly99F 3.3 Å | N Gly103 3.2 Å | |
-
*Numbering in parenthesis is given for A. aeolicus and O. aries, respectively.
Table 5
Differences in the hydrogen bond network of iron-sulfur clusters in complex I structures solved at high resolution and water molecules in the immediate cluster environment.
(Only the clusters for which such comparison could have been done and clusters displaying differences in the environment are listed).
| Cluster, Subunit | Organism | ||
|---|---|---|---|
| E. coli this work | A. aeolicus [pdb: 6hla] | O. aries [pdb: 6zk9] | |
| N3, NuoF | His400 (+) | Leu395(-) | Leu407(-) |
| Trp363(-) | Glu349(+) | Gln361(+) | |
| Asn196(+) | His198(-) | Lys202(-) | |
| N1b, NuoG | HOH386 | HOH1070 | |
| N7, NuoG | HOH441 | ||
| HOH577 | |||
| Cys228 | Asp229 | ||
| Cys231 | Asp232 | ||
| Cys235 | Ser236 | ||
| Cys263 | Ser264 | ||
| HOH929* | |||
| HOH933* | |||
| HOH1005* | |||
| N4, NuoG | Thr203(+) | Val205(-) | |
| N5, NuoG | conserved | ||
| N6a, NuoI | Phe92(-) | Tyr109(+) | |
| HOH539 | |||
| N6b, NuoI | Leu48(-) | His65(+) | |
| Cys74(+) | Ala91(-) | ||
| Leu116(-) | Glu133(+) | ||
| N2, NouB | HOH438 | HOH353 | |
| HOH211 | HOH579 | ||
| Arg250D | Arg85 dimethylated | ||
| Ser62 | Ala53 | ||
-
*Water molecules replacing the N7 cluster.
Table 6
Histidine residues with unassigned features extending from the imidazole ring.
| Residue | Modeled atom | Comments |
|---|---|---|
| EHis87 | None | Interaction with ED146 |
| EHis150 | HOH | Distance 2.1 Å |
| EHis152 | HOH | Distance 2.4–2.6 Å |
| GHis5 | HOH | Density on both sides |
| GHis101 | HOH | Positive environment |
| GHis123 | HOH | Distance 2.2 Å |
| GHis427 | HOH | Distance 2.85 Å |
| GHis653 | HOH | Distance 2.5 Å, very strong |
| CDHis163 | HOH | Distance 2.5 Å |
| CDHis507 | HOH | Distance 4.2 Å |
Key resources table
| Reagent type (species) or resource | Designation | Source or reference | Identifiers | Additional information |
|---|---|---|---|---|
| Gene (Escherichia coli) | nuoe, nuof | GenBank | NC_012971.2 region2288438–2289174 | |
| Strain, strain background (Escherichia coli) | BL21-AI | Thermo Fisher Scientific Inc | C607003 | Chemically competent cells |
| Strain, strain background (Escherichia coli) | BL21FS | This study | BL21-AI supplemented with a twin-STREP-tag and a TEV protease recognition site on the nuoF N-terminus, see Materials and Methods,"Generation of an E. coli strain….” | |
| Recombinant DNA reagent | pCas (plasmid) | Jiang et al., 2015 | RRID:Addgene_62225 | A vector for Crispr-Cas9 mutagensis |
| Recombinant DNA reagent | pTargetF (plasmid) | Jiang et al., 2015 | RRID:Addgene_62226 | A vector for Crispr-Cas9 mutagensis |
| Recombinant DNA reagent | pMSP2N2 (plasmid) | Grinkova et al., 2010 | RRID:Addgene_29520 | A vector for expression of MSP2N2 membrane scaffold protein |
| Recombinant DNA reagent | DNA knock-in cassette | This study | NuoEF fragment supplemented with a twin-STREP-tag and a TEV protease recognition site, see Materials and Methods,"Generation of an E. coli strain….” | |
| Chemical compound, drug | Piericidin A | Cayman Chemical | 15379 | |
| Chemical compound, drug | NADH | Carl-Roth GmbH | AE12.2 | |
| Chemical compound, drug | Decylubiquinone; DQ | Sigma Aldrich BVBA | D7911 | |
| Chemical compound, drug | Ubiquinone-1; Q1 | Sigma Aldrich BVBA | C7956 | |
| Chemical compound, drug | Potassium ferricyanide (III); FeCy | Sigma Aldrich BVBA | 244023 | |
| Chemical compound, drug | Lauryl Maltose Neopentyl Glycol; LMNG | Anatrace | NG310 | |
| Chemical compound, drug | n-Dodecyl-β-D-Maltopyranoside; DDM | Anatrace | D310 | |
| Chemical compound, drug | E. coli polar extract | Avanti Polar Lipids | 100600C | |
| Software, algorithm | SerialEM 3.0.8 | Mastronarde, 2005 | RRID:SCR_017293 | |
| Software, algorithm | MotionCor2 | Zheng et al., 2017 | RRID:SCR_016499 | |
| Software, algorithm | CTFFIND-4.1 | Rohou and Grigorieff, 2015 | RRID:SCR_016732 | |
| Software, algorithm | crYOLO 1.4, crYOLO 1.7.0 | Wagner et al., 2019 | RRID:SCR_018392 | |
| Software, algorithm | Relion 3.1 | Zivanov et al., 2018 | RRID:SCR_016274 | |
| Software, algorithm | cryoSPARC 2.11, cryoSPARC 3.2.0 | Punjani et al., 2017 | RRID:SCR_016501 | |
| Software, algorithm | SWISS-MODEL server | Waterhouse et al., 2018 | RRID:SCR_018123 | |
| Software, algorithm | UCSF Chimera 1.13.1 | Pettersen et al., 2004 | RRID:SCR_004097 | |
| Software, algorithm | Coot 0.9 | Casañal et al., 2020 | RRID:SCR_014222 | |
| Software, algorithm | PHENIX 1.19.2 | Liebschner et al., 2019 | RRID:SCR_014224 | |
| Software, algorithm | ISOLDE 1.0b5 | Croll, 2018 | ||
| Software, algorithm | MolProbity | Williams et al., 2018 | RRID:SCR_014226 | |
| Software, algorithm | ConSurf server | Ashkenazy et al., 2016 | RRID:SCR_002320 | |
| Software, algorithm | UCSF ChimeraX 1.1 | Goddard et al., 2018 | RRID:SCR_015872 | |
| Software, algorithm | The PyMOL Molecular Graphics System, Version 2.4.1 | Schrödinger, LLC | RRID:SCR_000305 | |
| Other | Quantifoil R0.6/1 Cu300 holey carbon grids | Quantifoil | Q350CR-06 |
Appendix 1—table 1
Equilibrium pHcav and proton translocation stoichiometry for various values of n as defined in the Appendix and calculated for ΔΨ −120 mV, ΔpH 0.9 and matrix pHout 7.4 characteristic of mitochondria (Mollica et al., 1998).
| N | pHcav | Stoichiometry xH+/2e- |
|---|---|---|
| 0 | 5.4 | -2 |
| 1 | 8.3 | 0 |
| 2 | 11.2 | 2 |
| 3 | 14.1 | 4 |
Additional files
Download links
A two-part list of links to download the article, or parts of the article, in various formats.
Downloads (link to download the article as PDF)
Open citations (links to open the citations from this article in various online reference manager services)
Cite this article (links to download the citations from this article in formats compatible with various reference manager tools)
Structure of Escherichia coli respiratory complex I reconstituted into lipid nanodiscs reveals an uncoupled conformation
eLife 10:e68710.
https://doi.org/10.7554/eLife.68710


