Different translation dynamics of β- and γ-actin regulates cell migration
- Department of Biomedical Sciences, School of Veterinary Medicine, University of Pennsylvania, United States
- Institute of Advanced Technology, Kindai University, Kainan, Japan
- Department of Chemical and Biomolecular Engineering, University of Maryland, United States
- Department of Chemistry, University of Maryland, United States
- Department of Mathematics and Statistics, Georgia State University, United States
- Institute for Biomedical Informatics, Perelman School of Medicine, University of Pennsylvania, United States
Figures
Figure 1 with 5 supplements
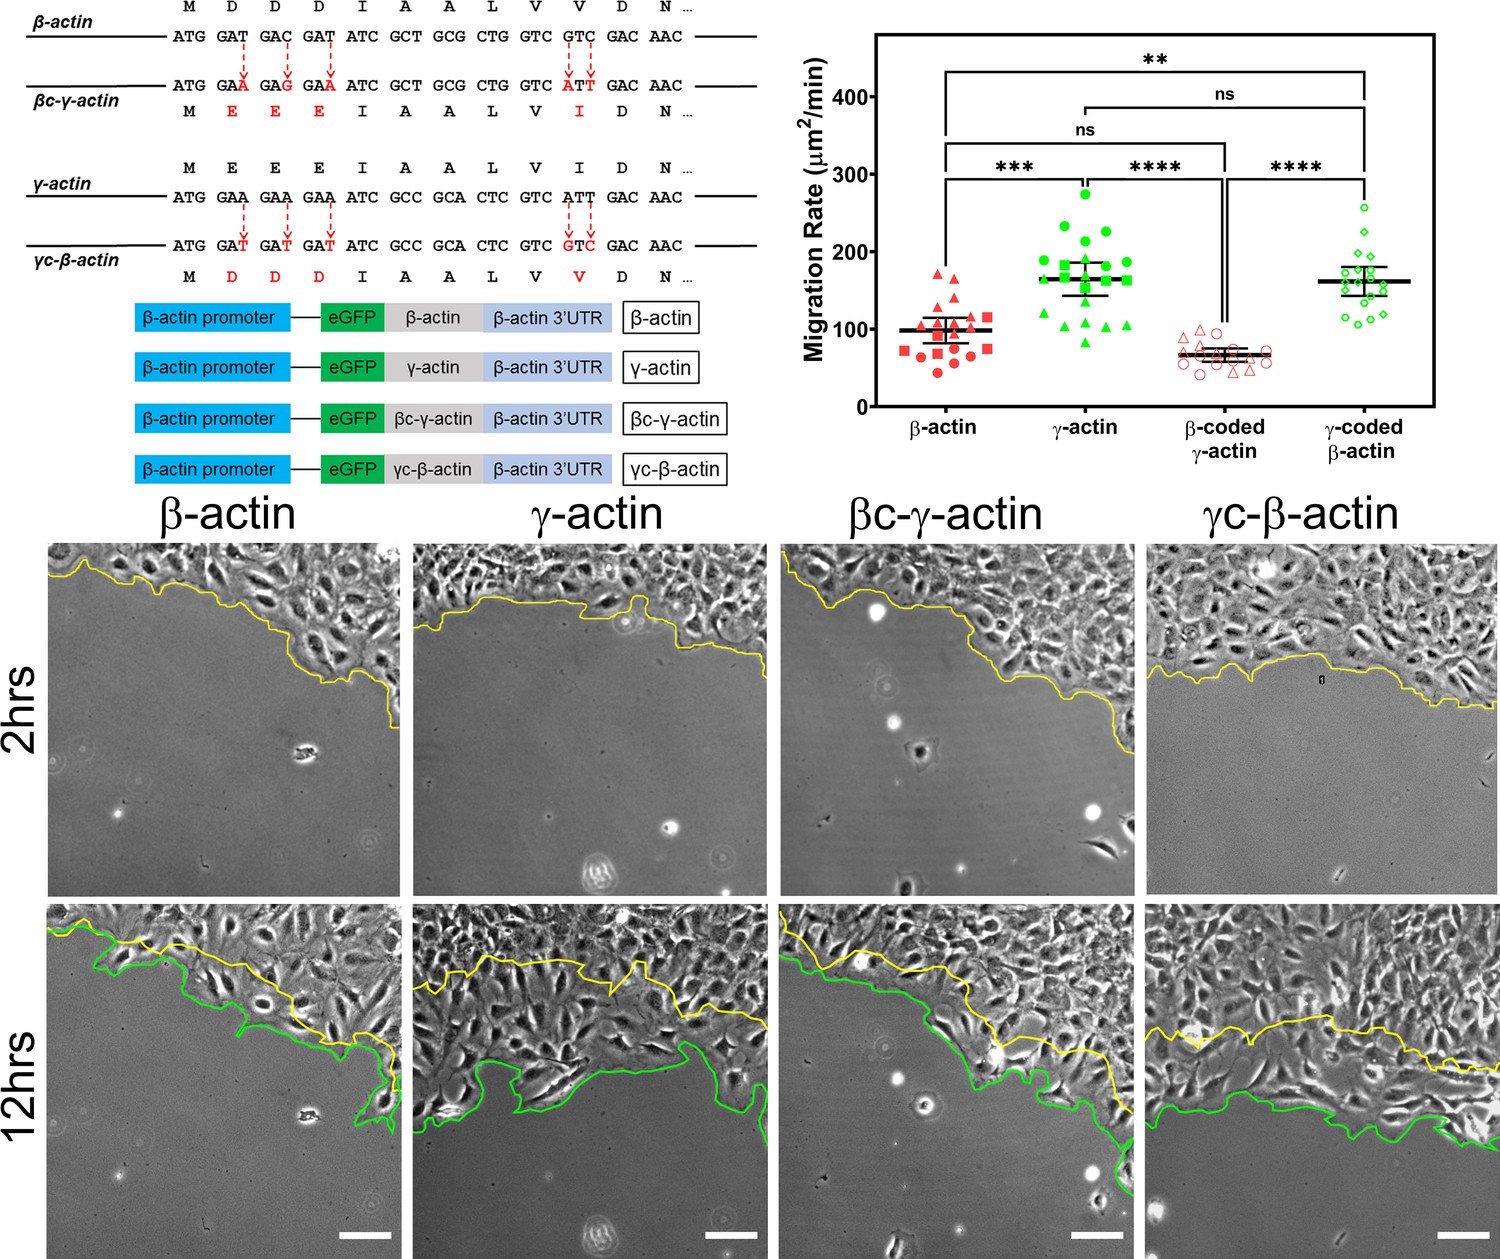
Cell migration speed is regulated by actin isoform coding sequence.
Top left, mutagenesis strategy used to generate ‘codon-switched’ actin variants and linear maps of the major constructs used in this study. Top right, scatter plot of migration rates in a wound-healing assay of cell populations expressing different actin constructs. Bottom, representative images of the migrating wound edge, with the initial and the final position of the edge denoted by the yellow and the green line, respectively. Cell migration rates were derived as the area covered over time by the cell layer within the field of view (calculated as the area between the yellow and the green lines). N = 20 (for β-actin); 22 (for γ-actin); 18 (for βc-γ-actin); 19 (for γc-β-actin). Independent experimental replicates (two or more) are indicated by different symbols within each cell population. One way non-parametric analysis of variance (ANOVA) yielded a p-value<0.0001 with multiple comparisons shown on the plot. Error bars represent mean ± 95% CI. *p<0.05, **p<0.01, ***p<0.001, and ****p<0.0001. See also Videos 1–4. Scale bars, 100 µm.
Figure 1—figure supplement 1
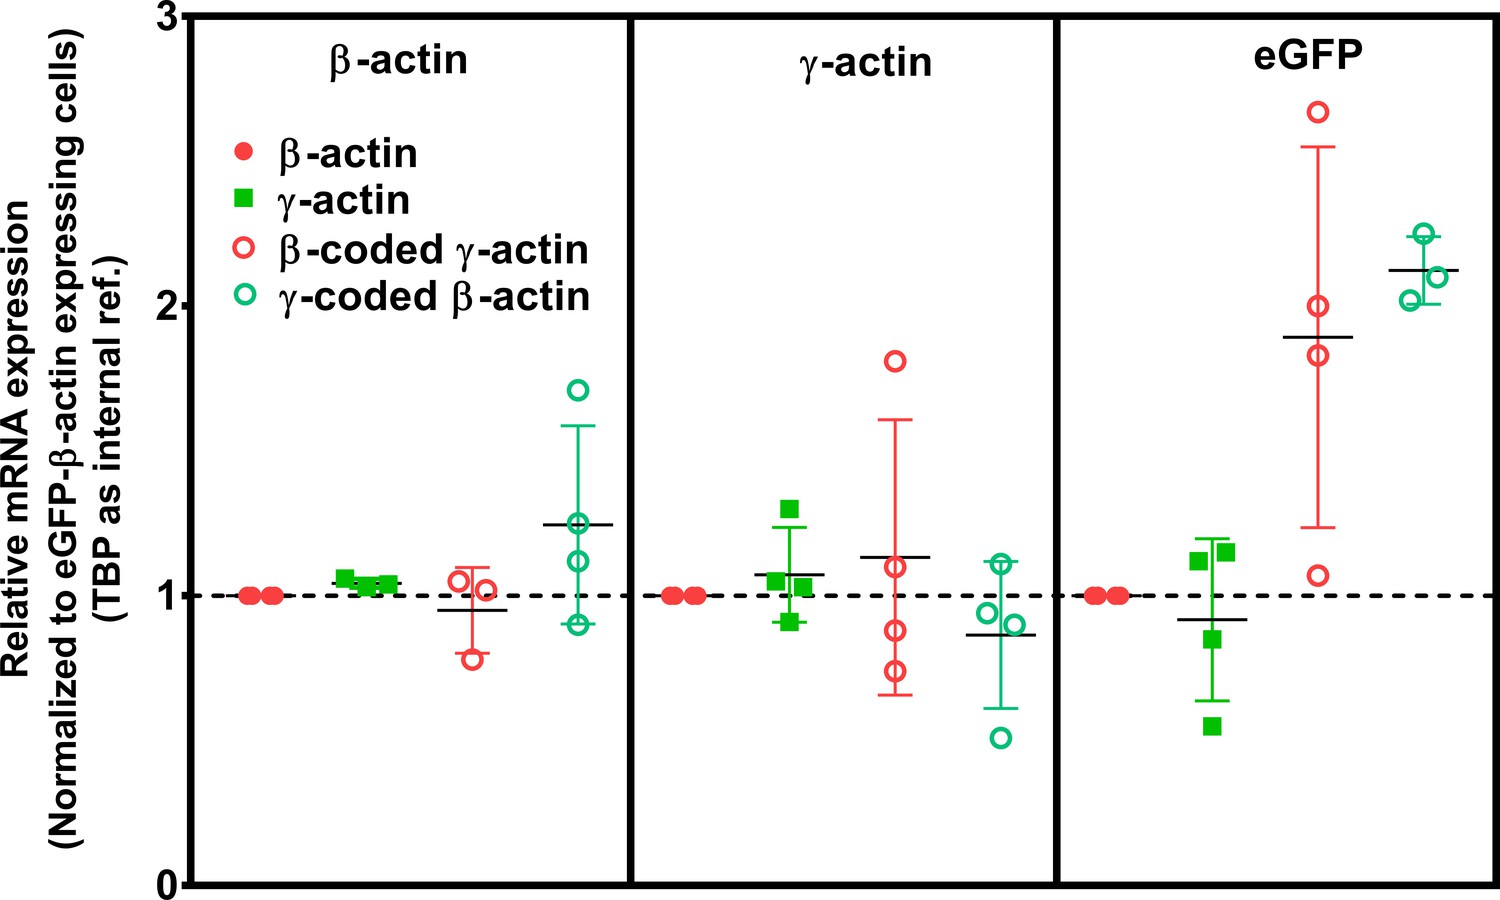
Cell transfection with actin isoforms does not perturb the endogenous levels of actin mRNA.
Data from the real-time PCR (quantitative PCR, or qPCR) of the four cell lines, using primer pairs detecting actin isoforms’ endogenous 3’UTRs and GFP. Each of the qPCR was repeated four times and outliers were excluded in Graphpad PRISM. The error bars represent 95% CI. One-way analysis of variance (ANOVA) indicated that there was a significant change only in the amount of eGFP mRNA (p=0.02), with multiple comparisons showing a significant change between β-actin and γ-coded β-actin only (p=0.02).
Figure 1—figure supplement 2
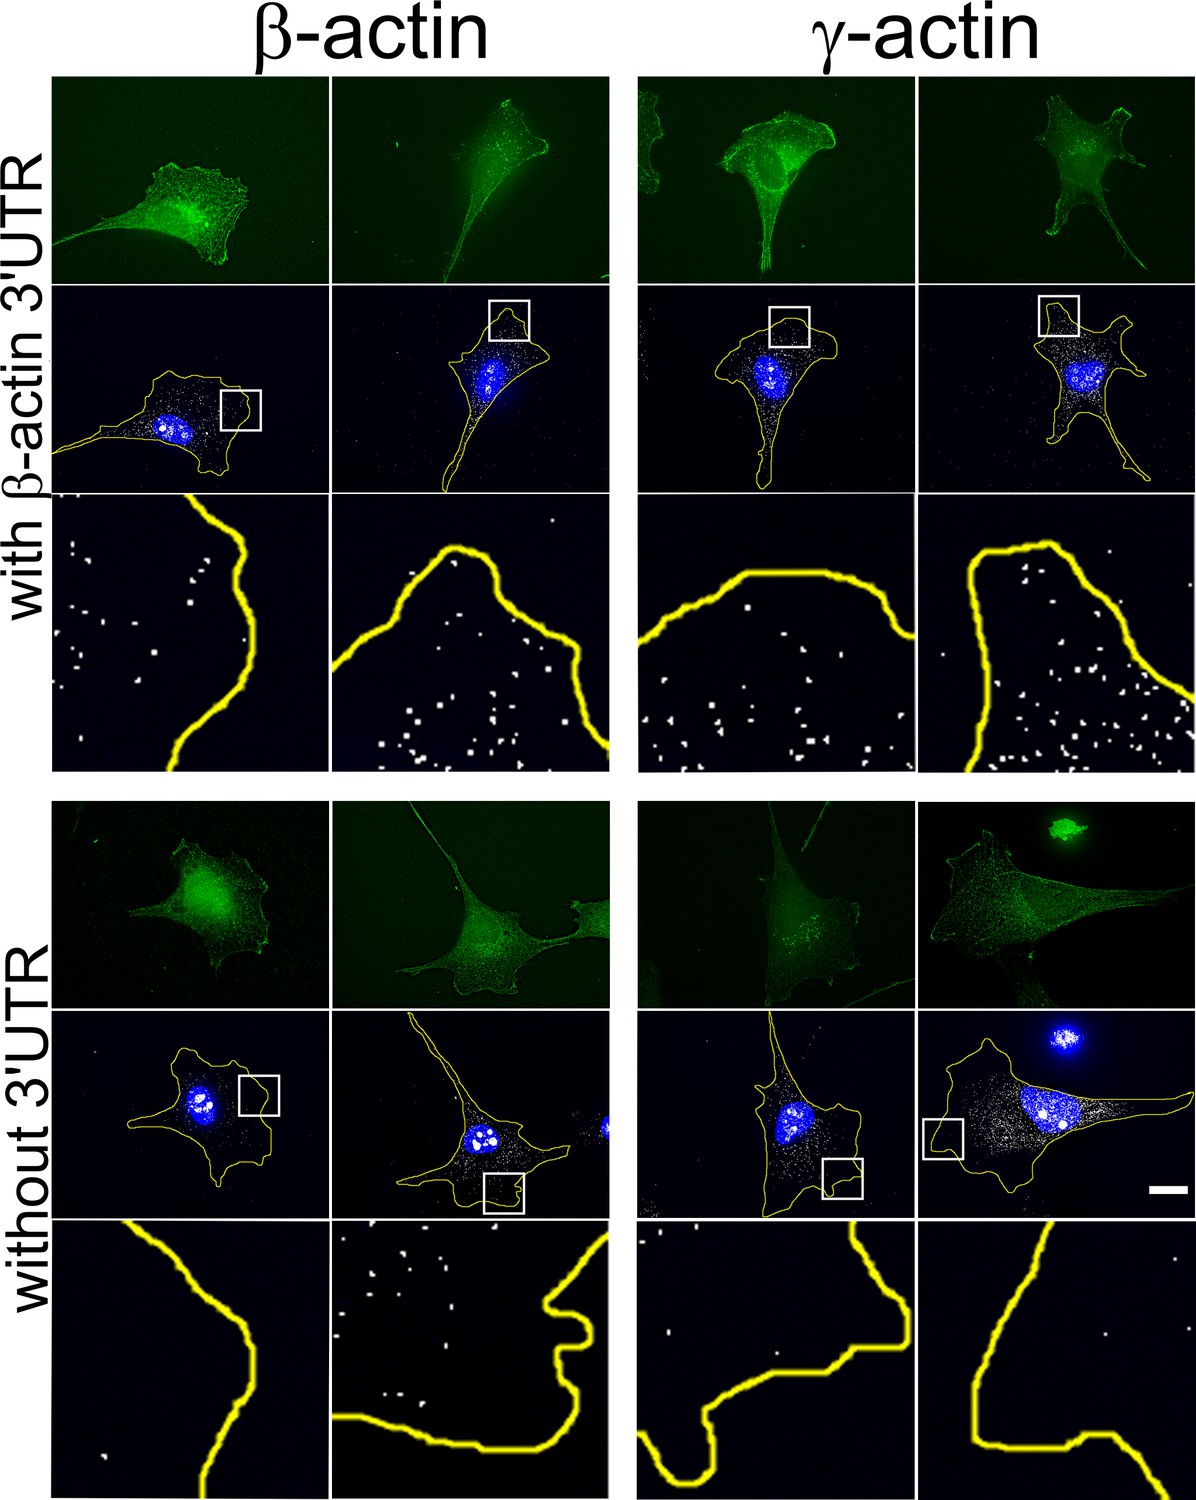
Transfected actin isoform mRNAs are targeted to the cell periphery via 3’UTR.
Images of GFP-actin-transfected cell lines with and without 3′UTR (as indicated on the left) visualized by GFP fluorescence (green), 4′,6-diamidino-2-phenylindole (DAPI) (blue), and GFP-encoding mRNA (white) detected using single-molecule fluorescence in situ hybridization (smFISH) probes against GFP mRNA. Insets show a zoom of the boxed areas in FISH images, showing localization of eGFP mRNA significantly more pronounced in the presence of β-actin 3′UTR. Scale bar, 20 µm.
Figure 1—figure supplement 3
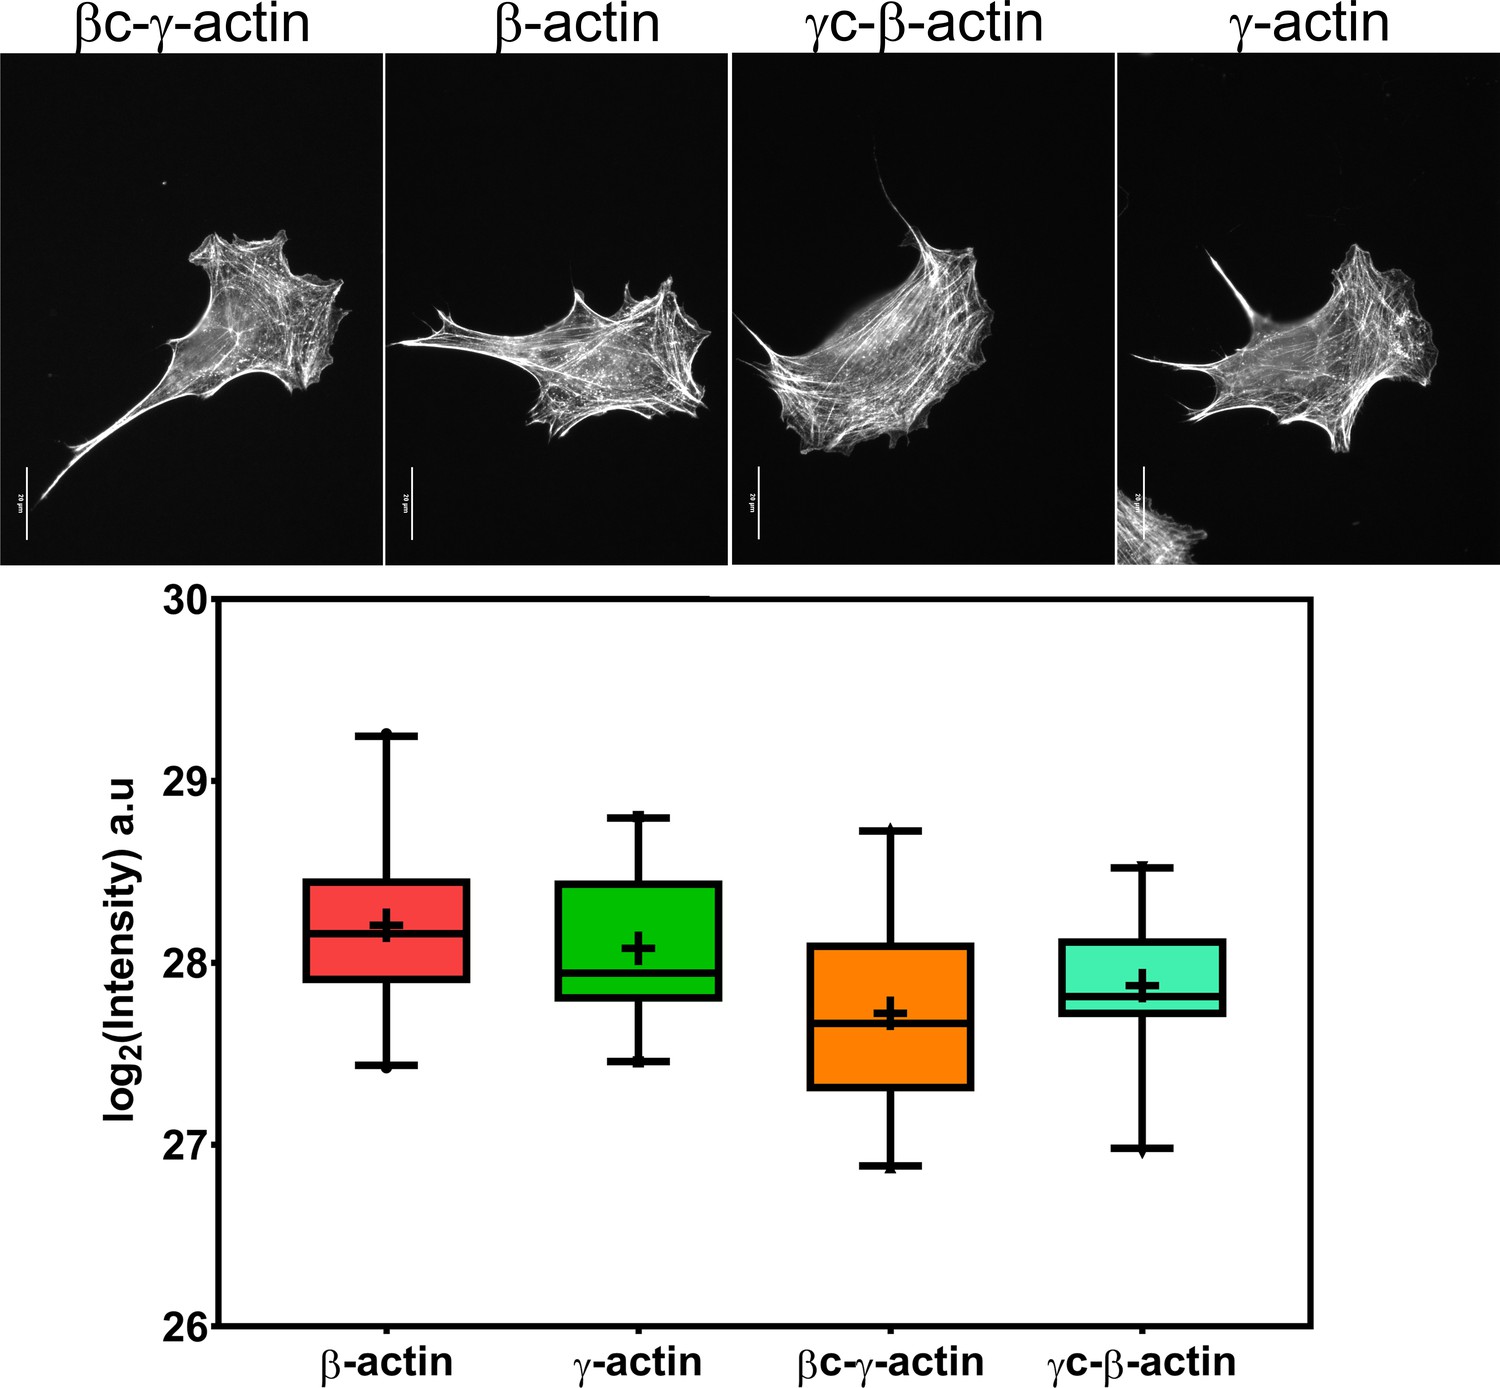
Cell transfection with actin isoforms does not perturb the level or distribution of the actin polymer.
(Top) Images of GFP-actin-transfected cell lines visualized by fluorescent phalloidin staining. (Bottom) Box and whisker plot of log2 (phalloidin intensity) in each cell line with error bars indicating 95% CI the mean. Scale bar = 20 µm. N = 20 each for β-actin, γ-actin, and γ-coded β-actin and 22 for β-coded γ-actin.
Figure 1—figure supplement 4
Expressing γ-actin with β-actin 3′UTR increases cell migration rate compared to expressing β-actin with β-actin 3′UTR.
Cell migration rate box plots showing untransfected (wild-type, WT), eGFP-β-actin (β-actin), and eGFP-γ-actin (γ-actin). The different symbols represent different scratch wounds.
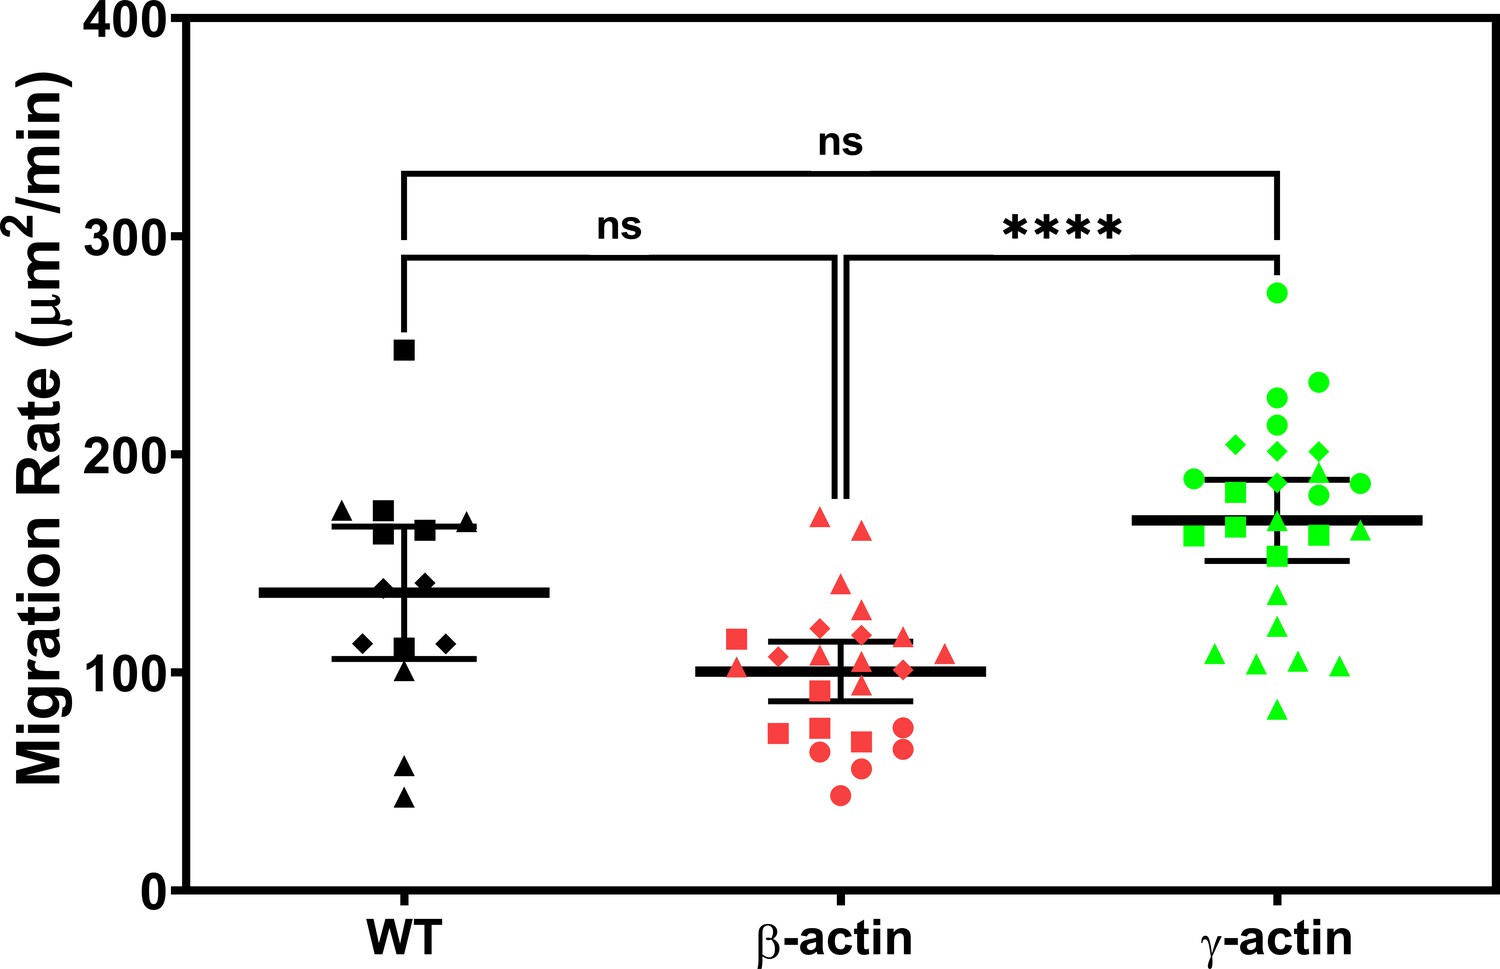
Figure 1—figure supplement 5
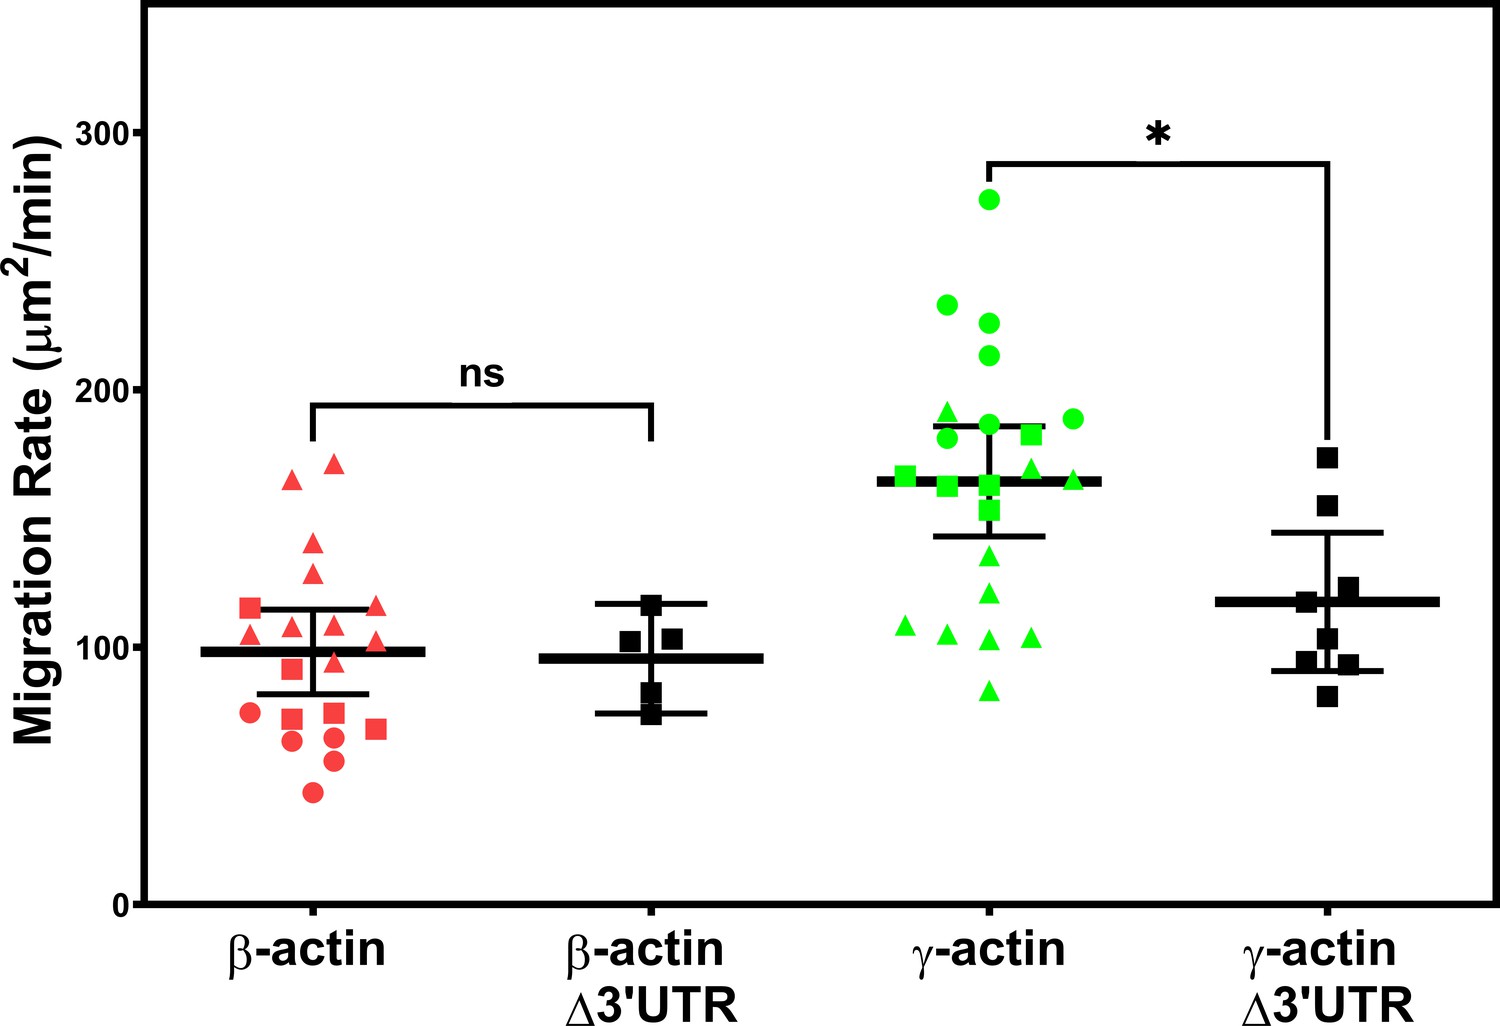
Expressing γ-actin with β-actin 3′UTR increases cell migration rate.
Migration rate plots of cell populations expressing different actin constructs, derived as area covered over time by the cell layer in the field of view as shown in Figure 1. Δ3′UTR denotes the constructs lacking the β-actin 3′UTR responsible for zipcode targeting. All other constructs contained the β-actin 3′UTR. Error bars represent mean ± 95% CI. Different symbols within each cell population represent different scratch wounds. Number of technical replicates: N = 5 (for β-actin Δ3′UTR); 8 (for γ-actin Δ3′UTR); 20 (for β-actin); 22 (for γ-actin). Results of unpaired t-test are indicated on the graph (*p<0.05).
Figure 2 with 2 supplements
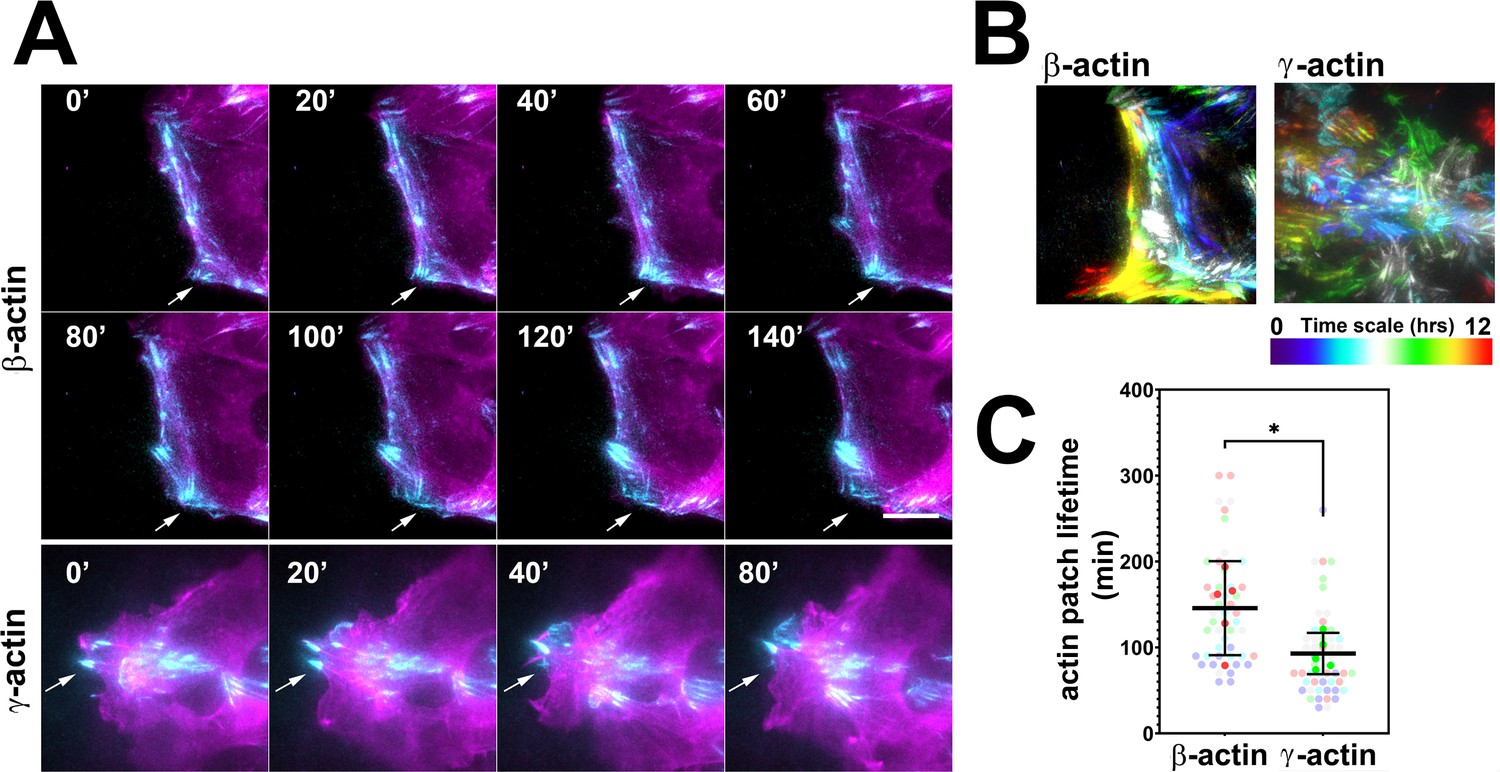
Actin isoforms have differential effects on focal adhesion dynamics.
(A) Montages of eGFP-β-actin- (top two rows) and eGFP-γ-actin (bottom row)-expressing cells undergoing wound healing following a scratch wound. Total internal reflection fluorescence microscopy (TIRF-M) images (cyan) are overlaid with widefield images (magenta). Scale bar = 10 µm. Arrows point to focal adhesions being formed and disassembled over time. (B) Maximum intensity projections of TIRF-M images of eGFP-actin over time for each of the β- and γ-actin-expressing cell populations during a 12-hr wound healing. Scale represents the temporal color scale. Note that β-actin persists longer in the TIRF plane as compared to γ-actin. (C) Actin patch lifetimes in the TIRF-M channel. Five fields of view for each cell population were used to estimate lifetimes (solid colors) with N = 50 (β-actin) and 53 (γ-actin) patches (transparent colors). Error bars represent mean ± 95% CI. Unpaired t-test gave a p-value<0.05.
Figure 2—figure supplement 1
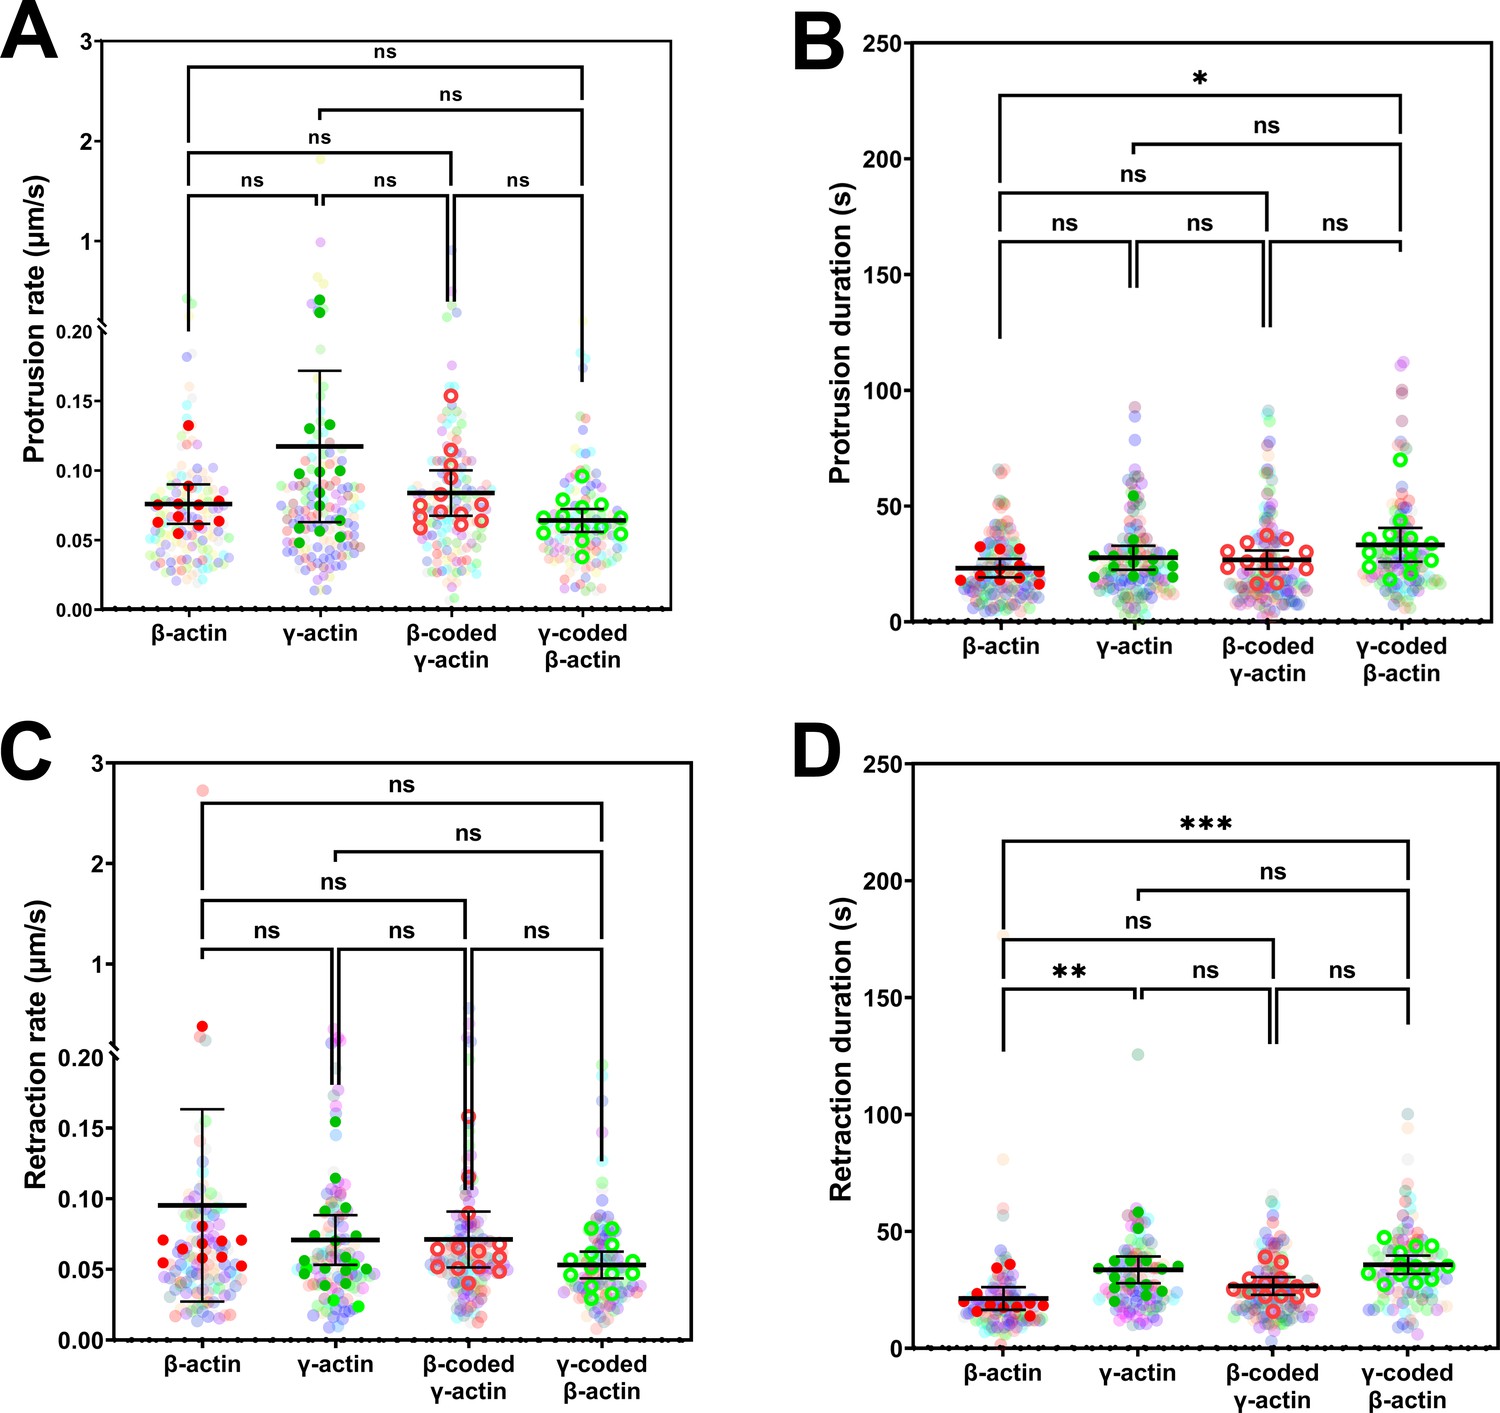
Protrusion and retraction dynamics of cells at wound edge during wound healing.
Super-plots of (A) protrusion rate, (B) protrusion duration, (C) retraction rate, and (D) retraction duration, measured from kymographs. Number of fields of view (indicated by the opaque data points in the above graphs, with the mean and 95% CI displayed) analyzed for each population: β-actin = 11, γ-actin = 14, β-coded γ-actin = 13, γ-coded β-actin = 14. Number of protrusions analyzed: β-actin = 139, γ-actin = 130, β-coded γ-actin = 143, γ-coded β-actin = 121. Number of retractions analyzed: β-actin = 112, γ-actin = 108, β-coded γ-actin = 124, γ-coded β-actin = 101. One-way non-parametric analysis of variance (ANOVA) (Kruskal-Wallis test) gave a p-value = 0.0798 (protrusion rate), 0.0540 (protrusion duration), 0.1065 (retraction rate), and 0.0002 (retraction duration) with multiple comparisons shown on the plot. *p<0.05, **p<0.01, and ***p<0.001.
Figure 2—figure supplement 2
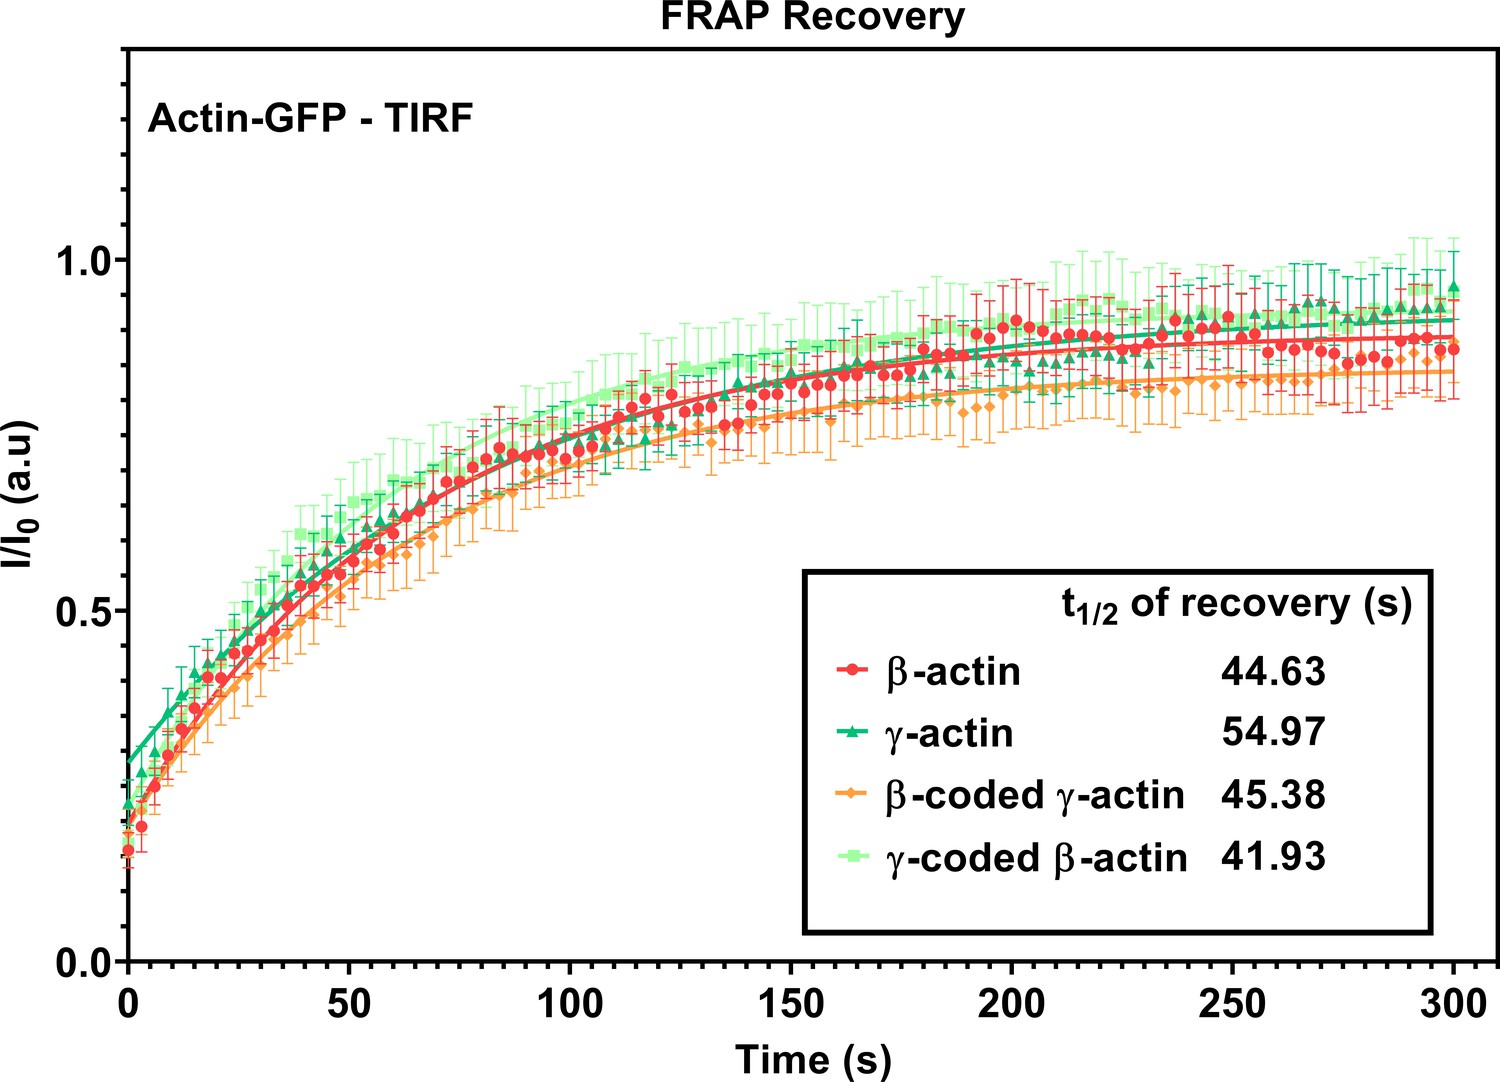
FRAP recovery curves for actin patches in cells at wound edge during wound healing imaged in TIRF-M.
Fluorescence recovery after photobleaching (FRAP) curves for the recovery of actin bleached at the focal adhesions. t1/2 of recovery for each actin variant is listed in the inset. N = 8 (β-actin), 10 (γ-actin), 10 (β-coded γ-actin), and 9 (γ-coded β-actin) actin patches. Each data set was fit to a one-phase association curve. R-squared values ranged from 0.52 to 0.62. A single curve was unable to fit all data sets, indicating that the recovery curves were different from each other (p-value<0.0001). The half-life of recovery for each curve derived from the fit is β-actin = 44.63 s, γ-actin = 54.97 s, β-coded γ-actin = 45.38 s, and γ-coded β-actin = 41.93 s. Error bars are SEM.
Figure 3 with 8 supplements
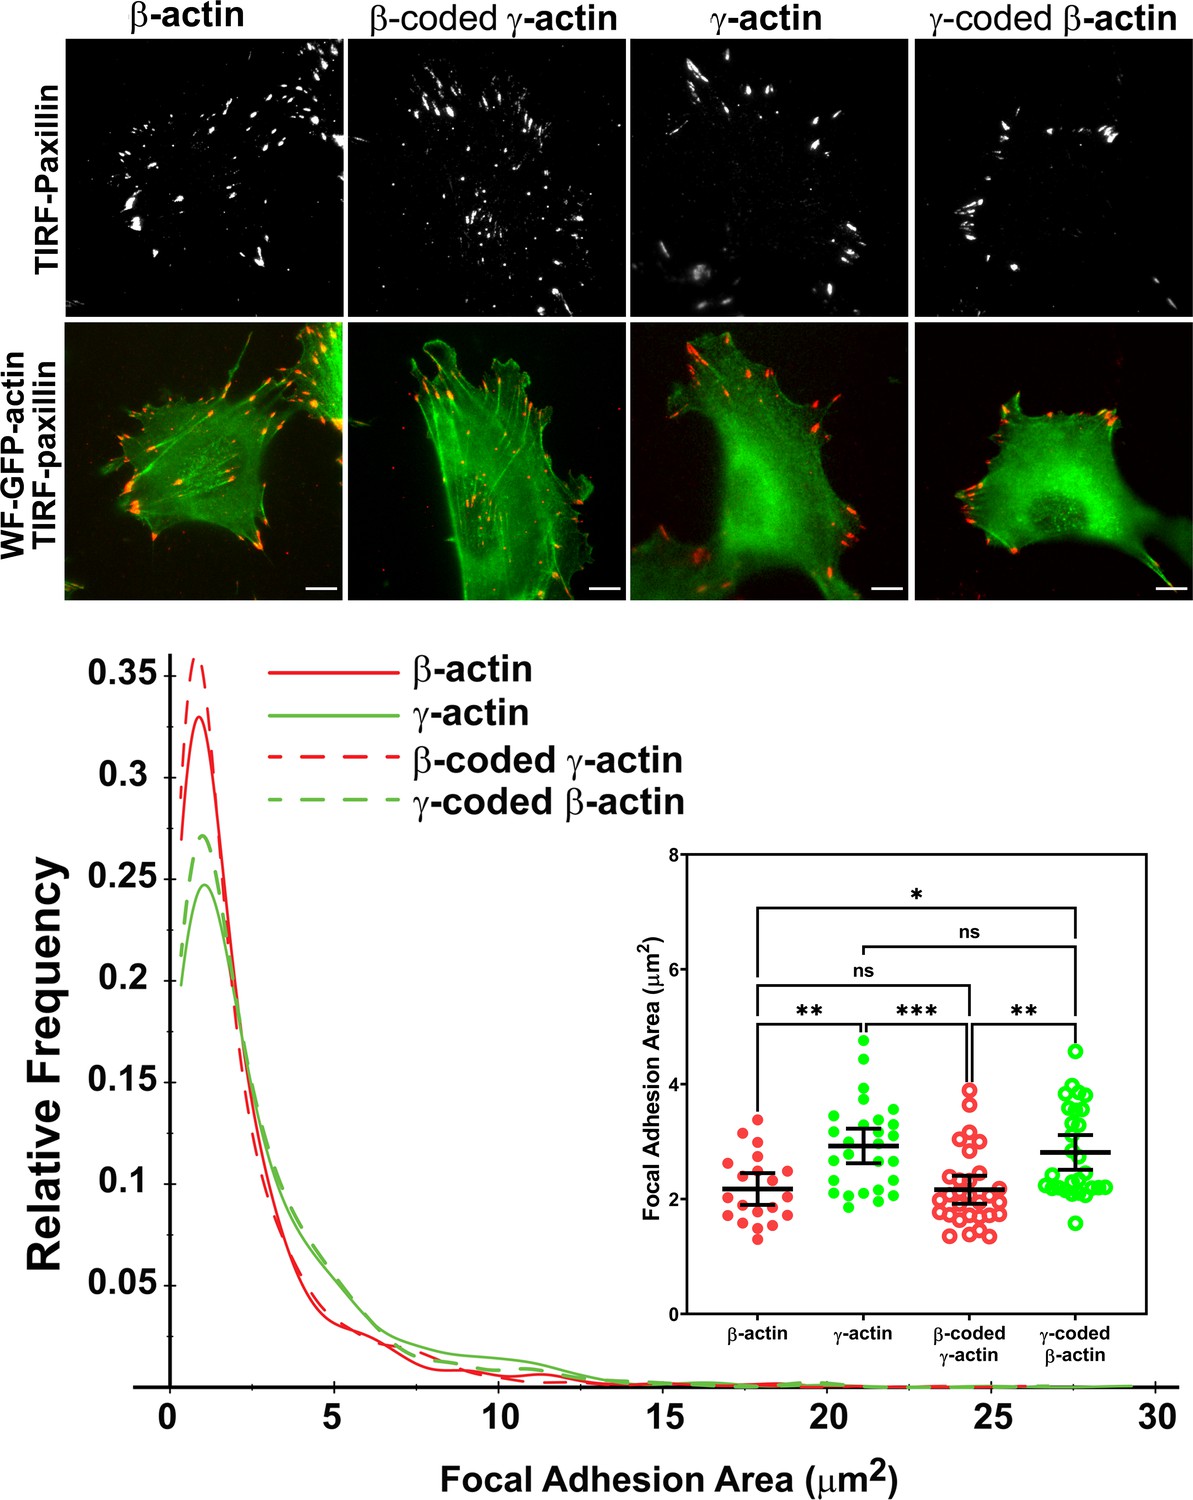
Actin isoform coding sequence affects the overall size and distribution of focal adhesions.
Top, representative images of eGFP-actin-transfected cells stained with anti-paxillin to visualize focal adhesions. Total interference reflection fluorescence microscopy (TIRF-M) images of paxillin staining are shown alone (top) and as an overlay with widefield eGFP signals (bottom). Bottom, quantification of focal adhesion size in the four different cell populations, shown as a distribution plot (for all focal adhesions analyzed) and as a scatter plot (for individual cells) in the inset. Scale bar = 10 µm. β-actin = 20, γ-actin = 28, β-coded γ-actin = 30, and γ-coded β-actin = 29 cells with N = 996, 786, 1245, and 1041 focal adhesions for the respective cell types. Results for non-parametric one-way analysis of variance (ANOVA) with multiple comparisons are indicated on the graph.
Figure 3—figure supplement 1
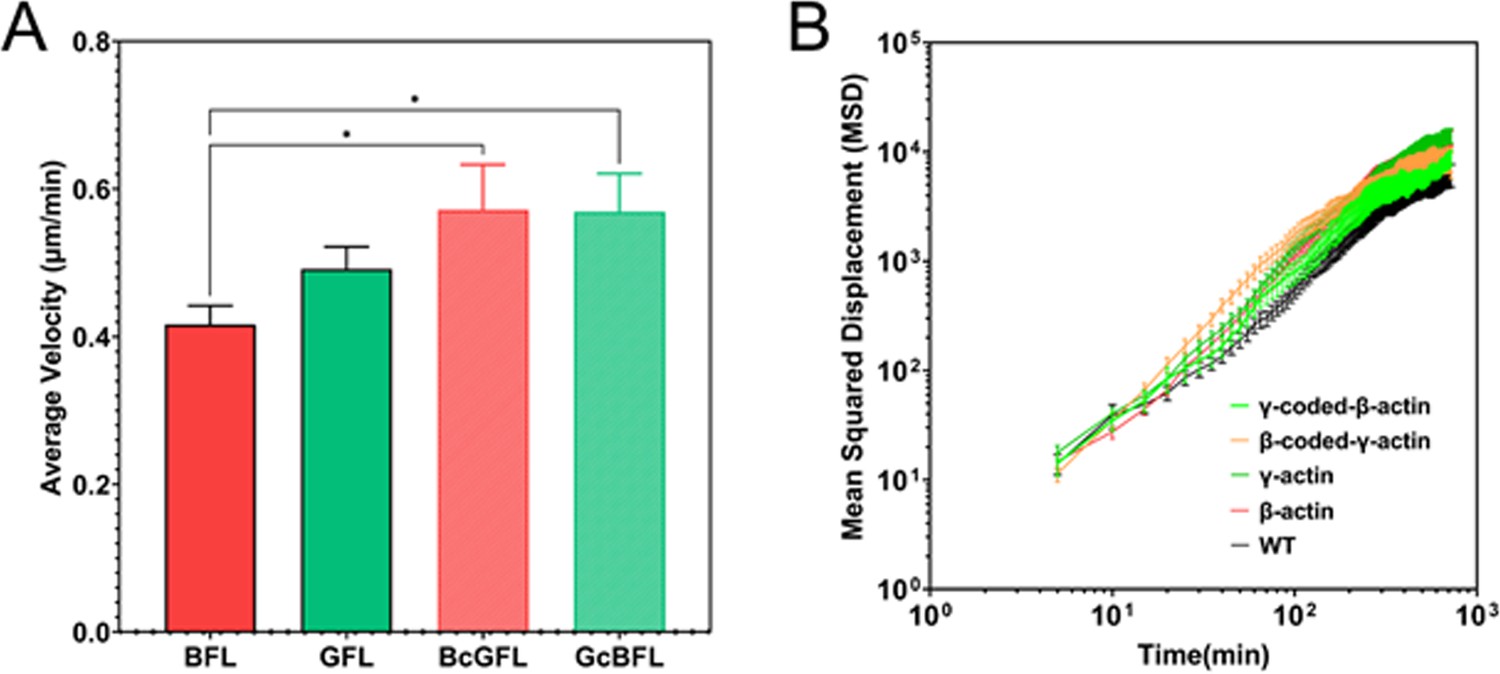
Single-cell motility is not dependent on actin isoform coding or amino acid sequences.
(A) Average velocity plots for single-cell migration in sparse cultures over a 3-hr period. One-way parametric analysis of variance (ANOVA) yielded a p-value = 0.0191, with multiple comparisons shown on the plot. *p<0.05. (B) Log-log plots of Mean Squared Displacement vs time for each of the cell lines indicated on the graph. Number of cells: β-actin = 86, γ-actin = 121, β-coded γ-actin = 97, γ-coded β-actin = 69, untransfected (WT) = 100.
Figure 3—figure supplement 2
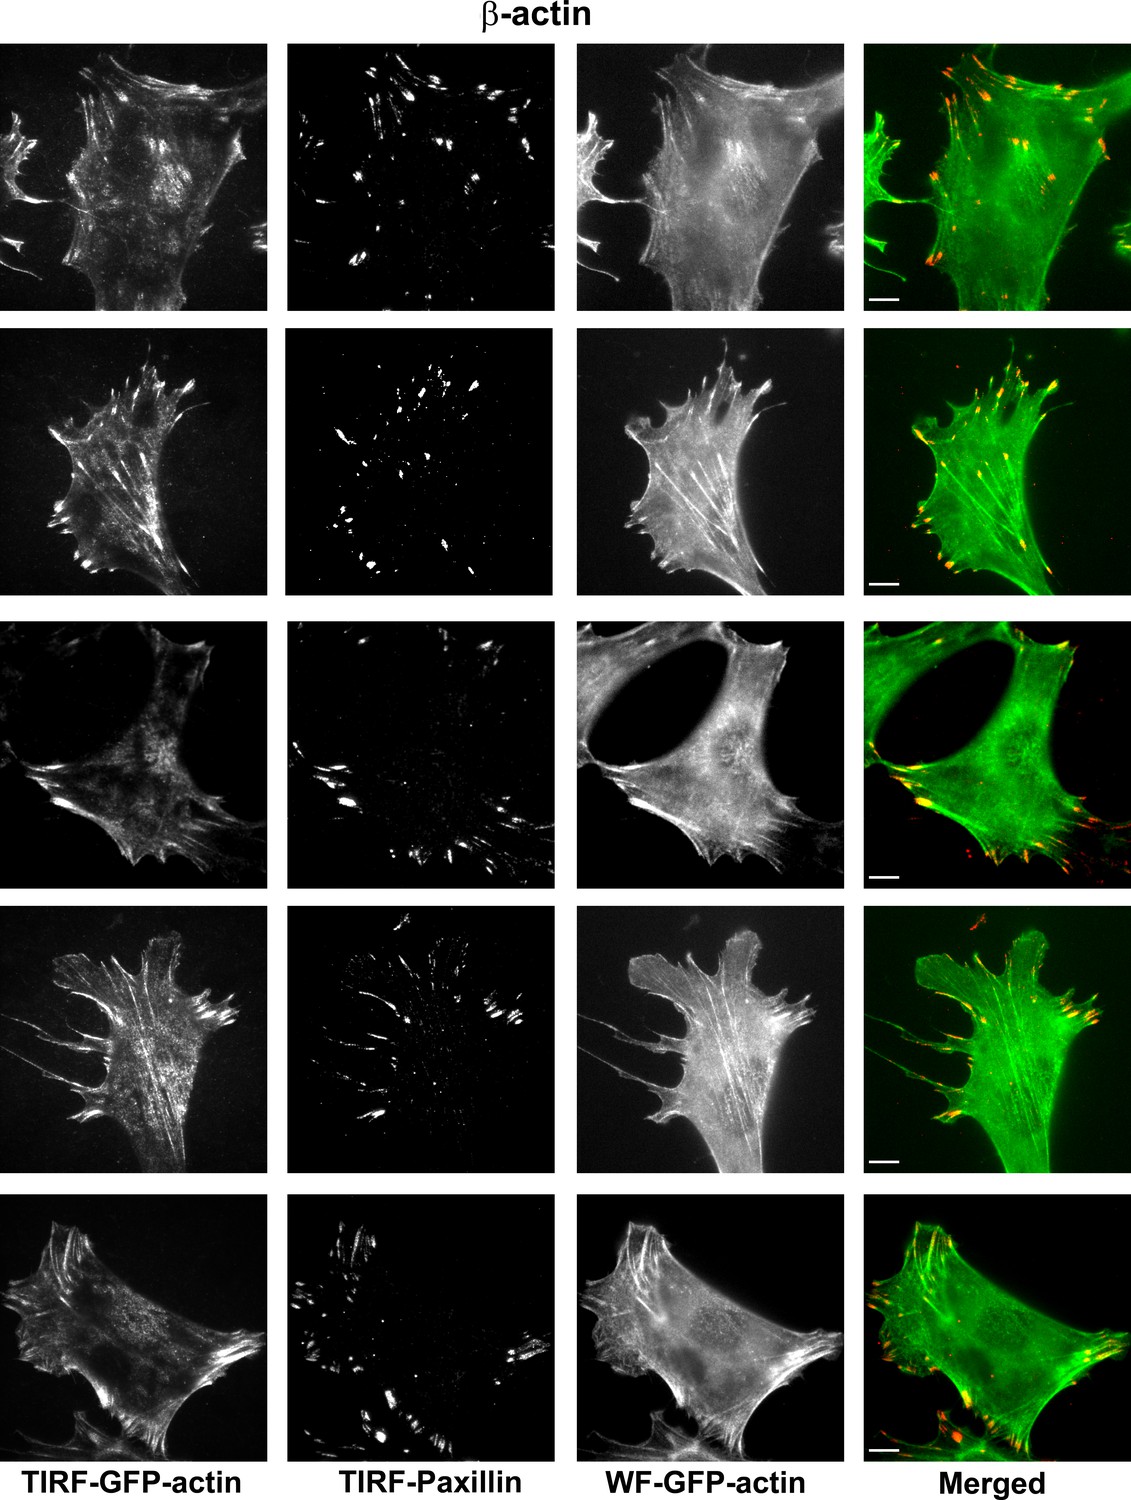
Representative images of paxillin and eGFP-actin distribution in cells stably transfected with eGFP-β-actin.
Scale bar, 10 µm.
Figure 3—figure supplement 3
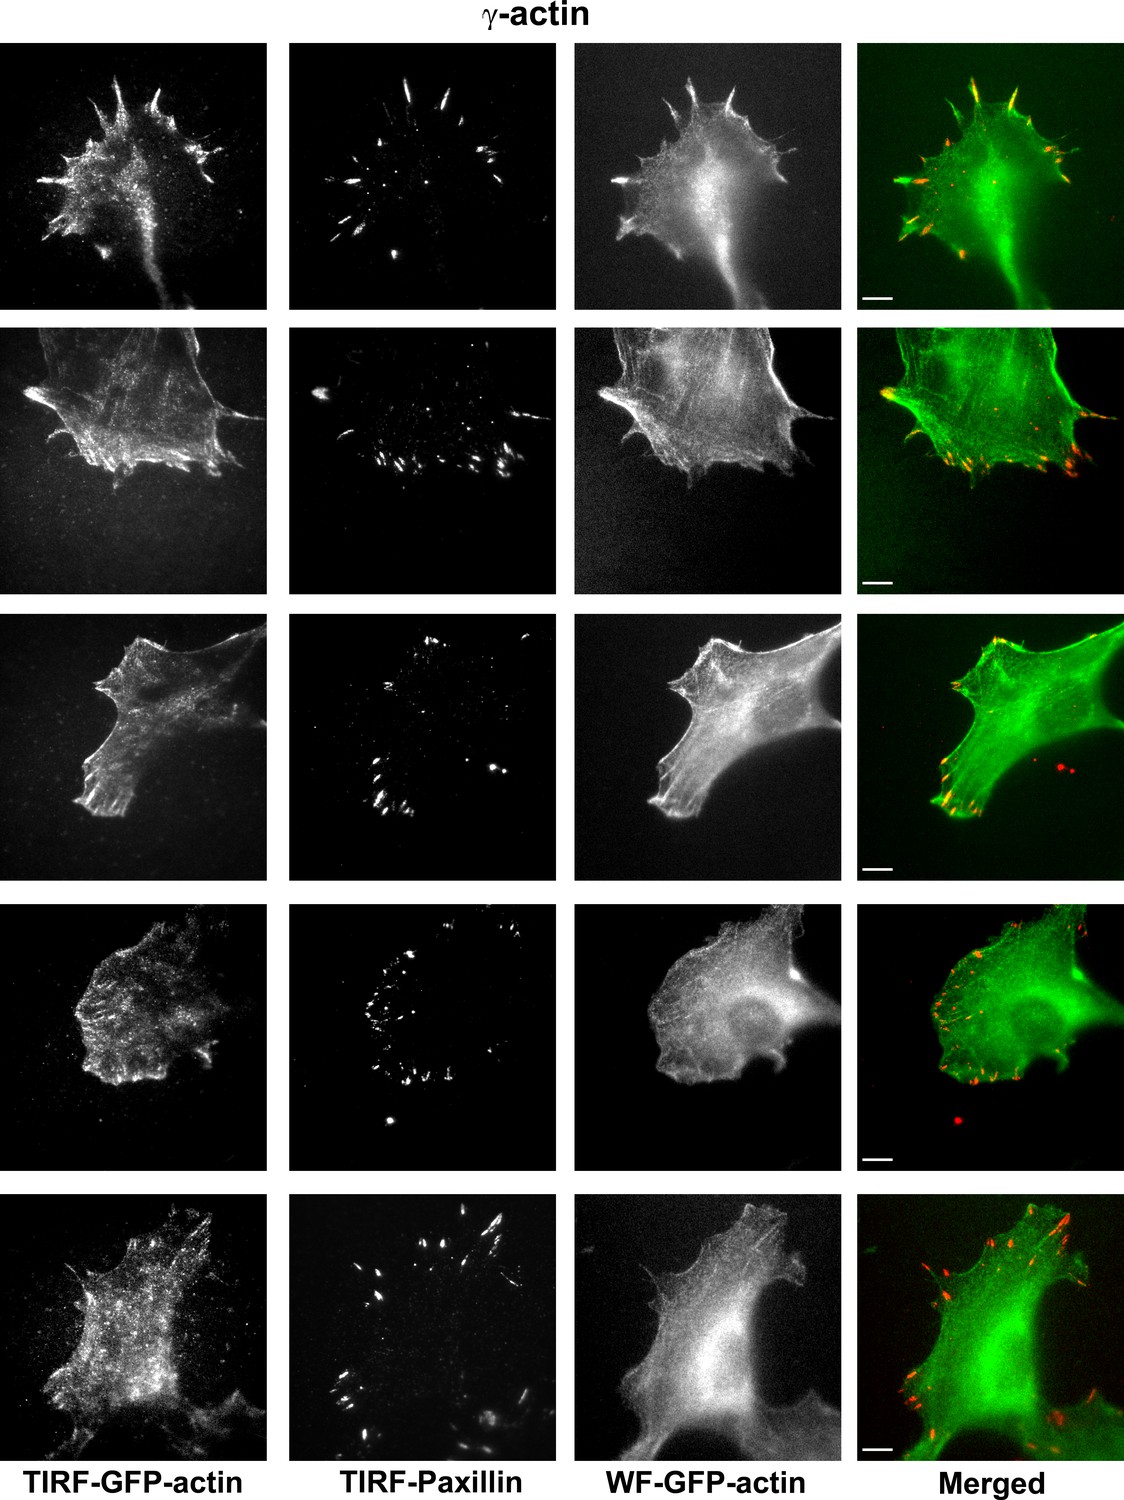
Representative images of paxillin and eGFP-actin distribution in cells stably transfected with eGFP-γ-actin.
Scale bar, 10 µm.
Figure 3—figure supplement 4
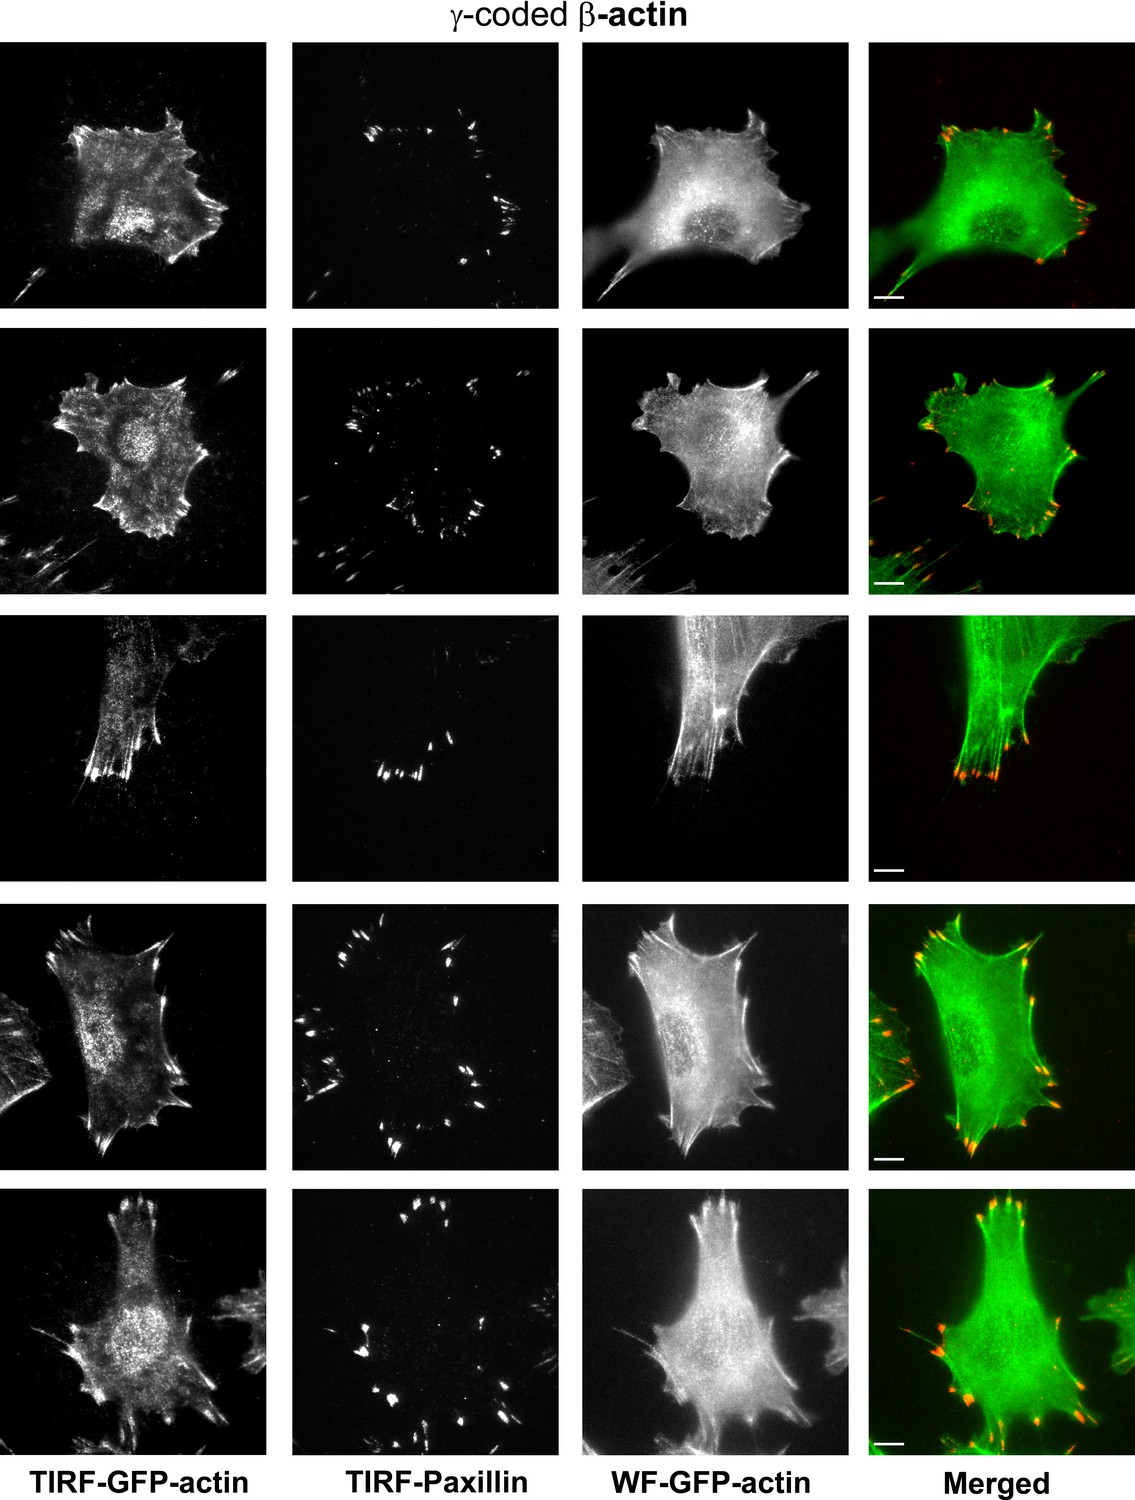
Representative images of paxillin and eGFP-actin distribution in cells stably transfected with eGFP-γ-coded β-actin.
Scale bar, 10 µm.
Figure 3—figure supplement 5
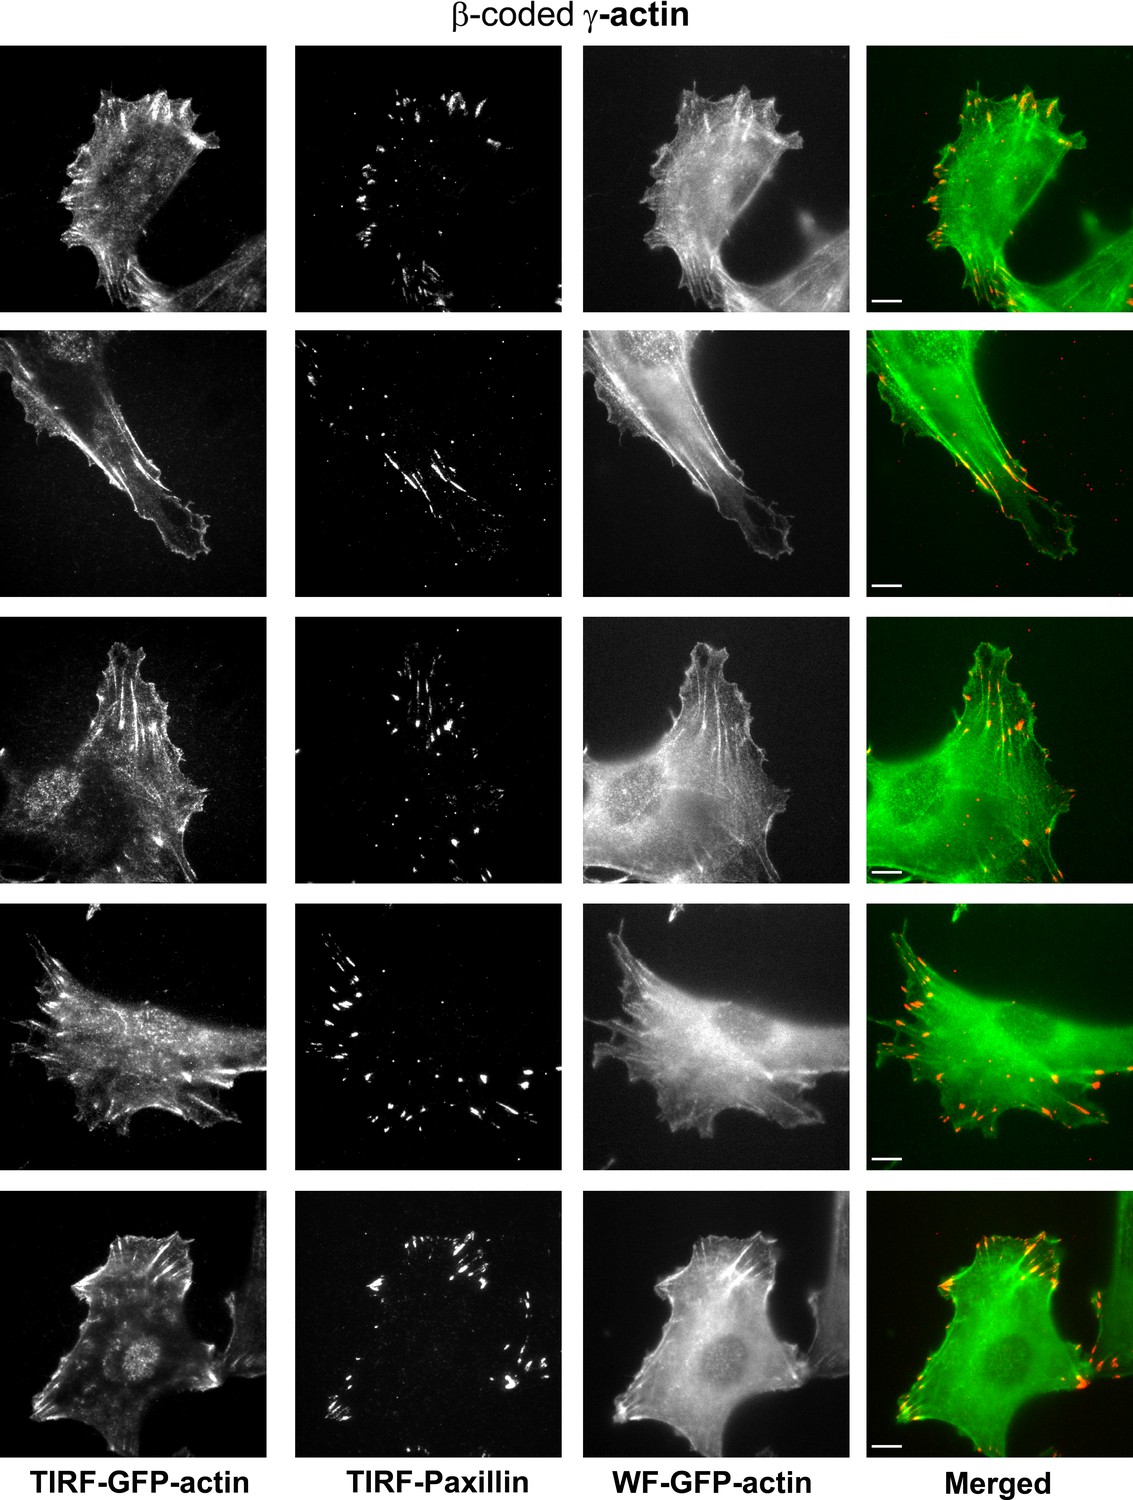
Representative images of paxillin and eGFP-actin distribution in cells stably transfected with eGFP-β-coded γ-actin.
Scale bar, 10 µm.
Figure 3—figure supplement 6
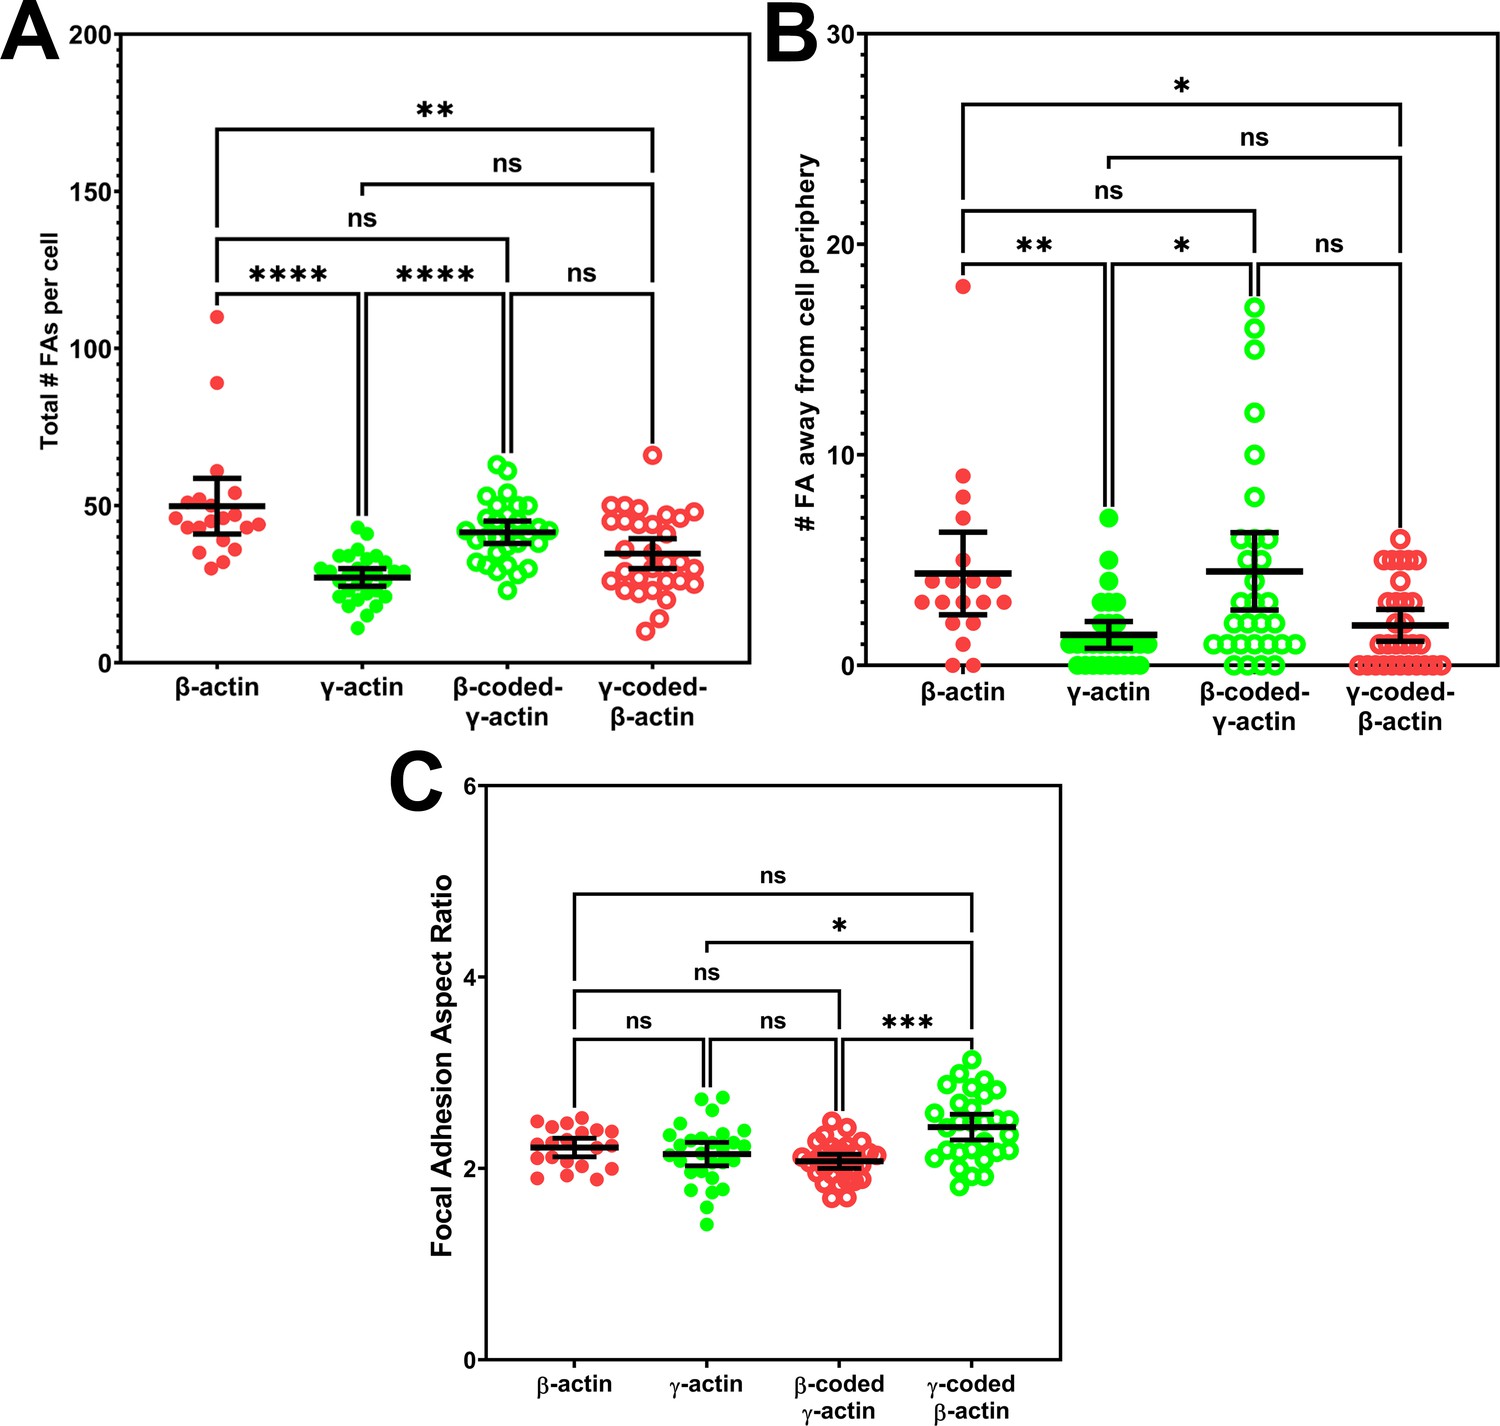
Quantification of focal adhesion distribution and shape.
(A) Total number of focal adhesions per cell. (B) Number of focal adhesions away from cell periphery. (C) Average focal adhesion aspect ratio for each cell. Each data point represents a single cell with β-actin = 20, γ-actin = 28, β-coded γ-actin = 30, and γ-coded β-actin = 29 cells. One-way non-parametric analysis of variance (ANOVA) (Kruskal-Wallis test) results are as follows: total number of focal adhesions:<0.0001, number of focal adhesions away from cell periphery: 0.0012, and focal adhesion aspect ratios: 0.0003. Results of multiple comparisons are indicated on the plots with *p<0.05, **p<0.01, ***p<0.001, and ****p<0.0001. Error bars represent mean ± 95% CI.
Figure 3—figure supplement 7
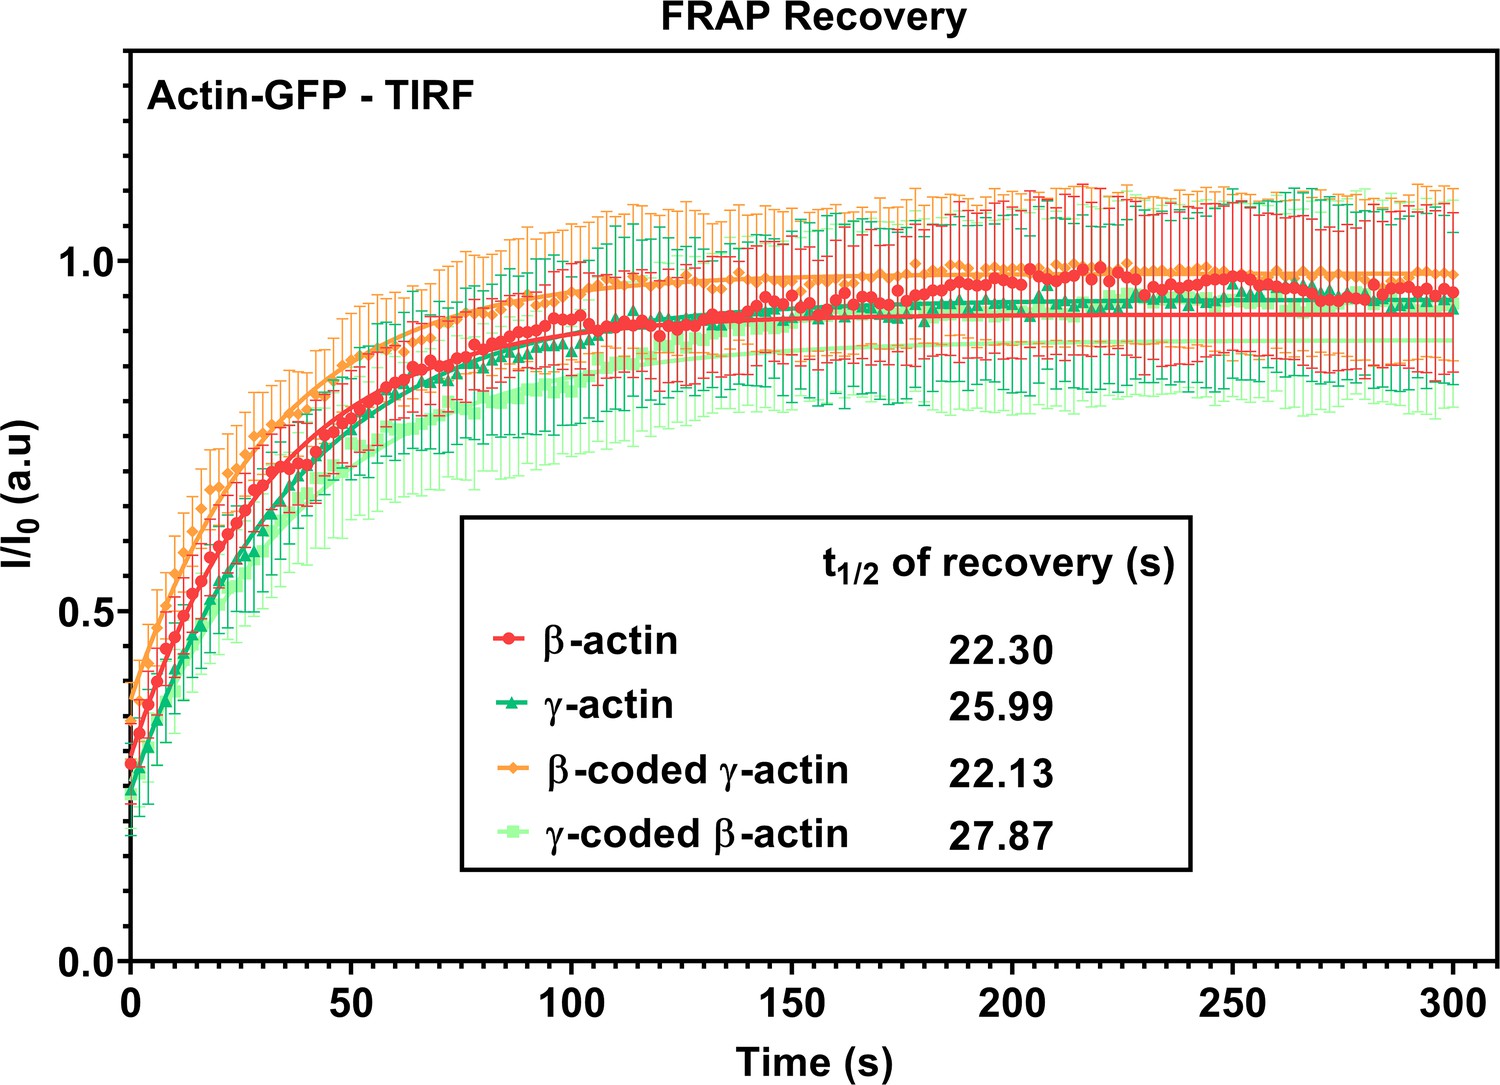
FRAP recovery curves for actin patches in single-cell cultures imaged in TIRF-M.
Fluorescence recovery after photobleaching (FRAP) curves for the recovery of actin bleached at the focal adhesions. N = 15 actin patches for each cell line. Each data set was fit to a one-phase association curve. R-squared values ranged from 0.36 to 0.59. A single curve was unable to fit all data sets, indicating the recovery curves were different from each other (p-value<0.0001). The half-life of recovery for each curve derived from the fit is β-actin = 22.30 s, γ-actin = 25.99 s, β-coded γ-actin = 22.13 s, and γ-coded β-actin = 27.87 s. Error bars are SEM.
Figure 3—figure supplement 8
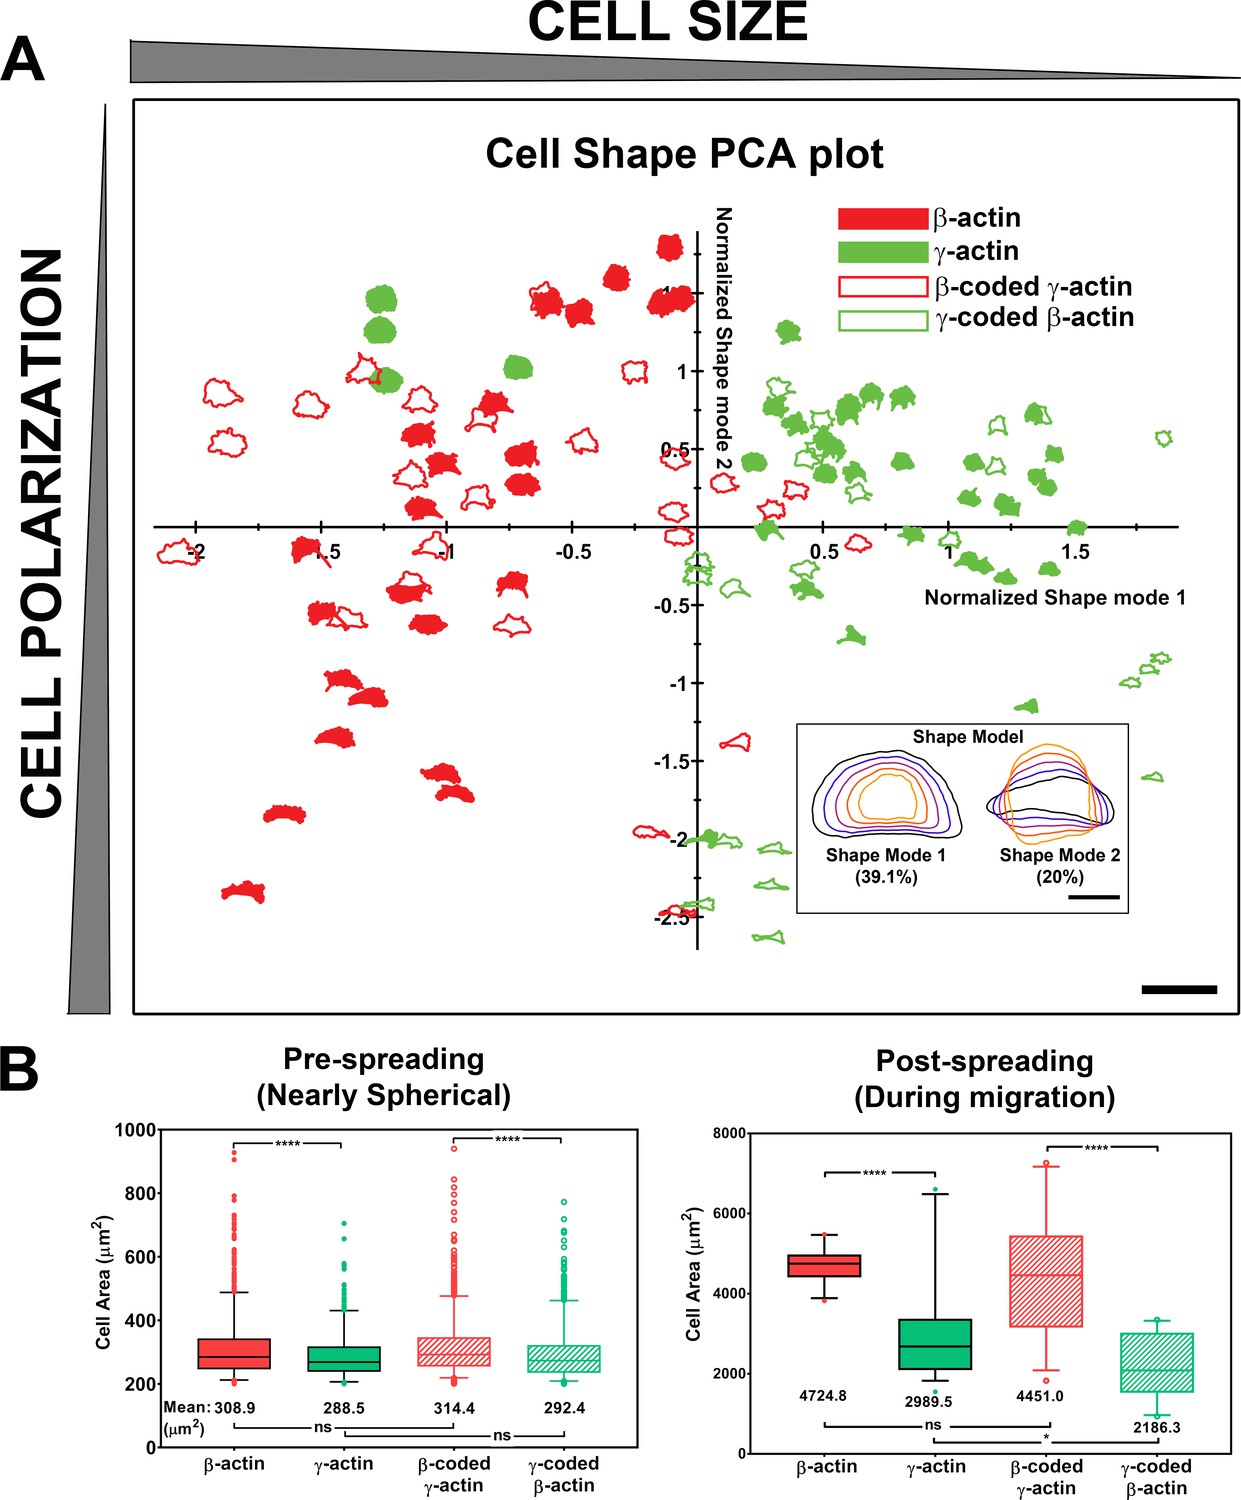
Actin isoforms confer differential effects on cell shape and spreading.
(A) Principal component analysis (PCA) plot classifying cell shapes from the four cell lines listed on top right according to the shape modes shown in the insert on bottom right. Shapes in the chart represent the actual cell outlines, with the size (Shape Mode 1) decreasing from left to right and the polarization variance (Shape Mode 2) spreading along the y-axis. Scale bars, 250 µm, and inset, 50 µm. (B) Quantification of the area of spherical trypsinized cells (left, N = 1230, 600, 1096, and 925) and the footprint of the cells spread on the substrate (right, N = 25, 36, 27, and 23). Results of one-way analysis of variance (ANOVA) with multiple comparisons are indicated on the graph.
Figure 4 with 2 supplements
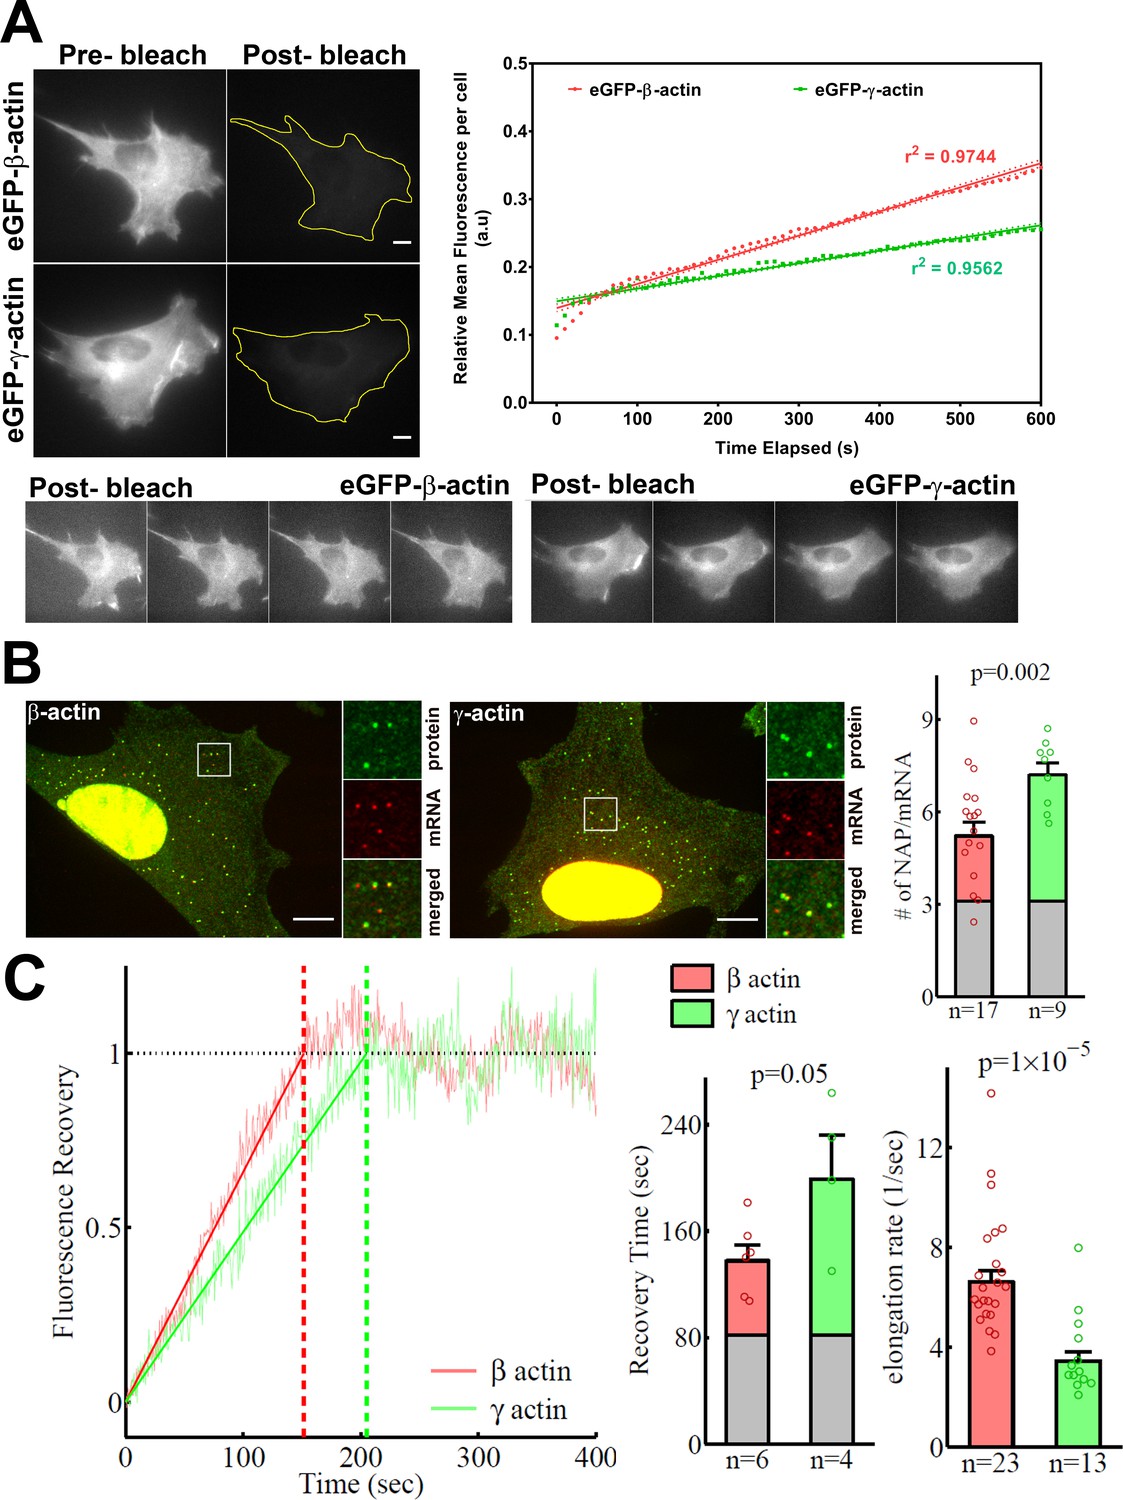
β-actin accumulates in cells faster than γ-actin and exhibits faster translation elongation.
(A) Images and quantification of GFP fluorescence in cells before and after photobleaching the entire intracellular GFP signal. Top left panels show representative cells before and after photobleaching, with gray levels scaled to show the actual difference in signal intensity. Top right graph shows the fluorescence recovery after photobleaching (FRAP) curve during the first 10 min post-bleach. Data points are dots and the linear regression curves are in bold (with dotted lines representing the 95% confidence bands). N = 8 for eGFP-β-actin and N = 10 for eGFP-γ-actin. Bottom, post-bleached images of cells taken at 2.5′ intervals from 0′ (left) to 10′ (right), with the gray levels scaled up to enhance the residual eGFP signal. Scale bars = 10 µm. (B) Left: representative images of actin protein and mRNA used for the experiments. Insets on the right of each image show the enlarged region indicated in the image on the left. Right: quantification of ribosomes per mRNA, calculated as the SunTag signal from the nascent peptides (NAPs) at each translation site divided by the HaloTag signal from the mRNA. (C) Left: FRAP curves showing recovery of the green fluorescence signal in individual translation spots. Right: fluorescence recovery time for each actin isoform and translation elongation rate (amino acids/s) calculated from the fluorescence recovery and NAPs/RNA. (B) and (C) right: gray boxed area at the bottom of each bar indicates the contribution from SunTag, the auxin-induced degron (AID), and linker portion of the construct (see 'Materials and methods'), and p-values are from one-tailed Welch’s t-test. Error bars represent SEM for n data points, calculated geometrically and plotted in a linear fashion.
Figure 4—figure supplement 1
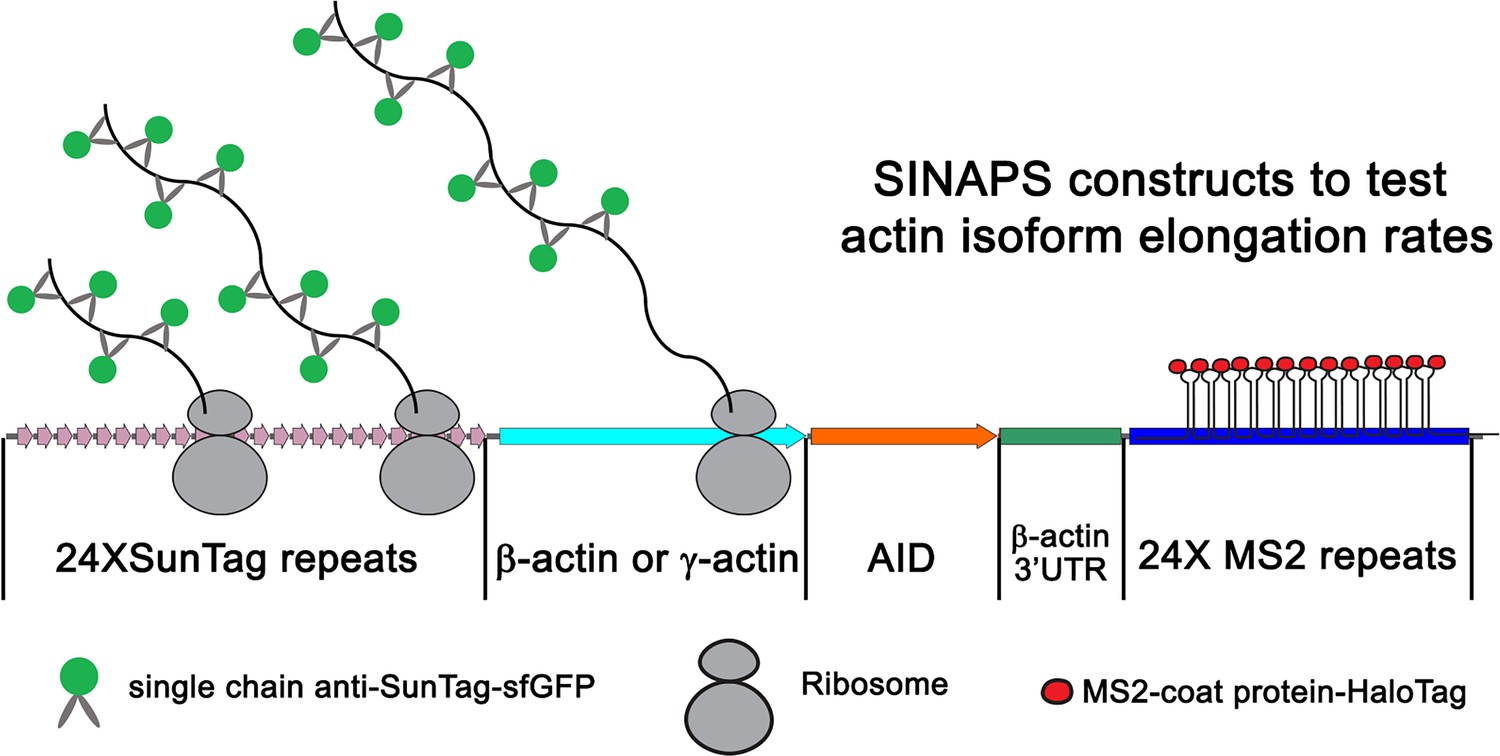
Illustration of single-molecule imaging of nascent peptide synthesis for β- and γ-actin.
The 5′ end of the construct encodes 24 Suntag repeats, each of which upon translation binds to sfGFP-fused anti-Suntag antibody fragment expressed in the cells. This is followed by the β- or γ-actin coding sequence. This is then followed by Auxin-induced degron, which once translated targets the nascent peptide for degradation. The construct also contains the β-actin 3′UTR required for mRNA zipcode-mediated targeting to the leading edge. Lastly, the construct encodes 24 MS2 repeats each, which bind to MS2 coat-binding protein fused to Halo-Tag. These MS2 repeats were used to visualize the mRNA of single-molecule imaging of nascent peptide synthesis (SINAPS) constructs.
Figure 4—figure supplement 2
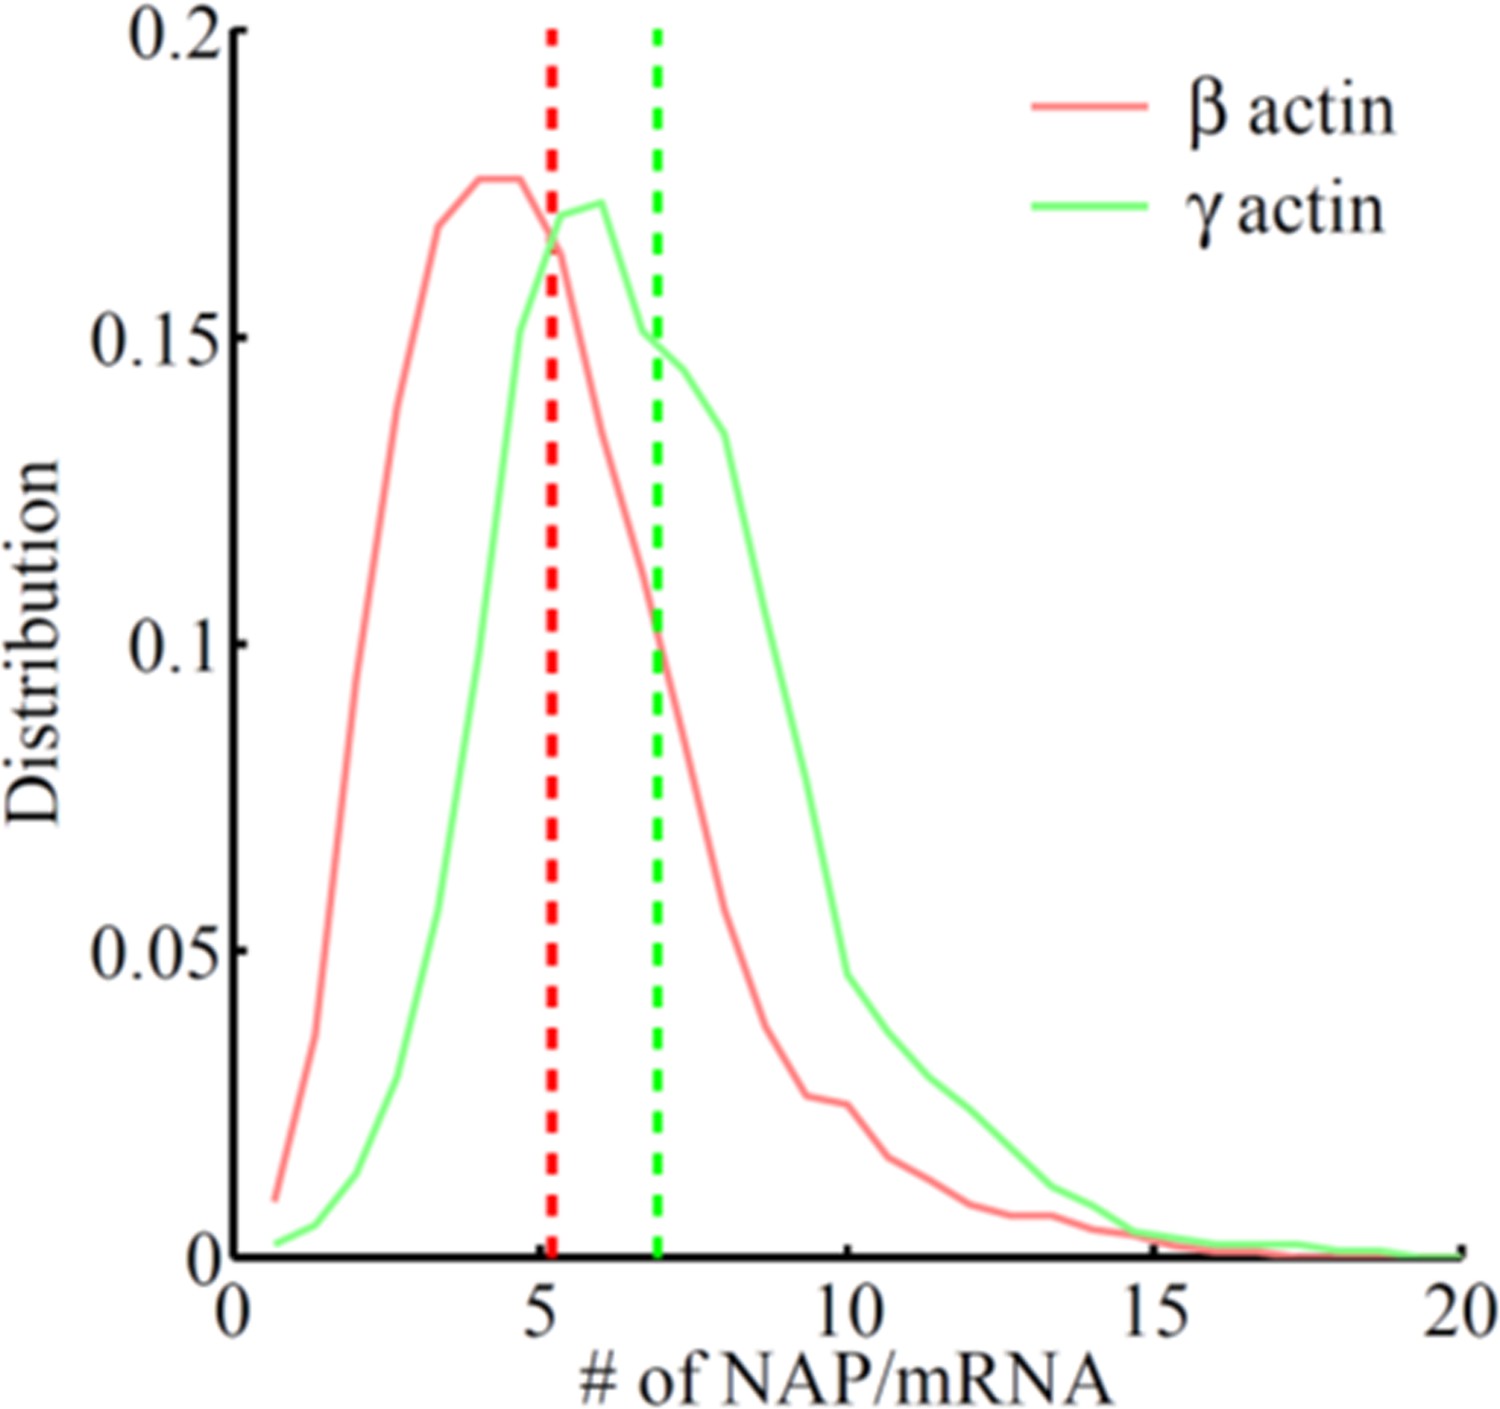
Frequency distribution of the number of nascent peptides per mRNA on SINAPS constructs of β-actin (red) or γ-actin (green).
The number of nascent peptides (NAPs)/mRNA is higher for γ-actin, indicating that γ-actin translation elongation is slower than that of β-actin.
Figure 5 with 1 supplement
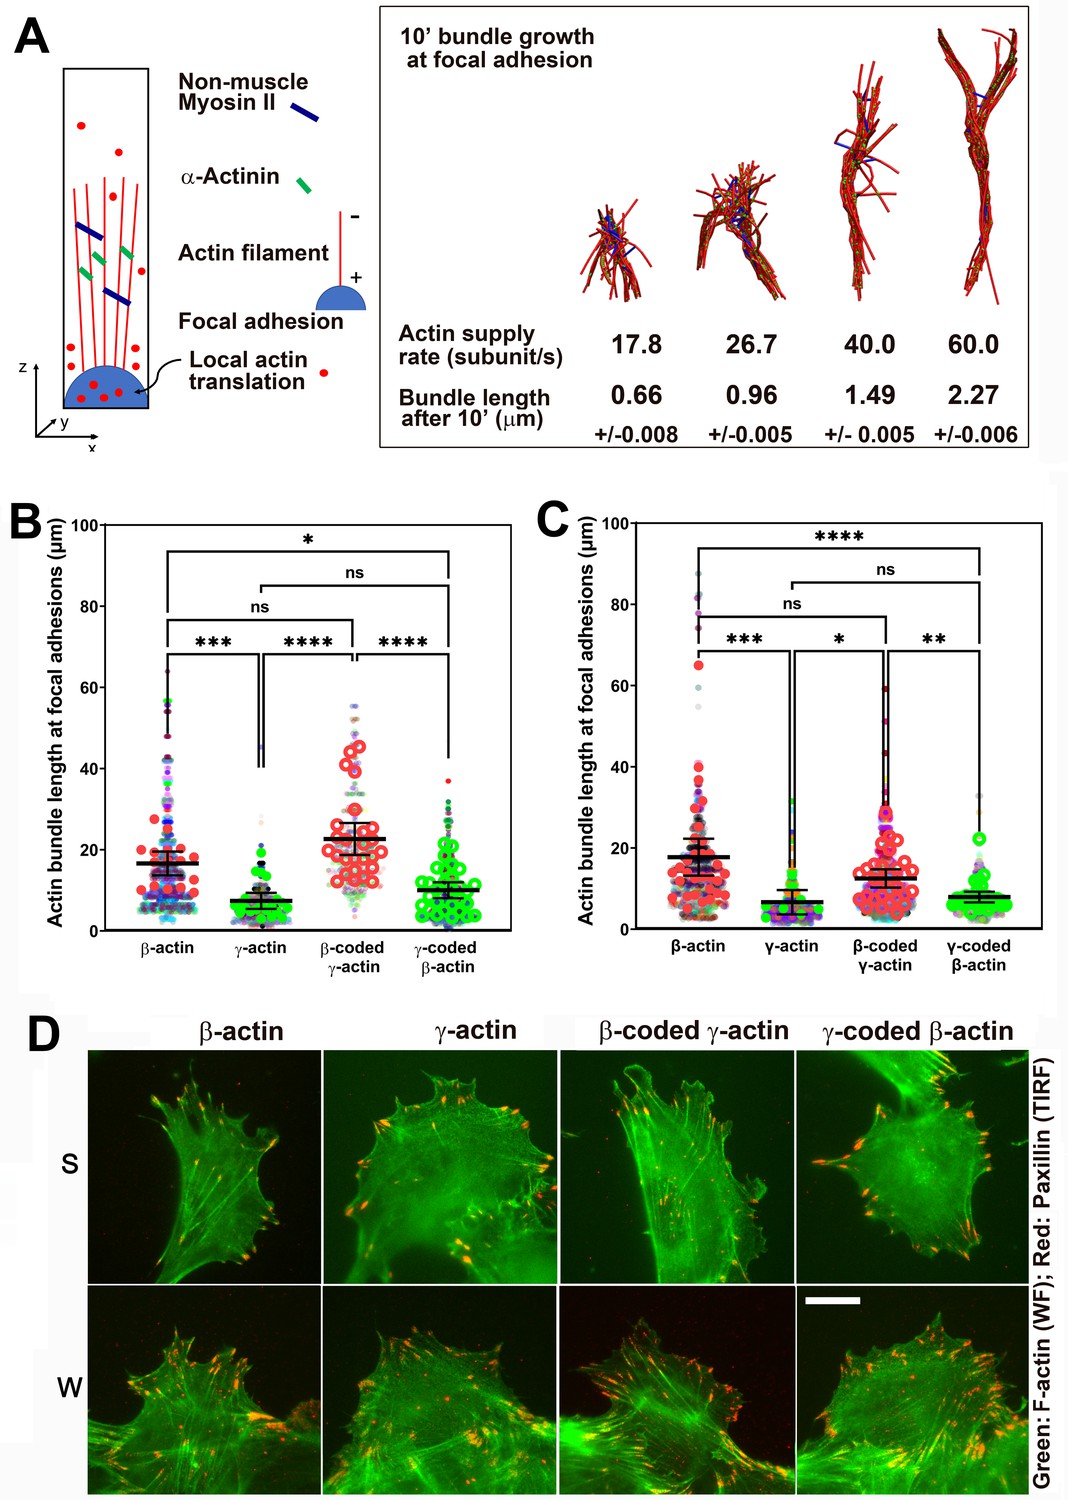
Faster β-actin subunit initial supply rate facilitates actin bundle formation at the focal adhesions to support normal cell migration.
(A) Molecular simulations of actin filament growth at the focal adhesion at four different subunit supply rates, using the components listed on the right. Length of the actin bundle for each supply rate is indicated underneath, with SD listed for five independent simulations. All systems contain 0.012 μM non-muscle myosin II mini-filaments and 1.25 μM alpha-actinin crosslinkers. (B, C) Scatter plots showing the lengths of actin bundles emanating from focal adhesions in two separate experiments—single-cell cultures (B) and wound edge (C). Solid colors indicate individual cells (β-actin: 16, γ-actin: 21, β-coded γ-actin: 26, γ-coded β-actin: 30) or fields of view (β-actin: 31, γ-actin: 30, β-coded γ-actin: 8, γ-coded β-actin: 30), and transparent colors represent individual actin bundle length measurements. Error bars are mean ± 95% CI. Number of actin cables measured: (B) β-actin = 1715, γ-actin = 756, β-coded γ-actin = 482, and γ-coded β-actin = 2383; (C) β-actin = 1165, γ-actin = 1129, β-coded γ-actin = 1726, and γ-coded β-actin = 898. A non-parametric one-way analysis of variance (ANOVA) (Kruskal-Wallis) test for both single-cell cultures and wound edge gave a significant p-value (<0.0001). (D) Representative images of the single-cell cultures (S) and cells at wound edge (W) showing eGFP-actin (green) co-stained with focal adhesion marker paxillin (red). Scale bar, 20 µm.
Figure 5—figure supplement 1
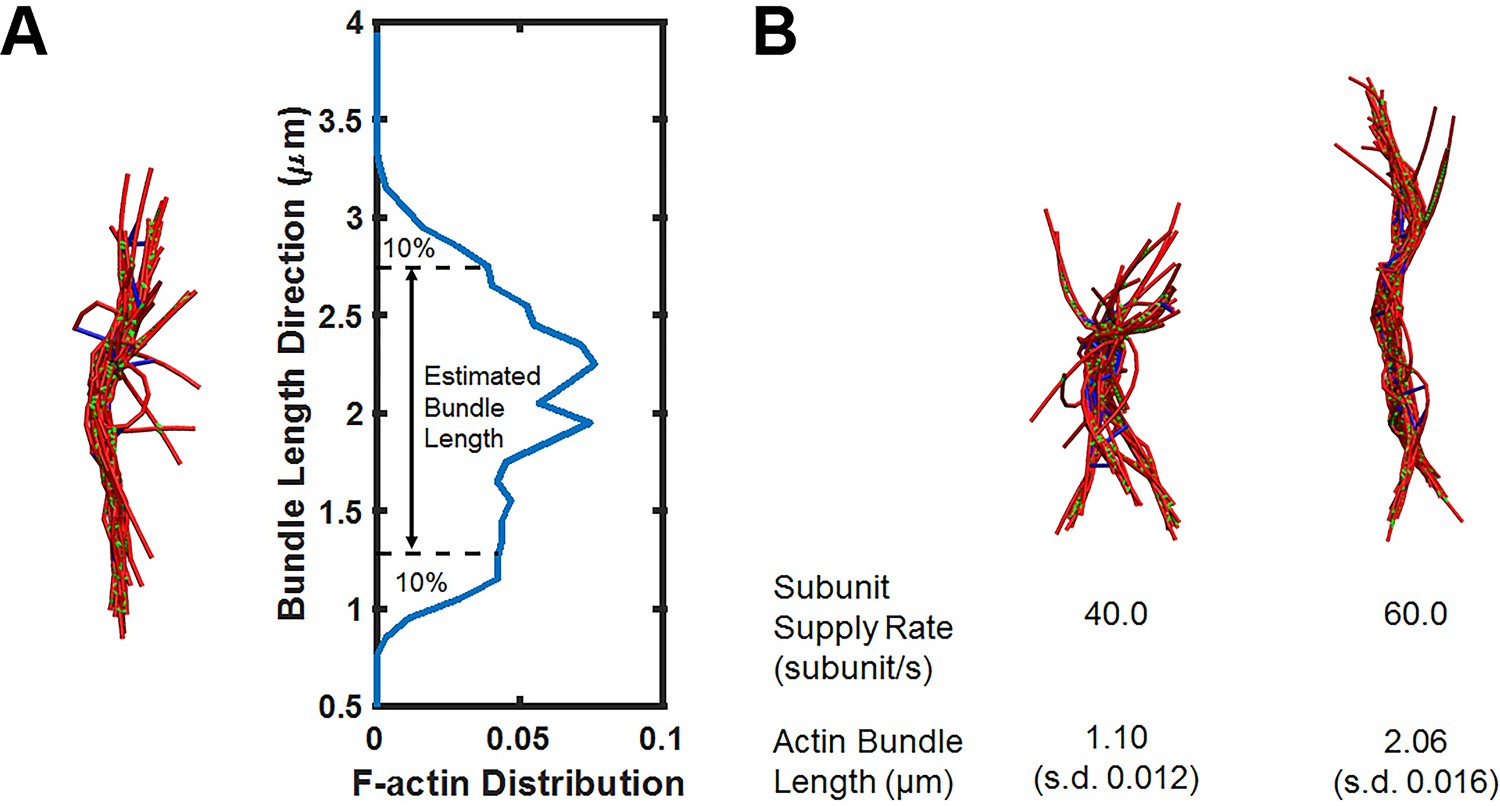
Simulations of actin bundle growth from the focal adhesion.
(A) Measurements of the actin bundle length from distribution plots of F-actin distribution in the Z-axis. (B) Representative simulation snapshots similar to those shown in Figure 5A but with a higher non-muscle myosin motor concentration (0.021 μM).
Figure 6

Hypothesis of cell migration regulation by actin isoforms’ translation rates.
Faster translating β-actin facilitates focal adhesion (FA) formation and persistence, resulting in increased cell spreading and a reduced rate of directional cell movement. Slower translating γ-actin has the opposite effect.
Videos
Video 1
Migration of β-actin-transfected cells.
Mouse embryonic fibroblast (MEF) cell cultures stably expressing eGFP-β-actin migrating into an infinite wound edge over a period of 10 hr.
Video 2
Migration of γ-actin-transfected cells.
Mouse embryonic fibroblast (MEF) cell cultures stably expressing eGFP-γ-actin migrating into an infinite wound edge over a period of 10 hr.
Video 3
Migration of β-coded-γ-actin-transfected cells.
Mouse embryonic fibroblast (MEF) cell cultures stably expressing eGFP-β-coded γ-actin migrating into an infinite wound edge over a period of 10 hr.
Video 4
Migration of γ-coded-β-actin-transfected cells.
Mouse embryonic fibroblast (MEF) cell cultures stably expressing eGFP-γ-coded β-actin migrating into an infinite wound edge over a period of 10 hr.
Video 5
Simulation of actin bundle growth from a focal adhesion at a slower subunit supply rate (40 subunits/s).
Video 6
Simulation of actin bundle growth from a focal adhesion at a faster subunit supply rate (60 subunits/s).
Tables
Key resources table
| Reagent type (species) or resource | Designation | Source or reference | Identifiers | Additional information |
|---|---|---|---|---|
| Strain, strain background (Escherichia coli) | NEB Stable (Stbl3) | New England Biosciences | C3040I | Chemically competent E. coli |
| Cell line (Mus musculus) | Spontaneously immortalized MEFs | This paper | Mouse embryonic fibroblasts were derived from E12.5-E16.5 mouse embryos. The primary cells were cultured till spontaneously immortalized populations survived. | |
| Transfected construct (synthetic) | pHR-scFv-GCN4-sfGFP-GB1-NLS-dWPRE | Tanenbaum et al., 2014 | Addgene plasmid #60906 | Plasmid containing Superfolder-GFP fused to single-chain variable fragment against GCN4 repeats used to localize nascent peptides from SINAPS constructs |
| Transfected construct (synthetic) | pBabe TIR1-9myc | Holland et al., 2012 | Addgene plasmid #47328 | Plasmid containing the ubiquitin ligase TIR, which targets auxin-induced degrons in nascent peptides from SINAPS constructs |
| Antibody | Anti-Paxillin (mouse monoclonal) | BD Transduction Laboratories | Cat#: 610619 | IF (1:100) |
| Recombinant DNA reagent | eTC GFP beta-actin full length (plasmid) | Rodriguez et al., 2006 | Addgene plasmid #27123 | Human ACTB promoter and 3′UTR containing plasmid with eGFP. This was used to construct the mouse β-, γ-, β-coded-γ-, and γ-coded-β-actin plasmids with β-actin 3′UTR. |
| Recombinant DNA reagent | eTC GFP beta-actin ΔZip (plasmid) | Rodriguez et al., 2006 | Addgene plasmid # 27124 | Human ACTB promoter with no ACTB 3′UTR plasmid with eGFP. This was used to construct the mouse β-, γ-, β-coded-γ-, and γ-coded-β-actin plasmids without β-actin 3′UTR. |
| Recombinant DNA reagent | pUbC-FLAG-24xSuntagV4-oxEBFP-AID-baUTR1-24xMS2V5-Wpre (plasmid) | Wu et al., 2016 | Addgene plasmid # 84561 | Plasmid containing Suntag, AID, β-actin 3′UTR, MS2 repeats. This was used to generate mouse SINAPS-β-actin and SINAPS-γ-actin reporters. |
| Recombinant DNA reagent | UbC NLS HA stdMCP stdHalo | Voigt et al., 2017 | Addgene plasmid #104999 | Plasmid containing MCP tandem dimer fused to HaloTag tandem dimer to visualize MS2 repeat containing RNA |
| Recombinant DNA reagent | pUbC-nls-ha-stdMCP-stdGFP | Wu et al., 2016 | Addgene plasmid #98916 | Plasmid containing MCP tandem dimer fused to GFP tandem dimer. Mouse vinculin sequence was cloned upstream of MCP to allow for tethering of MS2-containing RNA to focal adhesions. GFP was replaced by HaloTag. |
| Sequence-based reagent | Actb_F | This paper | PCR primers | GATCAAGATCATTGCTCCTCCTG |
| Sequence-based reagent | Actb_F | This paper | PCR primers | AGGGTGTAAAACGCAGCTCA |
| Sequence-based reagent | Actg1_F | This paper | PCR primers | GCGCAAGTACTCAGTCTGGAT |
| Sequence-based reagent | Actg1_R | This paper | PCR primers | TGCCAGGGCAAATTGATACTTC |
| Sequence-based reagent | eGFP_F | This paper | PCR primers | GTGAAGTTCGAGGGCGACA |
| Sequence-based reagent | eGFP_R | This paper | PCR primers | TCGATGTTGTGGCGGATCTT |
| Sequence-based reagent | Tbp_F | This paper | PCR primers | TAATCCCAAGCGATTTGCTGC |
| Sequence-based reagent | Tbp_R | This paper | PCR primers | AGAACTTAGCTGGGAAGCCC |
| Sequence-based reagent | eGFP FISH probes | LGC Biosearch Technologies | VSMF 1015–5 | |
| Software, algorithm | FishQuant | Mueller et al., 2013 | Used for quantifying signals from SINAPS constructs in fixed cells | |
| Software, algorithm | Airlocalize | Lionnet et al., 2011 | Used for quantifying signals from SINAPS constructs in FRAP experiments in live cells |
Table 1
Model parameters.
| Parameter name | Value | Reference and notes |
|---|---|---|
| Filaments | ||
| Filament polymerization and depolymerization rates | κon = 12.9 (11.6 + 1.3) μM-1s-1 κoff = 2.2 (1.4 + 0.8) s-1 | (Fujiwara et al., 2007) Taking both barbed ends and pointed ends into account |
| Filament bending constant | 672.5 pN·nm | (Ott et al., 1993) Bending constant between connecting cylinders* |
| Filament stretching constant | 100.0 pN/nm | (Popov et al., 2016) Stretching constant of cylinder |
| Motors | ||
| Binding rate constant | 0.2 s-1 per head | Stam et al., 2015 |
| Duty ratio | 0.1 | Stam et al., 2015 |
| Number of motor heads per mini-filament | 15–30 | Verkhovsky and Borisy, 1993 |
| Stretching constant | 56.0 pN/nm | Popov et al., 2016 |
| Characteristic stall force | 15.0 pN per head | Popov et al., 2016 |
| Characteristic motor unbinding force | 12.6 pN per head | Erdmann et al., 2013 |
| Crosslinkers | ||
| Binding rate constant | 0.7 μM-1s-1 | Wachsstock et al., 1993 |
| Unbinding rate constant | 0.3 s-1 | Wachsstock et al., 1993 |
| Stretching constant | 8.0 pN/nm | DiDonna and Levine, 2007 |
| Characteristic linker unbinding force | 17.2 pN | Ferrer et al., 2008 |
-
* Filaments are discretized into cylinders, and the length of cylinders ranges from 2.7 nm (1 subunit) to a maximum of 108 nm (40 subunits). Bending is only allowed between two connecting cylinders.
Additional files
Download links
A two-part list of links to download the article, or parts of the article, in various formats.
Downloads (link to download the article as PDF)
Open citations (links to open the citations from this article in various online reference manager services)
Cite this article (links to download the citations from this article in formats compatible with various reference manager tools)
Different translation dynamics of β- and γ-actin regulates cell migration
eLife 10:e68712.
https://doi.org/10.7554/eLife.68712


