An inhibitory circuit from central amygdala to zona incerta drives pain-related behaviors in mice
- National Center for Complementary and Integrative Health, United States
- National Institute of Mental Health, United States
- National Institutes on Drug Abuse, National Institutes of Health, United States
Figures
Figure 1 with 2 supplements
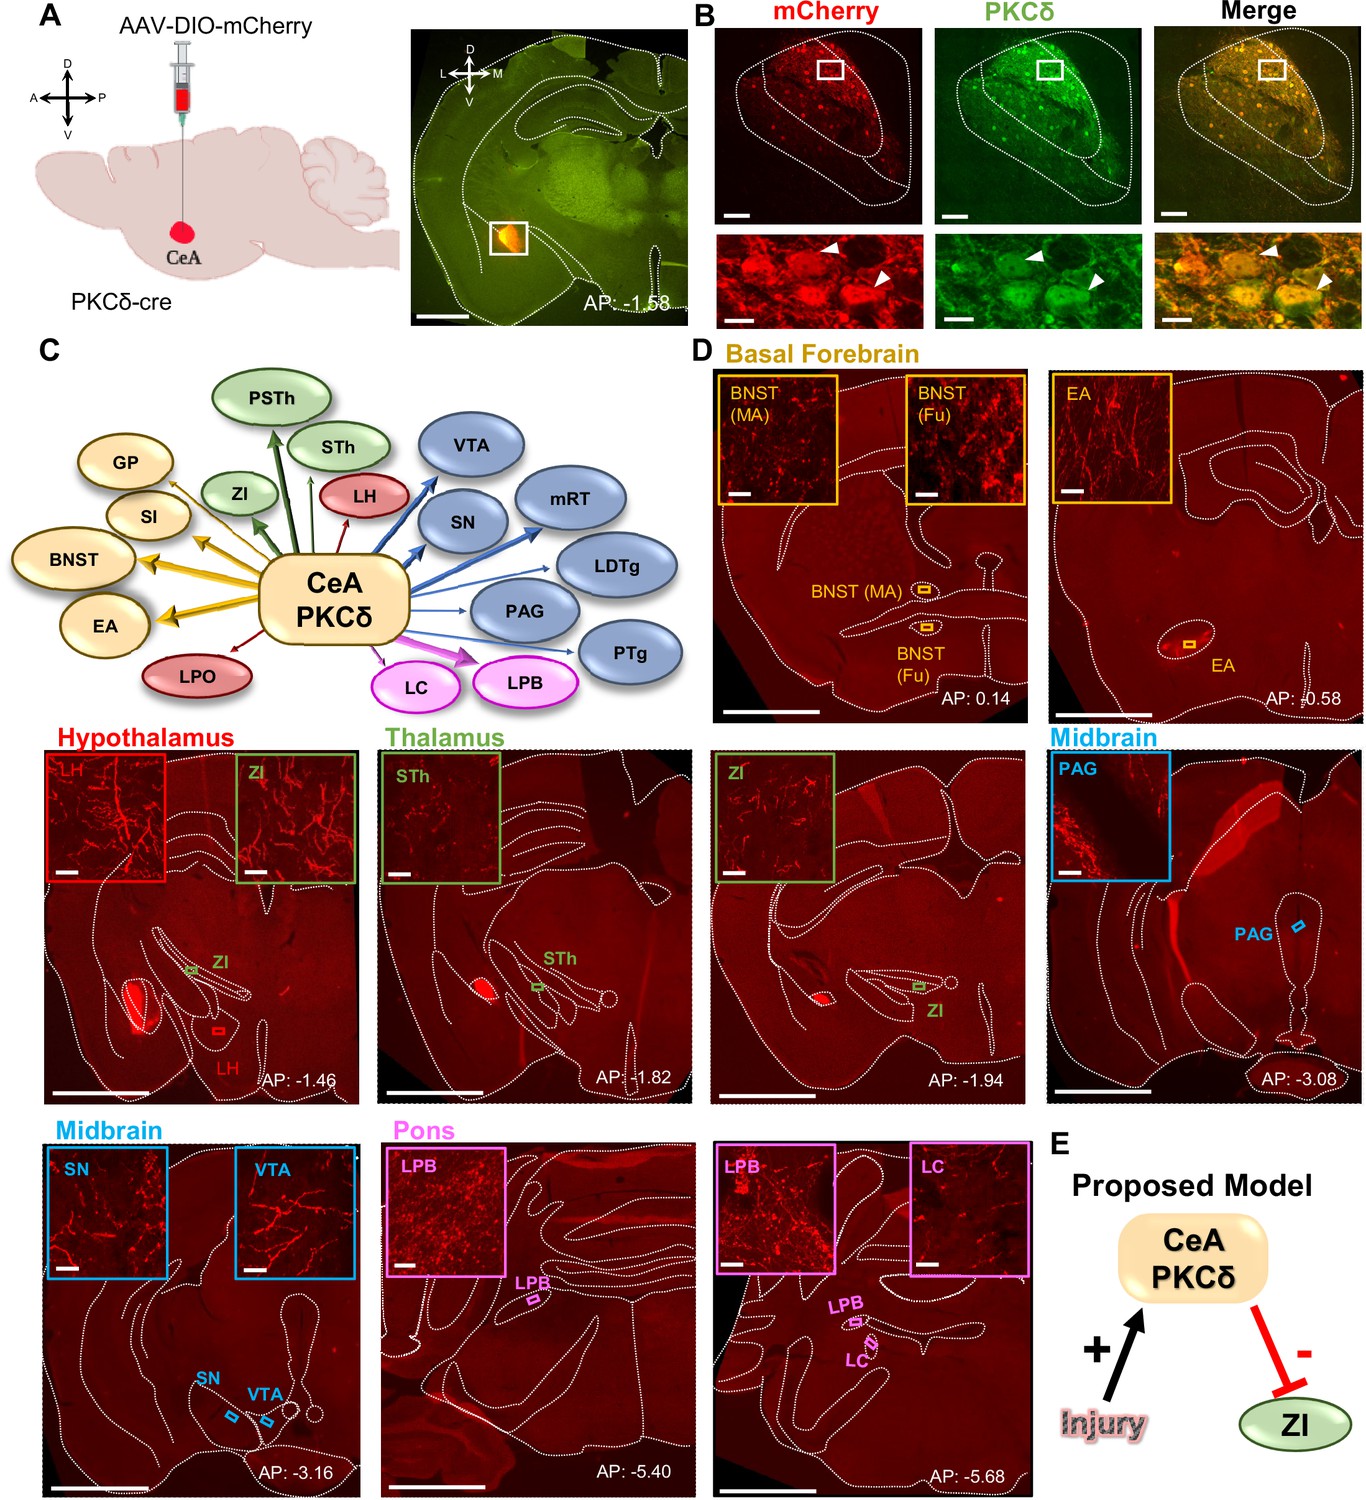
CeA-PKCδ neurons efferent targets.
(A) Schematic of experimental approach. AAV-DIO-mCherry was unilaterally injected into the CeA of PKCδ-cre mice. A representative coronal brain slice of an injected mouse is shown on the right panel, with mCherry shown in red. Scale bar represents 1000 µm. (B) Representative high magnification images of the CeA in a coronal brain slice of an AAV-DIO-mCherry injected mouse. mCherry-transduced cells are shown in red and neurons immunostained for PKCδ in green. The merged image is shown on the right panel. Lower insets depict higher magnification images of the areas delineated by the white box in the upper images. White arrowheads highlight representative transduced cells that are also positive for PKCδ. Scale bars represent 100 µm for low magnification and 10 µm for high magnification images. (C) Summary diagram illustrating CeA-PKCδ neuron efferent projections within the brain. Forebrain regions are shown in yellow, hypothalamic structures in red, thalamus in green, midbrain in blue and pons in fuchsia. The thickness of the arrows depicts the density of labeling (sparse, moderate or dense). (D) Low magnification representative images of brain regions with axonal terminals from CeA-PKCδ cells. Insets in each image are high magnification images depicting axonal terminals within the regions delineated by the boxes in the respective low magnification images. Scales are 1000 µm for low magnification images and 20 µm for high magnification images. (E) Proposed model for pain-related inhibition of the ZI via injury-induced activation of CeA-PKCδ neurons. Abbreviations: bed nucleus of stria terminalis medial (BNST-MA); bed nucleus of stria terminalis fusiform nucleus (BNST-Fu); extended amygdala (EA); substantia innominata (SI); lateral preoptic area (LPO); globus pallidus (GP); lateral hypothalamus (LH); subthalamic nucleus (STh); zona incerta (ZI); parasubthalamic nucleus (PSTh); periaqueductal grey (PAG); substantia nigra (SN); ventral tegmental area (VTA); pedunculopontine tegmental nucleus (PTg); laterodorsal tegmental nucleus (LDTg); reticular formation (mRT); lateral parabrachial (LPB); locus coeruleus (LC). See Figure 1—figure supplements 1 and 2.
Figure 1—figure supplement 1
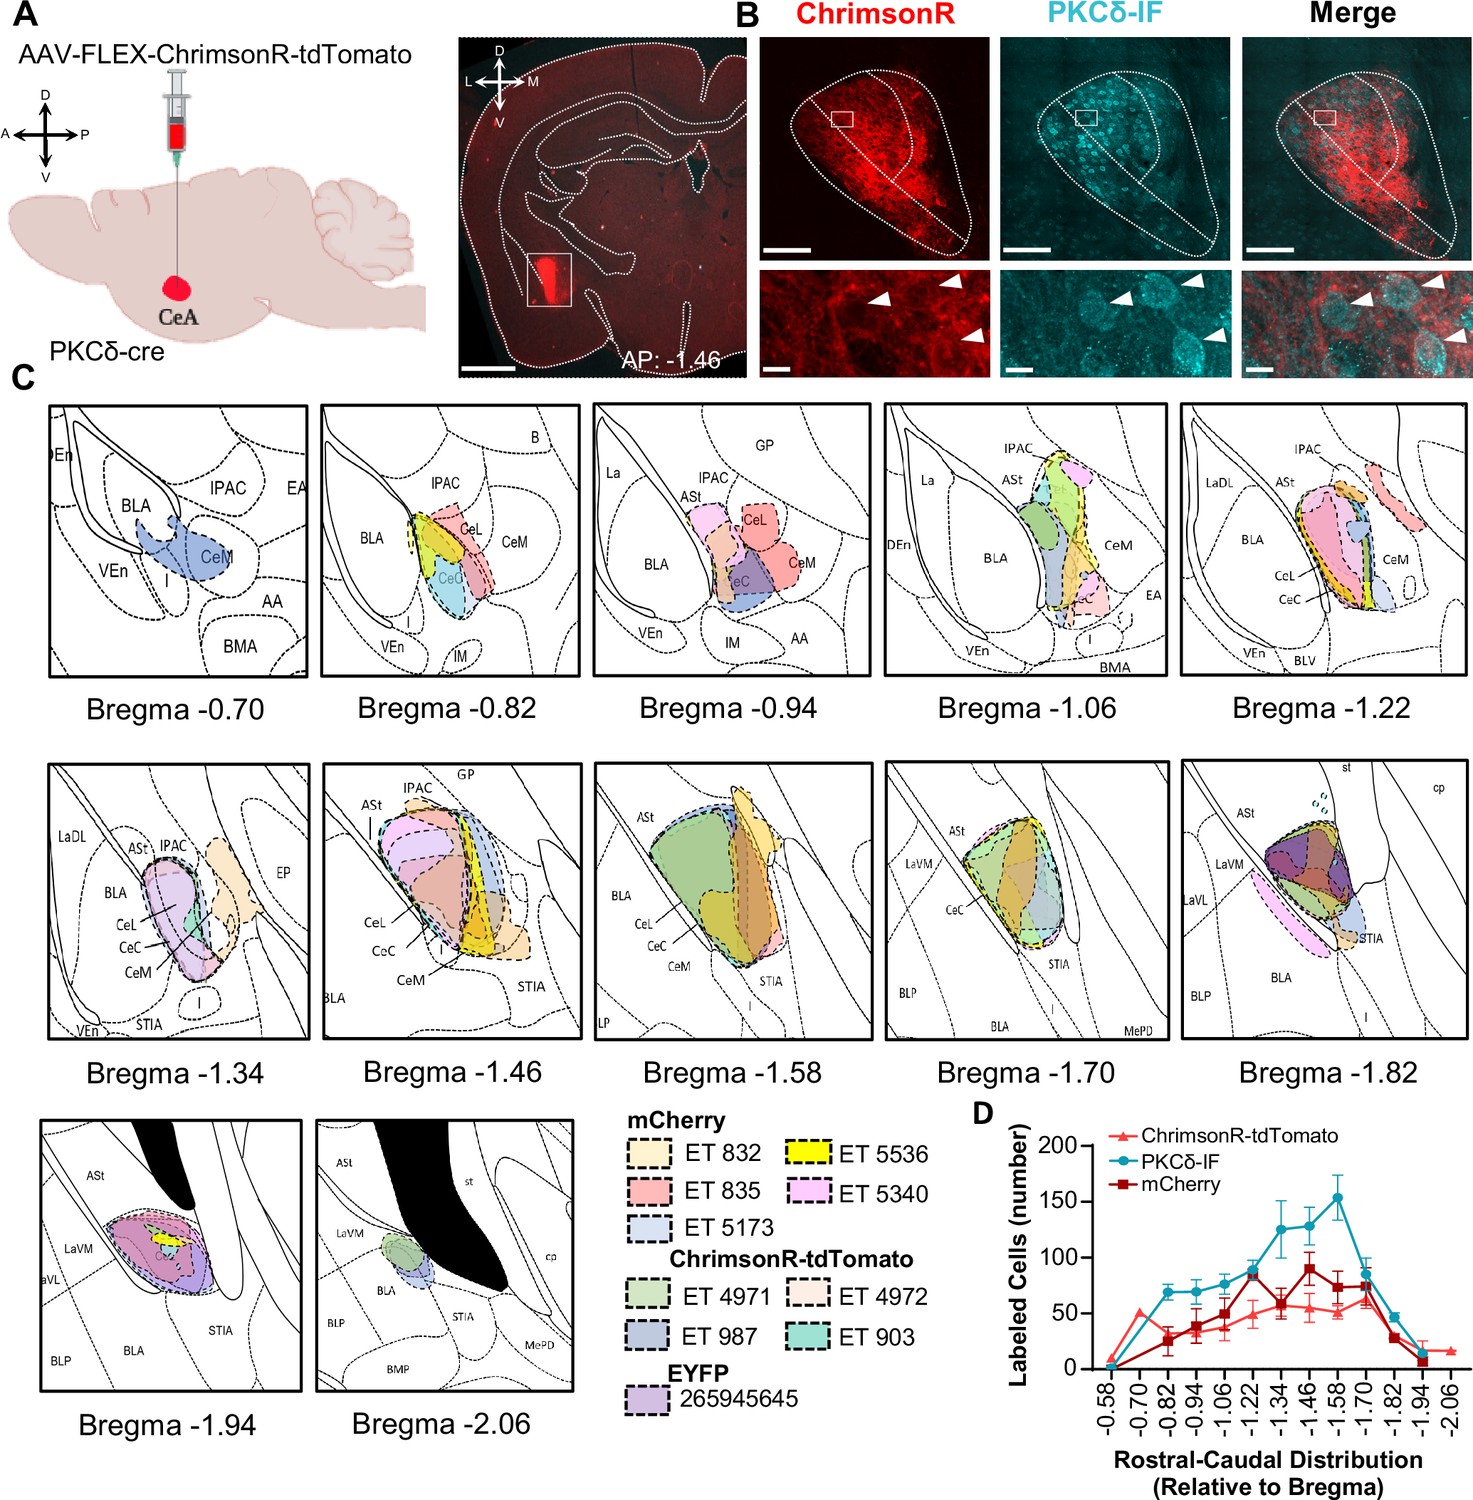
Rostral-caudal distribution of viral injection sites within the CeA of mice used for anatomical experiments.
(A) Schematic of experimental approach. AAV-FLEX-ChrimsonR-tdTomato or AAV-DIO-mCherry was unilaterally injected into the CeA of PKCδ-cre mice. A representative coronal brain slice of mouse injected with AAV-FLEX-ChrimsonR-tdTomato is shown on the right panel, with ChrimsonR-tdTomato shown in red. Scale bar represents 1 mm. (B) Representative high magnification images of the CeA in a coronal brain slice of an AAV-FLEX-ChrimsonR-tdTomato injected mouse. ChrimsonR-tdTomato-transduced cells are shown in red. Immunofluorescence (IF) for PKCδ is shown in cyan. The merged image is shown on the right panel. Lower insets depict higher magnification images of the areas delineated by the white box in the upper images. White arrowheads highlight representative transduced cells that are also positive for PKCδ. Scale bars represent 100 µm for upper panel and 10 µm for lower panel images. (C) Drawings depicting rostral-caudal distribution of CeA neurons transduced with mcherry, ChrimsonR-tdTomato, or EYFP in PKCδ-cre mice used for anatomical analysis. Individual mice are represented in different colors. EGFP brain is from experiment 265945645 of the Mouse Brain Connectivity Atlas of the Allen Brain Institute- http://connectivity.brain-map.org/. (D) Mean ± SEM number of CeA neurons transduced with ChrimsonR-tdTomato or mCherry or immunofluorescently labeled for PKCδ (PKCδ-IF) as a function of rostral-caudal level relative to bregma. n=5 mice for mCherry transduced neurons; n=4 mice for ChrimsonR-tdTomato transduced neurons; n=5 mice for PKCδ-IF neurons.
-
Figure 1—figure supplement 1—source data 1
Source data for quantification of CeA neurons transduced with ChrimsonR-tdTomato or mCherry.
- https://cdn.elifesciences.org/articles/68760/elife-68760-fig1-figsupp1-data1-v2.xlsx
Figure 1—figure supplement 2
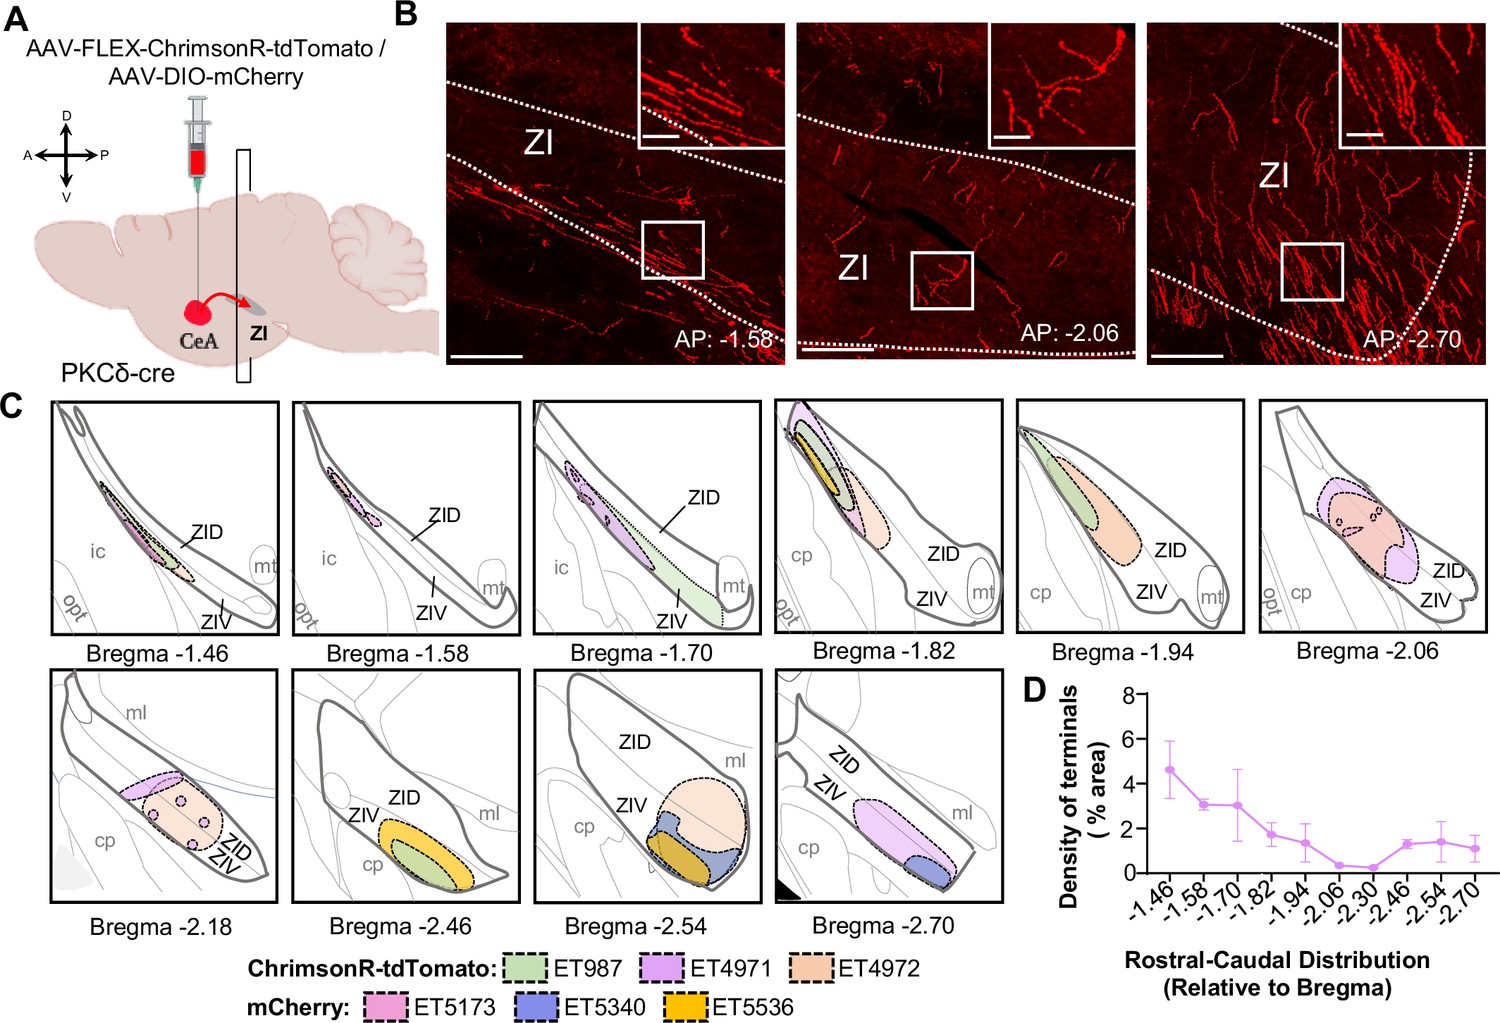
Rostral-caudal distribution of CeA-PKCδ terminals in ZI.
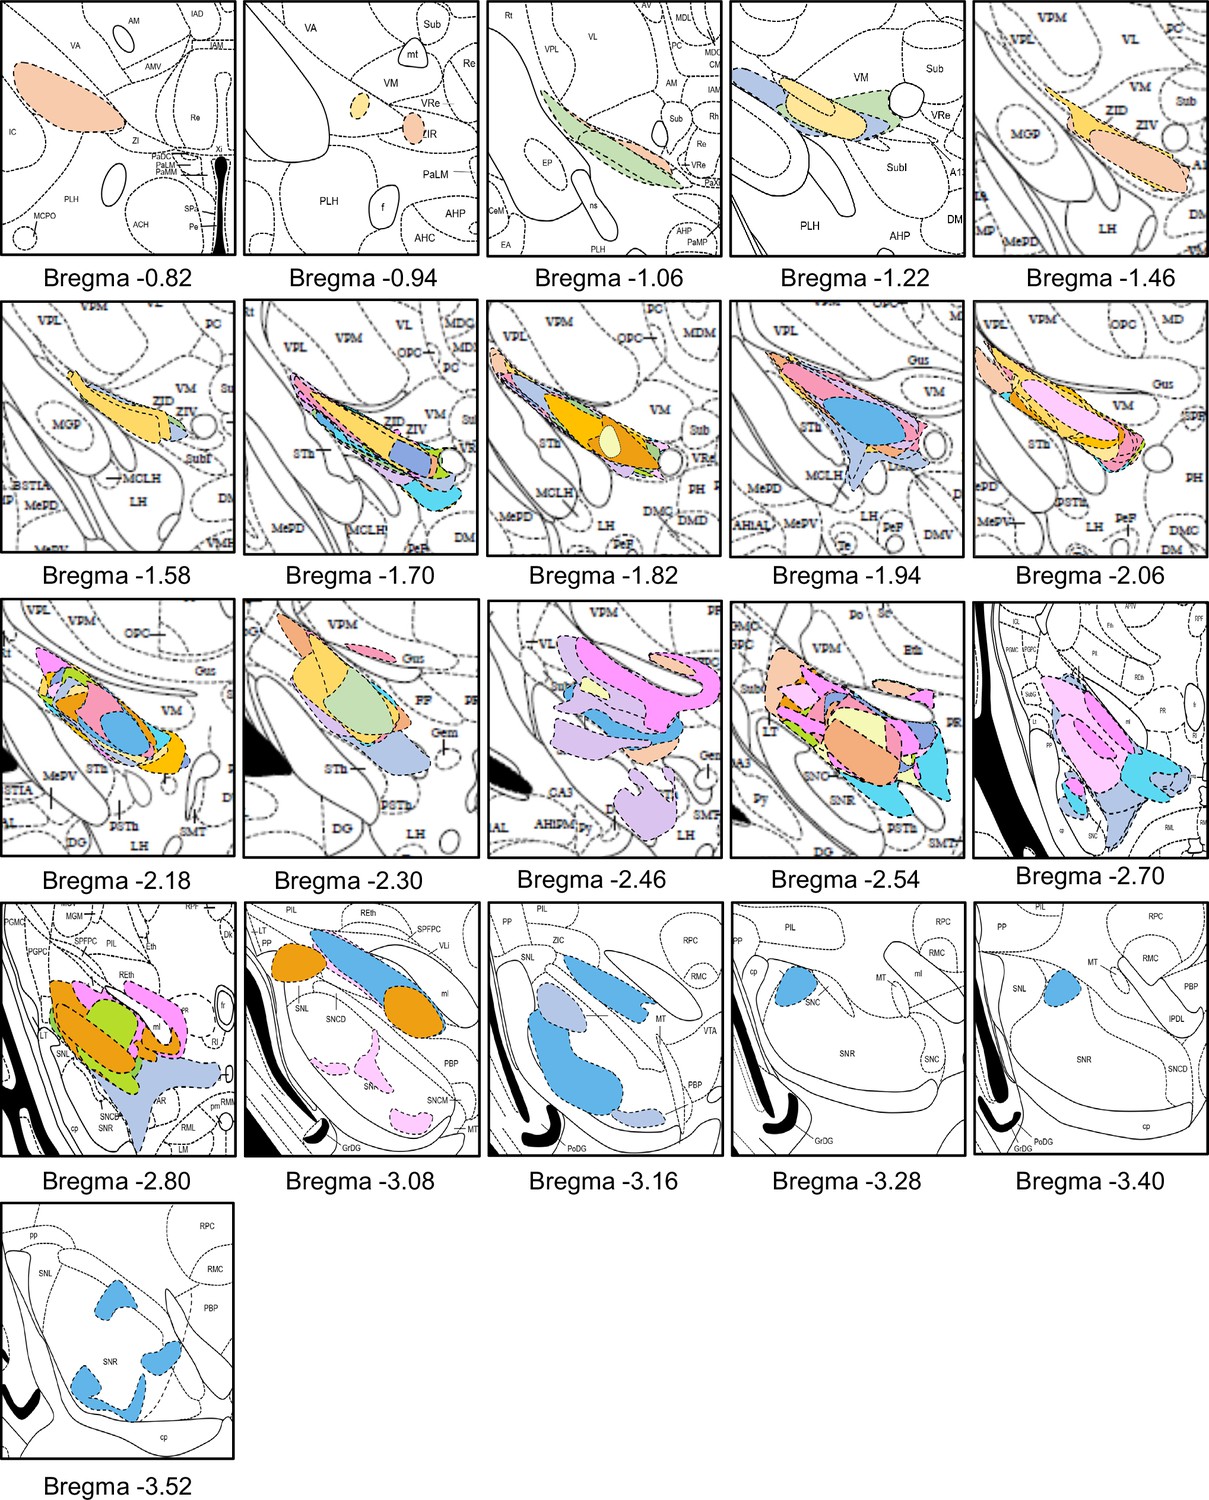
(A) Schematic of experimental approach. AAV-FLEX-ChrimsonR-tdTomato or AAV--DIO-mCherry was unilaterally injected into the CeA of PKCδ-cre mice. Terminal densities and distributions were evaluated in coronal slices containing the ZI. (B) Representative high magnification images of coronal brain slices containing the ZI at different rostral-caudal levels. Fluorescently labeled CeA-PKCδ terminals in ZI are shown in red. Insets depict higher magnification images of the areas delineated by the white box. Scale bars represent 100 µm for main images and 20 µm for insets. (C) Drawings depicting rostral-caudal distribution of ZI subregions fluorescently labeled with moderate CeA-PKCδ terminals. Individual mice are represented as different colors. (D) Quantification of CeA-PKCδ axonal terminal density within the ZI as a function of rostral-caudal level relative to bregma. n=3 mice for mCherry and 3 mice for ChrimsonR-tdTomato.
-
Figure 1—figure supplement 2—source data 1
Source data for quantification of CeA-PKCδ axonal terminal density within the ZI.
- https://cdn.elifesciences.org/articles/68760/elife-68760-fig1-figsupp2-data1-v2.xlsx
Figure 2 with 1 supplement
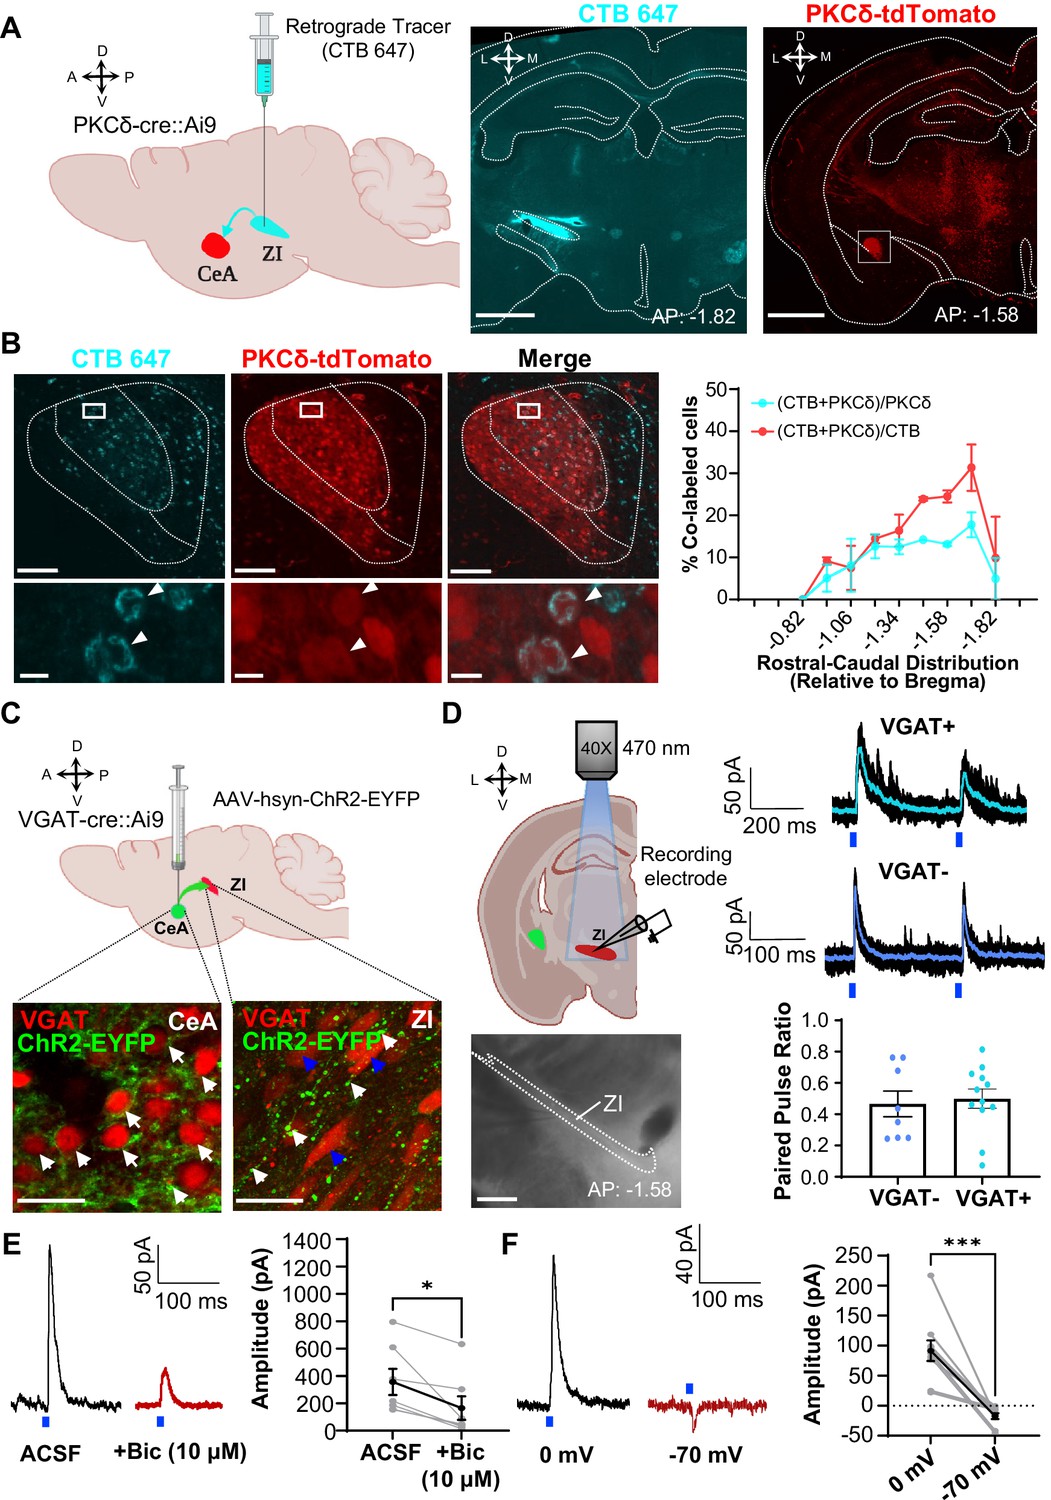
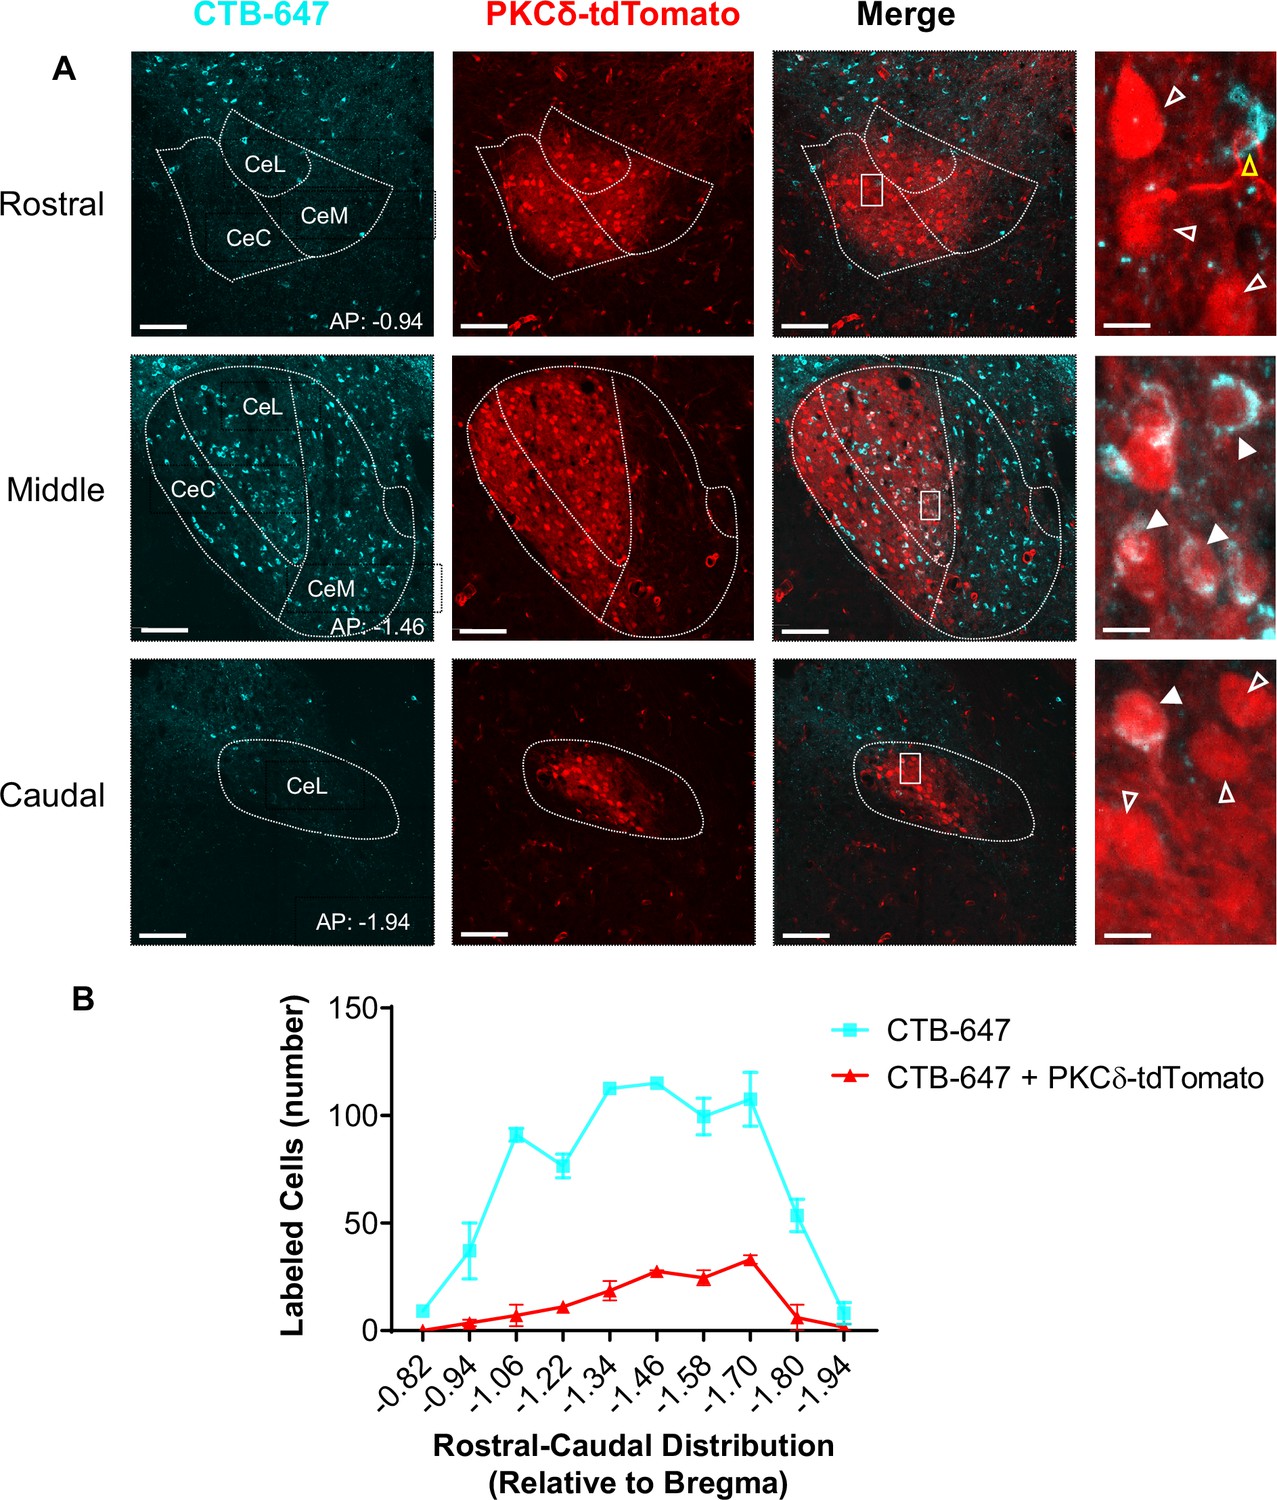
CeA-PKCδ inhibitory projections to the ZI (A) Schematic drawing of retrograde tracing experimental approach (left panel).
Fluorescently tagged cholera toxin B (CTB-647) was injected into the ZI of a PKCδ-cre::Ai9 mouse brain. A representative coronal brain slice depicting the focal injection of CTB-647 (cyan) into the ZI is shown in the middle panel. A representative coronal brain slice containing the CeA is shown in the right panel. PKCδ-tdTomato cells are shown in red. The white square delineates the area magnified in panel B. Scale bar represents 1000 µm. (B) Representative high magnification images of the CeA in a PKCδ-cre::Ai9 mouse injected with CTB-647 into the ZI. CTB-positive cells are shown in cyan and PKCδ-tdTomato cells in red. The merged image is shown on the right. Lower insets show higher magnification images of the area delineated by the white squares in the top panel. Arrowheads highlight cells that are positive for CTB and PKCδ-tdTomato. Scale bars represent 100 µm (top panel) and 10 µm (bottom panel). The mean ± SEM percentage of PKCδ or CTB cells co-labeled for both PKCδ and CTB as a function of the rostral-caudal level is shown on the right (n=2 mice, 8 slices per mouse). (C) Schematics for the optogenetically assisted circuit mapping experiments. VGAT-cre::Ai9 and C57BL/6 J mice were stereotaxically injected with AAV-hsyn-hChR2-EYFP into the CeA. Lower left panel – perisomatic ChR2-EYFP (green) in VGAT-positive CeA neurons (red) are highlighted by white arrows. Lower right panel – CeA terminals (green; white arrows) in proximity to VGAT-positive ZI neurons (red; blue arrows). Scale bars are 20 µm. (D) Schematic diagram and differential contrast image of the ZI for ex-vivo whole-cell recordings in acute ZI brain slices is shown in the left panel. Scale bar is 500 µm. Top right panel - Representative traces showing responses of VGAT-positive (cyan) and VGAT-negative (blue) ZI neurons upon optical paired pulse stimulation of ChR2-expressing CeA terminals (0.5–10ms duration, 200ms inter-stimulus interval). Ten overlaid responses are shown in black and the averaged response in cyan or blue. Blue bars under the traces represent the timing and duration of blue light stimulation. The mean ± SEM paired pulse ratio is shown on the bottom right panel (n=8 VGAT-negative and 12 VGAT-positive cells). (E) Representative traces of optically evoked inhibitory postsynaptic currents (oIPSCs) of ZI neurons before and 3 min after bath exchange to ACSF containing 10 μM Bicuculline (Bic). The mean ± SEM of the oIPSC amplitude is shown on the right panel (n=7 cells collected from 7 mice; paired two-tailed t-test: t=3.361, df = 6, *p=0.0152 for ACSF vs Bicuculline). (F) Representative traces of light-evoked responses recorded at 0 mV and –70 mV. The mean ± SEM response amplitude is shown on the right panel (n=10 cells collected from 7 mice; paired two-tailed t-test: t=5.879, df = 9, ***p=0.0002 for 0 mV vs –70 mV). See Figure 2—figure supplement 1.
-
Figure 2—source data 1
Source data for anatomical and electrophysiological validation of CeA-PKCd to ZI pathway.
- https://cdn.elifesciences.org/articles/68760/elife-68760-fig2-data1-v2.xlsx
Figure 2—figure supplement 1
Anatomical validation of CeA-PKCd to ZI pathway using retrograde tracer approach.
(A) Representative images of coronal brain slices at different rostral-caudal levels containing the CeA of PKCδ-cre:Ai9 mice injected with the fluorescently tagged retrograde tracer cholera toxin B (CTB-647; cyan). PKCδ-tdTomato neurons are shown in red. The merged images are shown in the third column. The rightmost panels show higher magnification images of the area delineated by the white squares in the merged images. White open arrowheads point to cells that are positive for PKCδ-tdTomato only; yellow open arrowheads point to cells that are positive for CTB-647 only; solid arrowheads point to cells that are positive for both PKCδ-tdTomato and CTB-647. Scale bars are 100 µm (low magnification) and 10 µm (high magnification). (B) The mean ± SEM number of neurons positive for CTB-647 only (cyan) or co-labeled for PKCδ-tdTomato and CTB-647 (red) as a function of the rostral-caudal level is shown on the bottom (n=2 mice, 8 slices per mouse).
-
Figure 2—figure supplement 1—source data 1
Source data for quantification of CTB-647 and PKCδ-tdTomato positive neurons in the CeA.
- https://cdn.elifesciences.org/articles/68760/elife-68760-fig2-figsupp1-data1-v2.xlsx
Figure 3 with 1 supplement
Inhibition of GABAergic ZI neurons is sufficient to induce bilateral tactile and pressure hypersensitivity in uninjured mice.
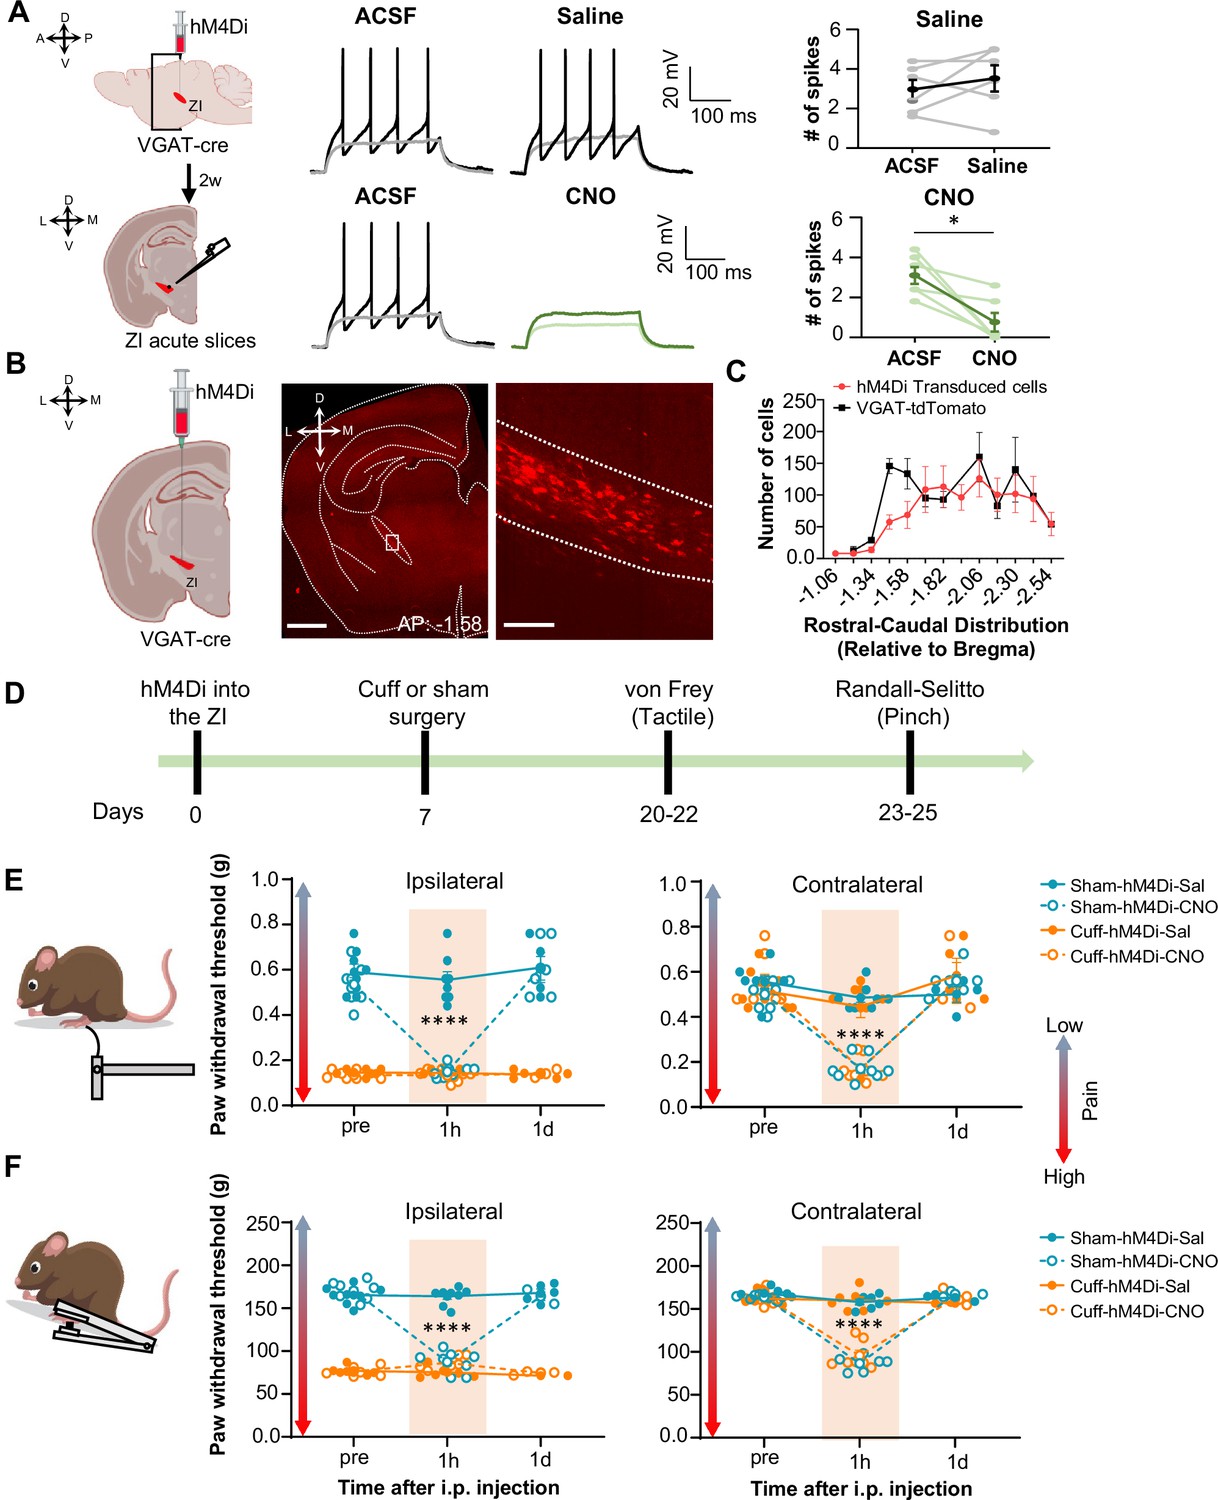
(A) Schematic of the experimental approach. VGAT-cre mice were stereotaxically injected with hM4Di into the ZI. Current-clamp recordings were obtained from hM4Di-positive cells in acute ZI slices 2 weeks after the injection. Representative traces of whole-cell current-clamp recordings obtained from ZI neurons transduced with hM4Di before (left) and after (right) bath application of 10 µM CNO (lower panel) or vehicle (top panel). Action potentials were elicited using 500ms depolarizing current injection that evoked 2–5 action potentials before the bath application. The same amplitude of depolarizing current injection was used before and after bath application. Summary graphs depicting the mean ± SEM number of spikes before and after bath treatment are shown on the right panel (n=6 neurons per treatment; paired two-tailed t-test: t=0.98, df = 5, p=0.3722 for ACSF vs saline; Wilcoxon two-tailed matched paired signed rank test: W=–21.0, *p=0.0313 for ACSF vs CNO). Scatter points represent individual cells, with darker lines indicating the mean values +/- SEM. (B) Schematic diagram for unilateral stereotaxic injection of hM4Di into the ZI of VGAT-cre mice. A representative image of a coronal mouse brain slice from a VGAT-cre mouse injected with hM4Di into the ZI is shown on the middle panel. The area delineated by the white rectangle in the middle panel is shown at higher magnification in the right panel, with mCherry-positive neurons shown in red. Scale bars represent 1000 µm (left) and 100 µm (right). (C) Mean ± SEM number of hM4Di-transduced cells and VGAT-tdTomato labeled cells in the ZI as a function of rostral-caudal level relative to bregma (n=11 mice for hM4Di-transduced neurons and 4 mice for VGAT-tdTomato neurons). (D) Timeline for behavioral experiments. (D–E) Different modalities of pain behavior test. Responses shown as mean ± SEM paw withdrawal threshold in the ipsilateral (left panel) and contralateral (right panel) hindpaws before, 1 h and 1 day after CNO or vehicle i.p. injection in cuff or sham mice stereotaxically injected with hM4Di into the ZI. Scatter points represent individual mice. Mixed-effects model followed by Dunnett’s multiple comparison test was performed for analysis of all behavioral assays. (E) von Frey (n=8 mice per treatment; ipsilateral hindpaw: i.p. treatment: F(2,42) = 31.03, ****p<0.0001; sciatic nerve treatment: F(3,28) = 138.8, ****p<0.0001; interaction: F(6,42) = 25.93, ****p<0.0001; posthoc: 95.00% CI of diff.=0.3129–0.4571, ****p<0.0001 for pre-injections vs 1 hr after CNO in sham-hM4Di mice; contralateral hindpaw: i.p. treatment: F(2,70) = 58.0, ****p<0.0001; sciatic nerve treatment: F(3,70) = 7.398, ***p<0.001; interaction: F(6,70) = 9.426, ****p<0.0001; posthoc: 95.00% CI of diff.=0.2276–0.4309, ****p<0.0001 for pre-injections vs 1 hr after CNO in sham-hM4Di mice and 95.00% CI of diff.=0.2787–0.4828, ****p<0.0001 for pre-injections vs 1 hr after CNO in cuff-hM4Di mice) (F) Randall-Selitto (ipsilateral hindpaw: n=8 for sham mice and 6 for cuff mice; i.p. treatment: F(2,33) = 41.16, ****p<0.0001; sciatic nerve treatment: F(3,24) = 265.4, ****p<0.0001; interaction: F(6,33) = 60.75, ****p<0.0001; posthoc: 95.00% CI of diff.=73.69–92.20, ****p<0.0001 for pre-injections vs 1 hr after CNO in sham-hM4Di mice; contralateral hindpaw: n=6 for sham mice and 7 for cuff mice; i.p. treatment: F(2,30) = 141.8, ****p<0.0001; sciatic nerve treatment: F(3,22) = 22.05, ****p<0.0001; interaction: F(6,30) = 37.21, ****p<0.0001; Posthoc: 95.00% CI of diff.=65.21–89.19, ****p<0.0001 for pre-injections vs 1 hr after CNO in sham-hM4Di mice and 95.00% CI of diff.=57.73–79.89, ****p<0.0001 for pre-injections vs 1 hr after CNO in cuff-hM4Di mice). See Figure 3—figure supplement 1.
-
Figure 3—source data 1
Source data for chemogenetic inhibition of ZI-GABAergic neurons.
- https://cdn.elifesciences.org/articles/68760/elife-68760-fig3-data1-v2.xlsx
Figure 3—figure supplement 1
Responses to thermal stimuli are unaltered by chemogenetic inhibition of ZI-GABAergic neurons.
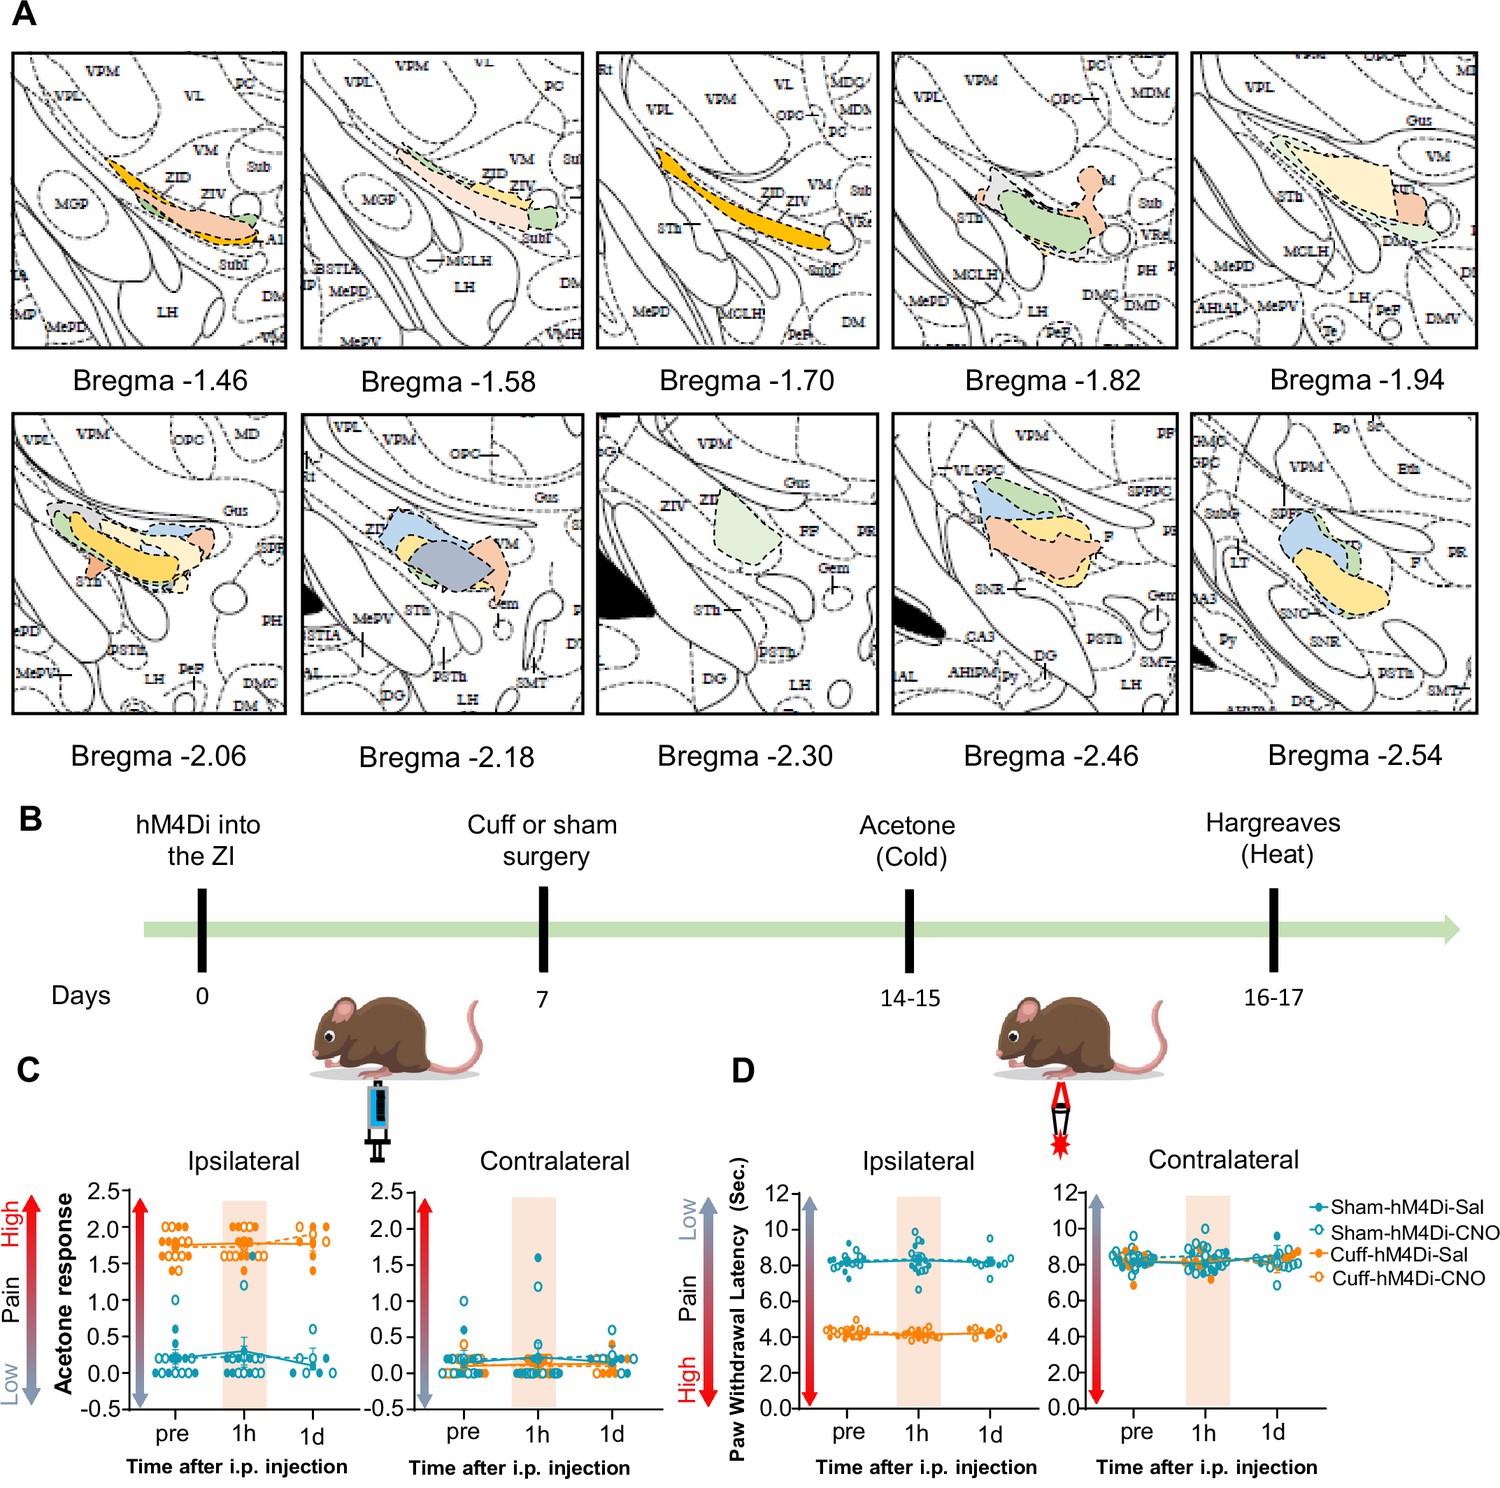
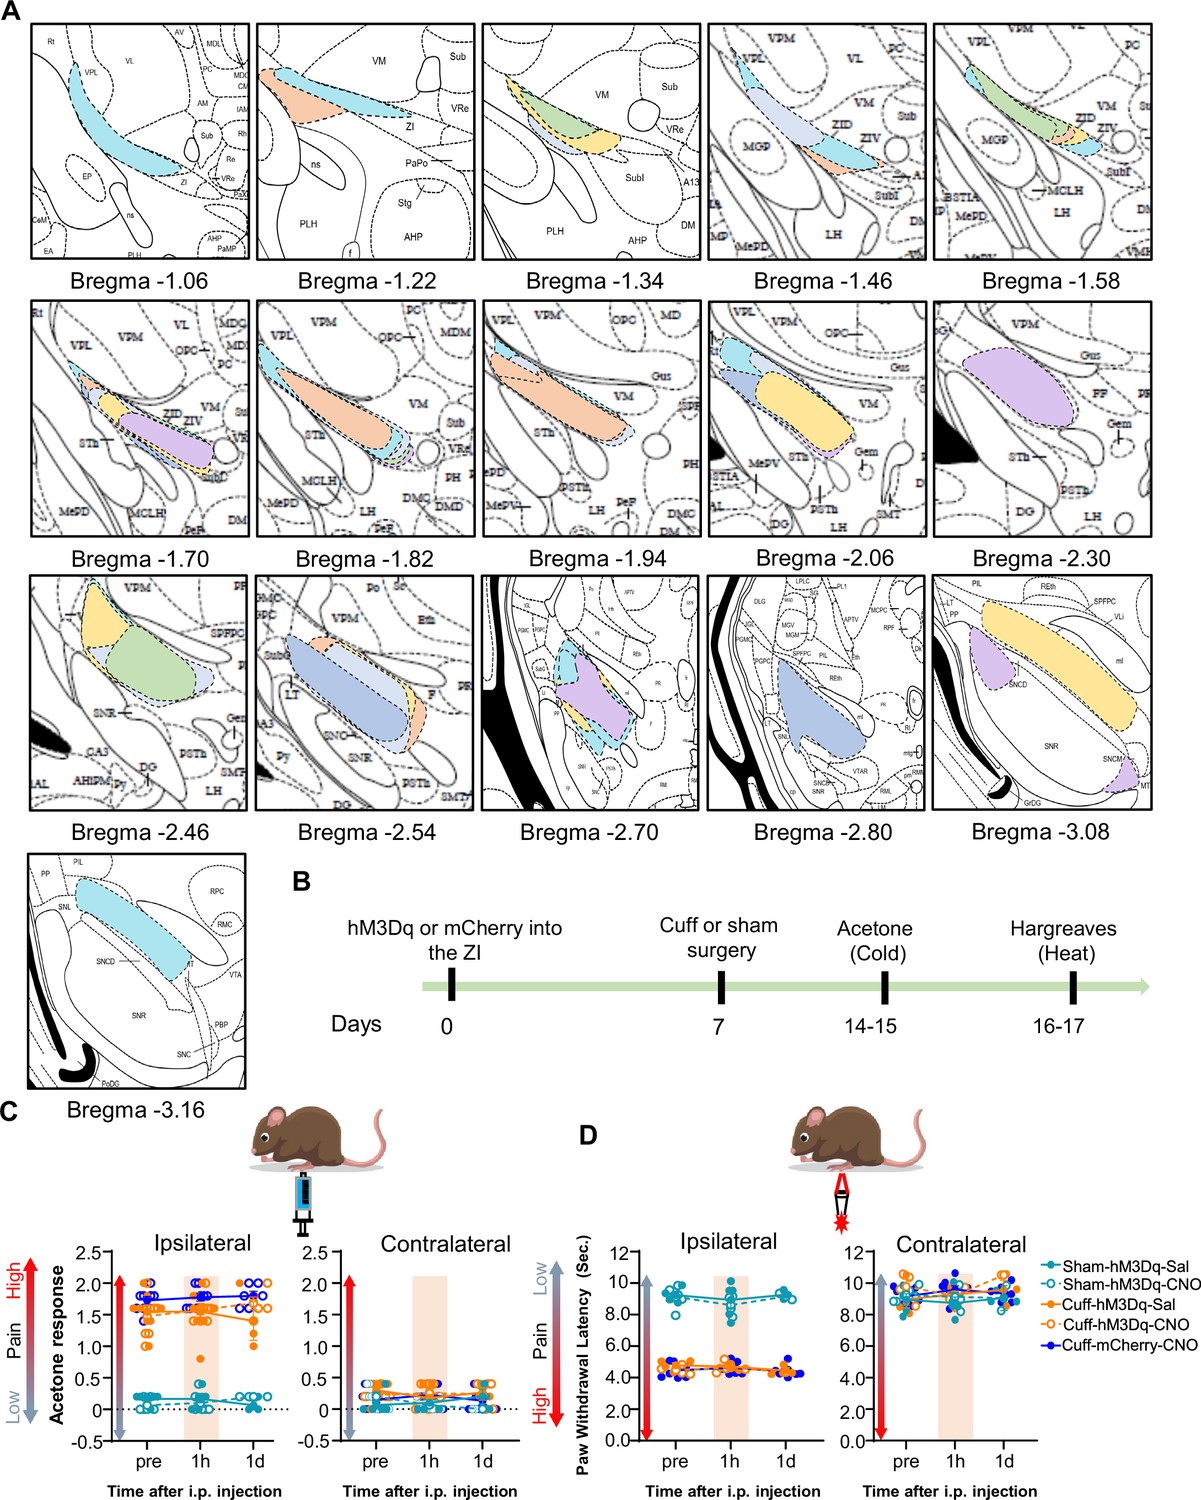
(A) Rostral-caudal distribution of hM4Di injection sites in mice used for behavioral experiments. Drawings of injection sites throughout the VGAT-cre mice brains injected with hM4Di into the ZI. Individual mice are represented in different color. (B) Timeline for cuff-induced thermal hypersensitivity behavioral experiments. Mixed-effects model followed by Dunnett’s multiple comparison test was performed for analysis of all behavioral assays. n=8 mice per treatment. (C) acetone response (ipsilateral hindpaw: i.p. treatment: F(2,40) = 0.2811; p=0.7564; sciatic nerve treatment: F(3,28) = 95.08; ****p<0.0001; interaction: F(6,40) = 0.5731, p=0.7493; contralateral hindpaw: i.p. treatment: F(2,40) = 0.1374; p=0.8720; sciatic nerve treatments: F(3,28) = 0.2550; p=0.8571; interaction: F(6,40) = 0.2001, p=0.9748) (D) paw withdrawal latency obtained from Hargreaves test (ipsilateral hindpaw: i.p. treatment: F(2,43) = 0.01655; p=0.9836; sciatic nerve treatments: F(3,28) = 286; ****p<0.0001; interaction F(6,43) = 0.3289, p=0.9181; contralateral hindpaw: i.p. treatment: F(2,43) = 0.01455; p=0.9856; sciatic nerve treatments: F(3,28) = 0.07683; p=0.9720; interaction: F(6,43) = 1.309, p=0.2738). Responses shown as mean ± SEM paw withdrawal threshold in the ipsilateral (left panel) and contralateral (right panel) hindpaws before, 1 h and 1 day after CNO or vehicle i.p. injection in cuff or sham mice stereotaxically injected with hM4Di into the ZI.
-
Figure 3—figure supplement 1—source data 1
Source data for thermal responses to chemogenetic inhibition of ZI-GABAergic neurons.
- https://cdn.elifesciences.org/articles/68760/elife-68760-fig3-figsupp1-data1-v2.xlsx
Figure 4 with 2 supplements
Activation of GABAergic ZI neurons reverses cuff-induced hypersensitivity to pinch stimulation.
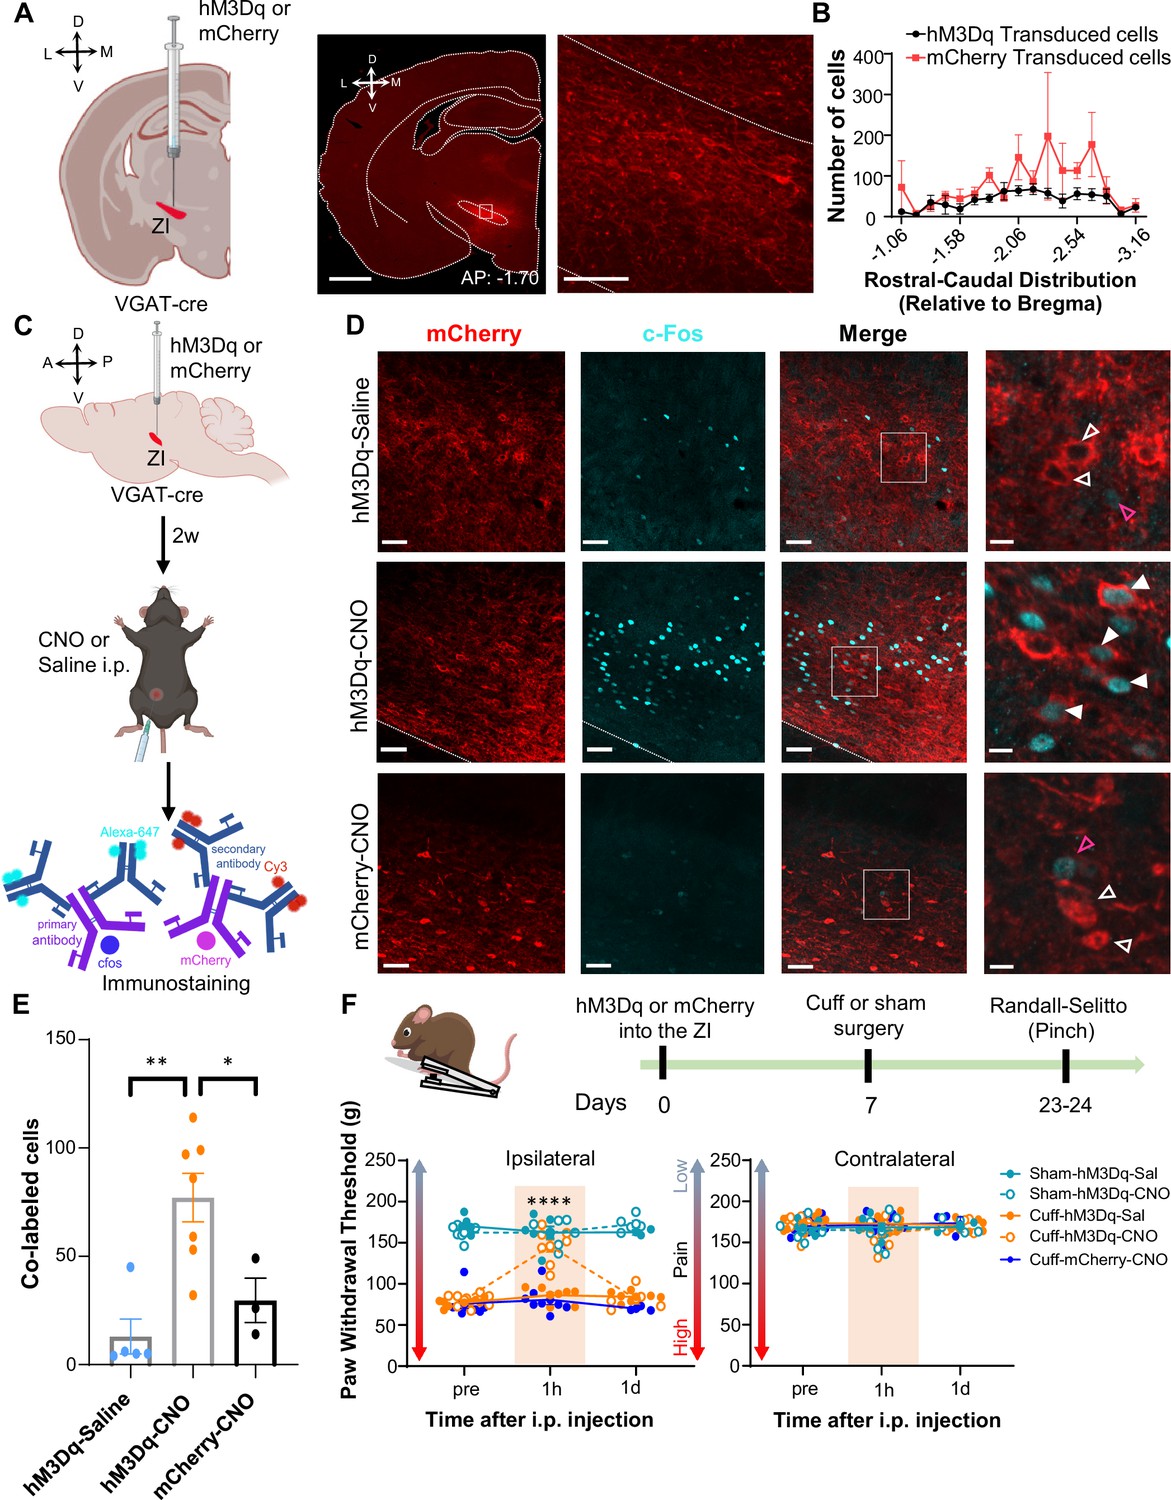
(A) VGAT-cre mice were injected with hM3Dq or mCherry into the ZI. Low-magnification representative image of a coronal brain slice shows the site of virus injection in red. The area delineated by the white rectangle is shown at higher magnification in the right image. Scale bars are 1000 µm for low magnification and 100 µm for high-magnification images (B) Quantification of ZI cells transduced with hM3Dq and mCherry is shown as mean ± SEM (n=17 mice for hM3Dq transduced group and 7 mice for mCherry group). (C) c-Fos experimental timeline. (D) Representative images of coronal brain slices containing the ZI of VGAT-cre mice injected with hM3Dq (top and middle panels) or mCherry (bottom) into the ZI and i.p. treated with CNO (middle and bottom panels) or saline (top panel). mCherry expression is shown in red and immunostaining for c-Fos in cyan. The merged images are shown in the rightmost panels. White boxes delineate the areas magnified on the right panel. Magenta open arrowheads point to cells that are positive for c-Fos only; white open arrowheads point to cells that are positive for mCherry only; solid arrowheads point to cells that are positive for both mCherry and c-Fos. Scale bars are 50 µm (low magnification) and 10 µm (high magnification). (E) Mean ± SEM numbers of c-Fos and mCherry transduced co-labeled cells per condition. (n=7 for hM3Dq-CNO, 5 for hM3Dq-saline and 3 for mCherry-CNO mice; One-way ANOVA followed by Tukey’s multiple comparisons test: F(2,12) = 10.90; **p<0.01 for hM3Dq-CNO vs hM3Dq-Sal and *p<0.05 for hM3Dq-CNO vs mCherry-CNO). (F) Randall-Selitto responses are shown as mean ± SEM paw withdrawal threshold in the ipsilateral (left panel) and contralateral (right panel) hindpaw before, 1 hr and 1 day after CNO or vehicle i.p. injections in cuff or sham mice stereotaxically injected with hM3Dq or mCherry into the ZI (n=6 for sham- hM3Dq mice, n=8 for cuff-hM3Dq and mCherry-cuff mice; Mixed-effects model followed by Dunnett’s multiple comparison test; Ipsilateral hindpaw: i.p. treatment: F(2,48) = 16.99, ****p<0.0001; sciatic nerve treatment: F(4,31) = 112.9, ****p<0.0001; interaction: F(8,48) = 17.52, ****p<0.0001; posthoc: 95.00% CI of diff.=–77.97 to –53.12, ****p<0.0001 for pre-injections vs 1 hr after CNO in cuff-hM3Dq mice; contralateral hindpaw: i.p. treatment: F(2,48) = 0.9387, p=0.3982; sciatic nerve treatment: F(4,31) = 0.4981, p=0.7372; interaction: F(8,48) = 1.070, p=0.3996). Scatter points represent individual mice. See Figure 4—figure supplements 1 and 2.
-
Figure 4—source data 1
Source data for chemogenetic activation of ZI-GABAergic neurons.
- https://cdn.elifesciences.org/articles/68760/elife-68760-fig4-data1-v2.xlsx
Figure 4—figure supplement 1
Rostral-caudal distribution of hM3Dq injection sites in mice used for behavioral experiments.
Drawings of injection sites throughout the VGAT-cre mice brains injected with hM3Dq into the ZI. Individual mice are represented in different color.
Figure 4—figure supplement 2
Cuff-induced thermal hypersensitivity is unaltered by chemogenetic activation of ZI-GABAergic neurons.
(A) Rostral-caudal distribution of mCherry injection sites in mice used for behavioral experiments. Drawings of injection sites throughout the VGAT-cre mice brains injected with mCherry into the ZI. Individual mice are represented in different colors. (B) Timeline for thermal hypersensitivity experiments. (C) acetone response (n=6 for hM3Dq-Sham and n=8 for both hM3Dq-Cuff and mCherry-Cuff mice; mixed-effects model followed by Dunnett’s multiple comparison test, ipsilateral hindpaw: i.p. treatment: F(2,46) = 0.7858, p=0.4618; brain and sciatic nerve treatments: F(4,31) = 110, ****p<0.0001; interaction: F(8,46) = 0.4403, p=0.8905; contralateral hindpaw: i.p. treatment: F(2,46) = 0.2500, p=0.7798; brain and sciatic nerve treatments: F(4, 31)=3.025, p=0.0324; interaction: F(8,46) = 1.160, p=0.3432) (D) paw withdrawal latency obtained from Hargreaves test (n=6 for hM3Dq-Sham and n=8 for hM3Dq-Cuff and mCherry-Cuff mice; mixed-effects model followed by Dunnett’s multiple comparison test, ipsilateral hindpaw ipsilateral paw: i.p. treatment: F(2,32) = 0.4157; p=0.6634; brain and sciatic nerve treatments: F(4, 21)=217.1; ****p<0.0001; interaction F(8,32) = 0.8282, p=0.5843; contralateral hindpaw: i.p. treatment: F(2,32) = 0.8809; p=0.4242; brain and sciatic nerve treatments: F(4,21) = 1.527; p=0.2306; interaction F(8,32) = 1.029, p=0.4353). Responses shown as mean ± SEM paw withdrawal threshold in the ipsilateral (left panel) and contralateral (right panel) hindpaws before, 1 hr and 1 day after CNO or vehicle i.p. injection in cuff or sham mice stereotaxically injected with hM3Dq into the ZI.
-
Figure 4—figure supplement 2—source data 1
Source data for thermal responses to chemogenetic activation of ZI-GABAergic neurons in cuff implanted mice.
- https://cdn.elifesciences.org/articles/68760/elife-68760-fig4-figsupp2-data1-v2.xlsx
Figure 5 with 1 supplement
Optogenetic inhibition of CeA-PKCδ terminals in ZI reverses cuff-induced hypersensitivity.
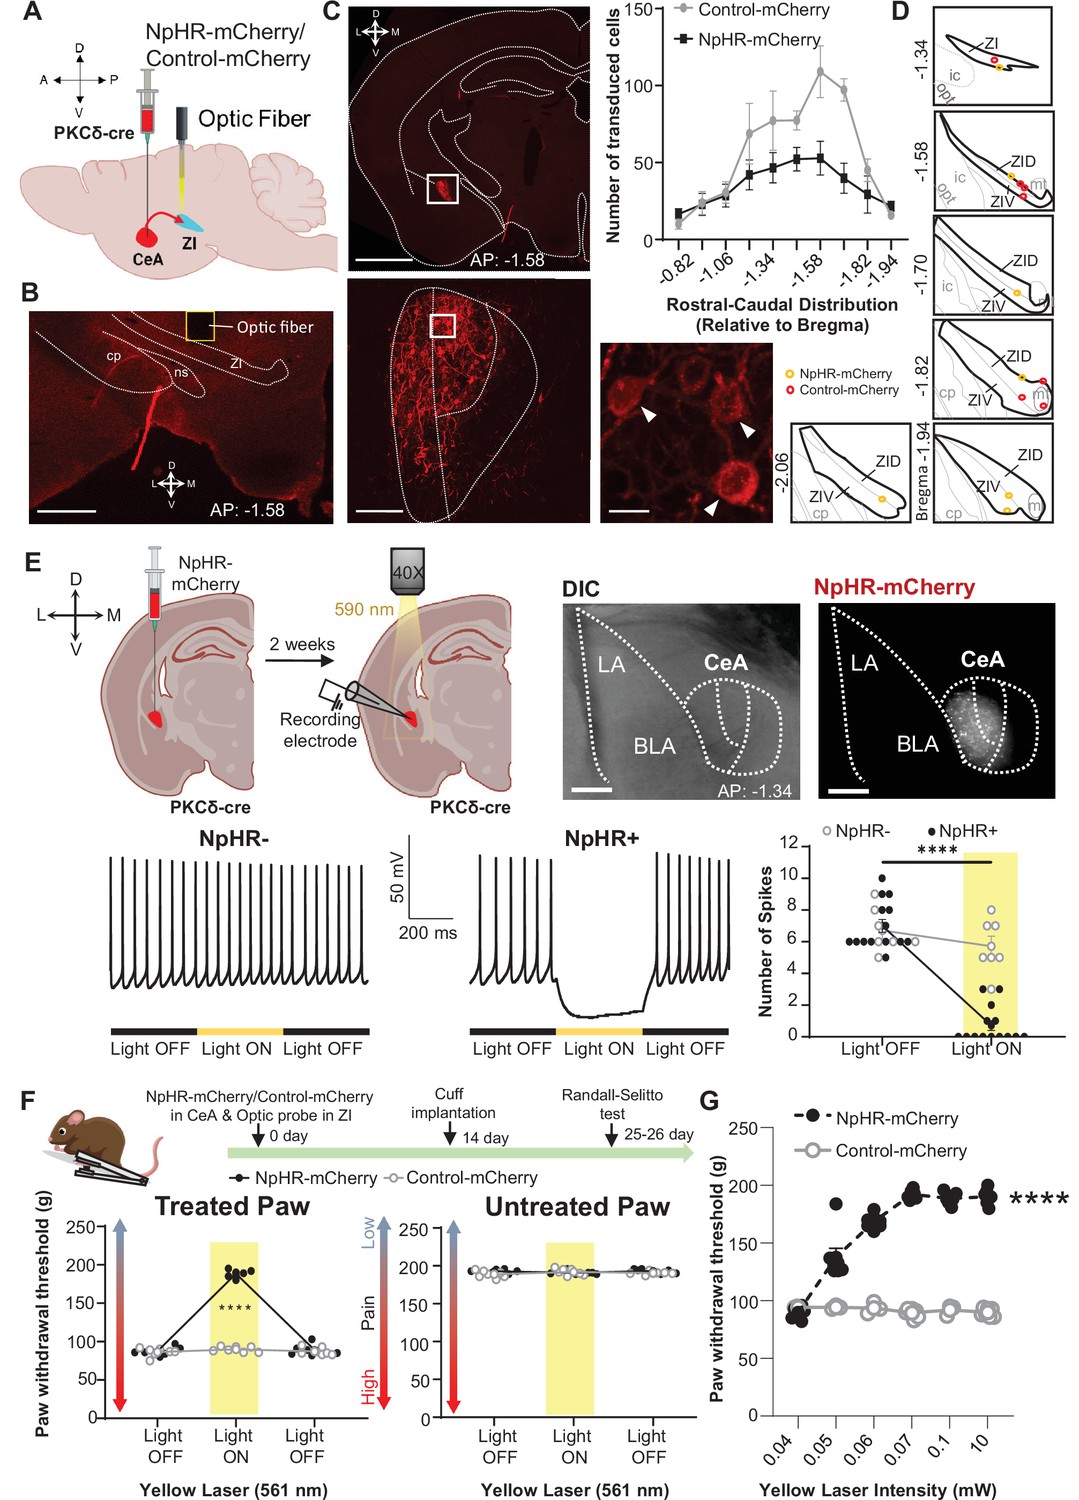
(A) Schematic of experimental approach. PKCδ-cre mice were stereotaxically injected with NpHR-mCherry or control-mCherry virus into the CeA and simultaneously implanted with an optic fiber above the ZI. (B) Representative image of coronal brain slice illustrating the placement of the optic fiber above the ZI (scale bar 500 µm). (C) Top left panel shows representative image of coronal brain slice depicting anatomical location of NpHR-mCherry transduced cells in the CeA (scale bar 1 mm). A higher magnification of the CeA, delineated by the white rectangle, is shown in the bottom left panel. NpHR-positive CeA neurons are highlighted by white arrowheads in the inset shown in right bottom. Scale bars represent 100 µm for left bottom image and 10 µm for right bottom image. Mean ± SEM number of NpHR-transduced and control-mCherry-transduced CeA cells as a function of rostral-caudal level relative to bregma are shown in the top right panel (n=6 mice for NpHR-transduced cells and n=6 mice for control-mCherry cells). (D) Drawing maps illustrating location of optic fiber tips in animals used for opto-inhibition study. Symbol (O) indicates where the cannula tips were placed in the ZI area. ZID = dorsal zona incerta, ZIV = ventral zona incerta, ic = internal capsule, cp = cerebral peduncle, opt = optic tract, mt = mammillothalamic tract. (E) Top left panel – Schematic diagram of experimental approach. NpHR-mCherry was injected in the CeA of PKCδ-cre mice. Whole-cell current-clamp recordings of NpHR-negative and NpHR-positive neurons in acute CeA slices were performed 2 weeks following the stereotaxic injection. Top right panel – representative differential contrast and fluorescent images of a coronal brain slice illustrating the anatomical localization of NpHR-transduced cells in the CeA. Scale bars represent 500 μm. LA = lateral amygdala, BLA = basolateral amygdala, CeA = central amygdala. Bottom left panel – representative voltage traces from NpHR-negative and NpHR-positive neurons before, during and after yellow light (λ=590 nm) stimulation. Black lines represent light off and yellow lines represent light on. Bottom right panel –mean ± SEM number of action potentials before and during light stimulation of NpHR-negative and NpHR-positive neurons (n=7 NpHR-negative and 14 NpHR-positive neurons; two-way ANOVA followed by Šídák’s multiple comparisons test: F(1,19) = 72.57, ****p<0.0001 for light off vs light on in NpHR-positive neurons). Scatter points represent individual cells. (F) Top panel shows experimental timeline. Randall-Selitto responses are shown as mean ± SEM paw withdrawal threshold in the cuff-treated (left panel) and untreated (right panel) hindpaw before, during and after yellow (λ=561 nm, 10 mW) light-induced inhibition of CeA-PKCδ terminals in the ZI in mice expressing NpHR-mCherry or control-mCherry in the CeA (n=6 for NpHR-mCherry mice and 7 for control-mCherry mice; two-way repeated measures ANOVA followed by Dunnett’s multiple comparison test: treated hindpaw: light treatment: F(2, 22)=339.3, ****p<0.0001; brain treatment: F(1,11) = 473.0; ****p<0.0001; interaction: F(2, 22)=300.0; ****p<0.0001; posthoc: 95.00% CI of diff.=–109.1 to –93.22, ****p<0.0001 for light off vs light on in NpHR-mCherry mice; untreated hindpaw: light treatment: F(2,22) = 0.3367; p=0.7177; brain treatment: F(1,11) = 2.278; p=0.1594; interaction: F(2,22) = 2.380; p=0.1160). Yellow bar indicates the behavioral response during opto-inhibition of CeA-PKCδ terminals in the ZI (G) Yellow laser intensity response curve during Randall-Selitto in the cuff-implanted hindpaw. Mean ± SEM paw withdrawal response as a function of increasing laser intensities during yellow (λ=561 nm) light-induced inhibition of CeA-PKCδ terminals in the ZI of mice expressing NpHR-mCherry or control-mCherry in the CeA (n=3–7 for control-mCherry and n=7 for NpHR-mCherry mice; two-way repeated measures ANOVA: F(2, 22)=339.3, ****p<0.0001 for laser intensity effect on treated hindpaw withdrawal responses in mice expressing NpHR-mCherry). Scatter points represent individual mice. See Figure 5—figure supplement 1.
-
Figure 5—source data 1
Source data for optogenetic inhibition of CeA-PKCδ terminals in ZI.
- https://cdn.elifesciences.org/articles/68760/elife-68760-fig5-data1-v2.xlsx
Figure 5—figure supplement 1
Rostral-caudal distribution of injection sites in PKCδ-cre mice used for optogenetics behavioral experiments.
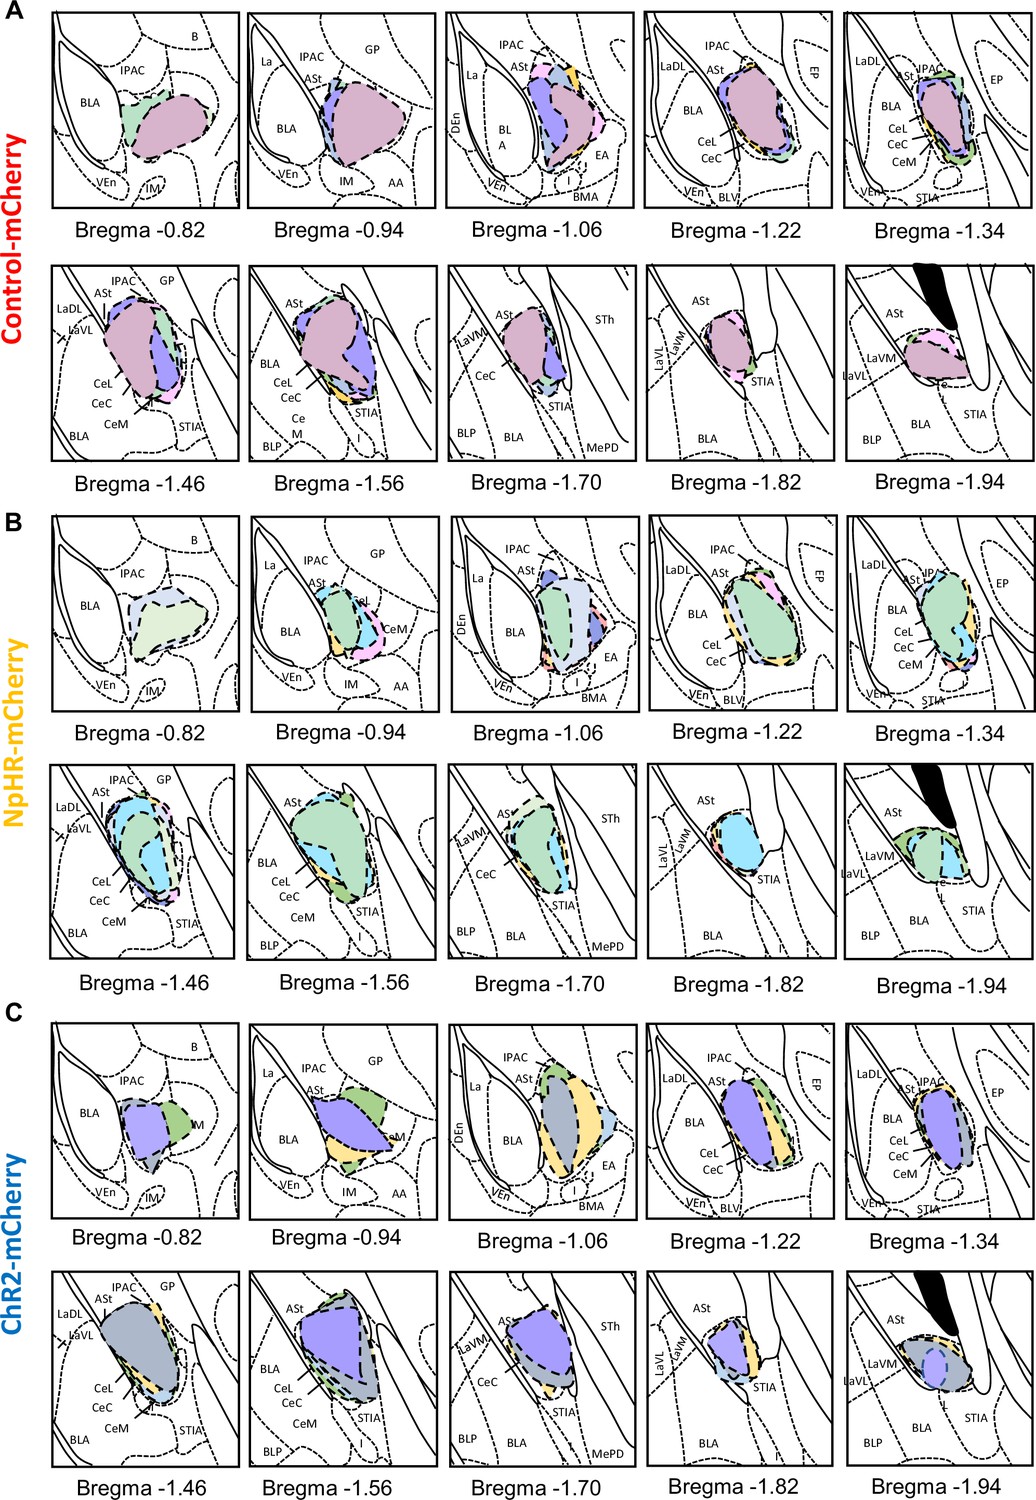
Drawings of injection sites injected into CeA with (A) control-mCherry (B) NpHR-mCherry and (C) ChR2-mCherry. Individual mice are represented in different color.
Figure 6
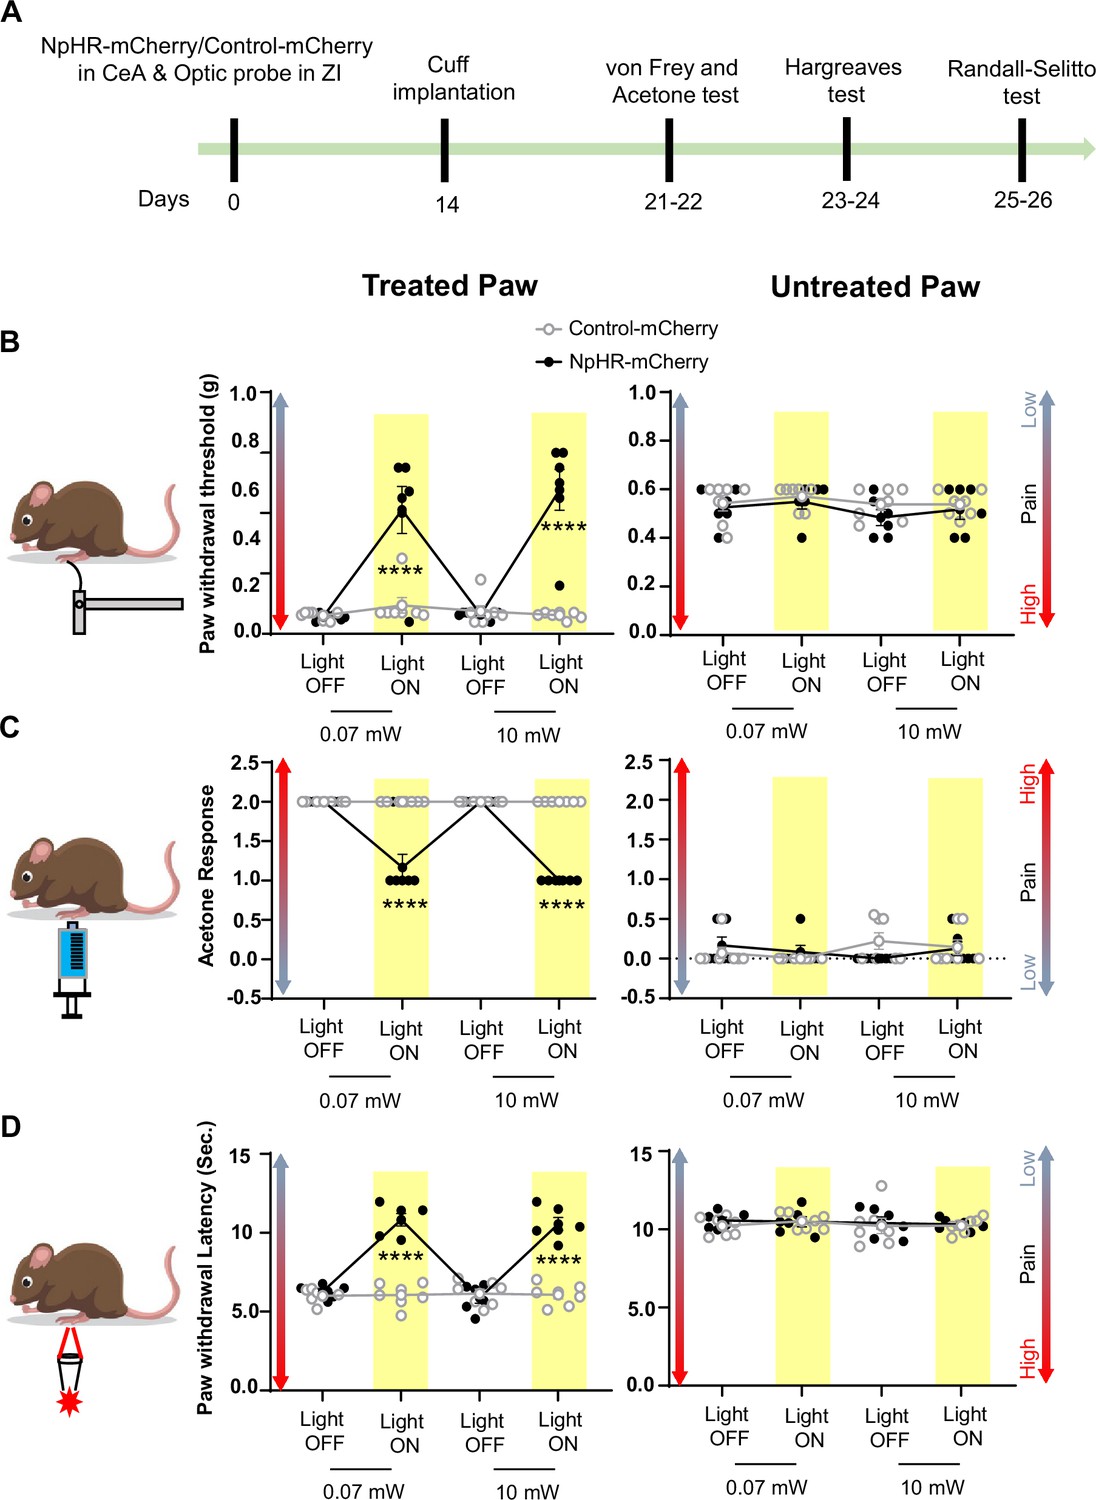
Inhibition of CeA-PKCδ terminals in ZI reduces cuff-induced tactile and thermal hypersensitivity.
(A) Experimental timeline of viral infection in CeA, optic probe implantation in ZI, cuff implantation in sciatic nerve and battery of nociceptive behavior tests. (B–D) Different modalities of pain related behavioral tests in cuff-treated (left panel) and untreated (right panel) hindpaws before and during yellow (λ=561 nm, 0.07 mW and 10 mW) light-induced inhibition of CeA-PKCδ terminals in the ZI of mice expressing NpHR-mCherry or control-mCherry in the CeA. Two-way repeated measures ANOVA followed by Dunnett’s multiple comparison test was performed for all behavioral assays. (B) Tactile hypersensitivity using von Frey test (n=6 for NpHR-mCherry mice and 7 for control-mCherry mice; treated hindpaw: light treatment: F(3,33) = 28.79; ****p<0.0001; brain treatment: F(1,11) = 26.42; ****p<0.0001; interaction: F(3,33) = 26.71; ****p<0.0001; posthoc: 95.00% CI of diff.=–0.4626 to –0.2456, ****p<0.0001 for 0.07 mW and 95.00% CI of diff.=–0.5289 to –0.3119, ****p<0.0001 for 10 mW light intensity for light off vs light on in NpHR-mCherry mice; untreated hindpaw: light treatment: F(3,33) = 0.8907; p=0.4561; brain treatment: F(1,11) = 3.723; p=0.0798; interaction: F(3,33) = 0.1554; p=0.9255) (C) cold hypersensitivity using acetone test (n=6 for NpHR-mCherry mice and 7 for control-mCherry mice; treated paw: light treatment: F(3,33) = 48.57; ****p<0.0001; brain treatment: F(1,11) = 143.3; ****p<0.0001; interaction: F(3,33) = 48.57; ****p<0.0001; posthoc: 95.00% CI of diff.=0.6377–1.029, ****p<0.0001 for 0.07 mW and 95.00% CI of diff.=0.8044–1.196, ****p<0.0001 for 10 mW light intensity for light off vs light on in NpHR-mCherry mice; untreated hindpaw: light treatment: F(3,33) = 0.7780; p=0.5147; brain treatment: F(1, 11)=0.03751; p=0.8500; interaction: F(3,33) = 2.495; p=0.0770) and (D) heat hypersensitivity using Hargreaves test (n=6 for NpHR-mCherry mice and 7 for control-mCherry mice; treated hindpaw: light treatment: F(3,33) = 40.88; ****p<0.0001; brain treatment: F(1,11) = 122.3, ****p<0.0001; interaction: F(3,33) = 41.89; ****p<0.0001; posthoc: 95.00% CI of diff.=–5.619 to –3.49, ****p<0.0001 for 0.07 mW and 95.00% CI of diff.=–5.353 to –3.227, ****p<0.0001 for 10 mW light intensity for light off vs light on in NpHR-mCherry mice; untretaed hindpaw: light treatment: F(3,33) = 0.2300; p=0.8748; brain treatment: F(1,11) = 0.4414; p=0.5201; interaction: F(3,33) = 0.1591, p=0.9231). Yellow bar indicates the behavioral response during opto-inhibition of CeA-PKCδ terminals in the ZI. Results are expressed as mean ± SEM. Scatter points represent individual mice.
-
Figure 6—source data 1
Source data for behavioral responses to tactile, cold and heat stimulation after optogenetic inhibition of CeA-PKCδ terminals in ZI.
- https://cdn.elifesciences.org/articles/68760/elife-68760-fig6-data1-v2.xlsx
Figure 7

Optogenetic activation of CeA-PKCδ terminals in ZI induces pain related hypersensitivity in uninjured paw.
(A) Schematic of experimental approach. PKCδ-cre mice were stereotaxically injected with ChR2-mCherry or control-mCherry virus into the CeA and simultaneously implanted with an optic fiber above the ZI. (B) Representative image of coronal brain slice showing the placement of the optic fiber above the ZI (scale bar 500 µm). (C) Top left panel shows representative image of coronal brain slice illustrating anatomical localization of ChR2-mCherry-transduced cells in the CeA (scale bar 1 mm). The area delineated by the white box is shown at higher magnification in the bottom left panel. ChR2-positive neurons are highlighted by white arrowheads in the insets shown in the right bottom panel. Scale bars represent 100 µm for left bottom image and 10 µm for right bottom image. Mean ± SEM number of ChR2-transduced and control-mCherry transduced CeA cells as a function of rostral-caudal level relative to bregma are shown in the top right panel (n=4 mice for ChR2-transduced neurons and n=6 mice for control-mCherry neurons). (D) Drawing maps illustrating location of optic fiber tips in animals used for opto-activation study. Symbol (O) indicates where the cannula tips were placed in the ZI area. ZID = dorsal zona incerta, ZIV = ventral zona incerta, ic = internal capsule, cp = cerebral peduncle, opt = optic tract, mt = mammillothalamic tract. (E) Left panel - schematic diagram of experimental approach. ChR2-mCherry was injected in the CeA of PKCδ-cre mice. Patch-clamp recordings of ChR2-negative and ChR2-positive neurons in acute brain slices were collected 2 weeks following the stereotaxic injection. Right panel – representative differential contrast and fluorescent images illustrating the anatomical localization of ChR2-transduced cells in the CeA. Scale bars represent 500 µm. LA = lateral amygdala, BLA = basolateral amygdala, CeA = central amygdala. (F–G) Representative current (F) and voltage (G) traces of ChR2-negative and ChR2-positive neurons in response to blue light (λ=470 nm, 10 Hz, 5ms) stimulation, depicted by the blue bars. Right panel in (G) proportion of ChR2-positive neurons with different spike fidelity (n=11 ChR2-positive cells, n=3 ChR2-negative cells). (H) Top panel shows experimental timeline. Randall-Selitto responses are shown as mean ± SEM paw withdrawal threshold in cuff-treated (left panel) and untreated (right panel) hindpaws before, during and after blue (λ=473 nm, 10 mW) light-induced activation of CeA-PKCδ terminals in the ZI of mice expressing ChR2-mCherry or control-mCherry in the CeA (n=7 for both ChR2-mCherry and control-mCherry mice; two-way repeated measures ANOVA followed by Dunnett’s multiple comparison test: treated hindpaw- light treatment: F(2, 24)=0.2333; p=0.7937; brain treatment: F(1,12) = 0.8852; p=0.3653; interaction: F(2, 24)=0.4450; p=0.6460; untreated hindpaw: light treatment: F(2,24) = 314.7; ****p<0.0001; brain treatment: F(1,12) = 220.6; ****p<0.0001; interaction: F(2,24) = 352.0; ****p<0.0001; posthoc: 95.00% CI of diff.=86.28–100.0, ****p<0.0001 for light off vs light on in ChR2-mCherry mice). Blue bar indicates the behavioral response upon opto-activation of CeA-PKCδ terminals in ZI. Scatter points represent individual mice. (I) Blue (λ=473 nm) laser intensity response curve during Randall-Selitto in the untreated hindpaw. Mean ± SEM paw withdrawal response as a function of increasing laser intensities during blue (λ=473 nm) light induced activation of CeA-PKCδ terminals in the ZI of mice expressing ChR2-mCherry or control-mCherry in the CeA (n=3–8 for ChR2-mCherry mice and n=2–7 for control-mCherry mice; two-way repeated measures ANOVA: F(5, 31)=77.96, ****p<0.0001 for laser intensity effect on untreated paw withdrawal responses in mice expressing ChR2-mCherry). Scatter points represent individual mice.
-
Figure 7—source data 1
Source data for optogenetic activation of CeA-PKCδ terminals in ZI.
- https://cdn.elifesciences.org/articles/68760/elife-68760-fig7-data1-v2.xlsx
Figure 8
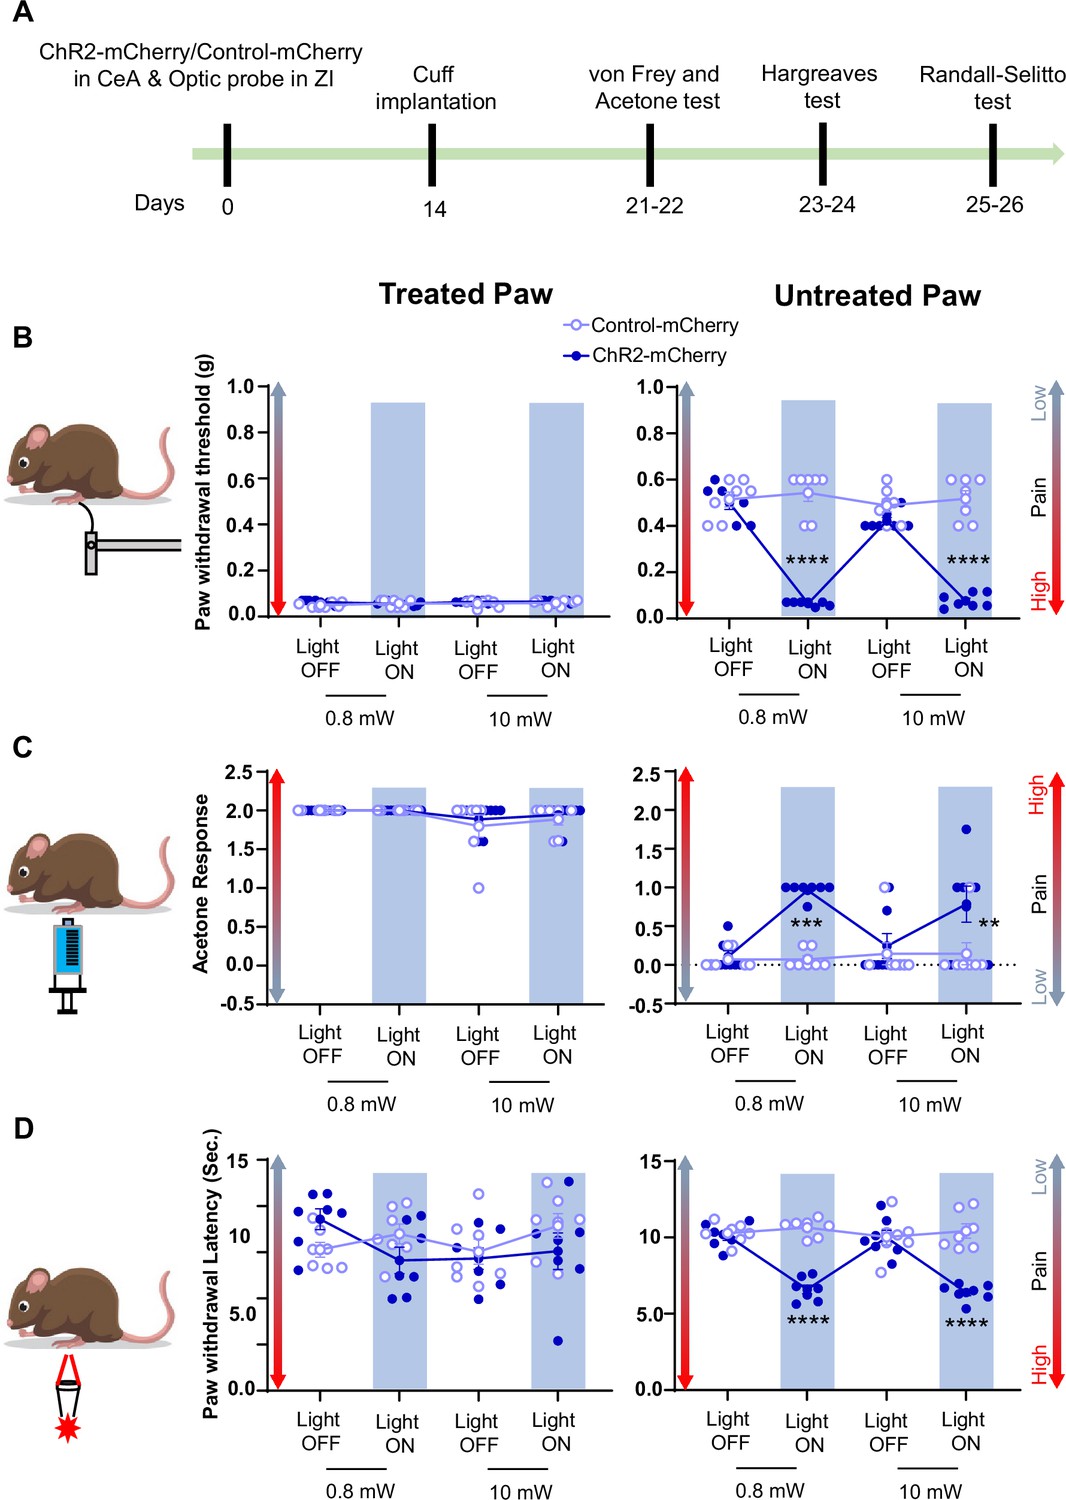
Activation of CeA-PKCδ terminals in ZI induces pain related tactile and thermal hypersensitivity in uninjured paw.
(A) Experimental timeline of viral infection in CeA, optic probe implantation in ZI, cuff implantation in sciatic nerve and battery of nociceptive behavior tests. (B–D) Different modalities of pain related behavioral tests in cuff-treated (left panel) and untreated (right panel) hindpaws before and during blue light (λ=473 nm, 0.8 mW and 10 mW) light-induced activation of CeA-PKCδ terminals in the ZI of mice expressing ChR2-mCherry or control-mCherry in the CeA. Two-way repeated measures ANOVA followed by Dunnett’s multiple comparison test was performed for all behavioral assays. n=7 mice per treatment. (B) Tactile hypersensitivity using von Frey test (treated hindpaw: light treatment: F(3,36) = 1.287; p=0.2937; brain treatment: F(1,12) = 2.390; p=0.1481; interaction: F(3,36) = 1.511; p=0.2282; untreated hindpaw: light treatment: F(3,36) = 92.80; ****p<0.0001; brain treatment: F(1,12) = 60.38; ****p<0.0001; interaction: F(3,36) = 120.8; ****p<0.0001; posthoc: 95.00% CI of diff.=0.3811–0.4896, ****p<0.0001 for 0.8 mW and 95.00% CI of diff.=0.3693–0.4778, ****p<0.0001 for 10 mW light intensity for light off vs light on in ChR2-mCherry mice) (C) cold hypersensitivity using acetone test (treated hindpaw: light treatment: F(3,36) = 3.418; p=0.0274; brain treatment: F(1,12) = 0.3386; p=0.5714; interaction: F(3,36) = 0.2698; p=0.8467; untreated hindpaw: light treatment: F(3,36) = 4.760; p=0.0068; brain treatment: F(1,12) = 29.45; ***p=0.0002; interaction: F(3,36) = 4.817; p=0.0064; posthoc: 95.00% CI of diff.=–1.324 to –0.3905, ***p=0.0002.for 0.8 mW and 95.00% CI of diff.=–1.145 to –0.2119, **p=0.0030 for 10 mW intensity of light off vs light on in ChR2-mCherry mice) and (D) heat hypersensitivity using Hargreaves test (treated hindpaw: light treatment: F(3,36) = 0.9690; p=0.4180: brain treatment: F(1,12) = 1.420; p=0.2564; interaction: F(3,36) = 2.020; p=0.1284; untreated hindpaw: light treatment: F(3,36) = 12.90; ****p<0.0001; brain treatment: F(1,12) = 69.76; ****p<0.0001; interaction: F(3,36) = 19.54; ****p<0.0001; posthoc: 95.00% CI of diff.=2.249–4.771, ****p<0.0001 for 0.8 mW and 95.00% CI of diff.=2.451–4.972, ****p<0.0001 for 10 mW intensity of light off vs light on in ChR2-mCherry mice). Blue bar indicates the behavioral response during opto-activation of CeA-PKCδ terminals in the ZI. Results are expressed as mean ± SEM. Scatter points represent individual mice.
-
Figure 8—source data 1
Source data for behavioral responses to tactile, cold and heat stimulation after optogenetic inhibition of CeA-PKCδ terminals in ZI.
- https://cdn.elifesciences.org/articles/68760/elife-68760-fig8-data1-v2.xlsx
Figure 9
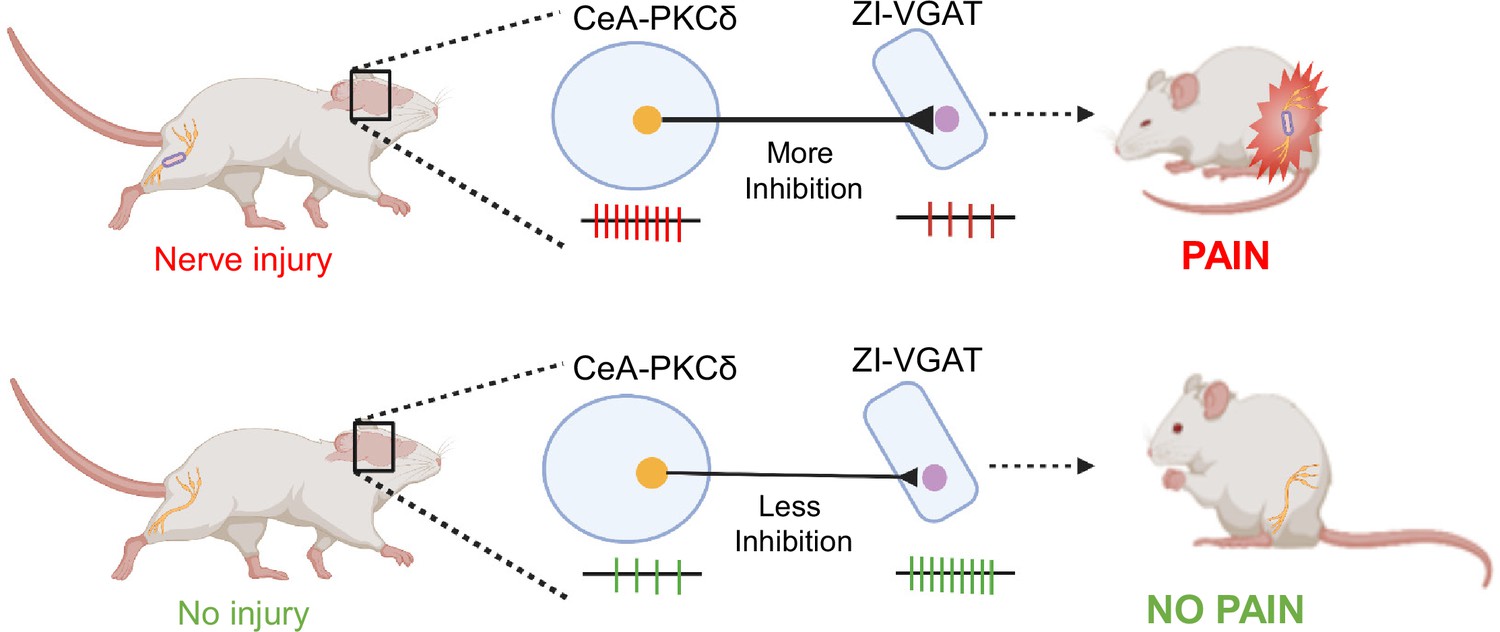
Proposed model for modulation of pain-related behaviors in the ZI.
Schematic drawing showing activation of CeA-PKCδ neurons after nerve injury, which leads to inhibition of VGAT-positive ZI neurons (ZI-VGAT), subsequently promoting behavioral hypersensitivity.
Tables
Table 1
CeA-PKCδ neuronal efferent targets.
Semi-quantitative analysis of the density of axonal terminals in brain regions from 5 PKCδ-Cre mice stereotaxically injected with an adeno-associated virus expressing the cre-dependent gene (mCherry, ChrimsonR-tdTomato, EGFP) into the CeA. Rightmost column is from experiment 265945645 of the Mouse Brain Connectivity Atlas of the Allen Brain Institute (http://connectivity.brain-map.org/). - no expression;+sparse;++moderate;+++dense.
| Area | Abbreviations | ET832 mCherry | ET835 mCherry | ET 987 ChrimsonR | ET 903 ChrimsonR | Allen Brain Atlas EGFP |
|---|---|---|---|---|---|---|
| Striatum and Basal Forebrain | ||||||
| Bed nucleus of stria terminalis | BNST | +++ | +++ | +++ | +++ | +++ |
| Globus pallidus | GP | ++ | + | + | + | + |
| Extended amygdala | EA | +++ | +/++ | +++ | +++ | +++ |
| Central amygdala | CeA | ++ | +/++ | +++ | +++ | ++ |
| Substantia innominata | SI | ++ | +/++ | ++ | ++ | ++ |
| Thalamus | ||||||
| Subthalamic nucleus | STh | + | - | ++ | + | - |
| Zona Incerta | ZI | ++ | - | ++ | + | + |
| Para subthalamic nucleus | PSTh | +/++ | + | ++ | ++ | - |
| Hypothalamus | ||||||
| lateral preoptic area | LPO | +/++ | + | + | + | + |
| Lateral hypothalamus | LH | +/++ | + | + | + | + |
| Midbrain | ||||||
| Ventral tegmental area | VTA | +/++ | - | +/++ | + | - |
| Substantia nigra | SN | ++ | + | ++ | +/++ | - |
| Pedunculopontine tegmental nucleus | PTg | ++ | - | + | + | - |
| Laterodorsal tegmental nucleus | LDTg | - | + | + | + | - |
| Periaqueductal grey | PAG | - | + | +/++ | + | - |
| Reticular formation | mRT | +/++ | +/++ | +/++ | + | - |
| Pons | ||||||
| Lateral parabrachial | LPB | ++/+++ | + | +++ | +++ | - |
| Locus coeruleus | LC | ++ | + | + | + | - |
Key resources table
| Reagent type (species) or resource | Designation | Source or reference | Identifiers | Additional information |
|---|---|---|---|---|
| Genetic reagent (M. musculus) | PKCδ-cre mice | GENSAT | founder line 011559-UCD | |
| Genetic reagent (M. musculus) | Ai9 mice | Jackson Laboratories | Stock number 007909 | |
| Genetic reagent (M. musculus) | Vesicular GABA transporter Cre mice | Jackson Laboratories | Stock number 016962 | |
| Genetic reagent (M. musculus) | C57BL/6NJ mice | Jackson Laboratories | Stock number 005304 | |
| Transfected construct (M. musculus) | pAAV8-hSyn-DIO-hM4D(Gi)-mCherry | Addgene; donated by Bryan Roth Krashes et al., 2011 | Addgene:#44362-AAV8 | |
| Transfected construct (M. musculus) | pAAV8-hSyn-DIO-mCherry | Addgene; donated by Bryan Roth | Addgene:#50459-AAV8 | |
| Transfected construct (M. musculus) | pAAV8-hSyn-DIO-hM3D(Gq)-mCherry | Addgene; donated by Bryan Roth Krashes et al., 2011 | Addgene:#44361-AAV8 | |
| Transfected construct (M. musculus) | AAV9-Syn-Flex-ChrimsonR-tdTomato | UNC; donated by Edward Boyden | Lot Number AV4384G | |
| Transfected construct (M. musculus) | rAAV2-hSyn-hChR2(H134R)-EYFP-WPRE-PA | UNC; donated by Karl Deisseroth | Lot Number AV6556C | |
| Transfected construct (M. musculus) | pAAV8-EF1a-double floxed-hChR2 (H134R)-mCherry-WPRE-HGHpA | Addgene; donated by Karl Deisseroth | Addgene:#20297-AAV8 | |
| Transfected construct (M. musculus) | AAV2-EF1a-DIO-eNpHR3.0-mCherry | UNC; donated by Karl Deisseroth | Lot Number AV4872B | |
| Transfected construct (M. musculus) | AAV2-EF1a-DIO mCherry | UNC; donated by Bryan Roth | Lot Number AV4735E | |
| Antibody (rat monoclonal) | rat anti-mCherr | Invitrogen | M11217 | 1:500 |
| Antibody (rabbit monoclonal) | rabbit anti-Phospho-c-Fos (Ser32) | Cell Signaling Technology | 5348 | 1:2000 |
| Antibody (mouse monoclonal) | mouse anti-PKCδ | BD Biosciences | 610397 | 1:1000 |
| Antibody (goat polyclonal) | goat anti-rat Cy3 | Invitrogen | A10522 | 1:250 |
| Antibody (goat polyclonal) | Alexa Fluor 647-conjugated goat anti-rabbit | Invitrogen | A21244 | 1:250 |
| Antibody (goat polyclonal) | Alexa Fluor 647-conjugated goat anti-mouse | Invitrogen | A21235 | 1:100 |
| Sequence-based reagent | Forward primer to genotype for the presence of cre-recombinase: TTAATCCATATTGGCAGAACGAAAACG | Transnetyx | Transnetyx.com | |
| Sequence-based reagent | Reverse primer to genotype for the presence of cre-recombinase: AGGCTAAGTGCCTTCTCTACA | Transnetyx | Transnetyx.com | |
| Peptide, recombinant protein | Alexa Fluor 647-conjugated cholera toxin subunit B | Invitrogen | C34778 |
Additional files
Download links
A two-part list of links to download the article, or parts of the article, in various formats.
Downloads (link to download the article as PDF)
Open citations (links to open the citations from this article in various online reference manager services)
Cite this article (links to download the citations from this article in formats compatible with various reference manager tools)
An inhibitory circuit from central amygdala to zona incerta drives pain-related behaviors in mice
eLife 11:e68760.
https://doi.org/10.7554/eLife.68760


