Bipartite binding and partial inhibition links DEPTOR and mTOR in a mutually antagonistic embrace
- MRC Laboratory of Molecular Biology, United Kingdom
- Department of Molecular Biology, University of Geneva, Switzerland
Figures
Figure 1 with 1 supplement
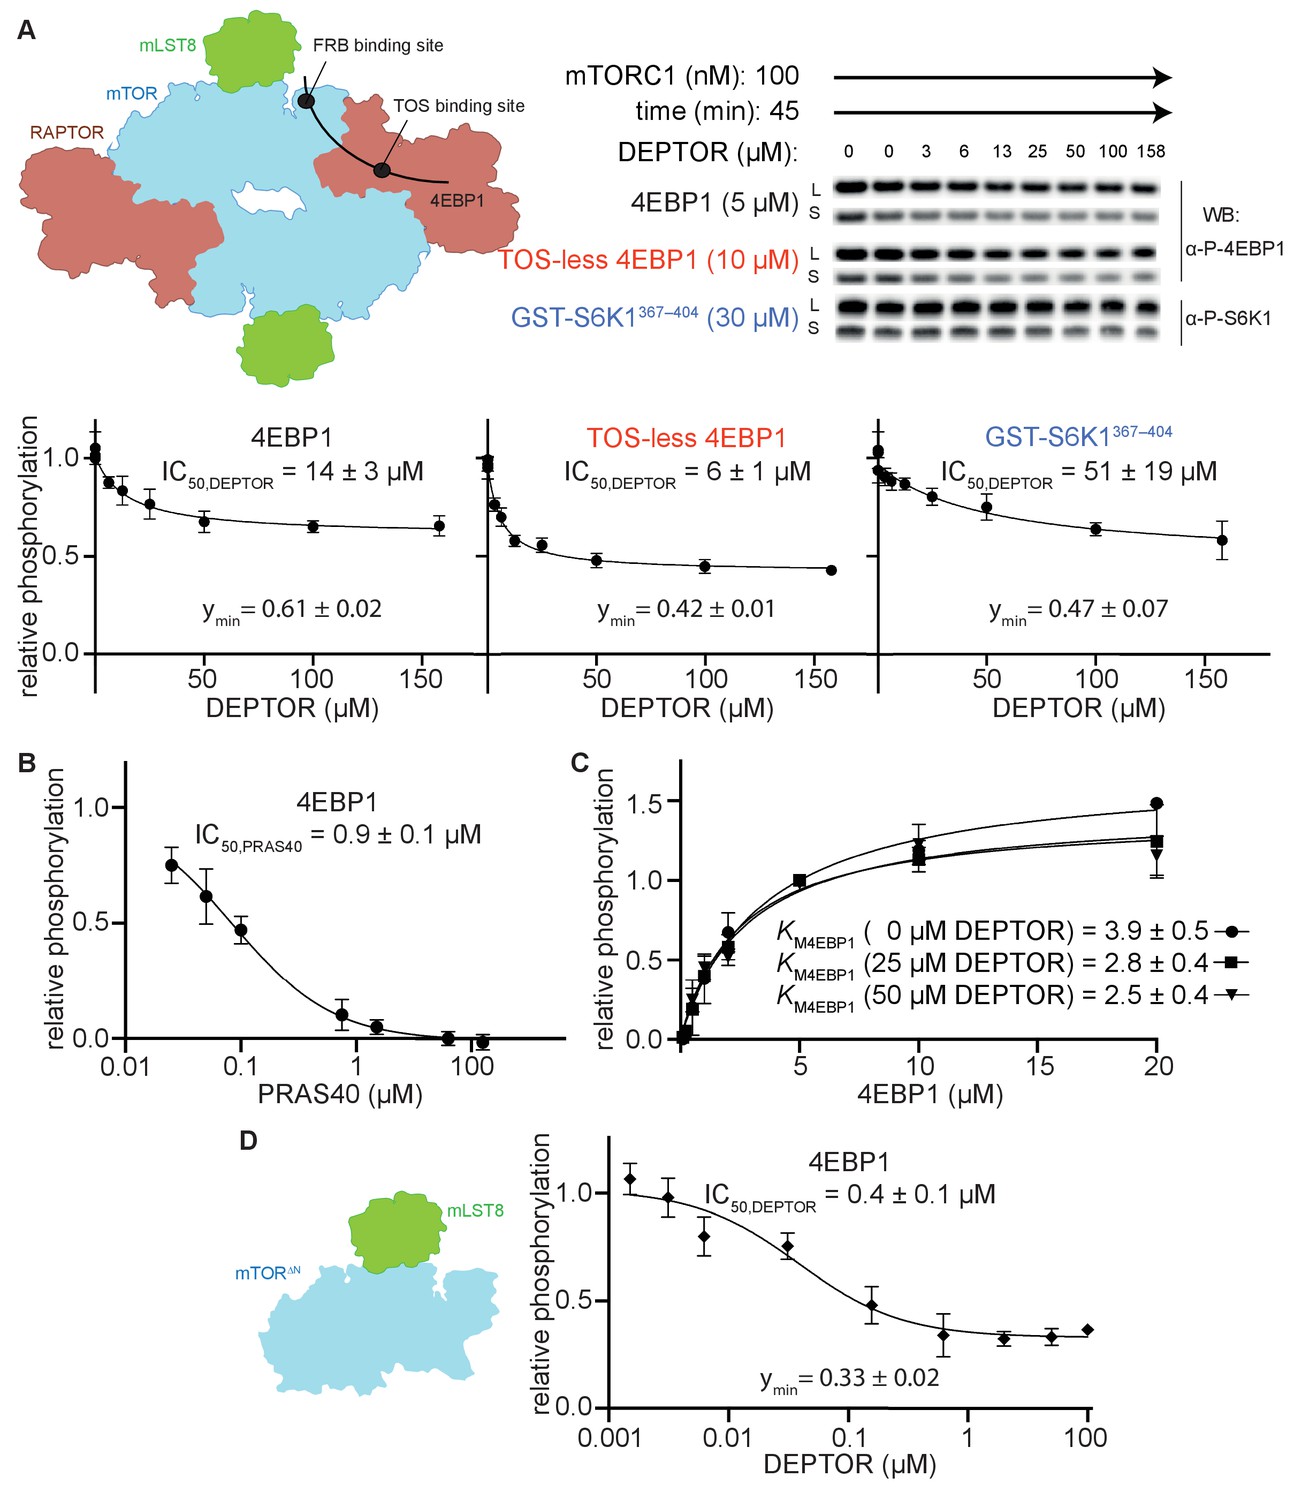
DEPTOR is a partial inhibitor of mTORC1, independent of substrate identity.
(A) Inhibition of the mTORC1 kinase activity by DEPTOR. mTORC1 schematic illustrating the two known substrate-binding sites, the TOS-binding site on RAPTOR and the FRB-binding site on mTOR, for 4EBP1 and S6K1 (left panel). Phosphorylation of substrates was analyzed by western blots using anti p-4EBP1 (Thr37/46) or anti p-S6K1 (Thr389) primary antibodies (right panel). Images of western blots with long (L) and short exposures (S) are shown. The S6K1367-404 peptide encompasses only the FRB-binding site of S6K1. The bottom panels show the quantification of the phosphorylation levels of the substrates based on the western blots from three independent experiments (mean ± SD). Band intensities were normalized to the control (0 µM DEPTOR) and data were plotted and fit by non-linear regression to determine IC50 and ymin (the residual activity at high [DEPTOR]) as described in Materials and methods. See Figure 1—figure supplement 1A,B for complementary experiment using Phos-tag SDS PAGE detection. (B) Inhibition of mTORC1 by PRAS40. Inhibition of 4EBP1 phosphorylation is complete under identical reaction conditions as carried out for DEPTOR. (C) DEPTOR has no effect on the apparent KM,4EBP1. The phosphorylation of 4EBP1 in the absence and presence of DEPTOR (25 µM or 50 µM), normalized to the 5 µM 4EBP1 is plotted (mean ± SD, n ≥ 3) and KM values were fit as described in Materials and methods. (D) Inhibition of monomeric mTORΔN-mLST8 (left panel) by DEPTOR (mean ± SD, n ≥ 3). Similar to the wild-type mTORC1 complex, partial inhibition is observed (right panel).
-
Figure 1—source data 1
Uncropped blots.
- https://cdn.elifesciences.org/articles/68799/elife-68799-fig1-data1-v1.ai
-
Figure 1—source data 2
Data values for Figure 1.
- https://cdn.elifesciences.org/articles/68799/elife-68799-fig1-data2-v1.xlsx
Figure 1—figure supplement 1
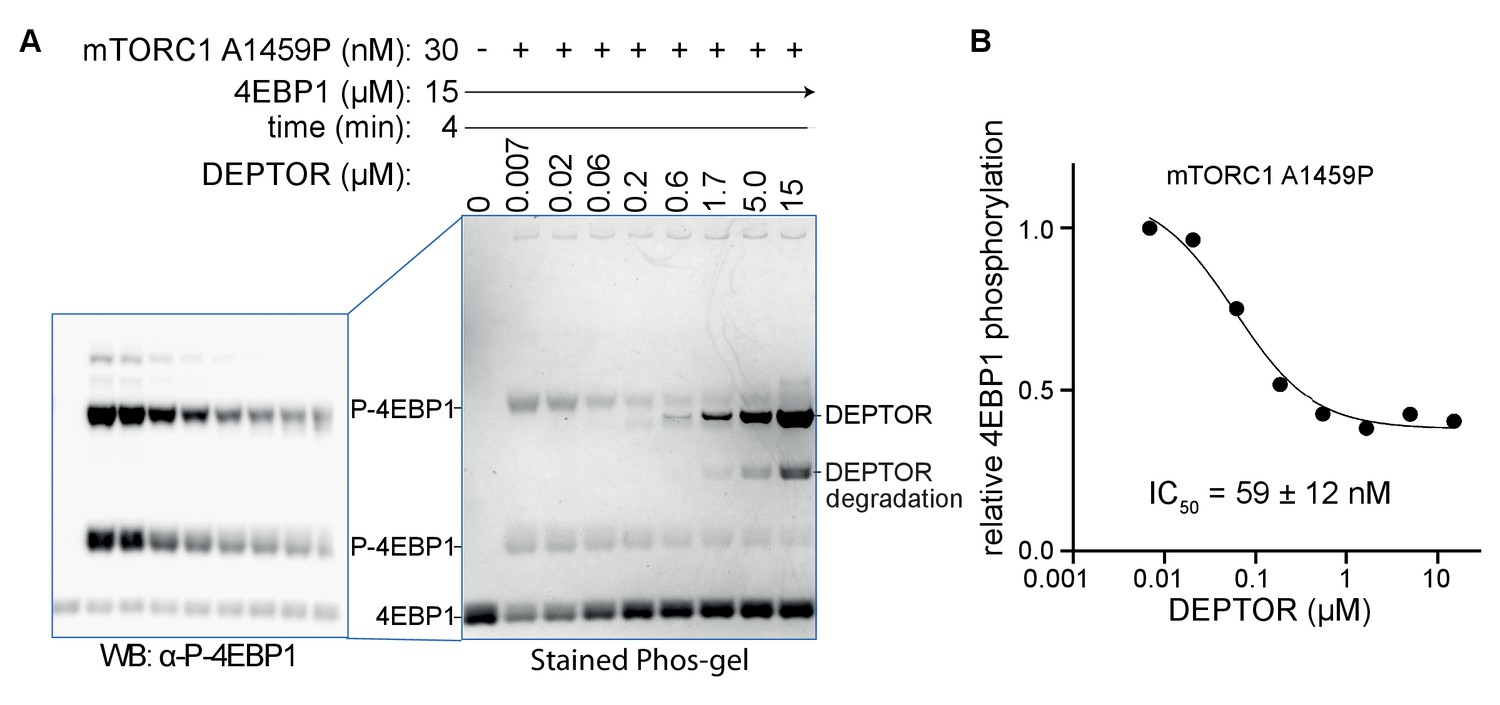
DEPTOR is a partial inhibitor of mTORC1, analyzed by Phos-tag SDS PAGE and western blot.
(A) DEPTOR inhibition of mTORC1 cancer-associated mutant A1459P phosphorylating 4EBP1 measured by Phos-tag SDS PAGE, stained with InstantBlue. A second Phos-tag SDS PAGE was used for a western blot analysis in order to identify all P-4EBP1 bands. (B) The plot of mTORC1-A1459 activity measured by P-4EBP resolved by the Phos-tag gel shown in (A). The plot is representative of three independent replicates. Intensity of all P-4EBP1 bands in one lane was normalized to the P-4EBP1 intensity at the lowest DEPTOR concentration. The IC50 for mTORC1 A1459P inhibition by DEPTOR was also tested via a western blot experiment, resulting in a comparable value (Figure 6B).
-
Figure 1—figure supplement 1—source data 1
Uncropped blot and stained gel.
- https://cdn.elifesciences.org/articles/68799/elife-68799-fig1-figsupp1-data1-v1.ai
-
Figure 1—figure supplement 1—source data 2
Data values.
- https://cdn.elifesciences.org/articles/68799/elife-68799-fig1-figsupp1-data2-v1.xlsx
Figure 2 with 1 supplement
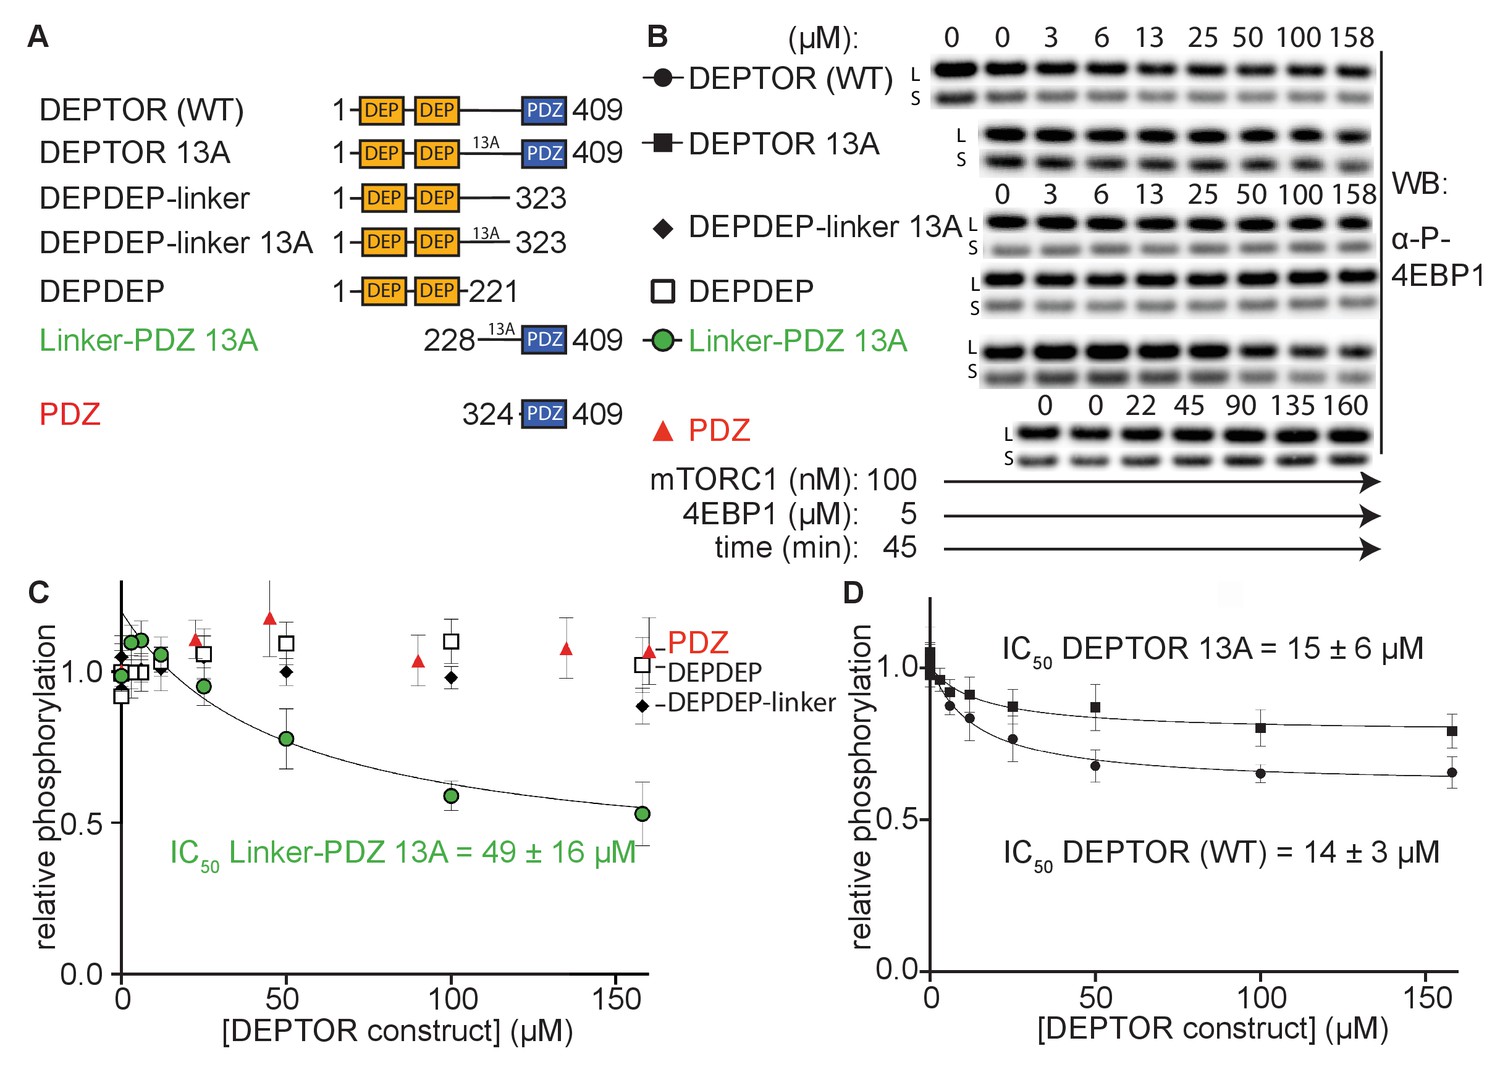
The minimal inhibitory unit of DEPTOR is long-linker-PDZ.
(A) DEPTOR deletion variants tested as inhibitors and substrates for mTORC1. (B) Immunoblots showing the residual phosphorylation of 4EBP1 in the presence of various DEPTOR deletion variants. Images of western blots with long (L) and short exposures (S) are shown. (C) and (D) quantification of western blots of phosphorylated 4EBP1 plotted as a fraction of the control (0 µM inhibitor) vs. inhibited (mean ± SD, n ≥ 3) and fit to a non-linear regression for all deletion variants to determine IC50. While all experiments were performed at 30°C, inhibition of mTORC1 by the PDZ domain was tested at 20°C for 20 min as the domain stability was low. N-terminally extended PDZ constructs that showed increased temperature stability showed no inhibition of mTORC1 (Figure 2—figure supplement 1A). To demonstrate that the temperature difference had no effect on the inhibition, DEPTOR (WT) was tested at 20°C for mTORC1 inhibition (Figure 2—figure supplement 1B). The data shown for DEPTOR (WT) is also part of Figure 1A. DEPTOR 13A inhibition of the mTORC1 A1459P mutant is shown in Figure 2—figure supplement 1C.
-
Figure 2—source data 1
Uncropped blots.
- https://cdn.elifesciences.org/articles/68799/elife-68799-fig2-data1-v1.ai
-
Figure 2—source data 2
Data values for Figure 2.
- https://cdn.elifesciences.org/articles/68799/elife-68799-fig2-data2-v1.xlsx
Figure 2—figure supplement 1
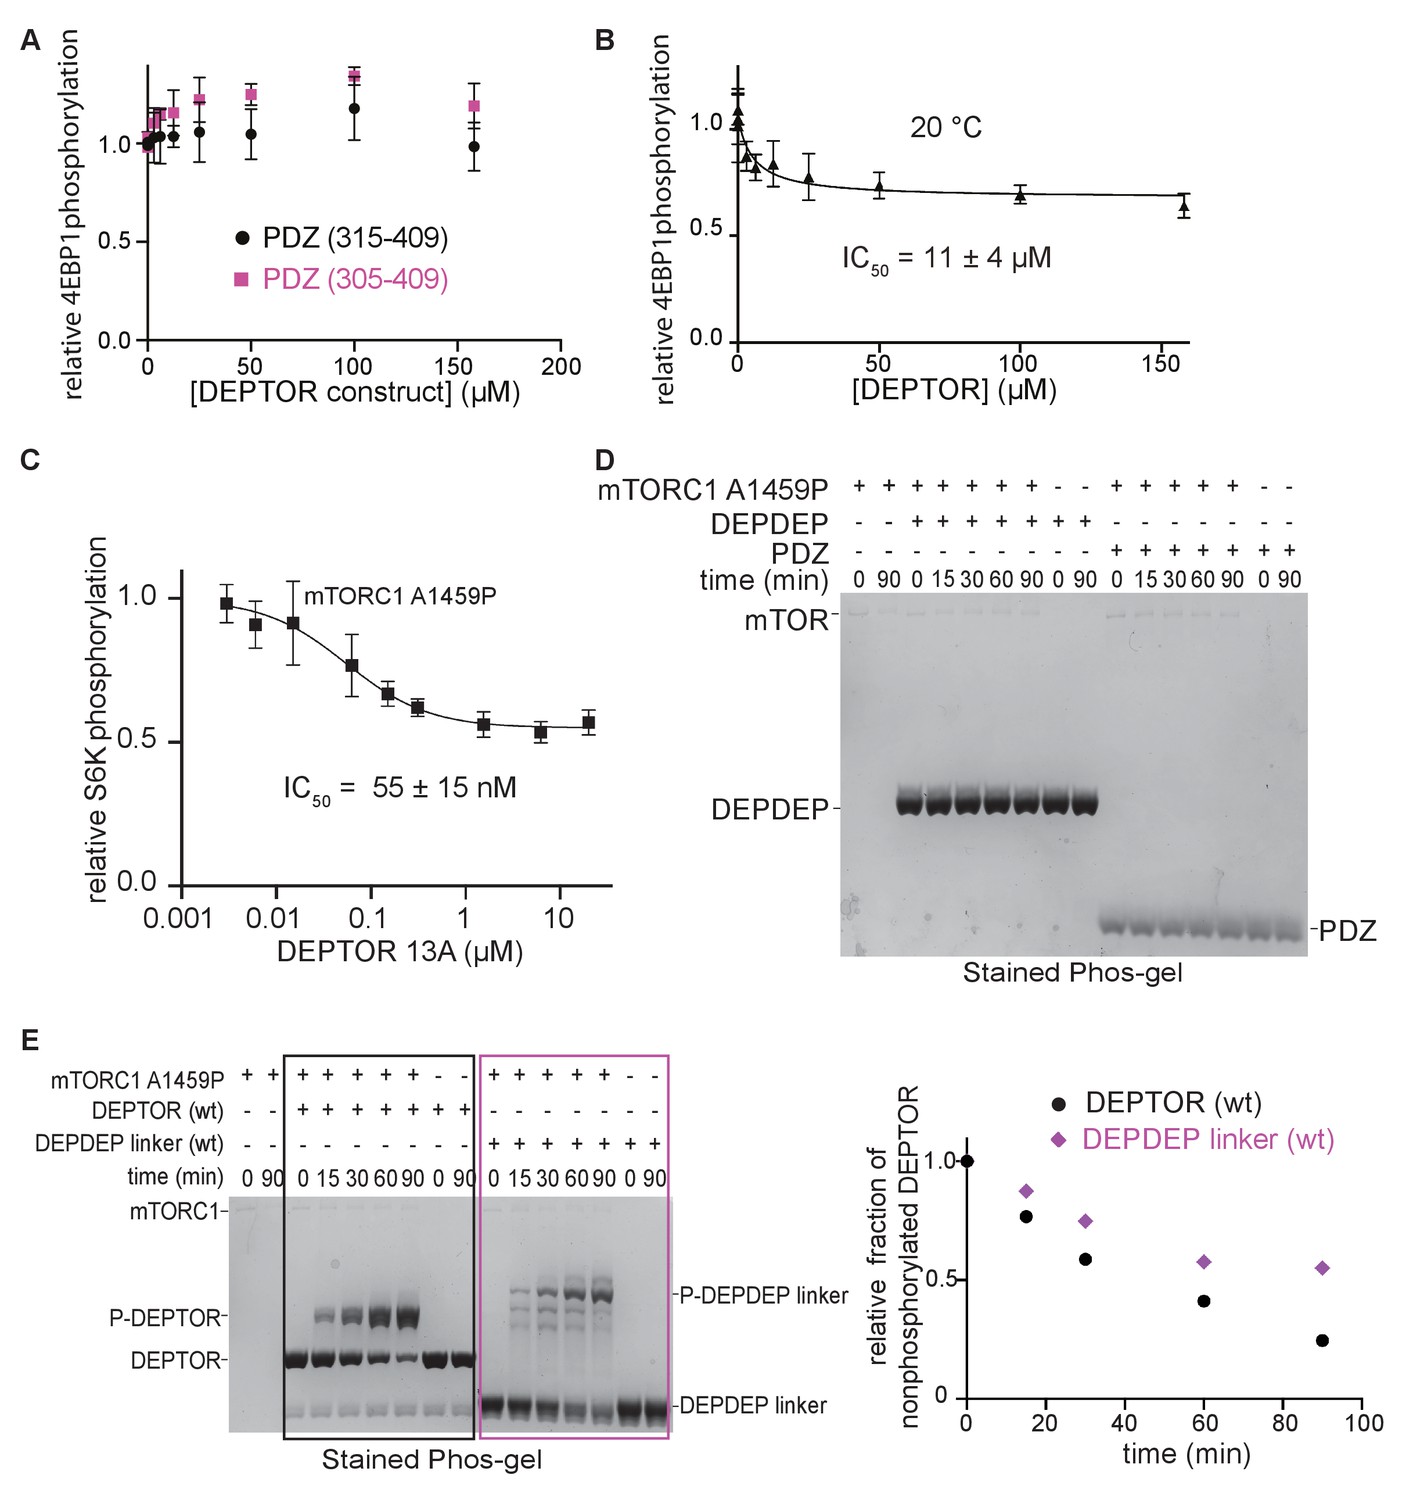
DEPTOR is a partial inhibitor of mTORC1, analyzed by Phos-tag SDS PAGE and western blot.
(A) The PDZ construct (324-409) was extended at the N-terminus to encompass residues 305–409 or 315–409 in order to obtain a more stable construct that could be used for assays at 30°C. No inhibition of mTORC1 kinase activity was observed in a western blot experiment with these two PDZ constructs at 30°C. (B) DEPTOR inhibition of mTORC1 was tested at 20°C (as compared with the results at 30°C, as shown in Figure 2D) via western blot experiment to allow a direct comparison with the inhibitory properties of temperature-sensitive DEPTOR PDZ domain. The data (mean ± SD, n ≥ 3) were fit by a nonlinear regression to determine IC50. (C) DEPTOR 13A inhibition of the mTORC1-A1459P mutant phosphorylating GST-S6K367-404 peptide measured by western blots. Band intensities were normalized to the control (0 µM DEPTOR). The data (mean ± SD, n = 3) were fitted. (D) The tandem DEPDEP and the PDZ domain are not substrates of mTORC1. No phosphorylation is observed in a Phos-tag SDS PAGE experiment. (E) DEPTOR as an mTORC1 substrate was investigated via Phos-tag SDS PAGE. DEPDEP-linker construct (residues 1–323) is phosphorylated slower than the full-length DEPTOR (WT), suggesting that the PDZ domain helps successful interaction at the FRB and active site (one representative of a triplicate experiment is shown).
-
Figure 2—figure supplement 1—source data 1
Uncropped stained gels.
- https://cdn.elifesciences.org/articles/68799/elife-68799-fig2-figsupp1-data1-v1.ai
-
Figure 2—figure supplement 1—source data 2
Data values.
- https://cdn.elifesciences.org/articles/68799/elife-68799-fig2-figsupp1-data2-v1.xlsx
Figure 3 with 2 supplements
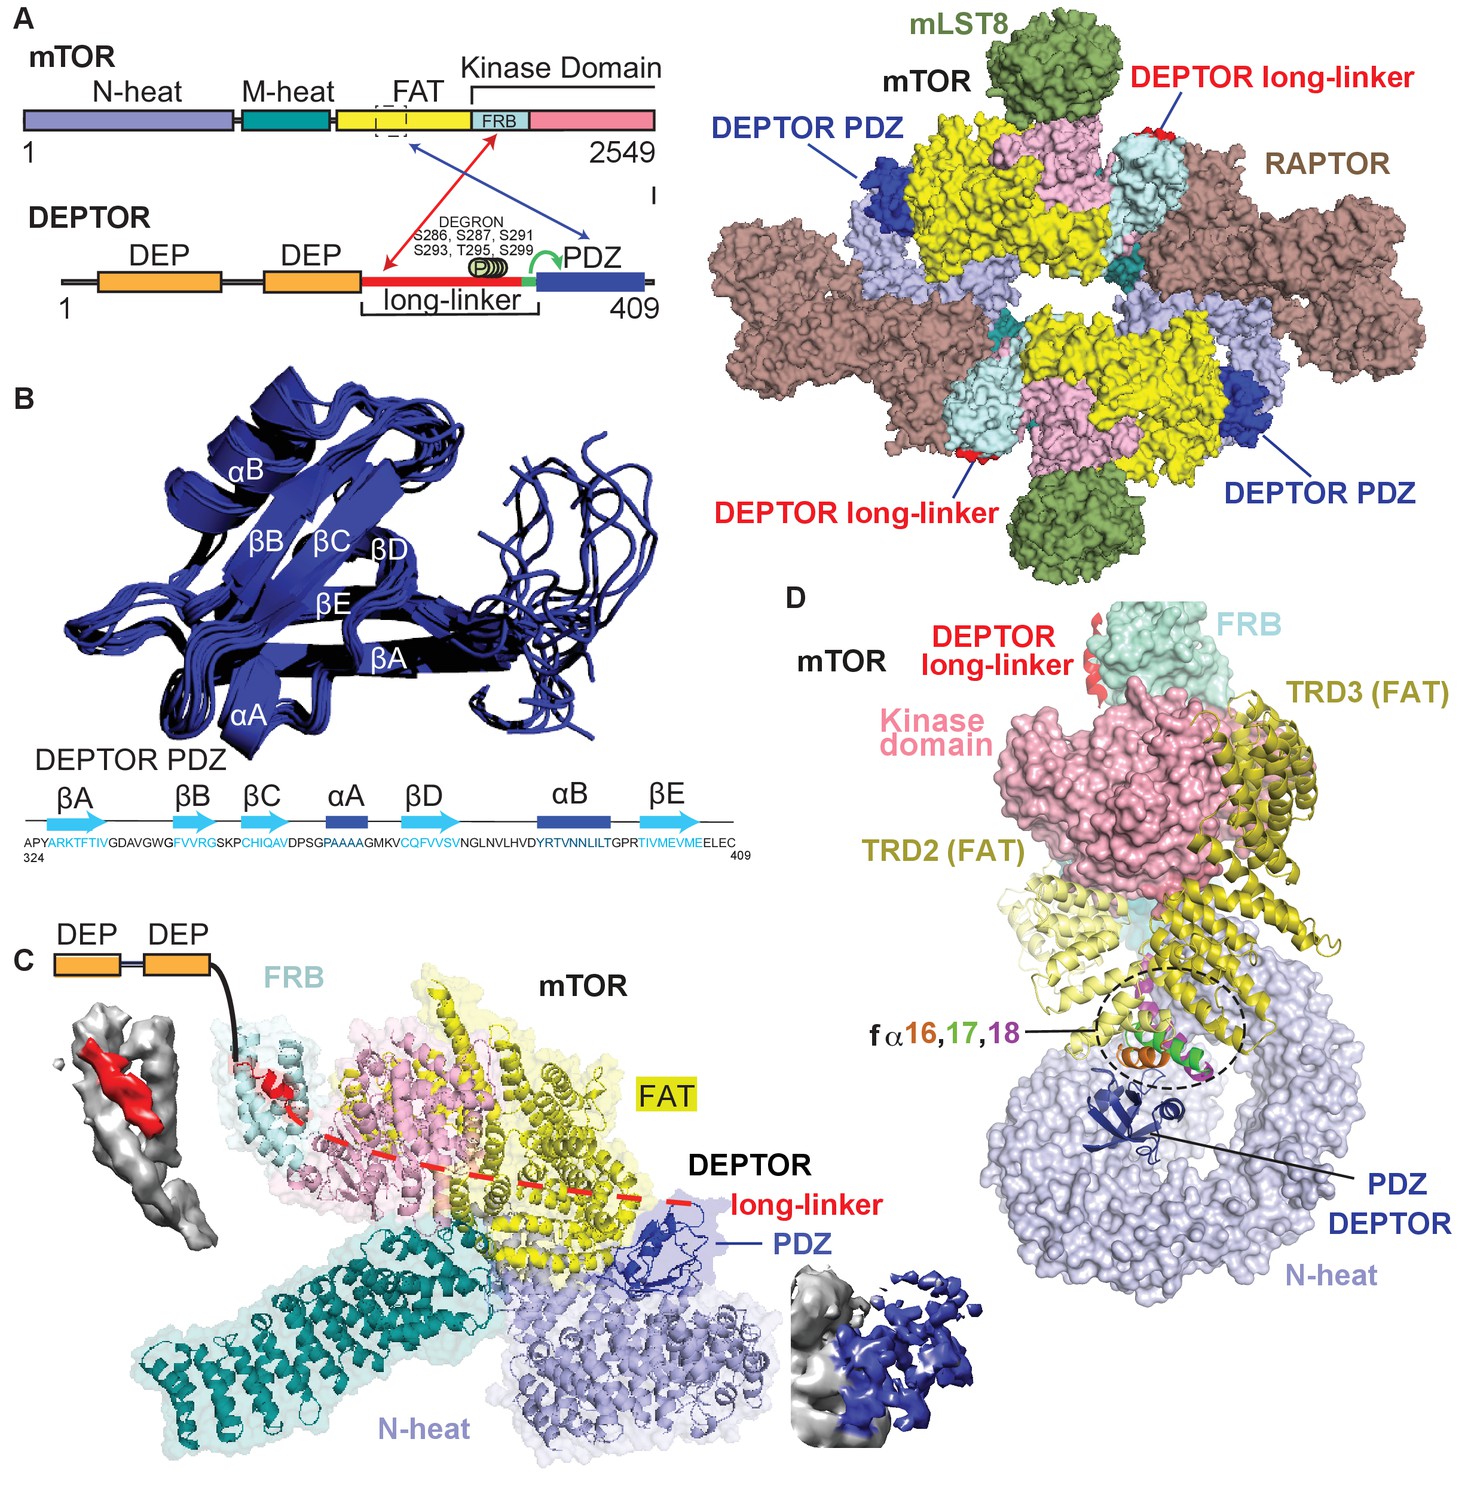
Cryo-EM structure of mTORC1/DEPTOR reveals bipartite binding mode of DEPTOR linker-PDZ to mTOR.
(A) Domain organization of mTOR and DEPTOR is shown on the left. The region of interaction between the mTOR FAT domain residues 1527–1571 and the DEPTOR PDZ domain, as well as the mTOR FRB domain and the DEPTOR linker are highlighted with arrows. Surface representation of the model for the mTORC1/DEPTOR complex is shown on the right, color-coded by domains. Only the linker and PDZ domain, not the tandem DEP domain of DEPTOR are visible in the cryo-EM density. See Figure 3—figure supplement 2 and Table 1 for cryo-EM data details. (B) The 10 lowest energy homology models of DEPTOR PDZ produced using CS-Rosetta guided by NMR data, including 14 NOE distance restraints. DEPTOR PDZ construct (324-409) was used. See Figure 5—figure supplement 2A for the assigned 1H-15N BEST-TROSY spectrum of the PDZ domain. (C) A close-up of DEPTOR binding to the mTOR subunit shows DEPTOR PDZ domain in a crevice between the FAT domain and the N-heat of mTOR. DEPTOR long-linker (red) forms interactions at the FRB domain. The dashed line spans the distance of DEPTOR long-linker between the two binding sites. Cryo-EM density for DEPTOR and its binding sites is shown next to the model. The density for mTOR, PDZ, and long-linker are colored in gray, blue, and red, respectively. (D) Three mTOR helices (fα16, fα17, fα18) at the junction of two solenoids (TRD2 and TRD3) in the FAT domain are splayed and form a non-canonical interface with the DEPTOR PDZ domain.
Figure 3—figure supplement 1
DEPTOR interaction with mTORC1.
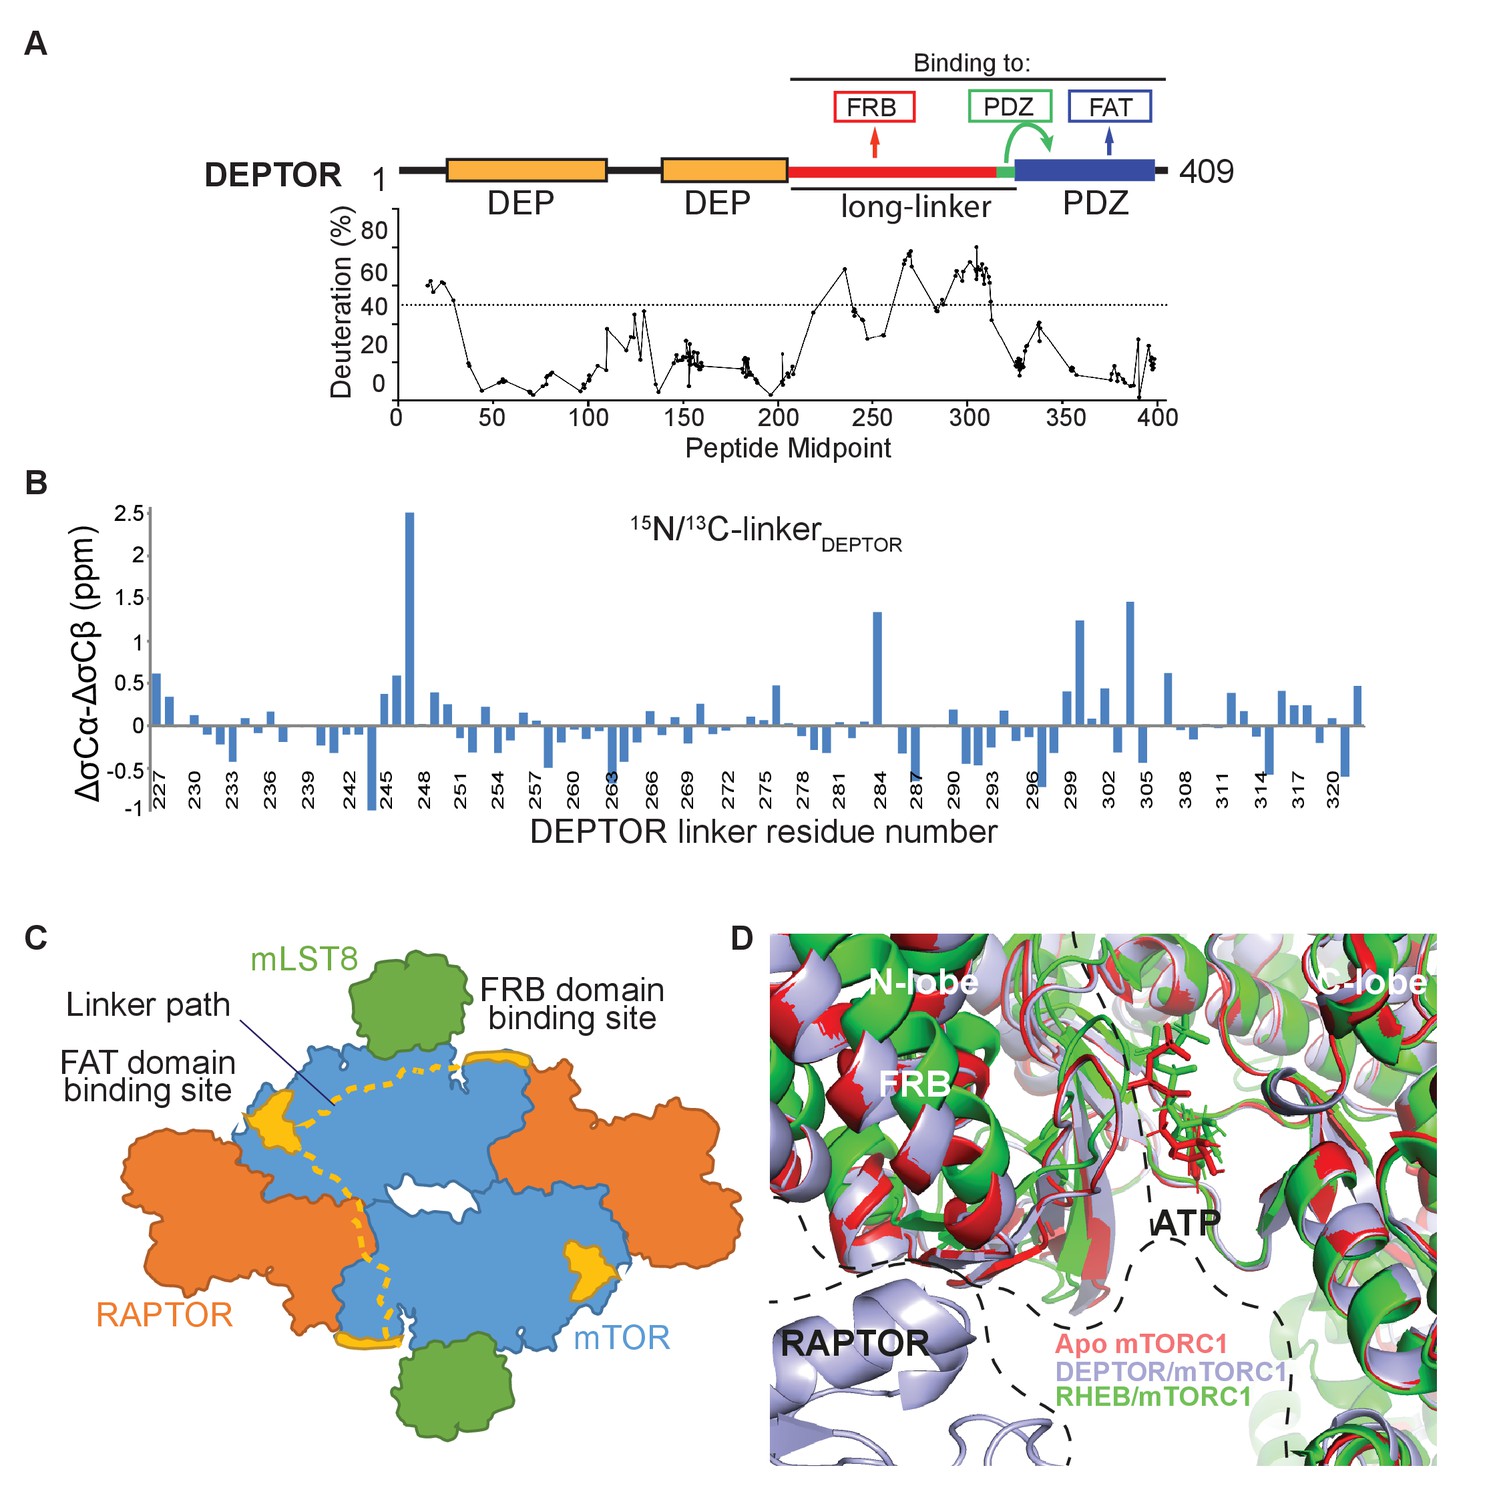
(A) Global HDX-MS result for DEPTOR as an indication of structured and flexible regions of DEPTOR. There were 179 reliable peptic peptides, with 94.9% coverage of DEPTOR and a redundancy of about 7.2. Areas of lower solvent exchange rate, suggestive of regions with likely secondary structure (Fowler et al., 2016), agreed with the predicted boundaries of the tandem DEP domains (36–119 and 145–219) and of the PDZ domain (330-409). There is also a region of lower solvent exchange rate observed in the inter-DEP-linker (residues 120–144, deuteration <50% in 3 s). In contrast, there is very rapid exchange for the long-linker (residues 228–323) connecting the tandem DEP domains with the PDZ domain (>50% in 3 s), suggesting that this region is unstructured. See also Supplementary file 1. (B) Secondary structure analysis of the DEPTOR linker construct (residues 228–323) comparing the assigned linker shifts with those that would be expected in a peptide of random coil conformation, revealing no regions of residual secondary structure in the unbound state. In this plot residual structure would be indicated by stretches of the protein with values greater than one for helical residues and greater than −1 for extended residues, which are not present for the DEPTOR linker. (C) A schematic illustrating two possible paths for the DEPTOR linker spanning the FRB and FAT domain binding sites. As DEPTOR is inhibitory for the mTOR monomer (ΔNmTOR/mLST8 construct), FRB and FAT domain binding can occur across the monomer. This does not exclude an interaction across the dimer interface. (D) Structure alignment on the C-lobe of free mTORC1 (pdb ID 6bcx), RHEB-bound mTORC1 (pdb ID 6bcu), and DEPTOR-bound mTORC1 shows similarities of free and DEPTOR-bound mTORC1 in the ATP-binding site.
Figure 3—figure supplement 2
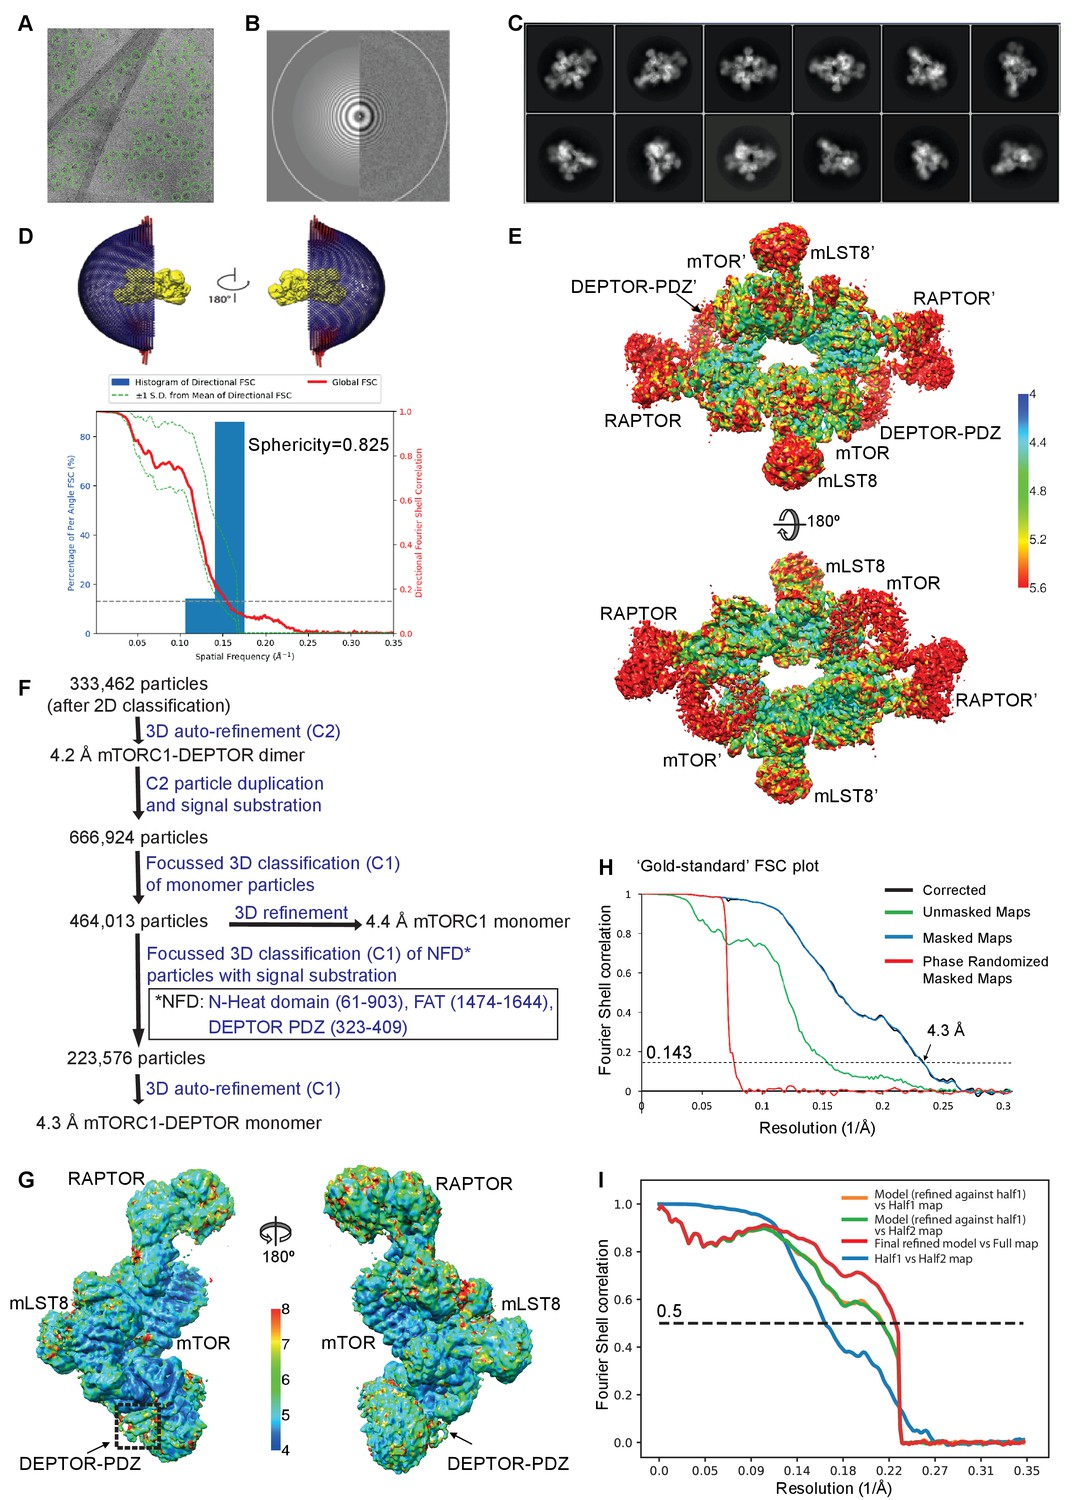
Cryo-EM data of the mTORC1/DEPTOR complex.
(A) A representative cryo-EM micrograph of mTORC1-DEPTOR complex. (B) Power spectrum of the image in (A) showing contrast transfer function rings (Thon rings) (C) Some of the reference-free 2D classes are shown. (D) The angular distribution (Euler angles) of the last 3D auto-refinement indicates some overrepresented views (preferred orientation, red cylinders). Directional resolution of the final 3D reconstruction of EM map density of mTORC1-DEPTOR was calculated using the 3DFSC server (Tan et al., 2017). (E) The local resolution map of the 3D reconstruction is shown for the mTORC1 dimer together with the resolution bar ranging from 4 Å to 5.6 Å (blue to red gradient). (F) Flowchart of cryo-EM data processing. Details are described in Materials and methods. (G) The local resolution map of the 3D reconstruction is shown for the mTORC1 monomer together with the resolution bar ranging from 4 Å to 8 Å (blue to red gradient). (H) The 'gold-standard' FSC curve for the B-factor sharpened post-processed reconstruction suggests a final resolution of the mTORC1/DEPTOR complex refined as a monomer of 4.3 Å. The dashed line indicates the FSC value for 0.143. (I) FSC curves of the final model versus the full map (red), of a same model refined in the first independent half map versus the first half map (orange), and of the same model versus the second independent half map, which was not used for refinement (green). FSC curve for the first half map versus the second half map (blue) is also shown. The dashed line indicates the FSC value for 0.5.
Figure 4 with 1 supplement
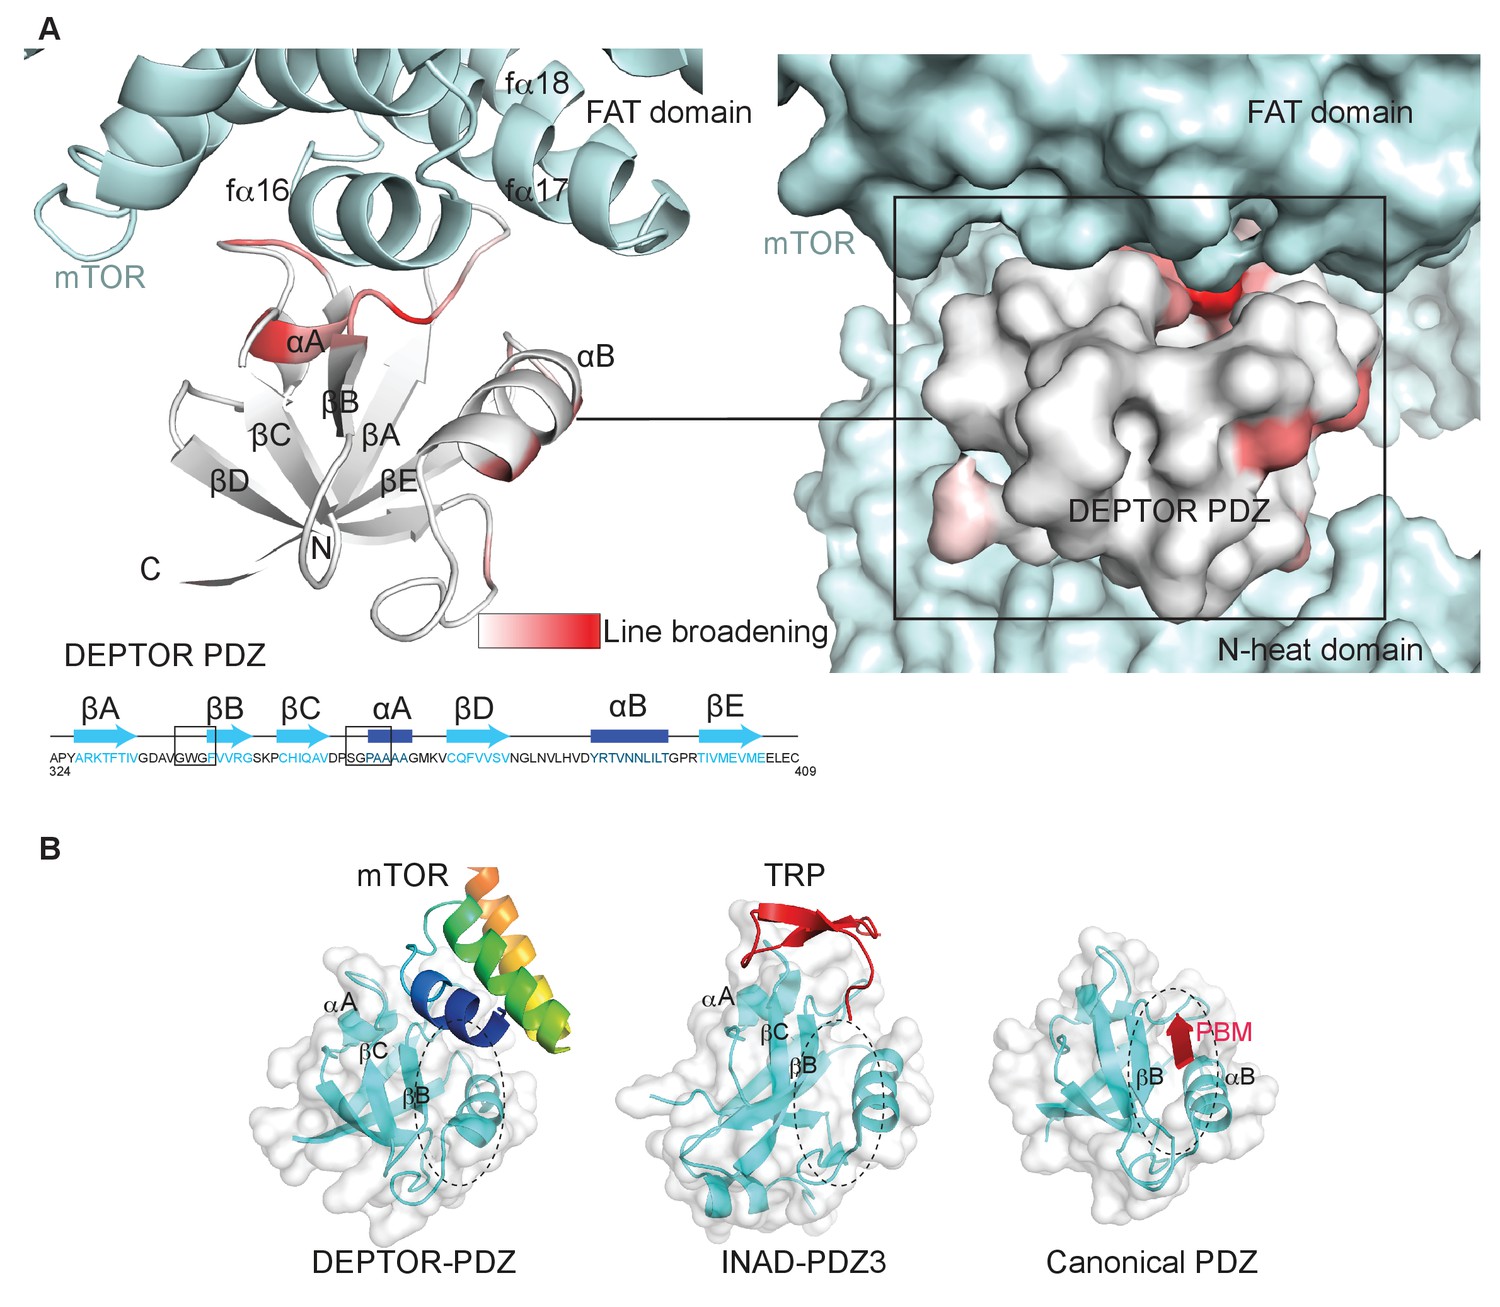
DEPTOR PDZ domain binds to mTORC1 in a non-canonical manner.
(A) Line broadening of isotope-labeled DEPTOR PDZ (residues 324–409) caused by its binding to the full-length mTORC1 is displayed in shades of red on the ribbon diagram of the PDZ domain. The NMR data is consistent with the non-canonical binding mode of DEPTOR PDZ seen with the cryo-EM. See Figure 4—figure supplement 1 for NMR differential line-broadening analysis. (B) A comparison of canonical and non-canonical binding to PDZ domains. The canonical binding mode (PDB 1BE9) is illustrated by the third PDZ domain of postsynaptic density-95 (PSD-95) interacting with the cysteine-rich interactor of PDZ3 (CRIPT). The DEPTOR PDZ binds to the mTOR FAT region in a non-canonical manner. Distinct non-canonical binding is also seen for other PDZ domains, such as the interaction of PDZ3 of inactivation no afterpotential D (INAD) with the transient receptor potential (TRP) channel (PDB 5F67).
Figure 4—figure supplement 1
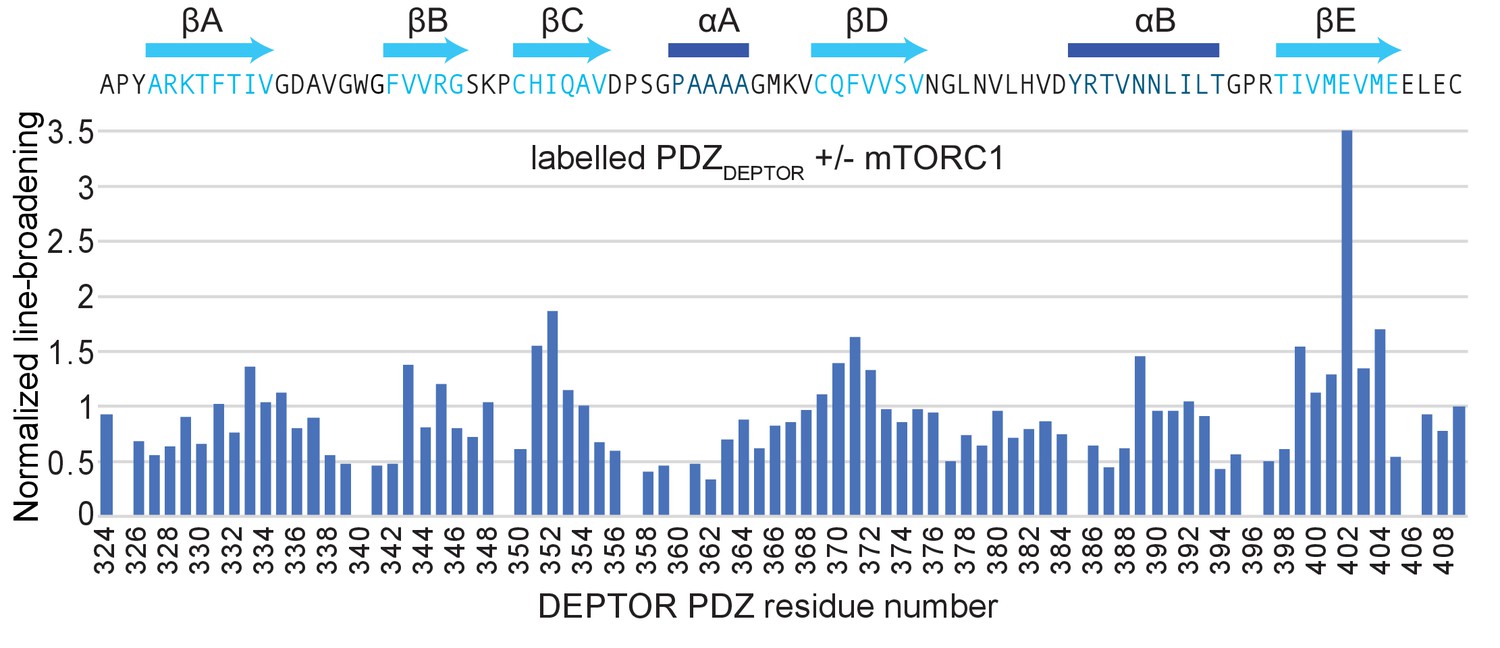
DEPTOR interaction with mTORC1.
Normalized differential line-broadening analysis of deuterated DEPTOR PDZ domain binding to mTORC1. Ratios of the 2H13C15N PDZ (residues 324–409) peak intensity in the 15N-1H HSQC lower than one indicate line broadening and therefore the binding surface of mTORC1 interaction with isolated DEPTOR PDZ domain (residues 324–409). Measured peak intensity was normalized to the peak of the C-terminal residue.
Figure 5 with 2 supplements
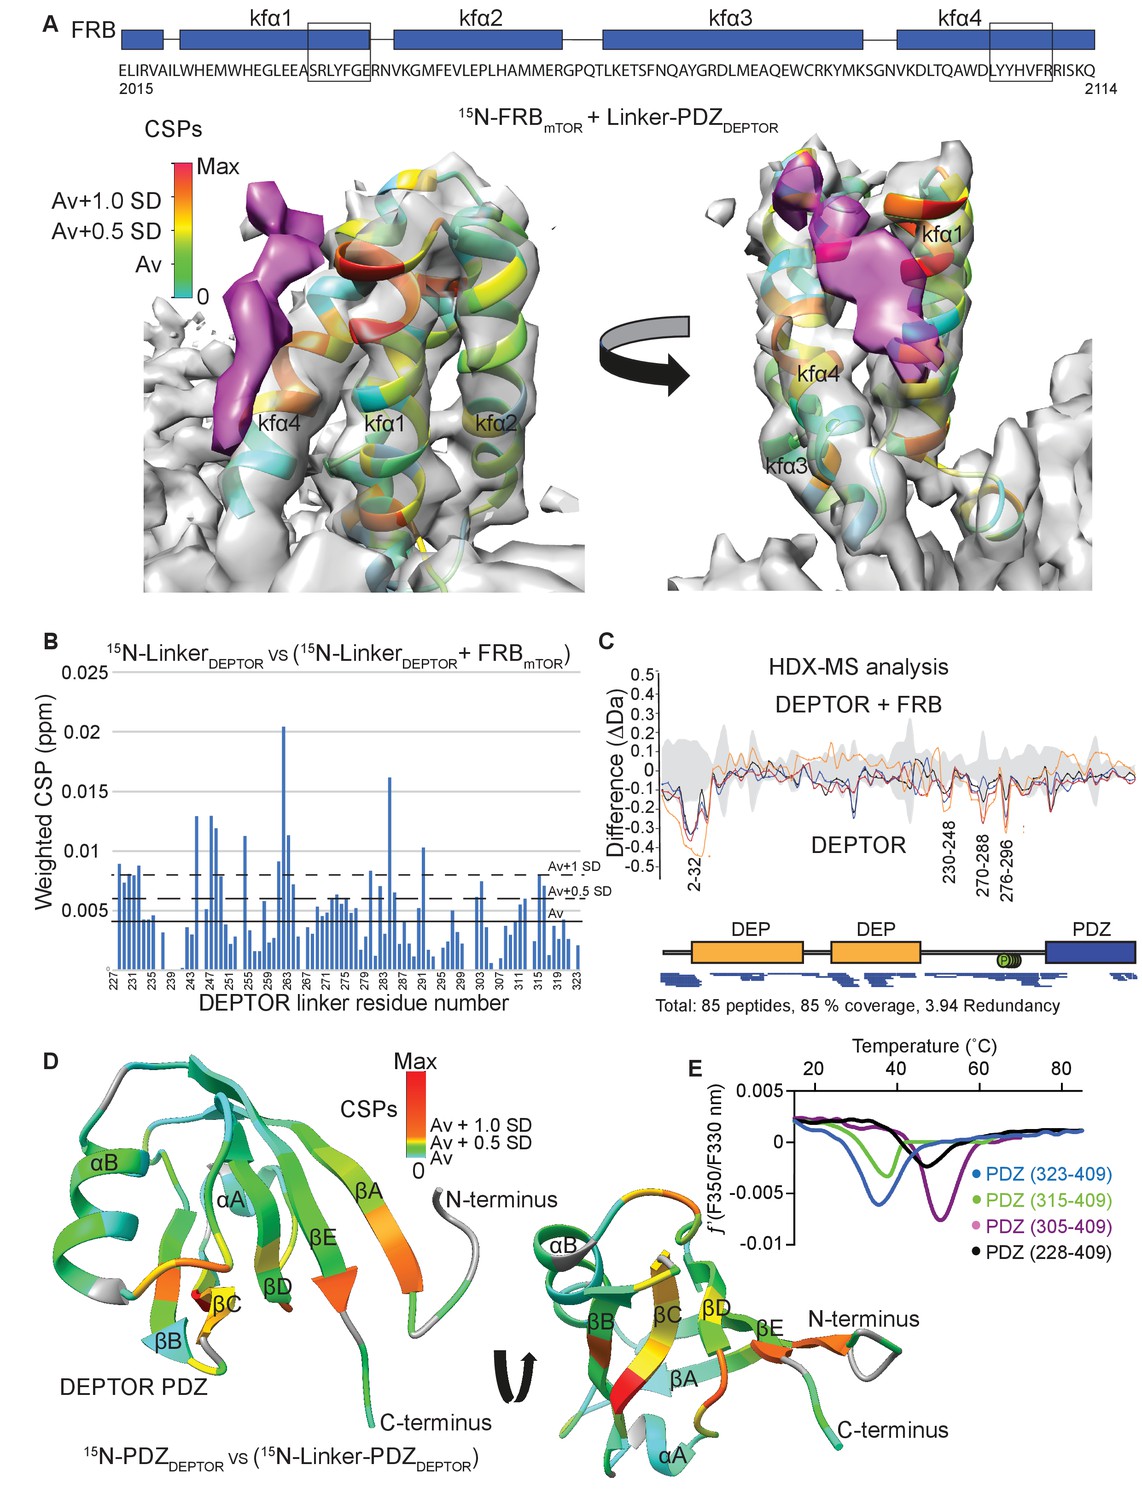
DEPTOR linker has two parts, each with a distinct role.
(A) Mapping the mTOR FRB surface that binds to the DEPTOR linker by the chemical shift perturbations (CSPs) of the FRB (residues 2015–2114) bound to DEPTOR linker-PDZ (residues 228–409) vs. free FRB in a 1H-15N BEST-TROSY experiment. The CSPs are displayed on the ribbon model of mTORC1 that is shown together with the EM density (semitransparent gray) for the FRB region of the mTORC1/DEPTOR complex. The EM density corresponding to DEPTOR is colored purple. See Figure 5—figure supplement 1A–C for NMR spectra and analysis. (B) Mapping the DEPTOR linker regions that interact with the FRB domain by the chemical shift perturbation of the FRB-bound linker vs. free linker in a 1H-15N BEST-TROSY experiment. See Figure 5—figure supplement 1D for NMR spectra. (C) Mapping the DEPTOR regions interacting with the mTOR FRB investigated by HDX-MS. Reduction in HDX in full-length DEPTOR in the presence of the FRB suggests that regions of the linker interact with the FRB. Four different colored lines represent four time points (3 s = orange, 30 s = red, 300 s = blue, 3000 s = black), the gray colored area represents the standard error. See also Supplementary file 2. (D) Interaction of the PDZ domain with a portion of a DEPTOR linker revealed from a comparison of DEPTOR PDZ (residues 324–409) and linker-PDZ (residues 228–409) 1H-15N BEST-TROSY spectra. The weighted chemical shift perturbation is calculated between the nearest linker-PDZ peak to the assigned PDZ peak in the overlaid spectra (see Figure 5—figure supplement 2A). The minimal map colored from green to red shows the interaction of the linker with the surface of the PDZ. (E) Stability of long-linker-PDZ (residues 228–409) and short-linker-PDZ (305-409) is greatly improved over the PDZ domain alone (residues 324–409), as shown by ~10°C increase in the protein melting temperature measured by differential scanning fluorimetry.
-
Figure 5—source data 1
Data values for Figure 5.
- https://cdn.elifesciences.org/articles/68799/elife-68799-fig5-data1-v1.xlsx
Figure 5—figure supplement 1
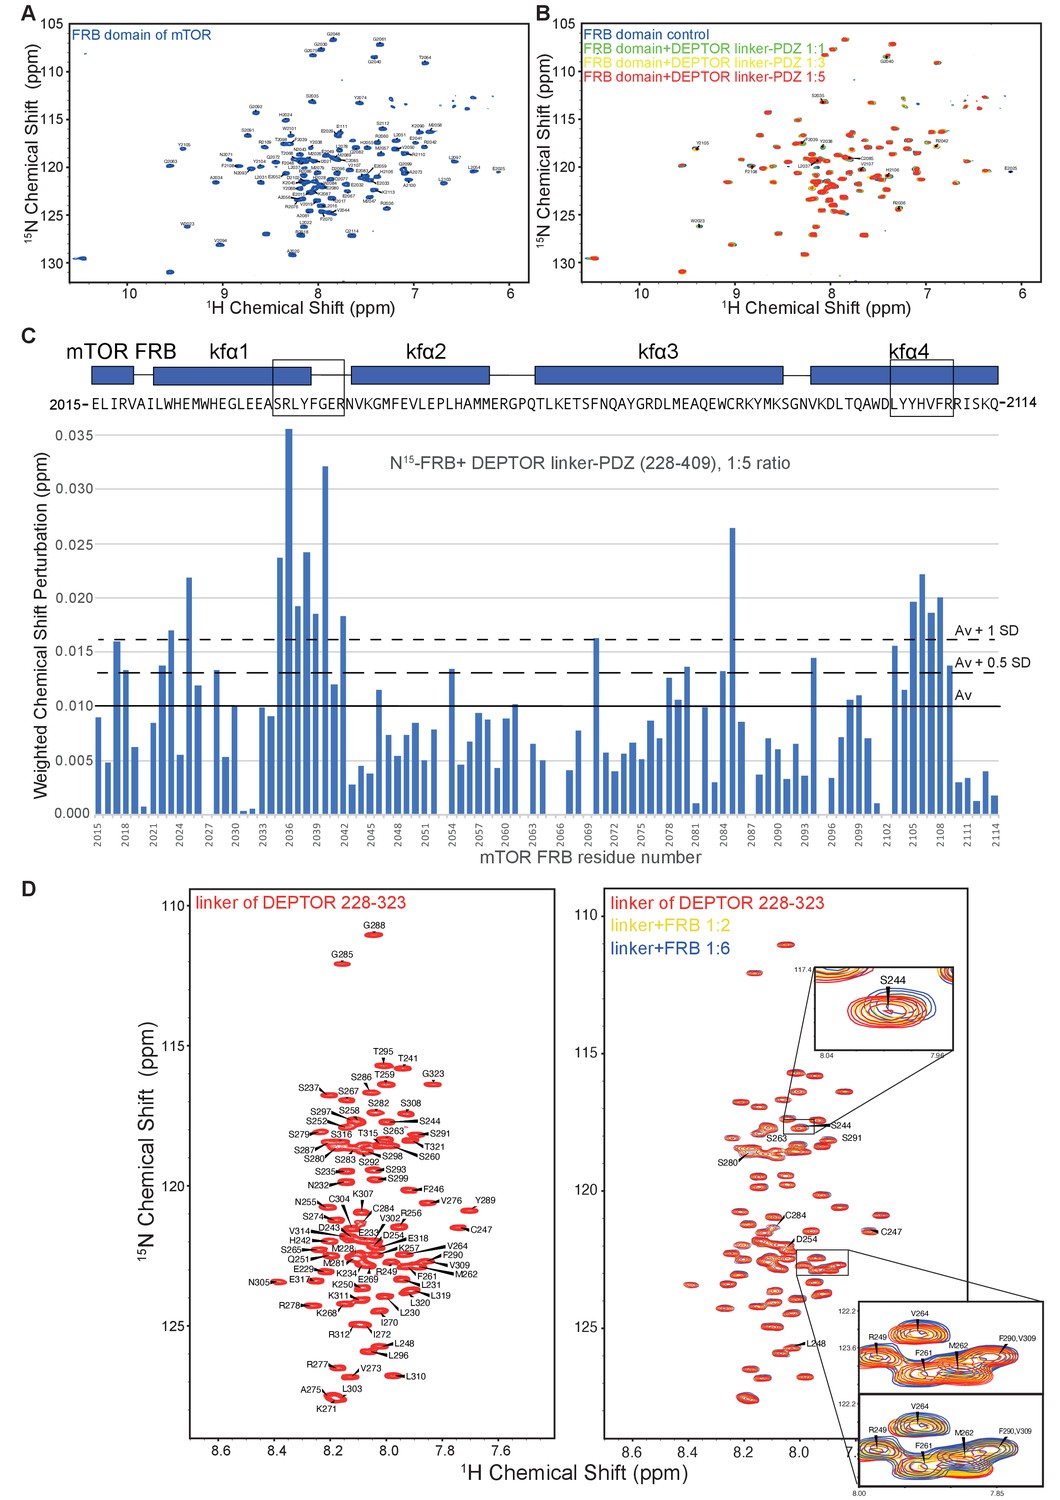
Analysis of the mTOR FRB domain and DEPTOR linker interaction by NMR.
(A) The assigned 1H-15N BEST-TROSY spectrum of 13C/15N mTOR-FRB (residues 2015–2114). (B) Overlaid spectra of 15N-labeled FRB with increasing concentrations of DEPTOR linker-PDZ (residues 228–409) (FRB alone, blue; FRB:linker-PDZ = 1:1, green; FRB:linker-PDZ = 1:3, yellow; FRB:linker-PDZ = 1:5, red). (C) The weighted chemical shift perturbation map showing residues of the FRB that bind DEPTOR linker-PDZ. These data were used to create the heat map in Figure 5A. (D) The assigned 1H-15N BEST-TROSY spectrum of DEPTOR-linker (residues 228–323) (left panel) and overlaid spectra of 15N-labeled DEPTOR linker with increasing concentrations of mTOR FRB (right panel: DEPTOR linker alone, red; DEPTOR linker:FRB=1:2, yellow; DEPTOR linker:FRB=1:6, blue). A subset of perturbed peaks has been labeled and the spectrum of 1:6 ratio of DEPTOR linker to FRB was used to create the weighted chemical shift map shown in Figure 5B. The insets show expanded views of two regions, one centered on S244 and one centered on M262. For the M262 inset, two overlays are shown, with either the red or blue contours on top.
Figure 5—figure supplement 2
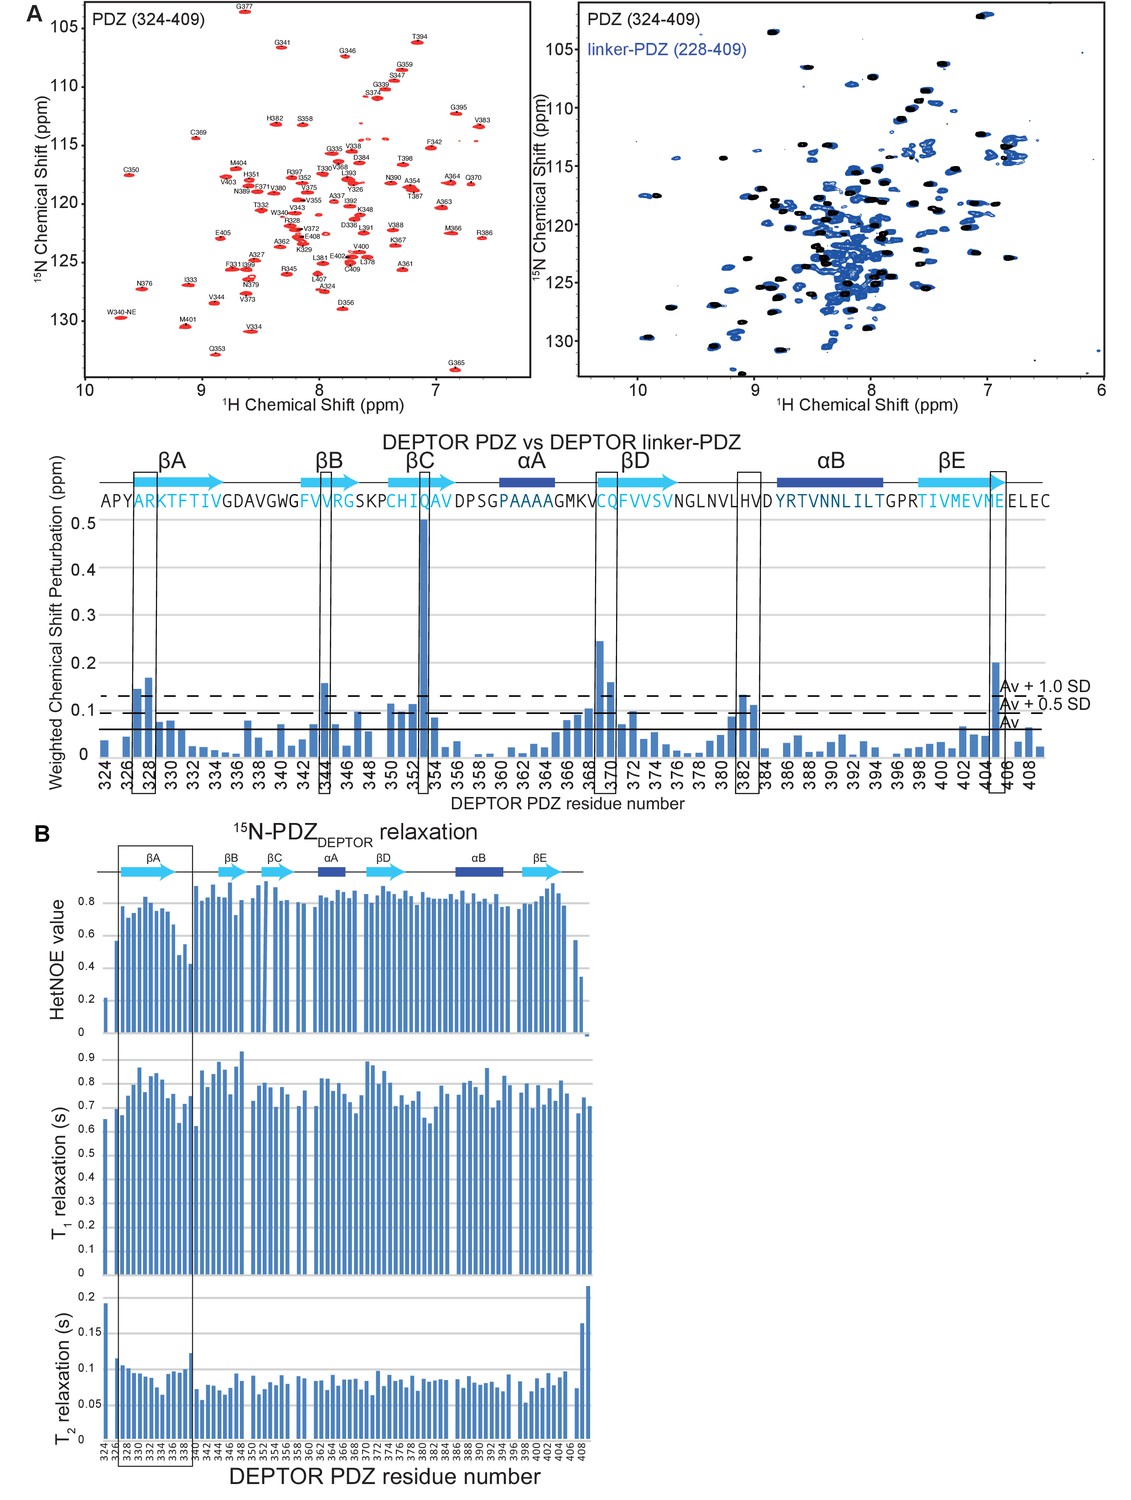
DEPTOR PDZ domain is greatly stabilized by its interaction with a short stretch of DEPTOR linker.
(A) NMR analysis of PDZ and linker-PDZ of DEPTOR. Top left: Assigned 15N-1H BEST-TROSY spectrum of the PDZ domain (residues 324–409) of DEPTOR. TOP right: Comparison of PDZ and linker-PDZ (residues 228–409) 15N-1H BEST-TROSY spectra. Bottom: A minimal chemical shift perturbation map showing the shortest distance between the assigned peaks of the PDZ spectrum and the unassigned peaks of the linker-PDZ of DEPTOR. Relatively large peak perturbation differences are attributed to an interaction of the linker with the folded PDZ domain and are used to make the heat map in Figure 5D. (B) 15N dynamics analysis of 15N/2H-labeled DEPTOR PDZ domain. Top: 15N-1H Heteronuclear NOE, middle: T1 – longitudinal, and bottom: T2 – transverse relaxation times for the PDZ construct (324-409) collected at 700 MHz. The N-terminal region of the PDZ shows increased flexibility.
Figure 6 with 2 supplements
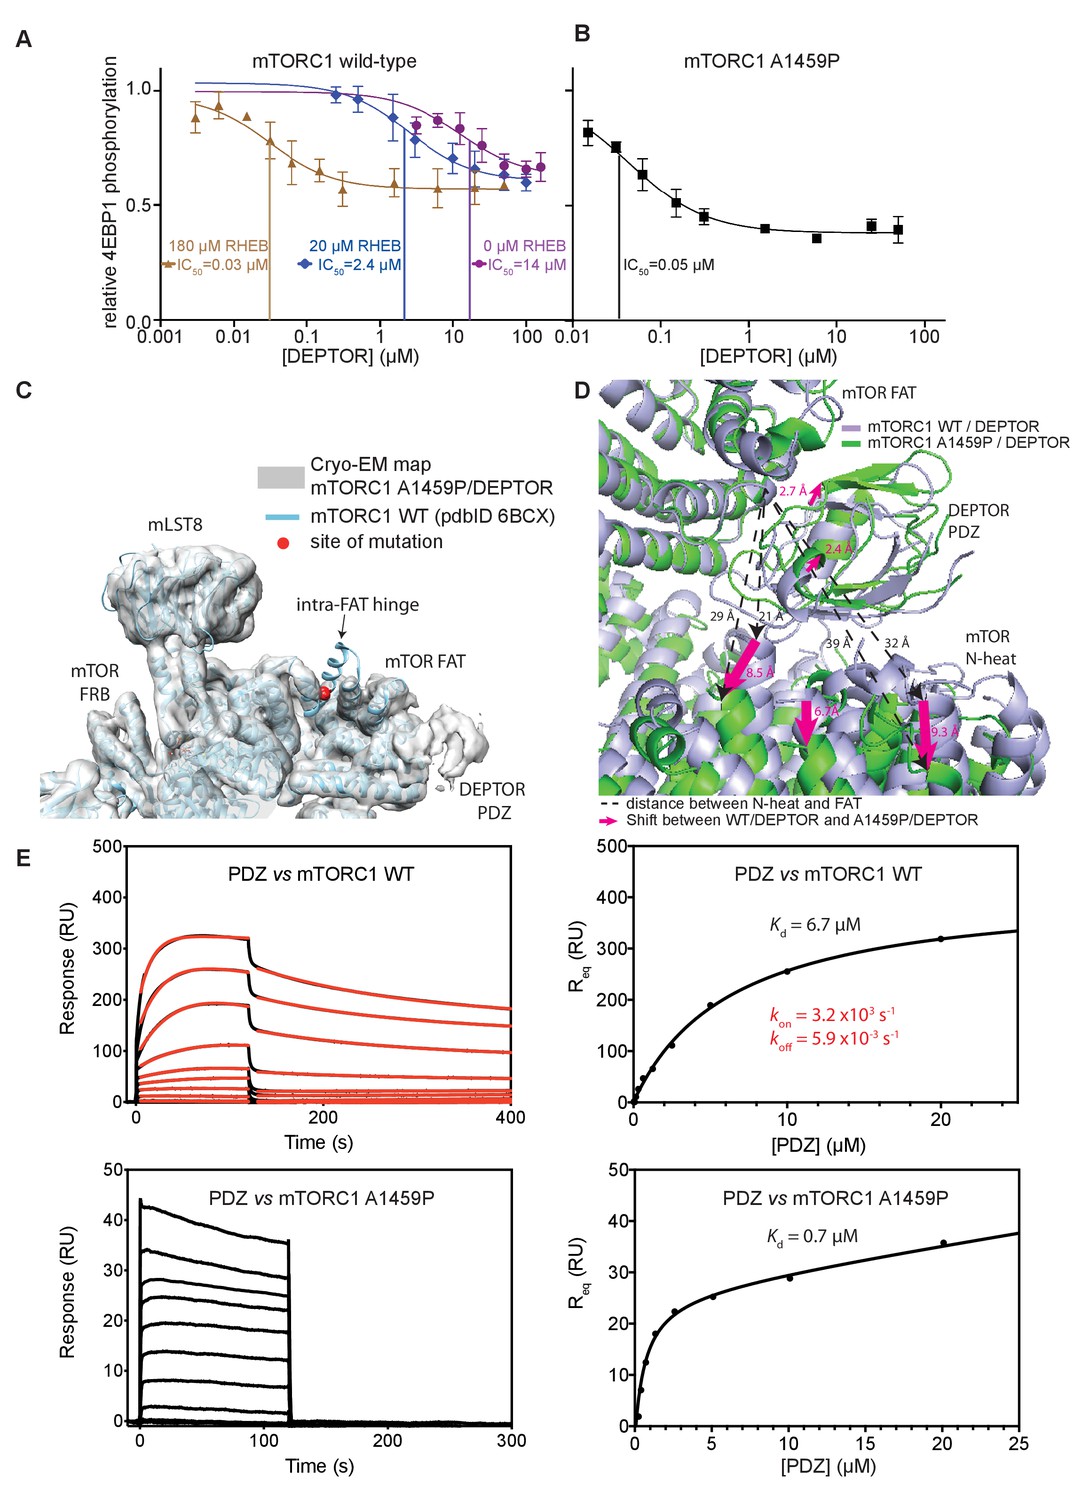
DEPTOR inhibits activated mTORC1 more strongly than basal mTORC1, but phosphorylated DEPTOR does not inhibit mTORC1.
(A) Increasing concentrations of RHEB-GTP lead to activated mTORC1 and at the same time result in a decreased DEPTOR IC50 (substrate was 4EBP1). Band intensities reflecting P-4EBP1 were normalized to the control (0 µM DEPTOR) and the data (mean ± SD, n ≥ 3) was fit by a nonlinear regression to determine IC50. (B) Cancer-associated, hyperactive mutant mTORC1-A1459P also shows a decreased DEPTOR IC50. Band intensities reflecting P-4EBP1 were normalized to the control (0 µM DEPTOR) and the data (mean ± SD, n ≥ 3) was fit by a nonlinear regression to determine IC50. (C) Cryo-EM reconstruction of A1459P mTORC1 mutant and DEPTOR reveals the loss of an mTOR helix at the mutation site. The site of mutation lies within the hinges of mTORC1 which are involved in introducing major conformational changes in mTOR upon RHEB-induced activation. (D) Alignment of WT and mutant A1459 mTORC1 on the PDZ-binding site in the FAT domain (shown with green density bound to the PDZ domain illustrated with magenta spheres) reveals a shift of mTOR N-heat domain for mTORC1 A1459P/DEPTOR (yellow density) with respect to mTORC1 WT/DEPTOR (gray density). This shift increases the crevice between the FAT and the N-heat domains in mTORC1 A1459P and creates an easier access for DEPTOR PDZ to its binding site. (E) Comparison of PDZ binding to wild-type and mutant mTORC1 analyzed by SPR. PDZ (construct 305–409) binds to wild-type mTORC1 with slow on/off kinetics and lower affinity, whereas it binds the mutant mTORC1, with fast on/off kinetics and 10-fold greater affinity. The total binding data were fit to a model with one-site specific binding combined with a linear non-specific component.
-
Figure 6—source data 1
Data values for Figure 6.
- https://cdn.elifesciences.org/articles/68799/elife-68799-fig6-data1-v1.xlsx
Figure 6—figure supplement 1
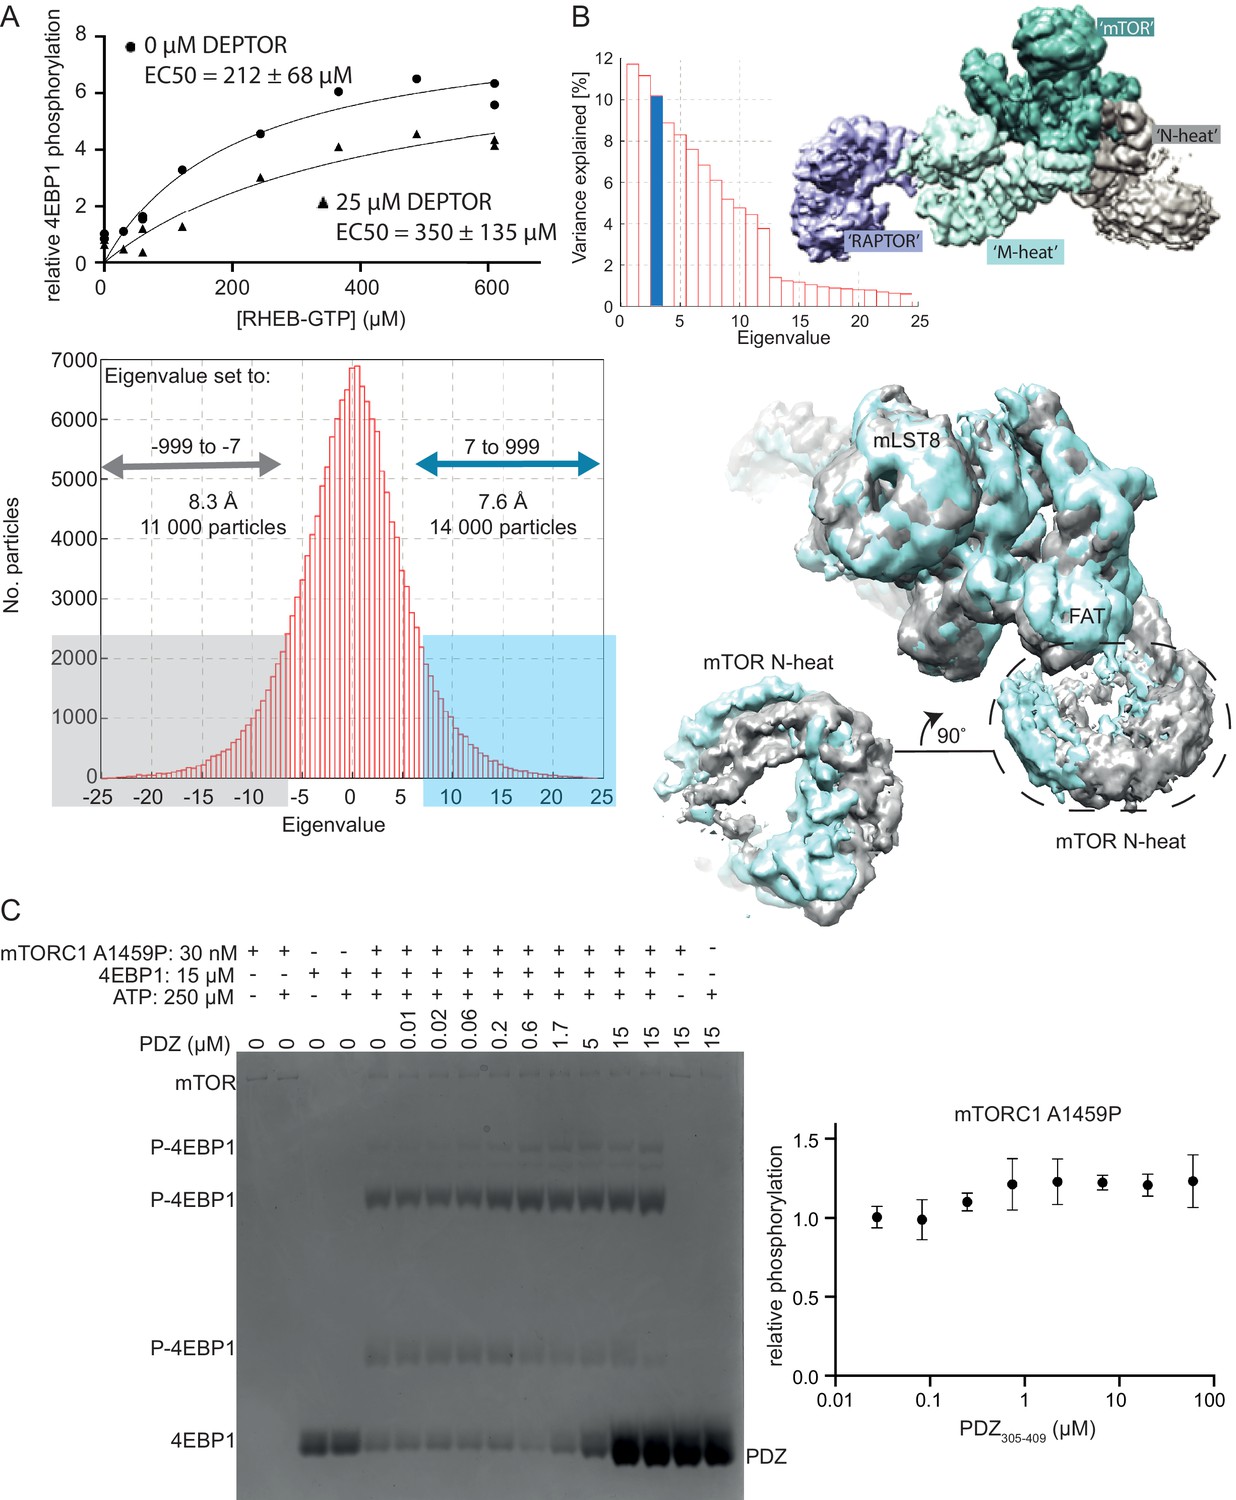
DEPTOR’s inhibition of activated mTORC1.
(A) RHEB activation of mTORC1 occurs in the presence of DEPTOR. RHEB concentration was varied in the presence of 0 and 25 µM DEPTOR. Activation of mTORC1 occurs in the presence of DEPTOR, while the ~60% residual mTORC1 activity over the entire [RHEB] range can be observed. Quantification of western blots of phosphorylated 4EBP1 plotted as a fraction of the control (no DEPTOR/ no RHEB) vs. activated/ inhibited. One representative of three replicates is shown. (B) For multibody refinement, the wild-type mTORC1/ DEPTOR complex was split into four bodies. The refinement revealed that about 33% of variation in rotation and translation is explained by the first three eigenvectors. The first two eigenvectors correspond to a twisting motion in RAPTOR and a slight tilt in mLST8, respectively, while the third shows a rolling motion in the N-heat domain. Histograms of all amplitudes were monomodal, implying continuous motions. We selected and refined ~11,000 particles for which the amplitude along the third eigenvector is ≤ −7 (yielding the density shown in gray) and ~ 14,000 particles with the amplitude > 7 (shown in cyan). These refinements yielded maps with overall resolutions of 8.3 Å and 7.6 Å, respectively, and show the motion in the N-heat and FAT regions. (C) Short-linker PDZ does not inhibit mTORC1 A1459P, as analyzed by Phos-gels. Despite the isolated PDZ domain (short-linker PDZ construct 305–409) binding tighter to mTORC1 A1459P than wild-type mTORC1, no inhibition of the mutant was observed. Quantification of western blots of phosphorylated 4EBP1 plotted as a fraction of the control (0 µM PDZ) vs. PDZ (mean ± SD, n = 3).
-
Figure 6—figure supplement 1—source data 1
Uncropped stained gel.
- https://cdn.elifesciences.org/articles/68799/elife-68799-fig6-figsupp1-data1-v1.ai
-
Figure 6—figure supplement 1—source data 2
Data values.
- https://cdn.elifesciences.org/articles/68799/elife-68799-fig6-figsupp1-data2-v1.xlsx
Figure 6—figure supplement 2
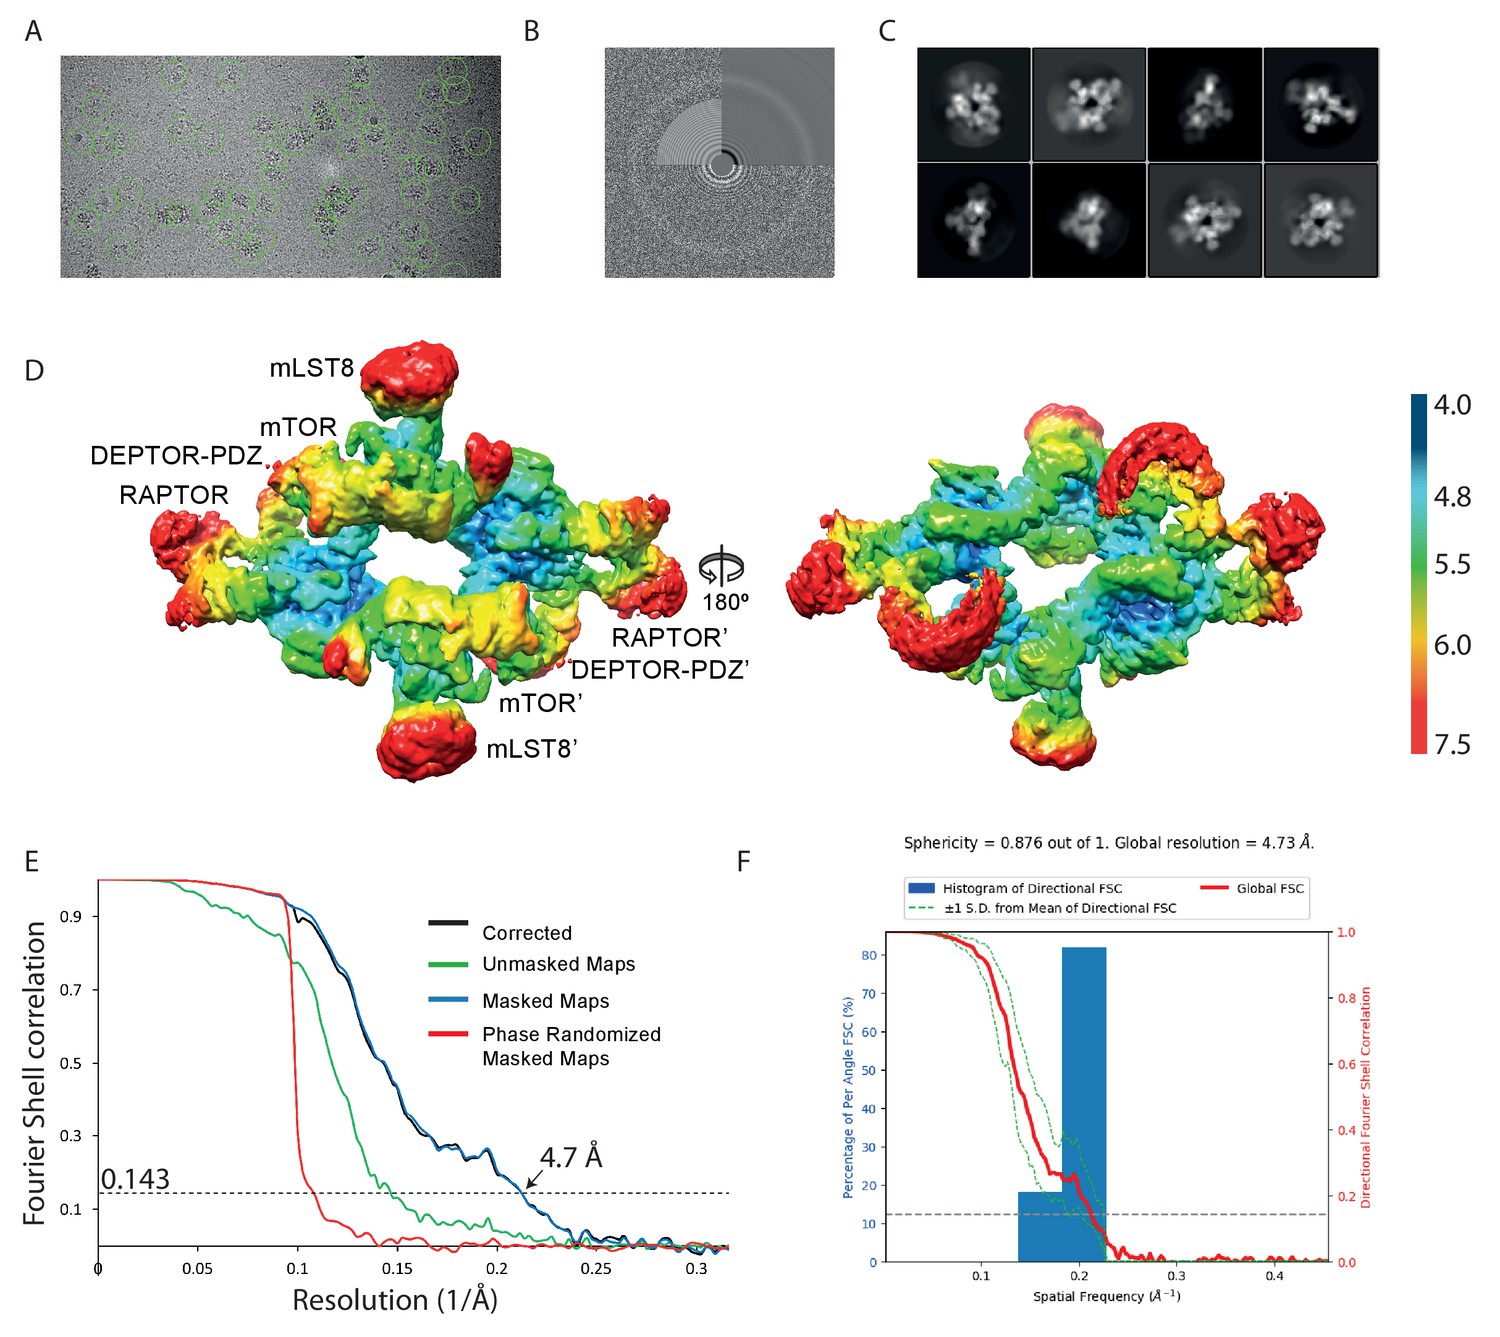
Cryo-EM data of the mTORC1 A1459P/DEPTOR complex.
(A) A representative cryo-EM micrograph of mTORC1 A1459P-DEPTOR complex. (B) Power spectrum of the image in (A) showing contrast transfer function rings (Thon rings). (C) Some of the 2D classes are shown. (D) The local resolution map of the 3D reconstruction is shown for the mTORC1 dimer together with the resolution bar ranging from 4 Å to 7.5 Å (blue to red gradient). (E) The 'gold-standard' FSC curve for the B-factor sharpened post-processed reconstruction suggests a final resolution of the mTORC1 A1459P/DEPTOR complex of 4.7 Å. (F) Directional resolution of the final 3D reconstruction was calculated using the 3DFSC server (Tan et al., 2017).
Figure 7
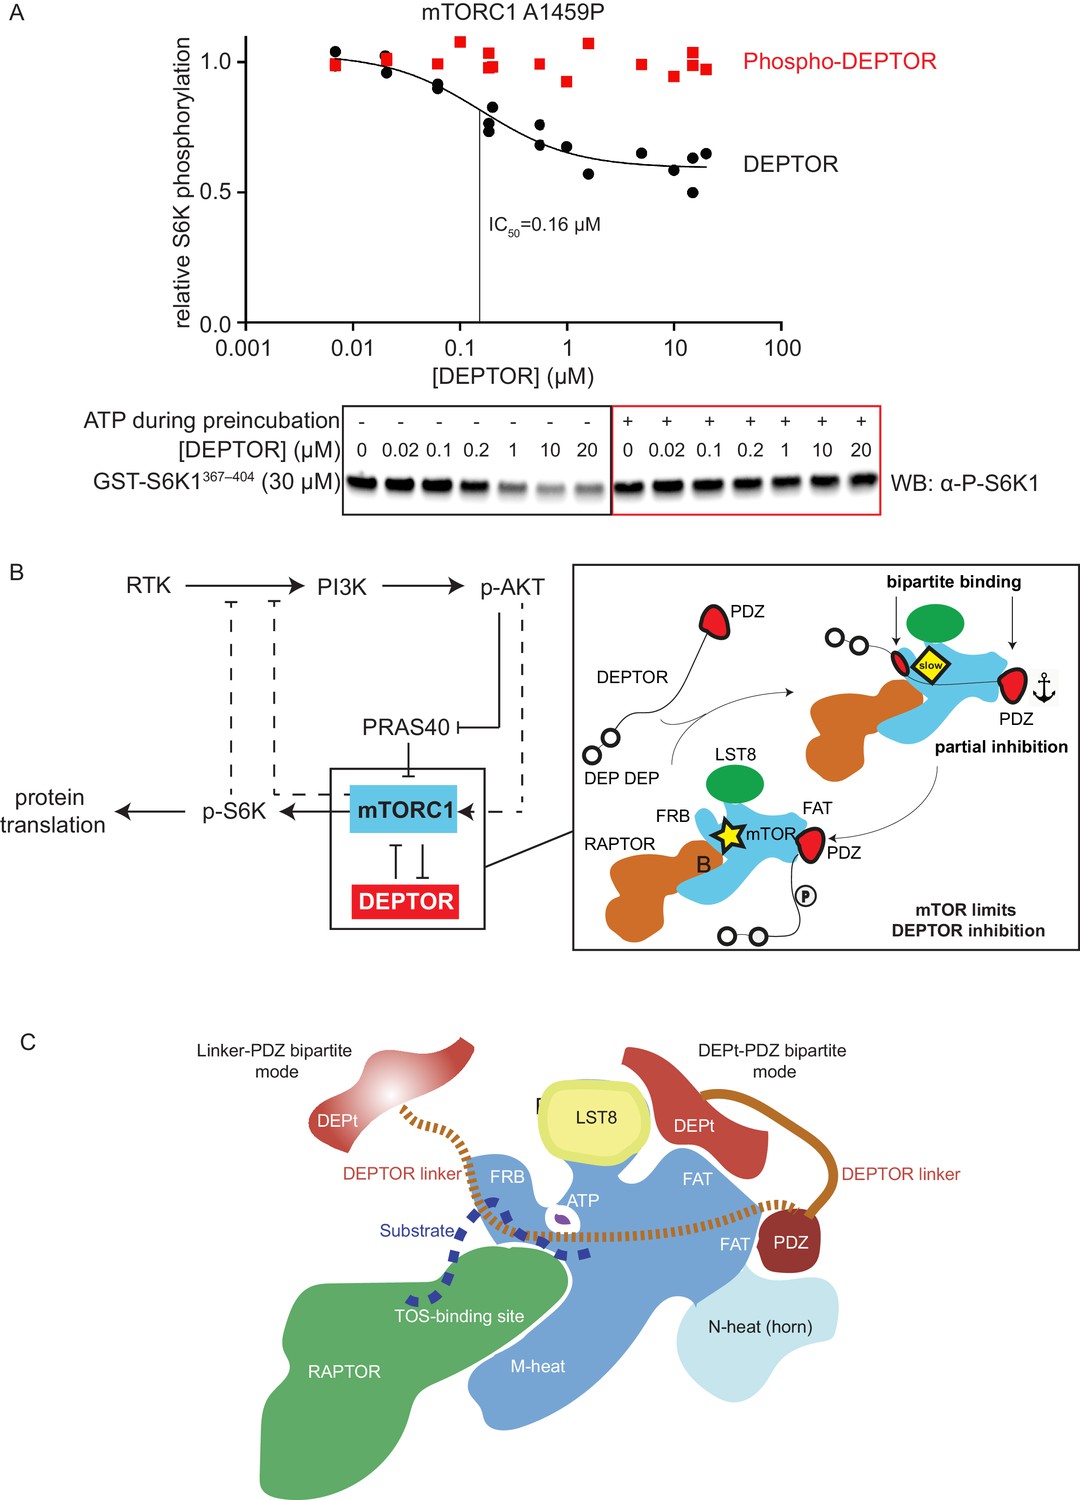
mTORC1 directly controls the function of its negative regulators.
(A) DEPTOR pre-phosphorylated by activated mTORC1 (phospho-DEPTOR) shows no inhibition of mTORC1 activity. Band intensities reflecting P-S6K1367-404 peptide were normalized to the control (0 µM DEPTOR). Each data point from three independent experiments is shown with varied [DEPTOR] in each experiment and results were fit by a nonlinear regression to determine IC50. (B) Negative feedback to PI3K (dashed lines) controls the activity of the two mTORC1 inhibitors PRAS40 and DEPTOR. If mTORC1 inhibition is high, PI3K is activated due to a loss of the negative feedback. Increased p-AKT results in decreased PRAS40 inhibition, with increased mTORC1 activity, which in turn reduces DEPTOR inhibition. mTORC1 activity alone is sufficient to reduce DEPTOR inhibition, without the necessity of DEPTOR’s ubiquitination and subsequent degradation. This increased mTORC1 activity in turn induces negative feedback to PI3K and prevents an overactivation of this pathway, keeping activities balanced. (C) A model for DEPTOR interaction with mTORC1. Taken together, our work and that of Wälchli et al., 2021 suggest that there are two possible modes of DEPTOR bipartite binding, with both modes having the PDZ domain bound to the PDZ-binding site, while the second interaction involves either: (1) the DEPTOR linker binding to the FRB (our work here) or (2) the DEPt binding to the DEPt binding site (Wälchli et al., 2021). The observed inhibition is a sum of the two modes. For the basal mTORC1, bipartite interaction with mTOR via linker and PDZ might predominate. For the RHEB-bound mTORC1, DEPt could play a predominant inhibitory role by preventing allosteric changes necessary for activation. Having two modes of inhibition ensures that the DEPTOR effectively inhibits both mTORC1 (inhibition with both modes) and mTORC2 (presumably only inhibition through the DEPt-PDZ mode), since the FRB site would not be accessible in mTORC2. It is possible that there are hybrid states of the DEPTOR-bound mTORC1. For example, RHEB binding could cause the PDZ binding site to switch to its high-affinity conformation, while the DEPt maintains the active site in its basal conformation.
-
Figure 7—source data 1
Uncropped blots.
- https://cdn.elifesciences.org/articles/68799/elife-68799-fig7-data1-v1.ai
-
Figure 7—source data 2
Data values for Figure 7.
- https://cdn.elifesciences.org/articles/68799/elife-68799-fig7-data2-v1.xlsx
Author response image 1

Tables
Table 1
Cryo-EM data collection and processing of mTORC1 in complex with DEPTOR.
| Data collection | ||
|---|---|---|
| Protein details | mTORC1 WT/DEPTOR | mTORC1 A1459P/DEPTOR |
| Microscope | Titan Krios (FEI) | Titan Krios (FEI) |
| Voltage (kV) | 300 | 300 |
| Detector | Gatan K2 Summit | Gatan K3 |
| Pixel size (Å) | 1.43 | 1.1 |
| Defocus range (μm) | −1.6 to −3.2 | −1.4 to −3.0 |
| Movies | 2370 | 4759 |
| Frames/movie | 20 | 50 |
| Exposure rate (e– / Å2/ s) | 2.5 | 22.4 |
| Total dose (e– / Å2) | 40 | 56 |
| Number of particles | 491,404 | 97,314 |
| Energy filter slit width (eV) | 20 | 20 |
| Model composition | ||
| Non-hydrogen atoms | 28917 (refined as a monomer) | 28784 (refined as dimer) |
| Protein residues | 3640 | 7196 |
| Ligands/ ions | - | - |
| Density refinement | ||
| Resolution (Å) | 4.2 | 4.7 |
| Sharpening B-factor (Å) | 283.5 | 145.7 |
| Model refinement | ||
| Root-mean-square deviation | ||
| Bond lengths (Å) | 0.0131 | 0.0089 |
| Bond angles (°) | 1.73 | 1.76 |
| Validation | ||
| Molprobity score | 1.47 | 1.4 |
| Clashscore, all atoms | 0.95 | 1.3 |
| Favored rotamers (%) | 98.0 | 89.4 |
| Ramachandran plot (%) | ||
| Favored | 92.9 | 92.2 |
| Allowed | 6.4 | 7.6 |
| Outliers | 0.75 | 0.2 |
Key resources table
| Reagent type (species) or resource | Designation | Source or reference | Identifiers | Additional information |
|---|---|---|---|---|
| Antibody | Anti-P-4EBP1 (T37/46) (Rabbit, polyclonal) | Cell Signalling | Cat#9459L; RRID:AB_330985 | WB (1:1000) |
| Antibody | Anti-4EBP1 (Rabbit, polyclonal) | Cell Signalling | Cat#9452S; RRID:AB_331692 | WB (1:1000) |
| Antibody | Anti-P-p70 S6 Kinase (T389) (Rabbit, monoclonal) | Cell Signalling | Cat#9205L; RRID:AB_330944 | WB (1:1000) |
| Antibody | Anti-Rabbit IgG, HRP-linked Antibody | Cell Signalling | Cat#7074; RRID:AB_2099233 | WB (1:5000) |
| Strain, strain background (Escherichia coli) | LOBSTR cells | KeraFast | Cat# EC1001 | Chemically competent cells |
| Cell line (Homo sapiens) | Expi293F cells | Thermo Fisher | Cat#A14527; RRID:CVCL_D615 | |
| Recombinant DNA reagent | pOPL24 (plasmid) | Anandapadamanaban et al., 2019 | 2xStrepII-1xFlag-Human_Raptor, in pCAG | |
| Recombinant DNA reagent | pOPL25 (plasmid) | Anandapadamanaban et al., 2019 | Human_mTOR nontagged, in pCAG | |
| Recombinant DNA reagent | pOPL26 (plasmid) | Anandapadamanaban et al., 2019 | 3xFlag-Human_LST8, in pCAG | |
| Recombinant DNA reagent | pOPL95 (plasmid) | This paper | Human_mLST8 nontagged, in pCAG (Available from RLW lab) | |
| Recombinant DNA reagent | pOPL119 (plasmid) | This paper | Human_Raptor nontagged, in pCAG (Available from RLW lab) | |
| Recombinant DNA reagent | pOPL121 (plasmid) | This paper | 2xStrepII(tev)-Human_mTOR, in pCAG (Available from RLW lab) | |
| Recombinant DNA reagent | pOPL146 (plasmid) | This paper | 2xStrepII(tev)-Human_mTOR_A1459P, in pCAG (Available from RLW lab) | |
| Recombinant DNA reagent | pOPL151 (plasmid) | This paper | 2xStrepII(tev)-Human_mTOR_1376–2549, in pCAG (Available from RLW lab) | |
| Recombinant DNA reagent | pOPL107 (plasmid) | This paper | GST(tev)-Human_mTOR_FRB_2015–2114, in pOPTG (Available from RLW lab) | |
| Recombinant DNA reagent | pOPL40 (plasmid) | This paper | GST(tev)-Human_Rheb1, in pOPTG (Available from RLW lab) | |
| Recombinant DNA reagent | pMA9 (plasmid) | Anandapadamanaban et al., 2019 This paper | HisLIP(tev)-Human_PRAS40,in pOPTL (Available from RLW lab) | |
| Recombinant DNA reagent | pAB87 (plasmid) | This paper | GST(PreScission)Human_DEPTOR_1–409 (S204, N389 natural variant) (Full length WT), in pGEX-6P1 (Available from RLW lab) | |
| Recombinant DNA reagent | pOPL111 (plasmid) | This paper | GST(tev)-Human_DEPTOR_228_409 (Linker-PDZ), in pOPTG (Available from RLW lab) | |
| Recombinant DNA reagent | pOPL127 (plasmid) | This paper | HisLIP(tev)-Human_DEPTOR_324_409 (PDZ), in pOPTL (Available from RLW lab) | |
| Recombinant DNA reagent | pOPL138 (plasmid) | This paper | GST(tev)-Human_DEPTOR_1–409 (S204, N389 natural variant) (Full length WT), in pOPTG (Available from RLW lab) | |
| Recombinant DNA reagent | pOPL139 (plasmid) | This paper | GST(tev)-Human_DEPTOR_1-409-13S/T-A mutant (T241A,S244A,T259A,S260A,S263A,S265A,S282A,S283A,S287A, S293A,S297A,S298A,S299A) (Full length 13A), in pOPTG (PCR-ed from Addgene clone 21702) (Available from RLW lab) | |
| Recombinant DNA reagent | pOPL140 (plasmid) | This paper | GST(tev)-Human_DEPTOR_1–323 (DEP-DEP-linker), in pOPTG (Available from RLW lab) | |
| Recombinant DNA reagent | pOPL141 (plasmid) | This paper | GST(tev)-Human_DEPTOR_1-323-13S/T-A mutant (DEP-DEP-linker 13A), in pOPTG (Available from RLW lab) | |
| Recombinant DNA reagent | pOPL143 (plasmid) | This paper | GST(tev)-Human_DEPTOR_228-409-13S/T-A mutant (linker PDZ 13A), in pOPTG (Available from RLW lab) | |
| Recombinant DNA reagent | pOPL157 (plasmid) | This paper | GST(tev)-Human_DEPTOR_1–220 (DEP-DEP), in pOPTG (Available from RLW lab) | |
| Recombinant DNA reagent | pOPL159 (plasmid) | This paper | His(tev)-Human_DEPTOR_228–323 (Linker), in pOPTH(tev) (Available from RLW lab) | |
| Recombinant DNA reagent | pOPL166 (plasmid) | This paper | GST(tev)-Human_DEPTOR_305–409 (extended PDZ), in pOPTG (Available from RLW lab) | |
| Recombinant DNA reagent | pOPL167 (plasmid) | This paper | GST(tev)-Human DEPTOR_315–409 (extended PDZ), in pOPTG (Available from RLW lab) | |
| Recombinant DNA reagent | pOPL163 (plasmid) | This paper | GST(PreScission)-Human_S6K1αII,367–404, in pGEX-6P1 (Available from RLW lab) | |
| Recombinant DNA reagent | pOP826 (plasmid) | This paper | in GST(tev)-Human 4EBP1, in pOPTG (Available from RLW lab) | |
| Recombinant DNA reagent | pOP854 (plasmid) | This paper | GST(tev)-Human 4EBP1-TOS-less-(114-FEMDI-118/AAAAA), in pOPTG (Available from RLW lab) | |
| Chemical compound, drug | NEBuilder HiFi assembly Master Mix | New England Biolabs | Cat#E2621S | |
| Chemical compound, drug | cOmplete EDTA-free protease inhibitor tablets | Roche | Cat#11873580001 | |
| Chemical compound, drug | Universal Nuclease | Pierce | Cat#88702 | |
| Chemical compound, drug | Desthiobiotin | IBA | Cat#2-1000-005 | |
| Chemical compound, drug | Glutathione Sepharose 4B resin | GE Healthcare | Cat#17-0756-05 | |
| Chemical compound, drug | Ni-NTA agarose resin | Qiagen | Cat#30230 | |
| Chemical compound, drug | Lysozyme | Sigma | Cat#L6876 | |
| Chemical compound, drug | TCEP (Tris(2-carboxyethyl) phosphine hydrochlorid) | Soltec Ventures | Cat#M115 | |
| Chemical compound, drug | Bovine Serum Albumin | Thermo Fisher | Cat#BP1605 | |
| Chemical compound, drug | PEI (Polyethyleneimine‘MAX’, MW 40,000) | Polysciences | Cat#24765 | |
| Chemical compound, drug | SuperSignal West Pico PLUS chemiluminescent substrate | Thermo Fisher | Cat#34577 | |
| Chemical compound, drug | LDS sample buffer | NuPAGE | Cat#NP0008 | |
| Chemical compound, drug | Triton X-100 | Sigma | Cat#T8787 | |
| Chemical compound, drug | Tween 20 | NBS Biologicals | Cat#17767-B | |
| Chemical compound, drug | ATP | Jena Bioscience | Cat#NU-1010 | |
| Chemical compound, drug | GTPγS | Jena Bioscience | Cat#NU-412–20 | |
| Chemical compound, drug | Glutaraldehyde solution, 25% in water | Sigma | Cat#G5882 | |
| Chemical compound, drug | D2O | Acros Organics | Cat#351430075 | |
| Chemical compound, drug | InstantBlue Protein Stain | Expedeon | Cat#1SB1L | |
| Chemical compound, drug | Expi293 Expression Medium | Thermo Fisher | Cat#A1435102 | |
| Chemical compound, drug | Yeast Nitrogen Base Without Amino Acids and Ammonium Sulfate | Sigma | Cat#Y1251 | |
| Chemical compound, drug | Ammonium15N chloride | Sigma | Cat#299251 | |
| Chemical compound, drug | D-Glucose (U-13C699%) | Cambridge Isotopes Laboratores Inc | Cat#CLM-1396–10 | |
| Chemical compound, drug | 99.9% 2H atom D2O | Cortecnet | Cat#CD5251P1000 | |
| Software, algorithm | ASTRA software package for analysis of SEC-MALS data | Wyatt | http://www.wyatt.com/products/software/astra.html; RRID:SCR_016255 | |
| Software, algorithm | ProteinLynx Global Server | Waters | 720001408EN; RRID:SCR_016664 | |
| Software, algorithm | DynamX | Waters | 720005145EN | |
| Software, algorithm | ImageJ | Schneider et al., 2012 | https://imagej.nih.gov/ij/; RRID:SCR_003070 | |
| Software, algorithm | GraphPad Prism | GraphPad Software | https://www.graphpad.com/ RRID:SCR_002798 | |
| Software, algorithm | Topspin | Bruker | https://www.bruker.com/products/mr/nmr/software/topspin.html; RRID:SCR_014227 | |
| Software, algorithm | NMRFAM-Sparky | Lee et al., 2015 | http://pine.nmrfam.wisc.edu/download_packages.html RRID:SCR_014228 | |
| Software, algorithm | MARS | Jung and Zweckstetter, 2004 | https://www3.mpibpc.mpg.de/groups/zweckstetter/_links/software_mars.html | |
| Software, algorithm | NMRPipe | Delaglio et al., 1995 | https://www.ibbr.umd.edu/nmrpipe/install.html | |
| Software, algorithm | MDD compressed sensing | Kazimierczuk and Orekhov, 2011 | http://mddnmr.spektrino.com/ | |
| Software, algorithm | POMONA | Shen and Bax, 2015 | https://spin.niddk.nih.gov/bax/nmrserver/pomona/ | |
| Software, algorithm | Rosetta and NMR restraints | Raman et al., 2010 | https://www.rosettacommons.org/software | |
| Software, algorithm | Random coil shifts | Kjaergaard and Poulsen, 2011; Kjaergaard and Poulsen, 2011; Schwarzinger et al., 2001. | https://www1.bio.ku.dk/english/research/bms/sbinlab/randomchemicalshifts1/ | |
| Software, algorithm | RELION three software package | Scheres, 2012 | http://www2.mrc-lmb.cam.ac.uk/relion; RRID:SCR_016274 | |
| Software, algorithm | Gctf | Zhang, 2016 | RELION three software package | |
| Software, algorithm | MotionCor2 | Zheng et al., 2017 | RELION three software package | |
| Software, algorithm | ResMap | Kucukelbir et al., 2014 | RELION three software package | |
| Software, algorithm | Chimera | Pettersen et al., 2004 | http://plato.cgl.ucsf.edu/chimera/ RRID:SCR_004097 | |
| Software, algorithm | Coot | Casañal et al., 2020; Emsley and Cowtan, 2004 | https://www2.mrc-lmb.cam.ac.uk/personal/pemsley/coot/; RRID:SCR_014222 | |
| Software, algorithm | ChimeraX | Pettersen et al., 2021 | https://www.cgl.ucsf.edu/chimerax/ RRID:SCR_015872 | |
| Software, algorithm | REFMAC5 | Brown et al., 2015; Murshudov et al., 1997 | https://www.ccp4.ac.uk; RRID:SCR_007255 | |
| Other | 0.45 μM Syringe Filter | Millipore Sigma | Cat#SE2M230I04 | |
| Other | 5 μM Minisart Syringe Filter | Sartorius | Cat#17594-Q | |
| Other | 5 mL StrepTrap HP column | GE Healthcare | Cat#28-9075-47 | |
| Other | 5 mL HiTrap Q HP column | GE Healthcare | Cat#17-1153-01 | |
| Other | 5 mL HiTrap Heparin HP column | GE Healthcare | Cat#17-0407-01 | |
| Other | 5 mL HisTrap FF column | GE Healthcare | Cat#17-5255-01 | |
| Other | HiLoad 16/60 Superdex 200 column | GE Healthcare | Cat#17-1069-01 | |
| Other | HiLoad 16/60 Superdex 75 column | GE Healthcare | Cat#17-1068-01 | |
| Other | Superose 6 increase10/300 GL | GE Healthcare | Cat#29-0915-96 | |
| Other | 4–12% BisTris NuPAGE Protein Gel | Thermo Fisher | Cat#NP0323 | |
| Other | SuperSep Phos-tag 7.5% precast gels | FUJIFILM Wako Chemicals | Cat#192–17381 | |
| Other | iBlot 0.2 µM pore size nitrocellulose Transfer Stacks | Thermo Fisher | Cat#IB301002 | |
| Other | 15 mL Amicon Ultra-153K Centrifugal Filters | Millipore Sigma | Cat#UFC900324 | |
| Other | 15 mL Amicon Ultra-1530K Centrifugal Filters | Millipore Sigma | Cat#UFC903024 | |
| Other | 15 mL Amicon Ultra-15100K Centrifugal Filters | Millipore Sigma | Cat#UFC910024 | |
| Other | 4 mL Amicon Ultra-4 100K Centrifugal Filters | Millipore Sigma | Cat#UFC810024 | |
| Other | Enzymate Pepsin Column | Waters | Cat#186007233 | |
| Other | Acquity UPLC BEH C18 VanGuard Pre-column | Waters | Cat#186003975 | |
| Other | Acquity UPLC BEH C18 column | Waters | Cat#186002346 |
Additional files
-
Supplementary file 1
Global HDX-MS measurements for the full-length, human DEPTOR.
- https://cdn.elifesciences.org/articles/68799/elife-68799-supp1-v1.xlsx
-
Supplementary file 2
Summary of HDX-MS results for DEPTOR in the presence and absence of the mTOR-FRB domain, related to Figure 5C.
- https://cdn.elifesciences.org/articles/68799/elife-68799-supp2-v1.xlsx
-
Transparent reporting form
- https://cdn.elifesciences.org/articles/68799/elife-68799-transrepform-v1.docx
Download links
A two-part list of links to download the article, or parts of the article, in various formats.
Downloads (link to download the article as PDF)
Open citations (links to open the citations from this article in various online reference manager services)
Cite this article (links to download the citations from this article in formats compatible with various reference manager tools)
Bipartite binding and partial inhibition links DEPTOR and mTOR in a mutually antagonistic embrace
eLife 10:e68799.
https://doi.org/10.7554/eLife.68799


