Impact of asymptomatic Plasmodium falciparum infection on the risk of subsequent symptomatic malaria in a longitudinal cohort in Kenya
- Department of Epidemiology, Gillings School of Global Public Health, University of North Carolina, United States
- Division of Infectious Diseases, School of Medicine, Duke University, United States
- School of Public Health, College of Health Sciences, Moi University, Kenya
- School of Medicine, College of Health Sciences, Moi University, Kenya
- Academic Model Providing Access to Healthcare, Moi Teaching and Referral Hospital, Kenya
- Duke Global Health Institute, Duke University, United States
Figures
Figure 1
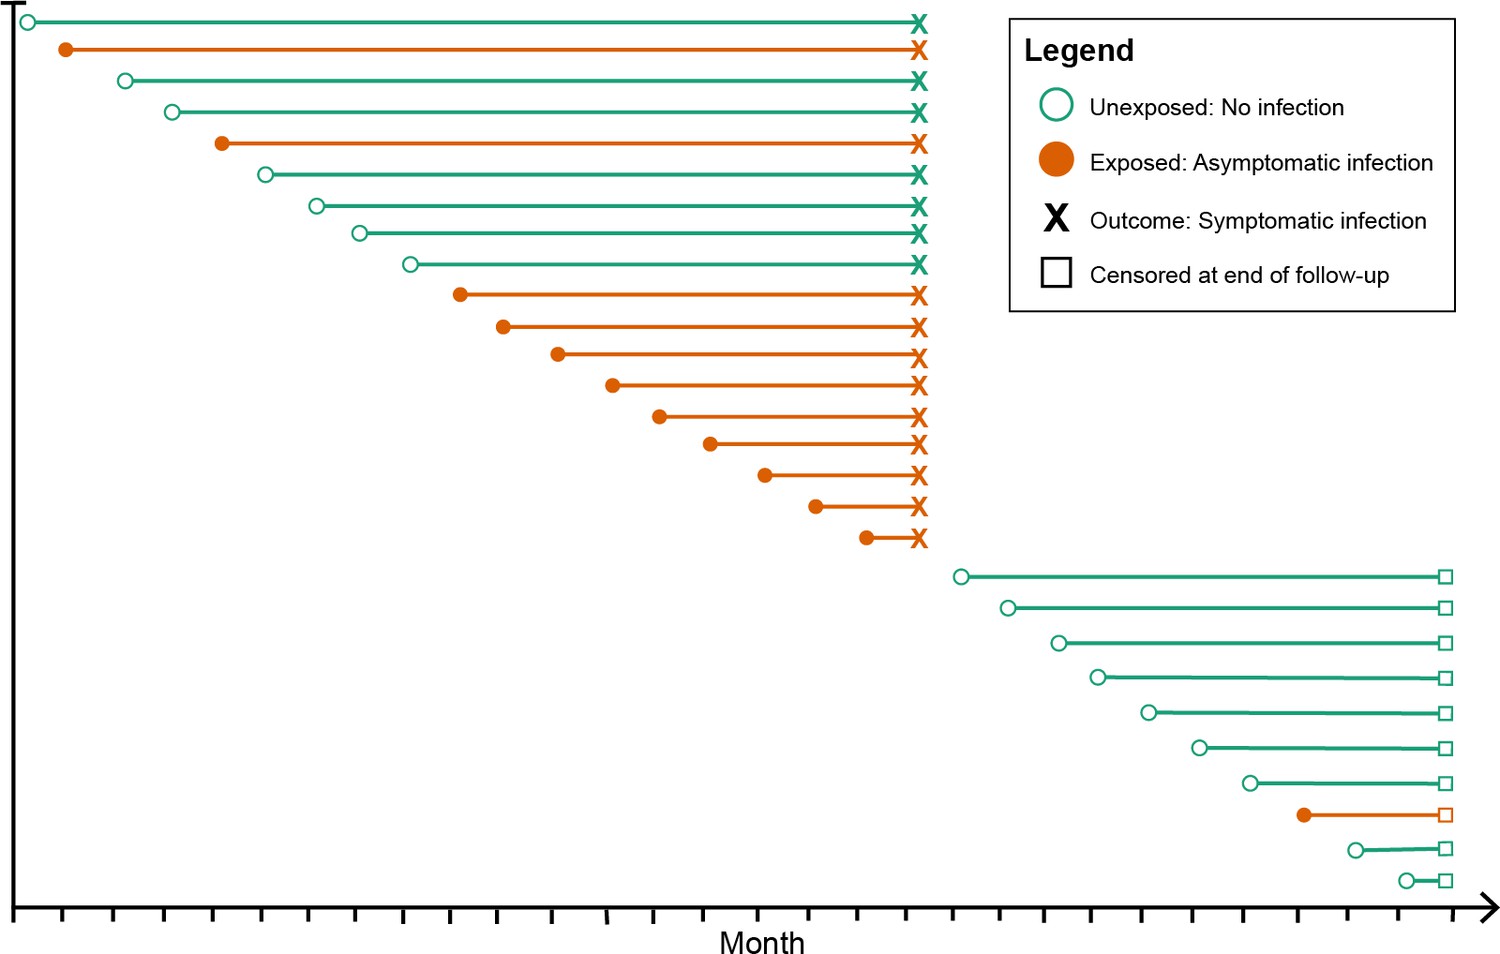
Schematic of how asymptomatic exposure status was ascertained for one participant’s follow-up.
The method treated each monthly follow-up visit as a new study entry for the participant (denoted by circles), recalculating the time to symptomatic malaria (denoted by X) using the monthly follow-up visit date as the origin. The exposure status for each monthly follow-up visit became the exposure status for the follow-up period (denoted by the horizontal line). The follow-up period ended if the participant had a symptomatic infection (X) or was censored due to the study ending or becoming lost to follow-up (denoted by squares). Illustrated here is one hypothetical participant’s follow-up during 29 months, during which they contributed follow-up periods after being uninfected (green lines) and after having asymptomatic infections (orange lines), and suffered one episode of symptomatic malaria (denoted by X), before being censored at the close of follow-up (denoted by squares). As a result, each participant contributes multiple entries to each model equal to the number of exposure assessments, and models include a random effect at the level of the participant to account for repeated observations.
Figure 2
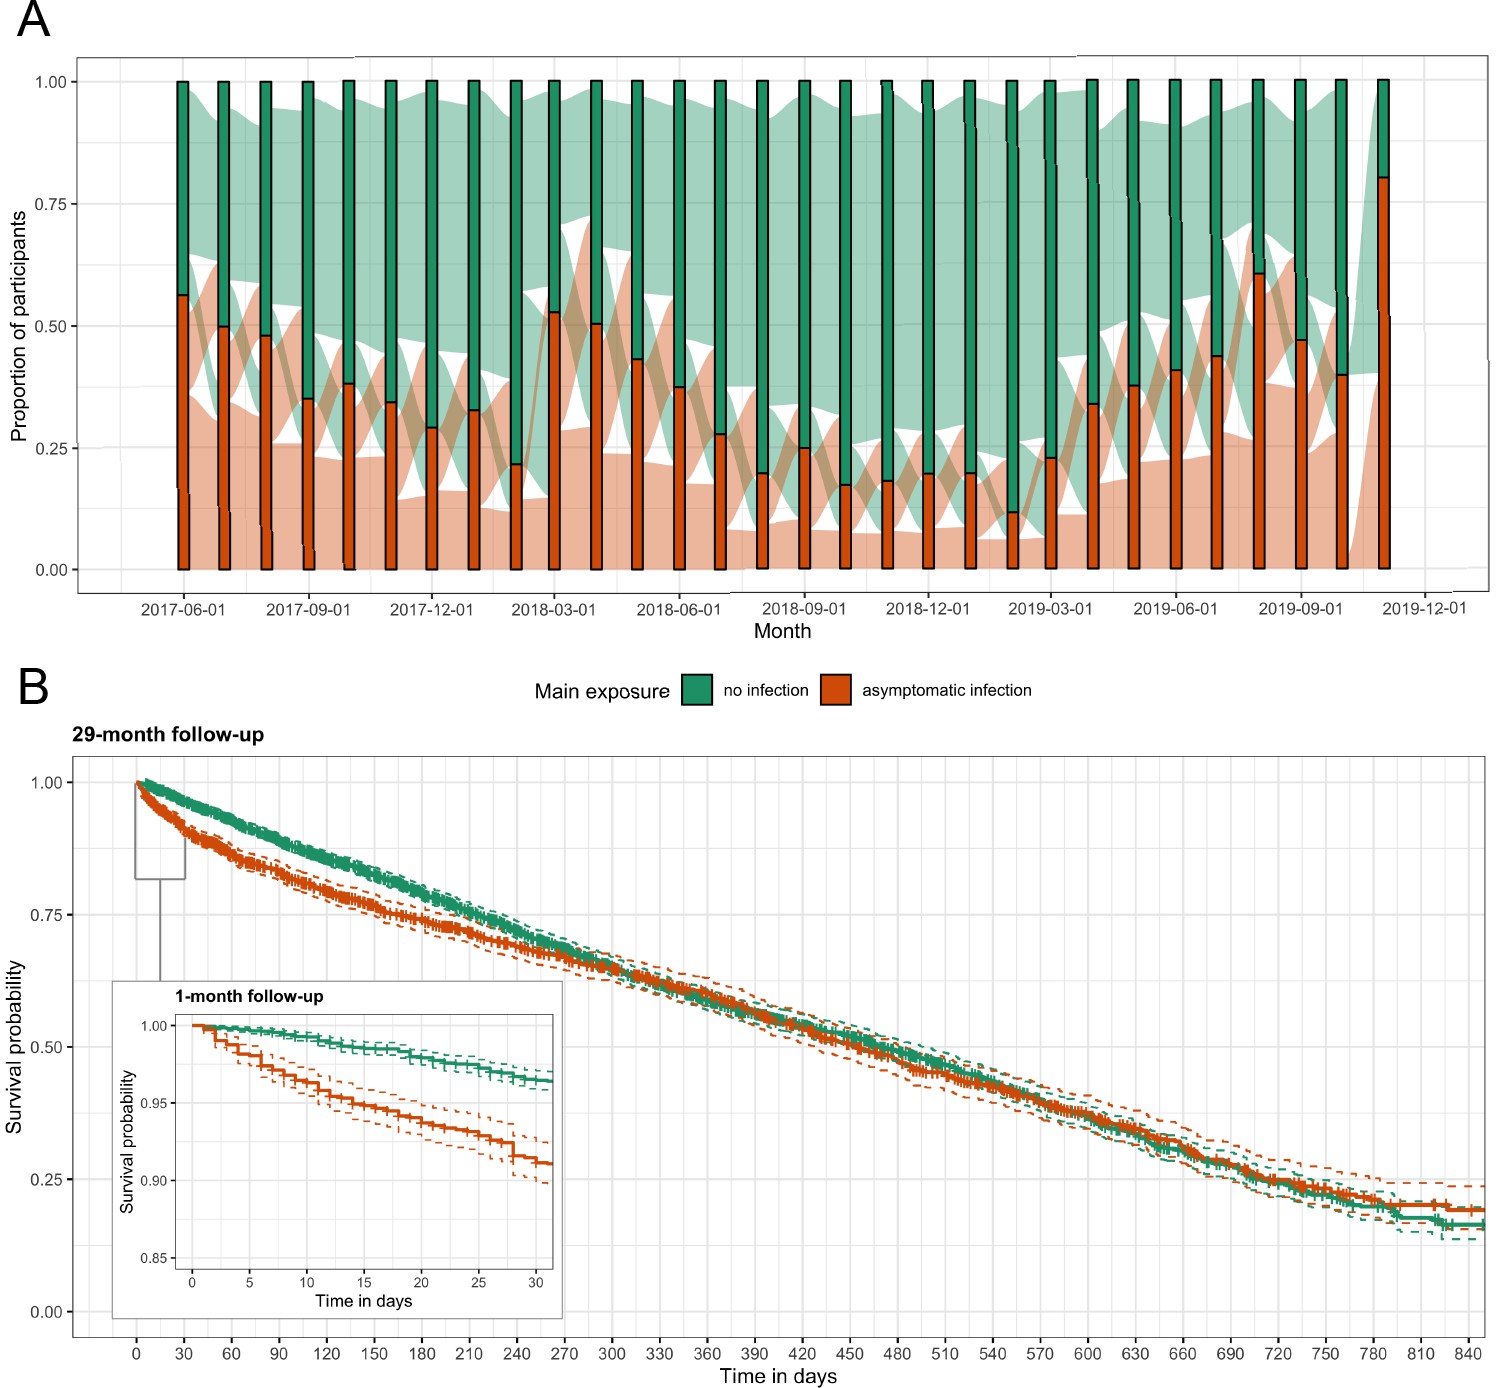
Asymptomatic malaria exposure classifications and symptomatic malaria outcomes over time.
(A) The proportion of participants who had either an asymptomatic infection (orange) or were uninfected (green) at each monthly visit is indicated by the bars. The ribbons connecting the bars illustrate the proportion of participants who moved exposure status from month to month. Orange ribbons indicate the proportion of participants with asymptomatic infections and green the proportion that were uninfected. (B) A Kaplan-Meier survival curve of symptomatic events across the follow-up period stratified by asymptomatic malaria exposure is displayed. Each exposure-outcome pair depicted in Figure 1 is plotted, and therefore each study participant is registered in the curve multiple times, equal to the number of exposure classifications.
Figure 3 with 4 supplements
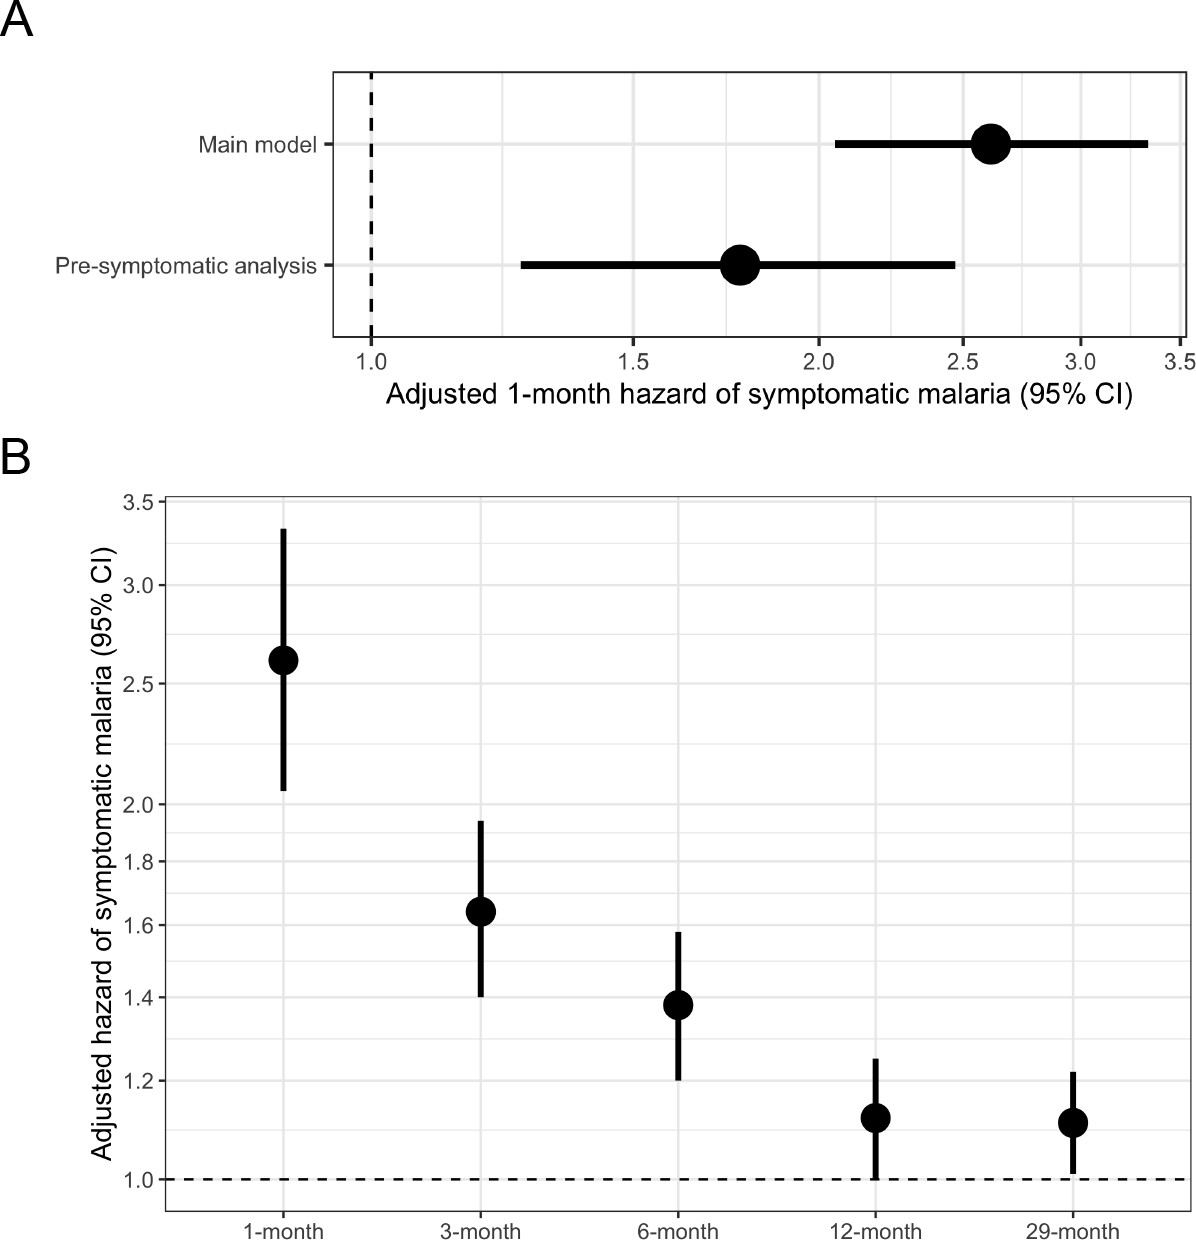
Adjusted hazard of symptomatic malaria after asymptomatic infections compared to uninfected over various follow-up periods.
(A) Frailty Cox proportional hazards model results comparing having asymptomatic malaria infections versus being uninfected over time and the 1-month hazard of symptomatic malaria. The main model used all eligible participants while the pre-symptomatic model removed monthly follow-up visits that occurred within 14 days prior to a symptomatic malaria infection. Models controlled for covariates participant age, sex, bed net usage, and village. (B) Main model results using primary outcome coding of symptomatic malaria were computed using differing follow-up periods ranging from 1 to 29 months and controlled for covariates participant age, sex, bed net usage, and village.
Figure 3—figure supplement 1
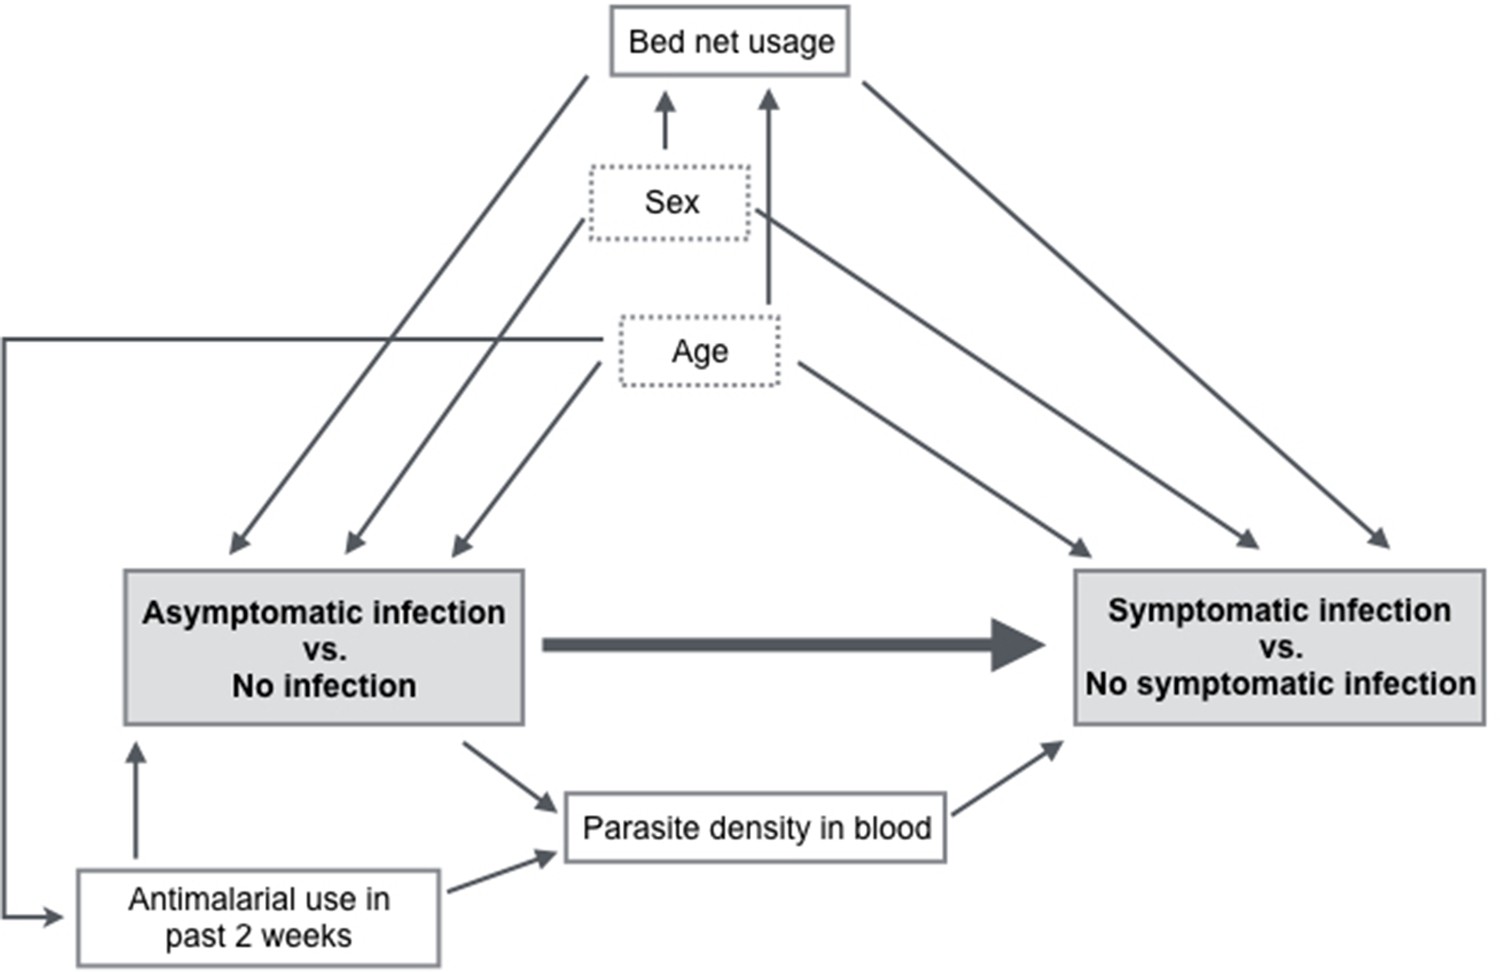
Directed acyclic graph illustrating covariate relationships for the association between exposure to asymptomatic malaria versus no infection and time to symptomatic malaria infection.
The shaded gray boxes represent the main exposure and main outcome. The boxes outlined with dotted lines represent potential effect measure modifiers (sex and age).
Figure 3—figure supplement 2
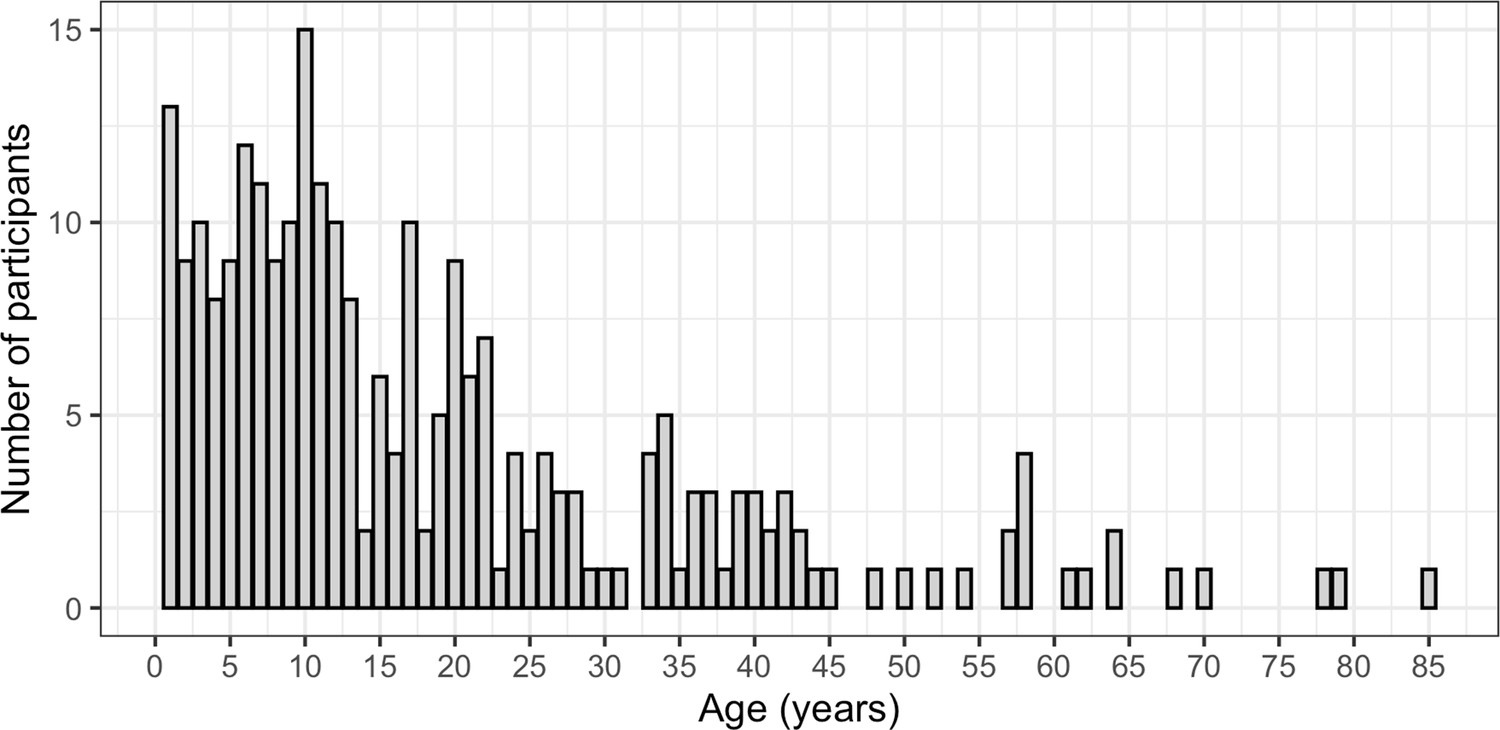
Distribution of ages (in years) of participants included in the study.
The age of each participant is shown on the X-axis and number of participants that were each age (by years) is shown on the Y-axis.
Figure 3—figure supplement 3
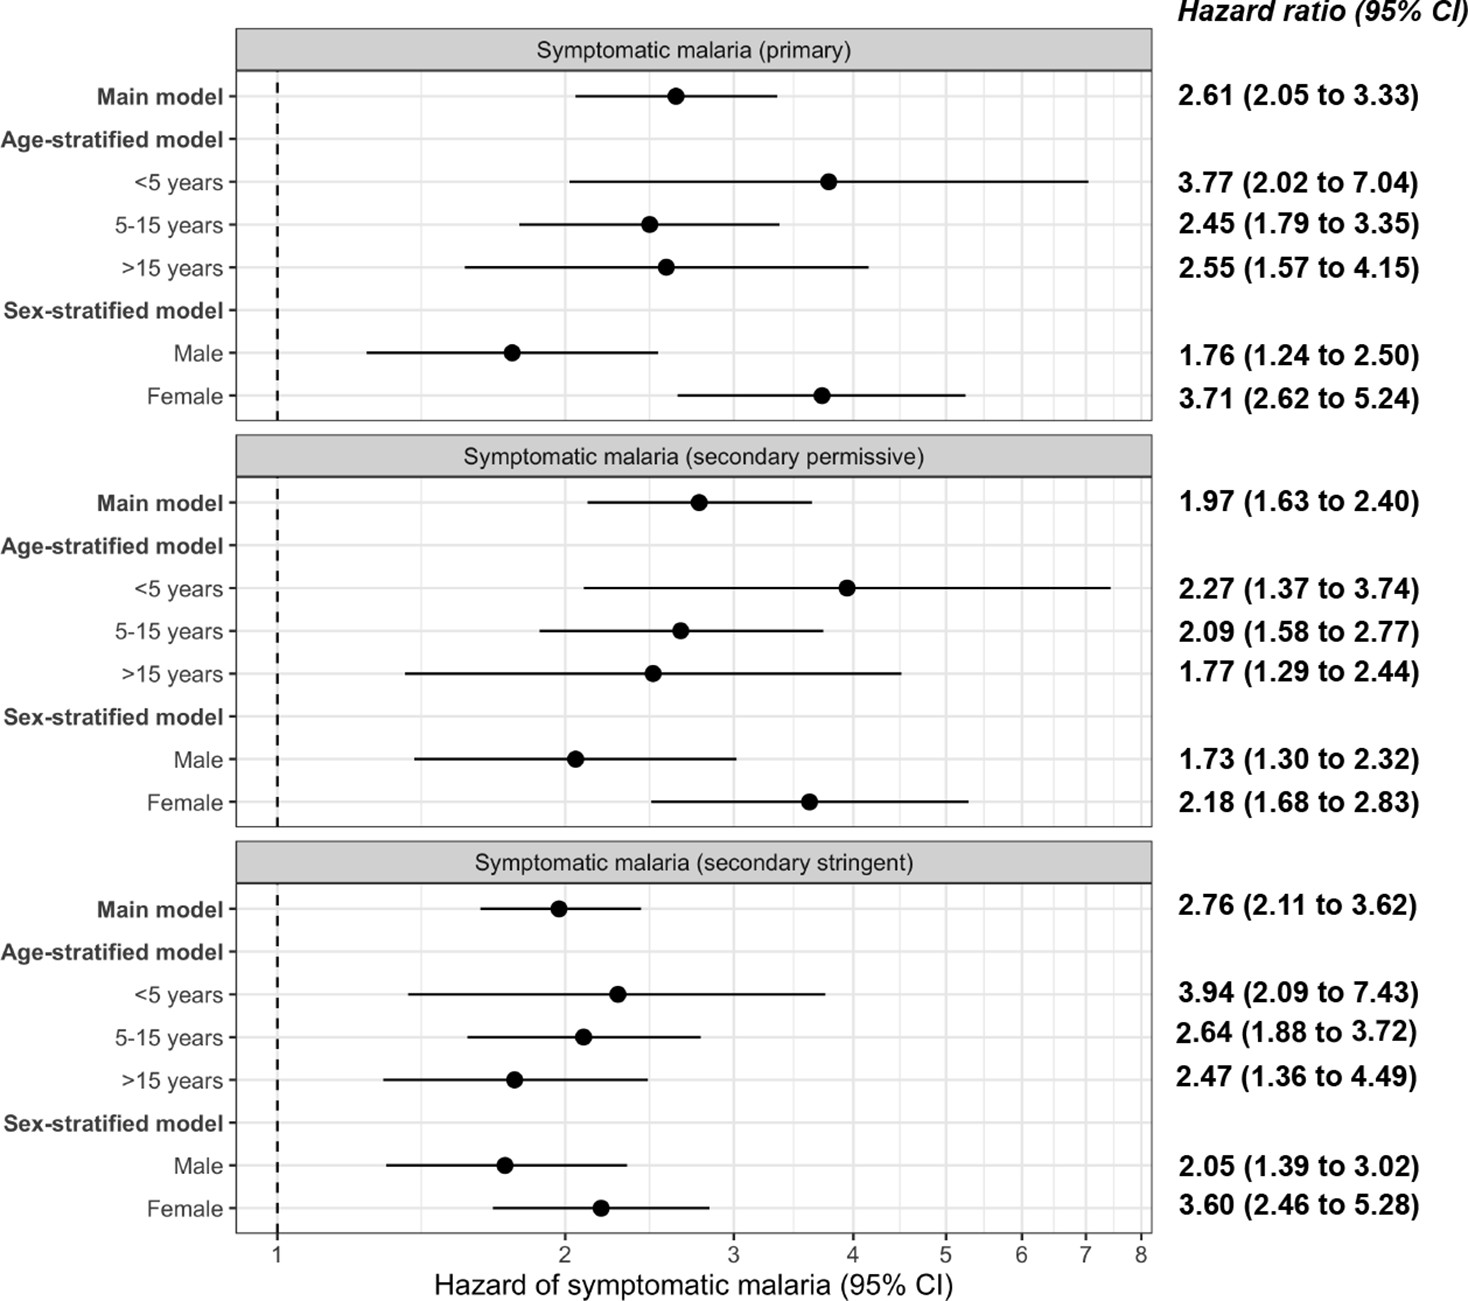
Frailty Cox proportional hazards model results comparing exposure to asymptomatic malaria infections versus no infection over time and 1-month adjusted hazard of symptomatic malaria across the three case definitions for symptomatic malaria: primary, secondary permissive, and secondary stringent.
The main model controls for covariates participant age, sex, bed net usage, and village. The age-stratified model controls for covariates sex, bed net usage, and village. The sex-stratified model controls for participant age, bed net usage, and village. Statistically significant adjusted hazard ratios are bolded.
Figure 3—figure supplement 4
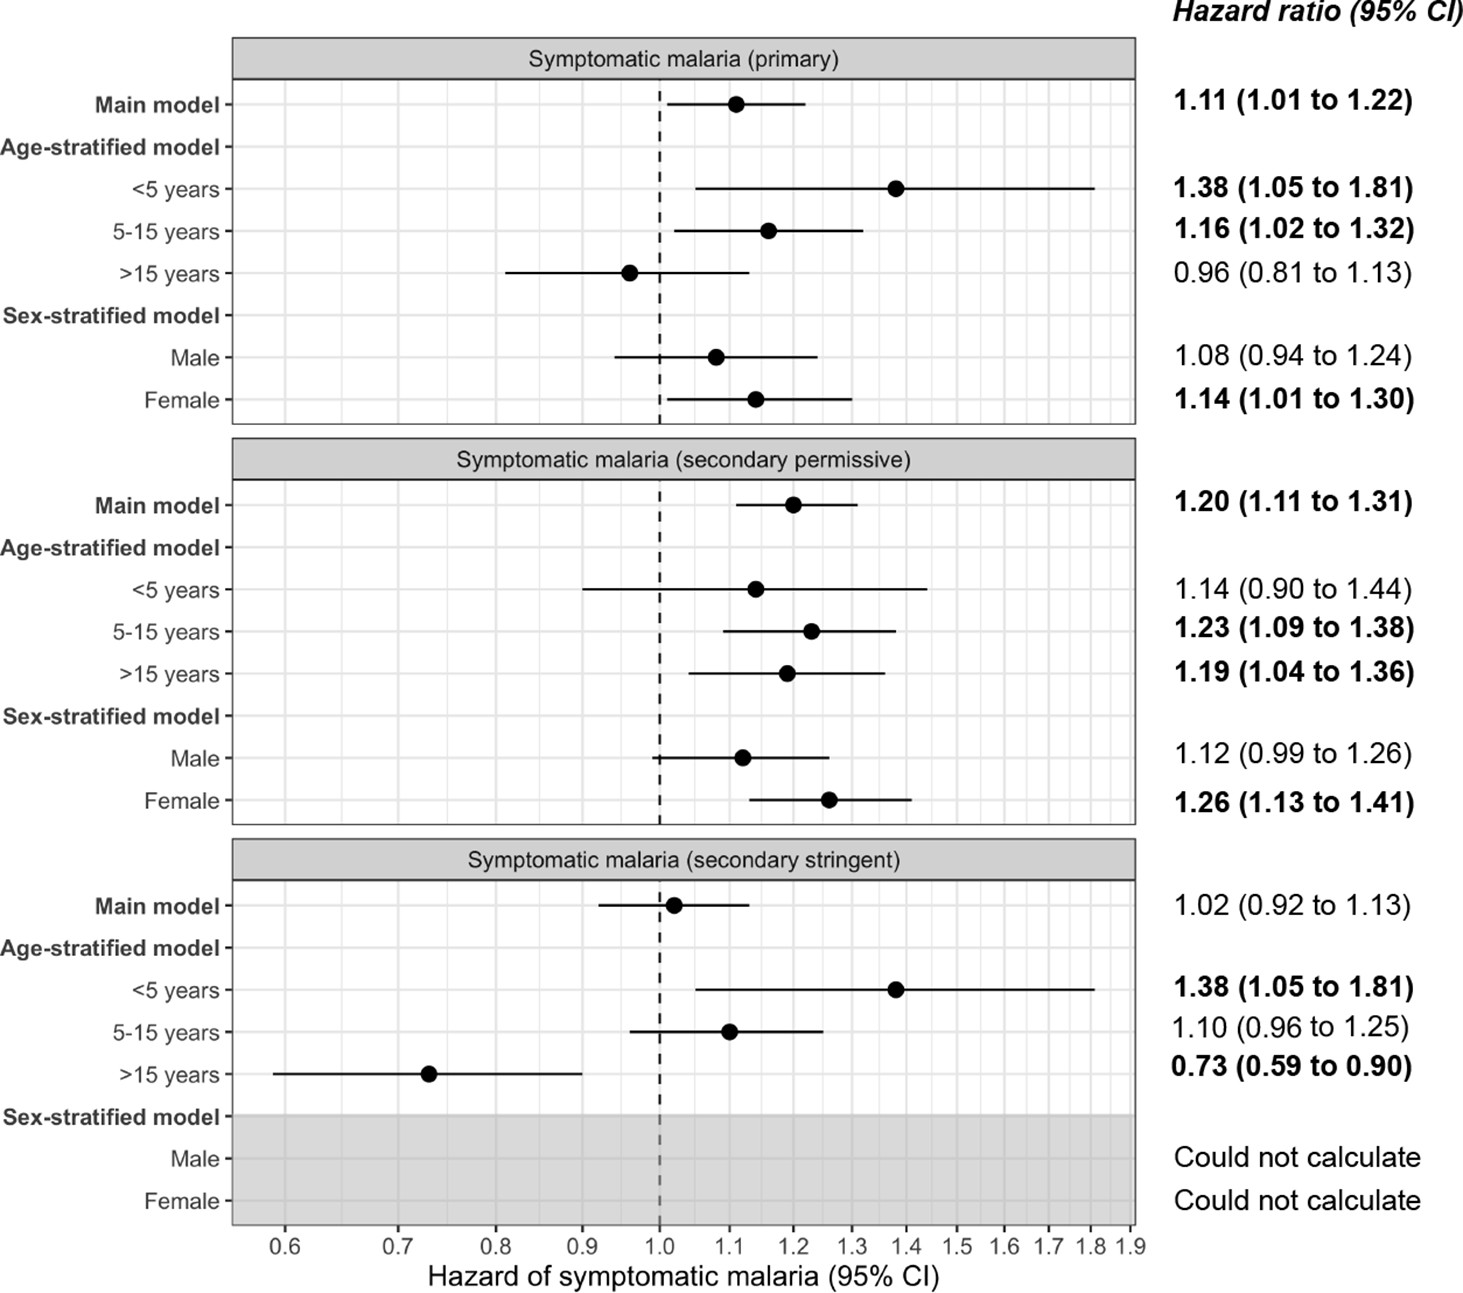
Frailty Cox proportional hazards model results comparing exposure to asymptomatic malaria infections versus no infection over time and 29-month adjusted hazard of symptomatic malaria across the three case definitions for symptomatic malaria: primary, secondary permissive, and secondary stringent.
The main model controls for covariates participant age, sex, bed net usage, and village. The age-stratified model controls for covariates sex, bed net usage, and village. The sex-stratified model controls for participant age, bed net usage, and village. Statistically significant adjusted hazard ratios are bolded.
Figure 4 with 1 supplement
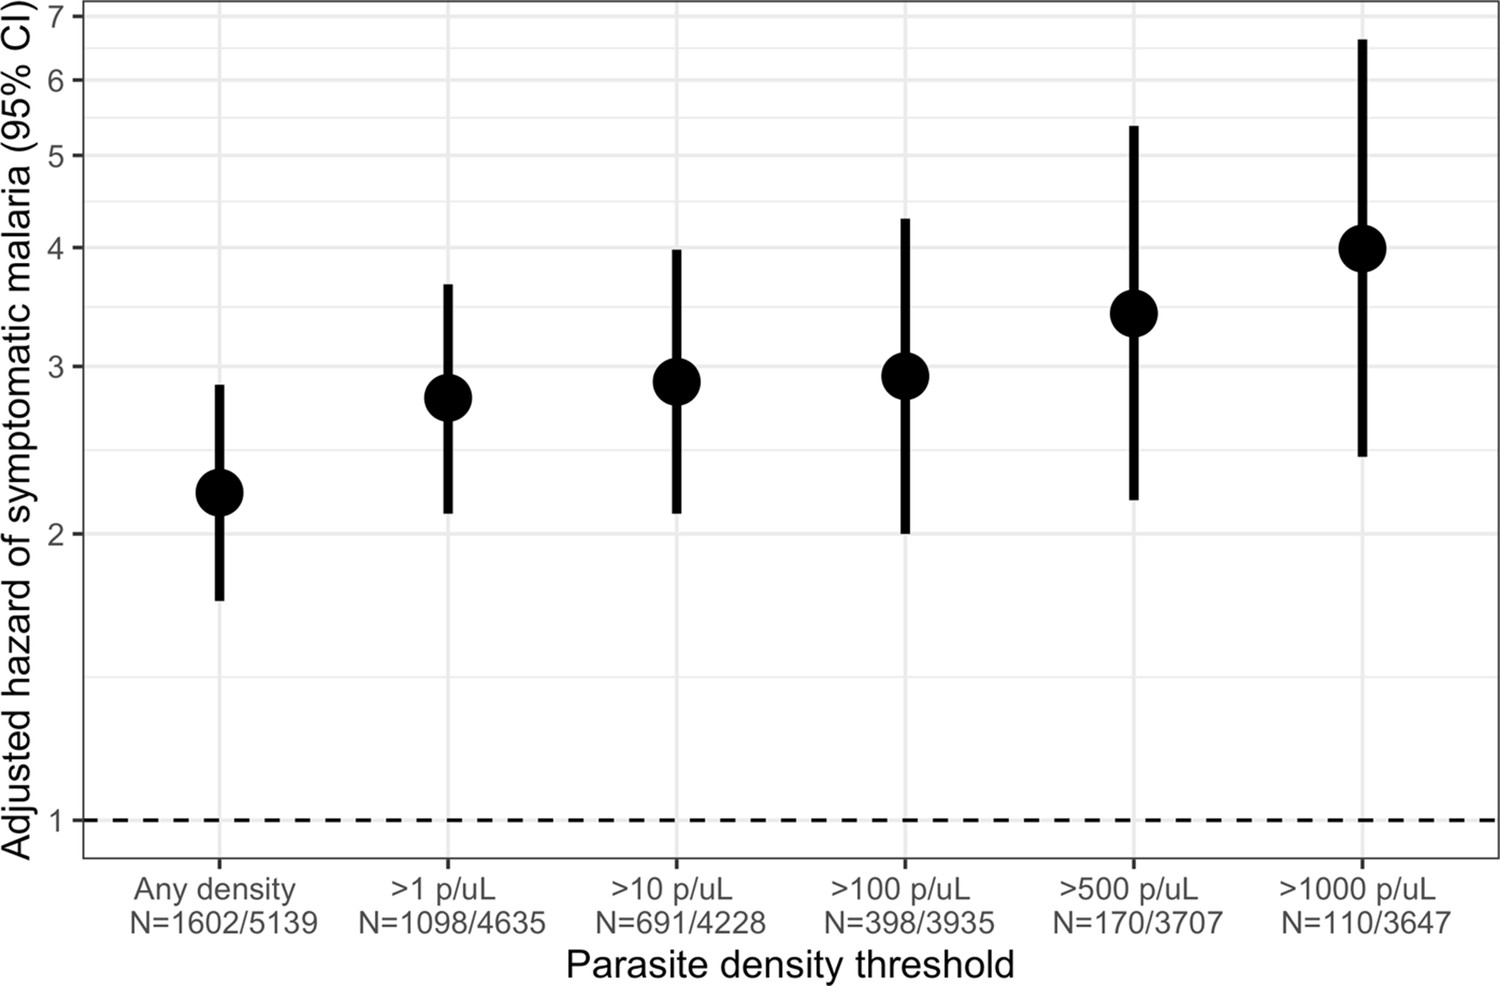
Association between parasite density of asymptomatic malaria infections and the short-term, 1-month hazard of symptomatic malaria.
Estimates of the 1-month hazard of symptomatic malaria in people with asymptomatic infections compared to being uninfected are presented in separate frailty Cox proportional hazards models that were each restricted to asymptomatic infections meeting parasite density thresholds. Each model compared people with asymptomatic malaria infections meeting the listed density threshold to uninfected people and controlled for covariates participant age, sex, bed net usage, and village.
Figure 4—figure supplement 1
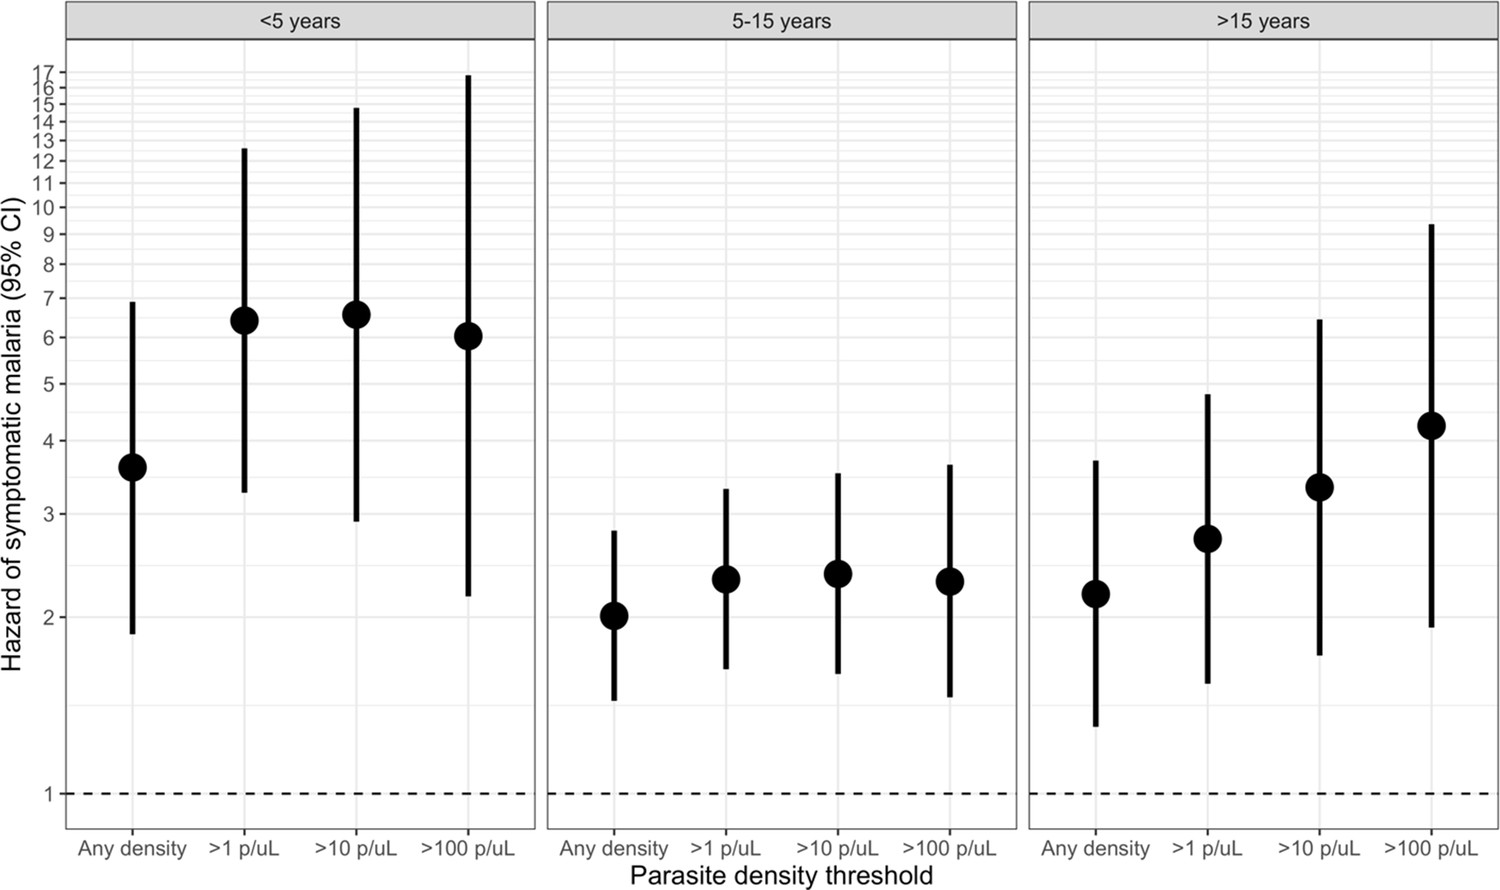
Association between parasite density of asymptomatic malaria infections and the 1-month hazard of symptomatic malaria stratified by participant age.
Each model compared people with asymptomatic malaria infections meeting the listed density threshold to uninfected people and controlled for covariates participant sex, bed net usage, and village. The >500 p/μL and >1000 p/μL thresholds are not presented due to sparse data.
Tables
Table 1
Covariate distribution across symptomatic malaria events in 29 months of follow-up.
| Total person-months† (N, %) | Person-months ending in symptomatic infections‡ (N, %) | Median time to symptoms for entire study (days, IQR) | p-Value comparing time to symptoms | |
|---|---|---|---|---|
| Main exposure | <0.001§ | |||
| No infection | 3537 (65.8) | 1580 (65.7) | 230 (98, 402) | – |
| Asymptomatic infection | 1842 (34.2) | 826 (34.3) | 173 (49, 399) | – |
| Age | 0.015¶ | |||
| <5 years | 812 (15.1) | 329 (13.7) | 226 (82, 435) | – |
| 5 to 15 years | 2279 (42.4) | 1319 (54.8) | 199 (70, 379) | – |
| >15 years | 2288 (42.5) | 758 (31.5) | 244 (97, 426) | – |
| Sex | 0.779§ | |||
| Male | 2360 (43.9) | 1190 (49.5) | 229 (86, 420) | – |
| Female | 3019 (56.1) | 1216 (50.5) | 202 (76, 384) | – |
| Regular bed net usage* | 1.000§ | |||
| No | 1425 (26.5) | 730 (30.3) | 210 (82, 386) | – |
| Yes | 3954 (73.5) | 1676 (69.7) | 217 (80, 403) | – |
| Village | <0.001¶ | |||
| Kinesamo | 1854 (34.5) | 876 (36.4) | 233 (89, 418) | – |
| Maruti | 1681 (31.3) | 745 (31.0) | 174 (64, 350) | – |
| Sitabicha | 1844 (34.3) | 785 (32.6) | 231 (90, 421) | – |
-
Abbreviations: IQR, interquartile range.
*Regular bed net usage was a person averaging > 5 nights a week sleeping under a bed net.
-
†Total person-months indicates the total number of monthly follow-up visits ending in a symptomatic infection or censoring for full 29 months of follow-up.
‡Symptomatic infections were defined using the primary case definition where a participant was P. falciparum-positive by both RDT and qPCR as well as had at least one symptom consistent with malaria during a sick visit.
-
§Wilcoxon rank sum test with continuity correction and Bonferroni correction for repeated measures.
¶ Kruskal-Wallis test with Bonferroni correction for repeated measures.
-
Significant estimates are bolded.
Table 2
Predicted hazard of symptomatic malaria across follow-up periods.
| 1-Month aHR (95% CI) | 3-Month aHR (95% CI) | 6-Month aHR (95% CI) | 12-Month aHR (95% CI) | 29-Month aHR (95% CI) | |
|---|---|---|---|---|---|
| Main exposure | |||||
| No infection | Ref | Ref | Ref | Ref | Ref |
| Asymptomatic infection | 2.61 (2.05, 3.33) | 1.64 (1.40, 1.94) | 1.38 (1.20, 1.58) | 1.12 (1.00, 1.25) | 1.11 (1.01, 1.22) |
| Age | |||||
| <5 years | Ref | Ref | Ref | Ref | Ref |
| 5 to 15 years | 1.37 (0.90, 2.08) | 1.61 (1.00, 2.61) | 1.99 (1.07, 3.71) | 2.37 (0.97, 5.77) | 2.52 (1.26, 5.01) |
| >15 years | 0.56 (0.36, 0.88) | 0.74 (0.46, 1.21) | 0.83 (0.44, 1.53) | 0.88 (0.37, 2.08) | 0.97 (0.51, 1.84) |
| Sex | |||||
| Male | Ref | Ref | Ref | Ref | Ref |
| Female | 0.93 (0.70, 1.24) | 0.84 (0.61, 1.16) | 0.80 (0.53, 1.20) | 0.68 (0.38, 1.21) | 0.63 (0.40, 0.99) |
| Regular bed net usage* | |||||
| No | Ref | Ref | Ref | Ref | Ref |
| Yes | 1.00 (0.70, 1.43) | 0.81 (0.55, 1.20) | 0.70 (0.43, 1.16) | 0.59 (0.29, 1.21) | 0.52 (0.30, 0.89) |
| Village | |||||
| Kinesamo | Ref | Ref | Ref | Ref | Ref |
| Maruti | 1.08 (0.77, 1.52) | 1.11 (0.75, 1.64) | 1.14 (0.69, 1.88) | 1.13 (0.56, 2.31) | 1.09 (0.64, 1.85) |
| Sitabicha | 0.72 (0.49, 1.05) | 0.80 (0.53, 1.21) | 0.76 (0.45, 1.29) | 0.73 (0.35, 1.51) | 0.70 (0.40, 1.23) |
-
Abbreviations: CI, confidence interval; aHR, adjusted hazard ratio; Ref, reference.
*Regular bed net usage was defined as a person averaging > 5 nights a week sleeping under a bed net.
-
Significant estimates are bolded.
Table 3
Age- and sex-stratified adjusted hazard ratios of time to symptomatic malaria.
| Comparison | Age aHR (95% CI) | Sex aHR (95% CI) | ||||
|---|---|---|---|---|---|---|
| <5 years | 5 to 15 years | >15 years | Male | Female | ||
| 1-Month main model | 3.77 (2.02,7.04) | 2.45 (1.79,3.35) | 2.55 (1.57,4.15) | 1.76 (1.24,2.50) | 3.71 (2.62,5.24) | |
| 1-Month pre-symptomatic | 2.85 (1.19,6.79) | 1.61 (1.05,2.46) | 1.90 (0.93,3.86) | 1.24 (0.75,2.05) | 2.34 (1.47,3.71) | |
| 3-Month main model | 2.47 (1.59,3.84) | 1.49 (1.21,1.85) | 1.69 (1.23,2.32) | 1.29 (1.01,1.64) | 2.03 (1.62,2.55) | |
| 3-Month pre-symptomatic | 2.00 (1.20,3.34) | 1.16 (0.90,1.48) | 1.35 (0.94,1.93) | 1.05 (0.79,1.39) | 1.52 (1.18,1.97) | |
| 6-Month main model | 1.94 (1.34,2.80) | 1.32 (1.11,1.57) | 1.31 (1.01,1.70) | 1.13 (0.93,1.39) | 1.62 (1.35,1.94) | |
| 6-Month pre-symptomatic | 1.63 (1.08,2.46) | 1.11 (0.92,1.34) | 1.10 (0.83,1.46) | 0.98 (0.78,1.22) | 1.33 (1.09,1.62) | |
| 12-Month main model | Not calculated* | Not calculated* | Not calculated* | 1.10 (0.86,1.19) | 1.21 (1.05,1.41) | |
| 12-Month pre-symptomatic | 1.24 (0.88,1.74) | 1.00 (0.86,1.17) | 0.85 (0.68,1.07) | 0.91 (0.77,1.09) | 1.04 (0.88,1.22) | |
| 29-Month main model | 1.38 (1.05,1.81) | 1.16 (1.02,1.32) | 0.96 (0.81,1.13) | 1.08 (0.94,1.24) | 1.14 (1.01,1.30) | |
| 29-Month pre-symptomatic | 1.23 (0.92,1.64) | 1.06 (0.93,1.21) | 0.88 (0.74,1.05) | Not calculated* | Not calculated* | |
-
Abbreviations: CI, confidence interval; aHR, adjusted hazard ratio.
*Not calculated due to data sparsity.
-
Statistically significant effect measure modification by the log-likelihood ratio test is bolded.
Additional files
-
Supplementary file 1
Comparison of time-varying exposure coding approaches.
- https://cdn.elifesciences.org/articles/68812/elife-68812-supp1-v2.docx
-
Supplementary file 2
Covariate distribution across symptomatic events: secondary permissive case definition.
- https://cdn.elifesciences.org/articles/68812/elife-68812-supp2-v2.docx
-
Supplementary file 3
Covariate distribution across symptomatic events: secondary stringent case definition.
- https://cdn.elifesciences.org/articles/68812/elife-68812-supp3-v2.docx
-
Reporting standard 1
STROBE checklist for cohort studies.
- https://cdn.elifesciences.org/articles/68812/elife-68812-repstand1-v2.docx
-
Transparent reporting form
- https://cdn.elifesciences.org/articles/68812/elife-68812-transrepform-v2.docx
Download links
A two-part list of links to download the article, or parts of the article, in various formats.
Downloads (link to download the article as PDF)
Open citations (links to open the citations from this article in various online reference manager services)
Cite this article (links to download the citations from this article in formats compatible with various reference manager tools)
Impact of asymptomatic Plasmodium falciparum infection on the risk of subsequent symptomatic malaria in a longitudinal cohort in Kenya
eLife 10:e68812.
https://doi.org/10.7554/eLife.68812


