A human-based multi-gene signature enables quantitative drug repurposing for metabolic disease
- William Harvey Research Institute, Queen Mary University of London, United Kingdom
- Augur Precision Medicine LTD, United Kingdom
- Relation Therapeutics LTD, United Kingdom
- Fiona Stanley Hospital, Australia
- Center for Therapeutic Innovation, Miller School of Medicine, University of Miami, United States
- School of Medicine, Duke University, United States
- Faculty of Science, Kinesiology, McMaster University, Canada
Figures
Figure 1
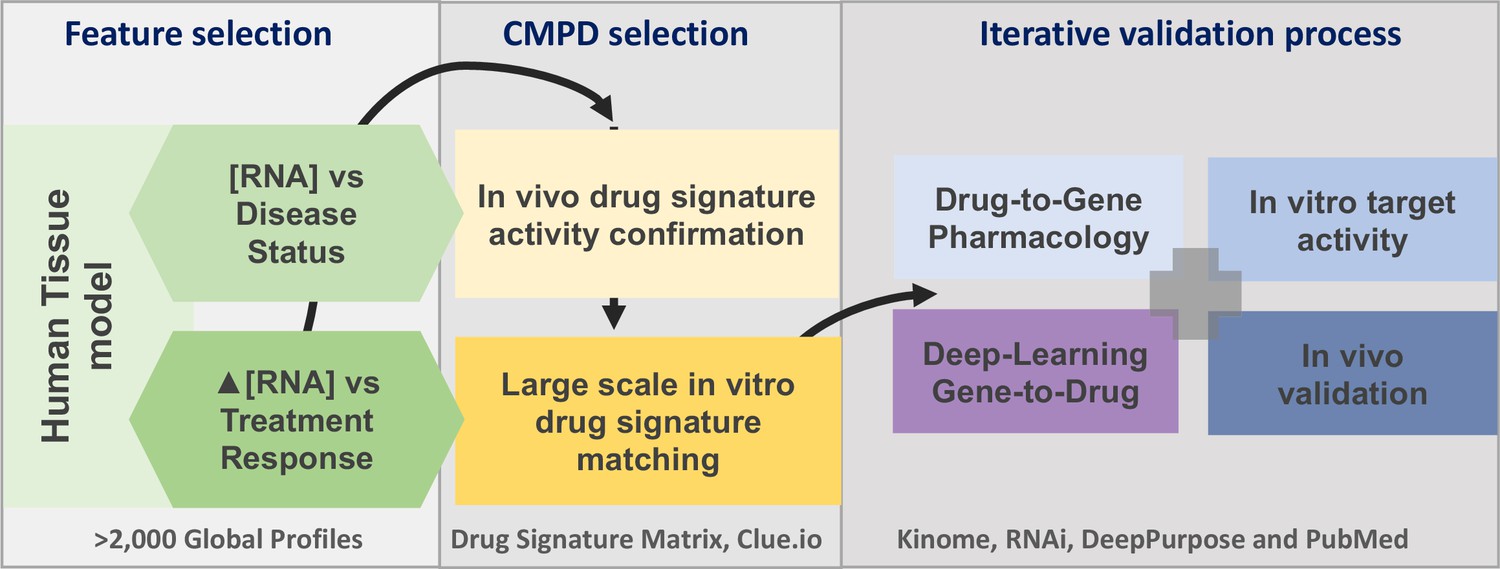
The project analysis process.
The three major phases of the project are defined by the grey boxes. A limited number of gene signatures were considered (four) to limit false-positive associations. The compound (CMPD) selection phase first confirmed that the drug repurposing signature provided valid matches with in vivo positive control drugs, and then a full list of in vitro active drug matches was generated. The third phase was an iterative process in that validation was considered on several levels. We utilised four main independent validation strategies, incorporating multiple data sources, to demonstrate that the insulin resistance drug repurposing (IR-DR) signature produced a high rate of likely true-positive drugs that would reverse IR.
Figure 2
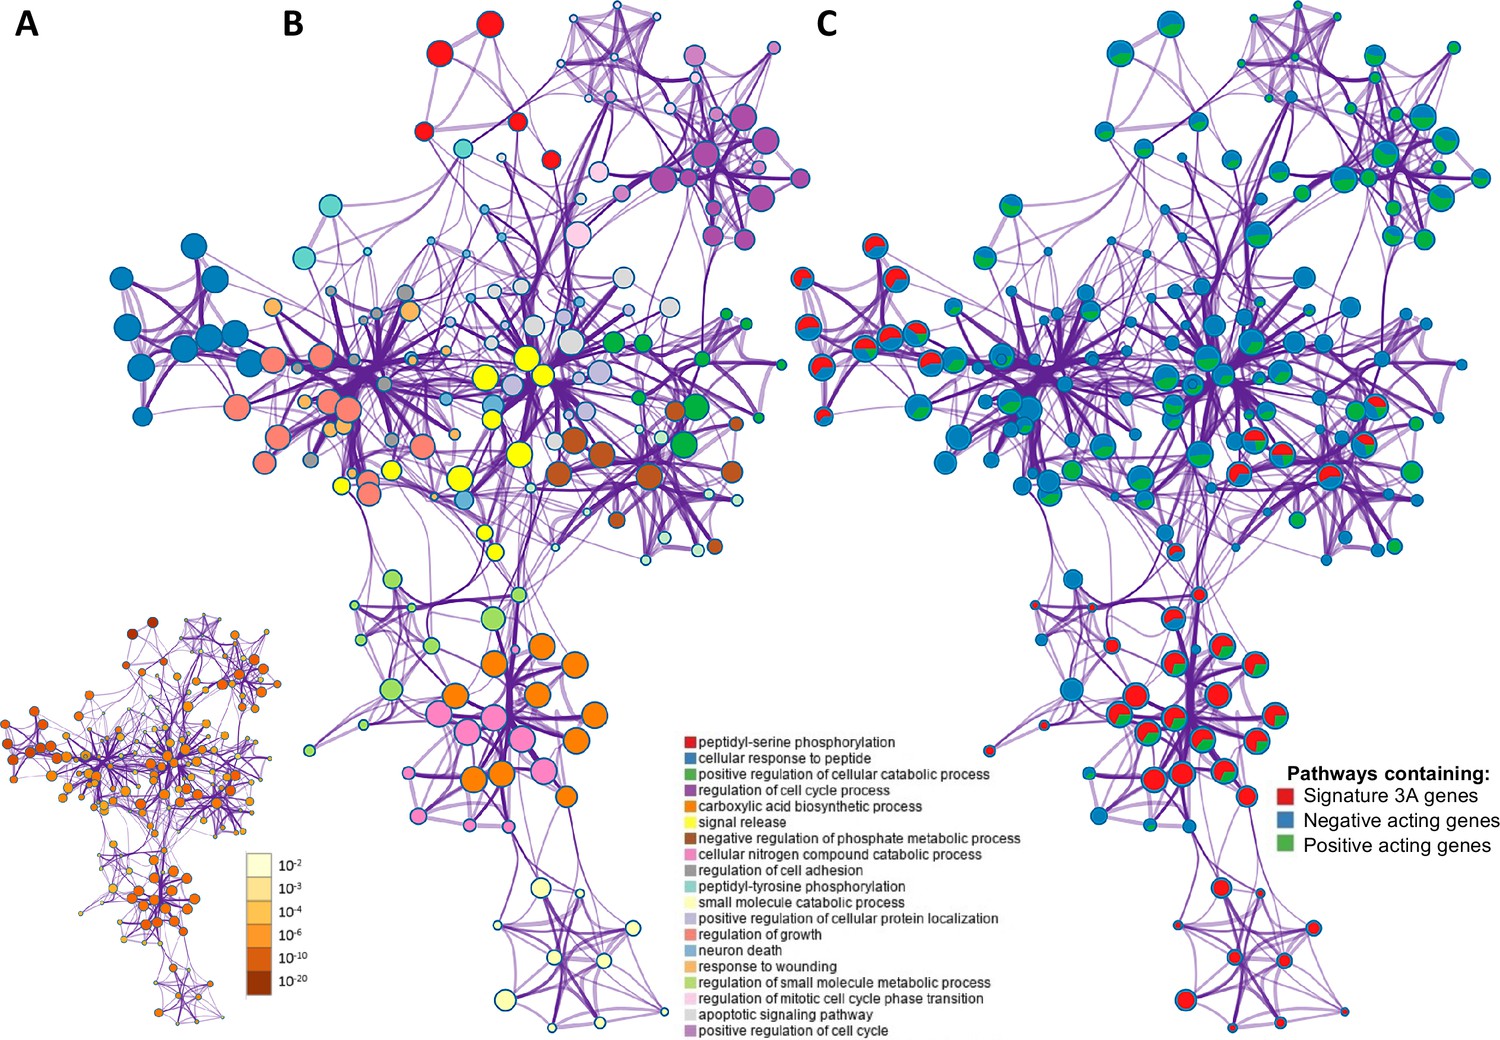
The overlap between protein targets of positively acting drugs and the insulin resistance-drug repurposing (IR-DR) input signature.
(A) A network of significant pathways coloured by p-values, derived from the IR-DR input genes and the 73 validated protein targets of the 150 positively acting drugs. (B) Edges represent connected Gene Ontology (GO) biological processes (>0.3), and nodes within each cluster are coloured/named by their most statistically enriched GO term. (C) Each node is presented as a pie chart, scaled in size by the total number of terms represented by that (top-scoring) ontology, and with the ‘slices’ coloured to indicate which gene list the terms originate from. The same network structure is separately colour-coded by list membership to identify when pathways include members of Signature 3A (red), or protein targets which are negative acting genes (blue, where inhibition yields a positive and overexpression yields a negative IR-DR score) or genes appear to be positively acting (green).
Figure 3
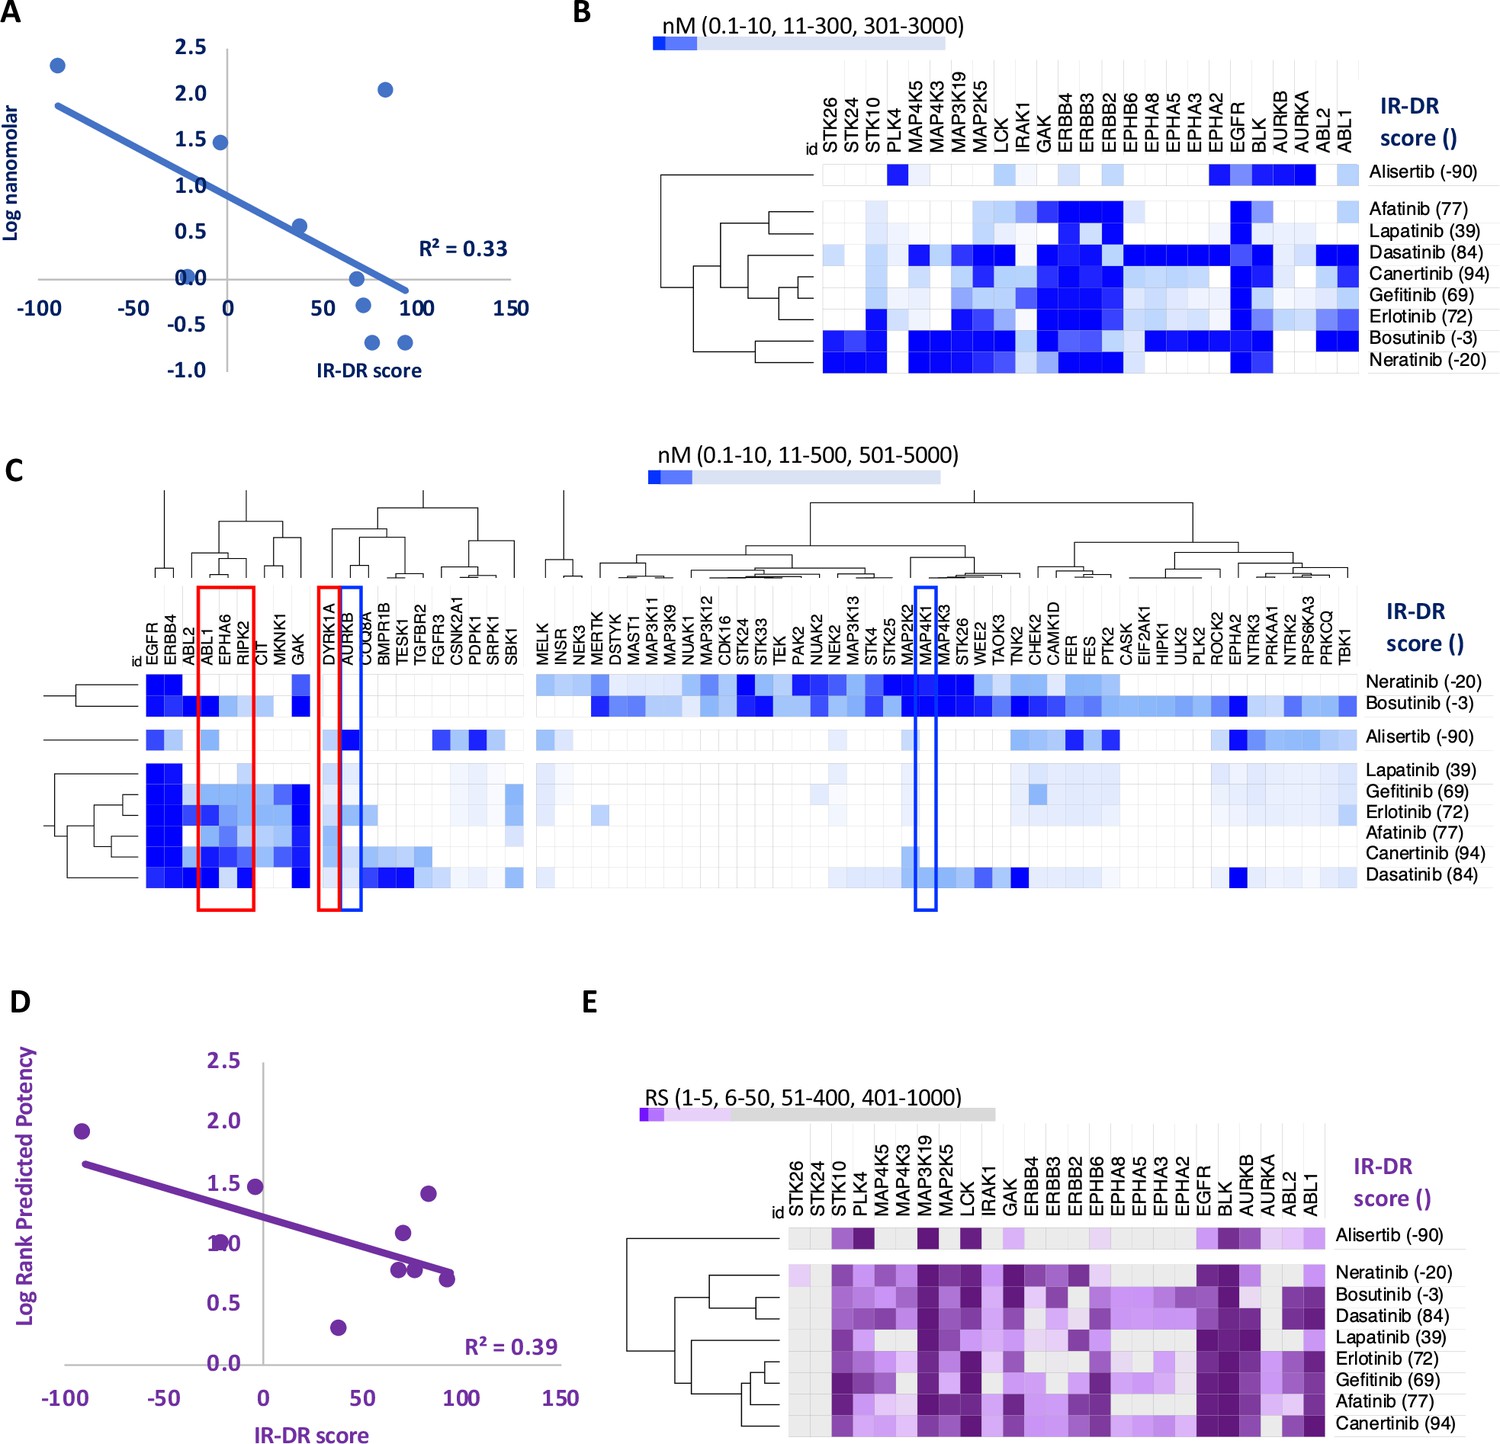
An analysis of the relationship between the insulin resistance-drug repurposing (IR-DR) score and laboratory-based pharmacological potency and selectivity or deep learning-based predictions of compound potency and selectivity.
(A) Inhibitory constants (nM) derived from laboratory assays against top-ranked targets for a series of epidermal growth factor receptor (EGFR) inhibitors. (B) Relationship between IR-DR score (100 = best score) and log potency against EGFR. (C) Expanded range of known targets, for at least one of the inhibitors, helps identify potentially positive (red box) and negative (blue box) off-target inhibitory actions. (D) Rank order score (RS, 1–19211) of predicted compound binding for all protein-coding genes using the DeepPurpose ML model; lab-validated targets feature in top 0.15% of target predictions. Log rank order (‘predicted potency’) for EGFR, over the protein-coding genome, partly predicts efficacy in IR-DR assay, confirming that the ML model matches the relationship observed using the laboratory pharmacology. (E) Using the predicted protein targets and the DeepPurpose rank order scores, it is possible to cluster positively acting ‘EGFR’ compounds from less active or negatively acting compounds.
Appendix 1—figure 1
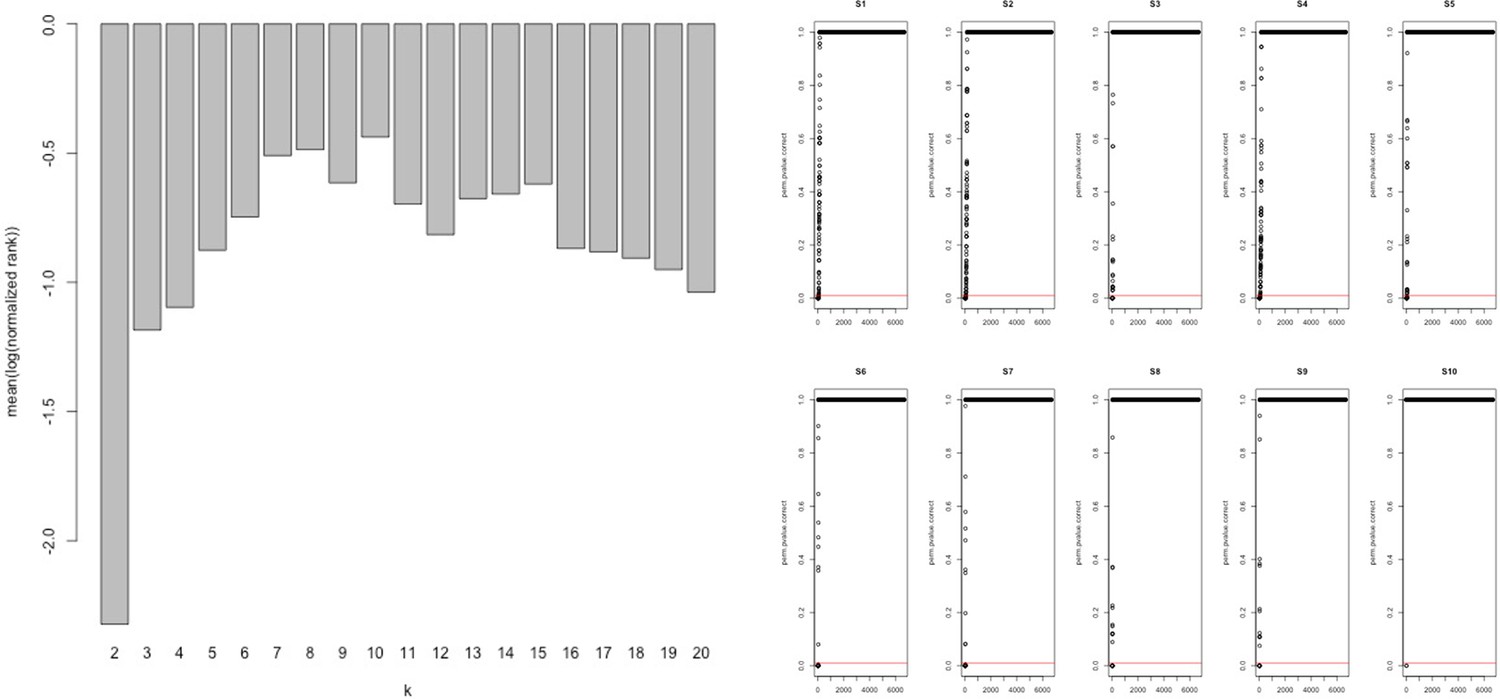
Network analysis statistics from MEGENA.
Analysis of the combined ‘disease’ insulin resistance (IR) and ‘treatment’ response IR genes using tissue gene expression data (Timmons et al., 2018; Timmons et al., 2019) identified those genes that had the greatest connectivity in tissue. These values were used to re-rank and select the top 60 upregulated (positively correlating) and 60 downregulated (negatively correlating) genes regulated in common in adipose and muscle tissue (see Methods).
Appendix 1—figure 2
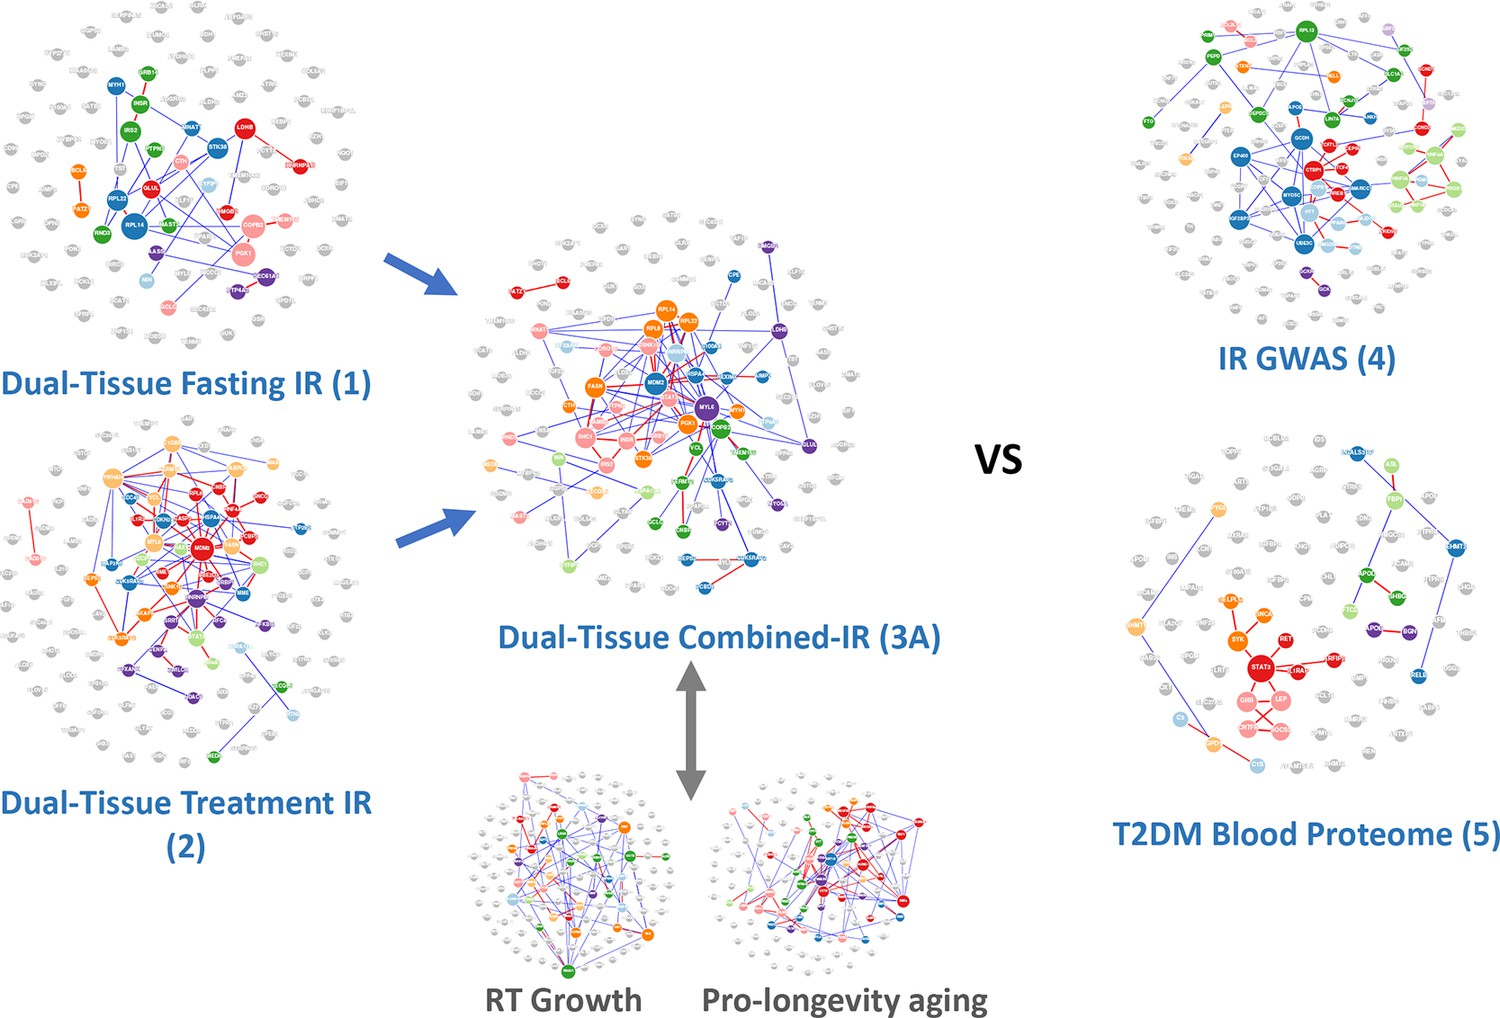
Network-based analysis of the gene lists from Table 1 analysed using protein-protein interaction data.
A notable characteristic of these gene lists was that prior knowledge using multi-omic interaction databases (http://apps.broadinstitute.org/genets) was unable to connect the members of the list, indicating that previously unknown information was contained within each list and our novel analysis. There were <3% overlap of genes across the signatures considered in this study (Table S1) and only two genes common between signatures 3A and 4 (INSR, GRB14), and these were not essential for the performance of the RNA-based insulin resistance-drug repurposing (IR-DR) signature. See Figure S3 and ‘Discussion’ for reference to additional human signatures beyond IR.
Appendix 1—figure 3
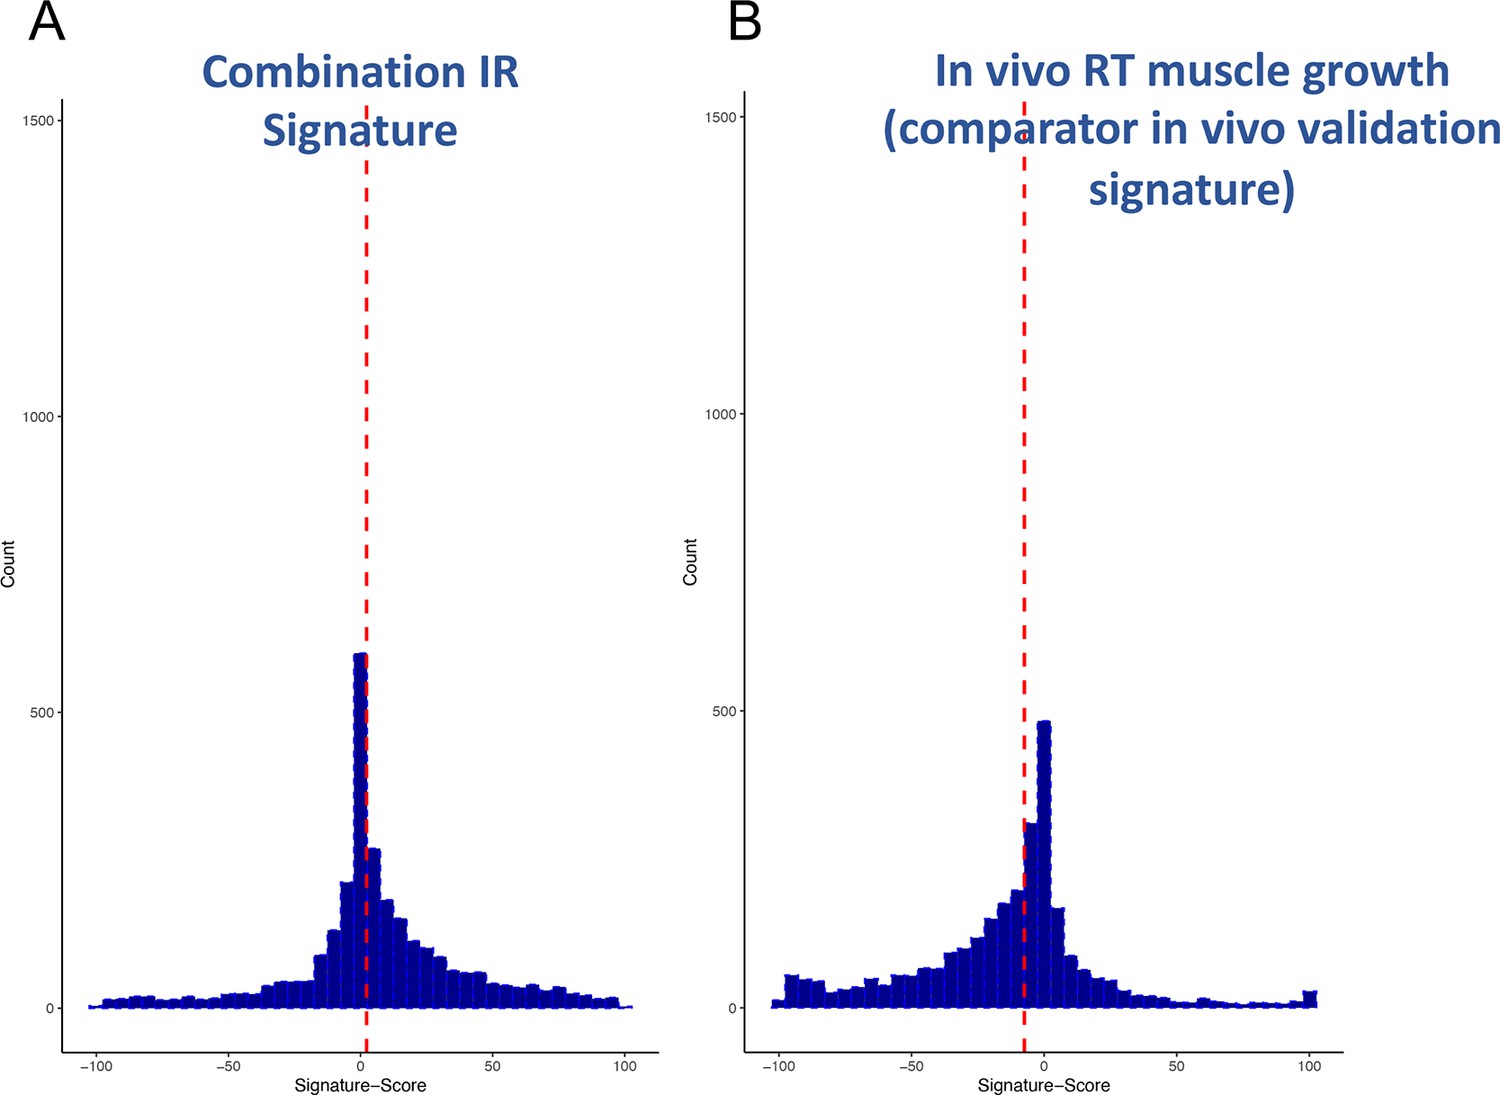
Distribution of scores from clinical input signatures.
Using the input gene lists from Table 1 and the CLUE dataset of >2500 compound signatures, the degree of match (-100 to +100) was established across nine cell types. (A) Distribution of scores was plotted and demonstrates that the majority of compounds are not significantly active. (B) For comparison, it can also be observed that a human muscle in vivo pro-growth signature (Stokes et al., 2020) yields an excess of negatively acting compounds, confirming as expected that the drug database may be biased for anti-tumour/anti-growth compounds.
Appendix 1—figure 4
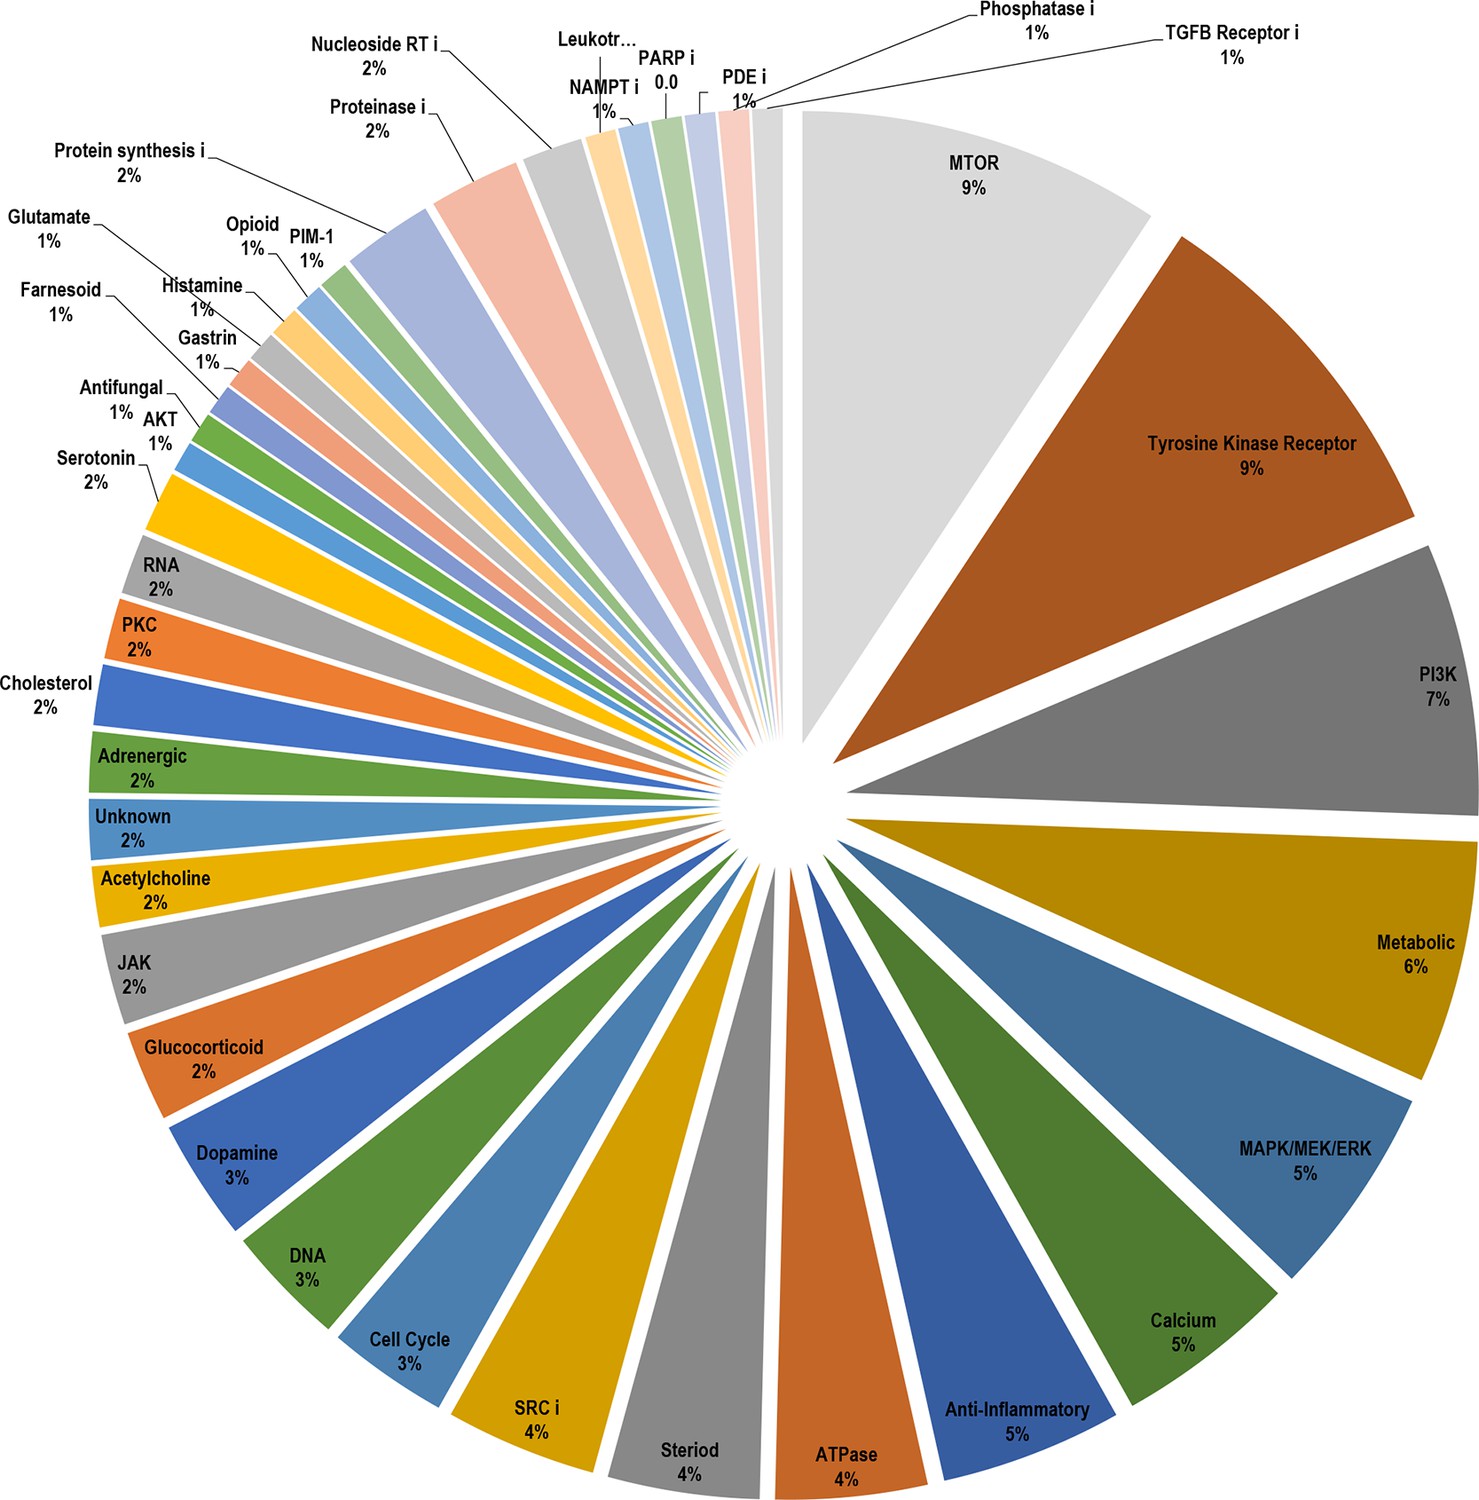
Breakdown of the drug classes of positive scoring insulin resistance-drug repurposing (IR-DR) compounds based on their known primary pharmacological actions.
From >250 active compounds, 140 were associated with a positive action on the IR-DR signature and thus predicted to treat IR. Using the pre-assigned pharmacological descriptors of each compound, they were groups into general classes of compound and represented by a pie-chart. Over 45% of the compounds were classed as kinase inhibitors, while the remaining positively acting compounds belonged to a broad range of pharmacological classes
Appendix 1—figure 5

Breakdown of the drug classes of negatively scoring insulin resistance-drug repurposing (IR-DR) compounds.
From >250 active compounds, ~100 were associated with a negative action on the IR-DR signature and thus predicted to aggravate IR. Using the pre-assigned pharmacological descriptors of each compound, they were grouped into general classes of compound. 17% of the compounds were classed as tubulin inhibitors, while the remaining compounds belonged to a relatively narrow range of pharmacological classes including compounds associated with activation of pro-inflammatory pathways and disruption of cell cycle.
Appendix 1—figure 6

Calculated physicochemicals do not distinguish between positive and negative acting drugs.
Calculated physicochemical descriptors (RDKit) were used to compare positively or negatively acting on the insulin resistance-drug repurposing (IR-DR) signature for systemic properties that might contribute to assay score (MolWt, HeavyAtomCount, NumHeteroatoms, MolLogP, NumRotatableBonds, TPSA, NumAromaticRings, NumSaturatedRings, NumAliphaticRings, RingCount, BalabanJ, NumHAcceptors, NumHDonors). The results were plotted using mean and standard deviation.
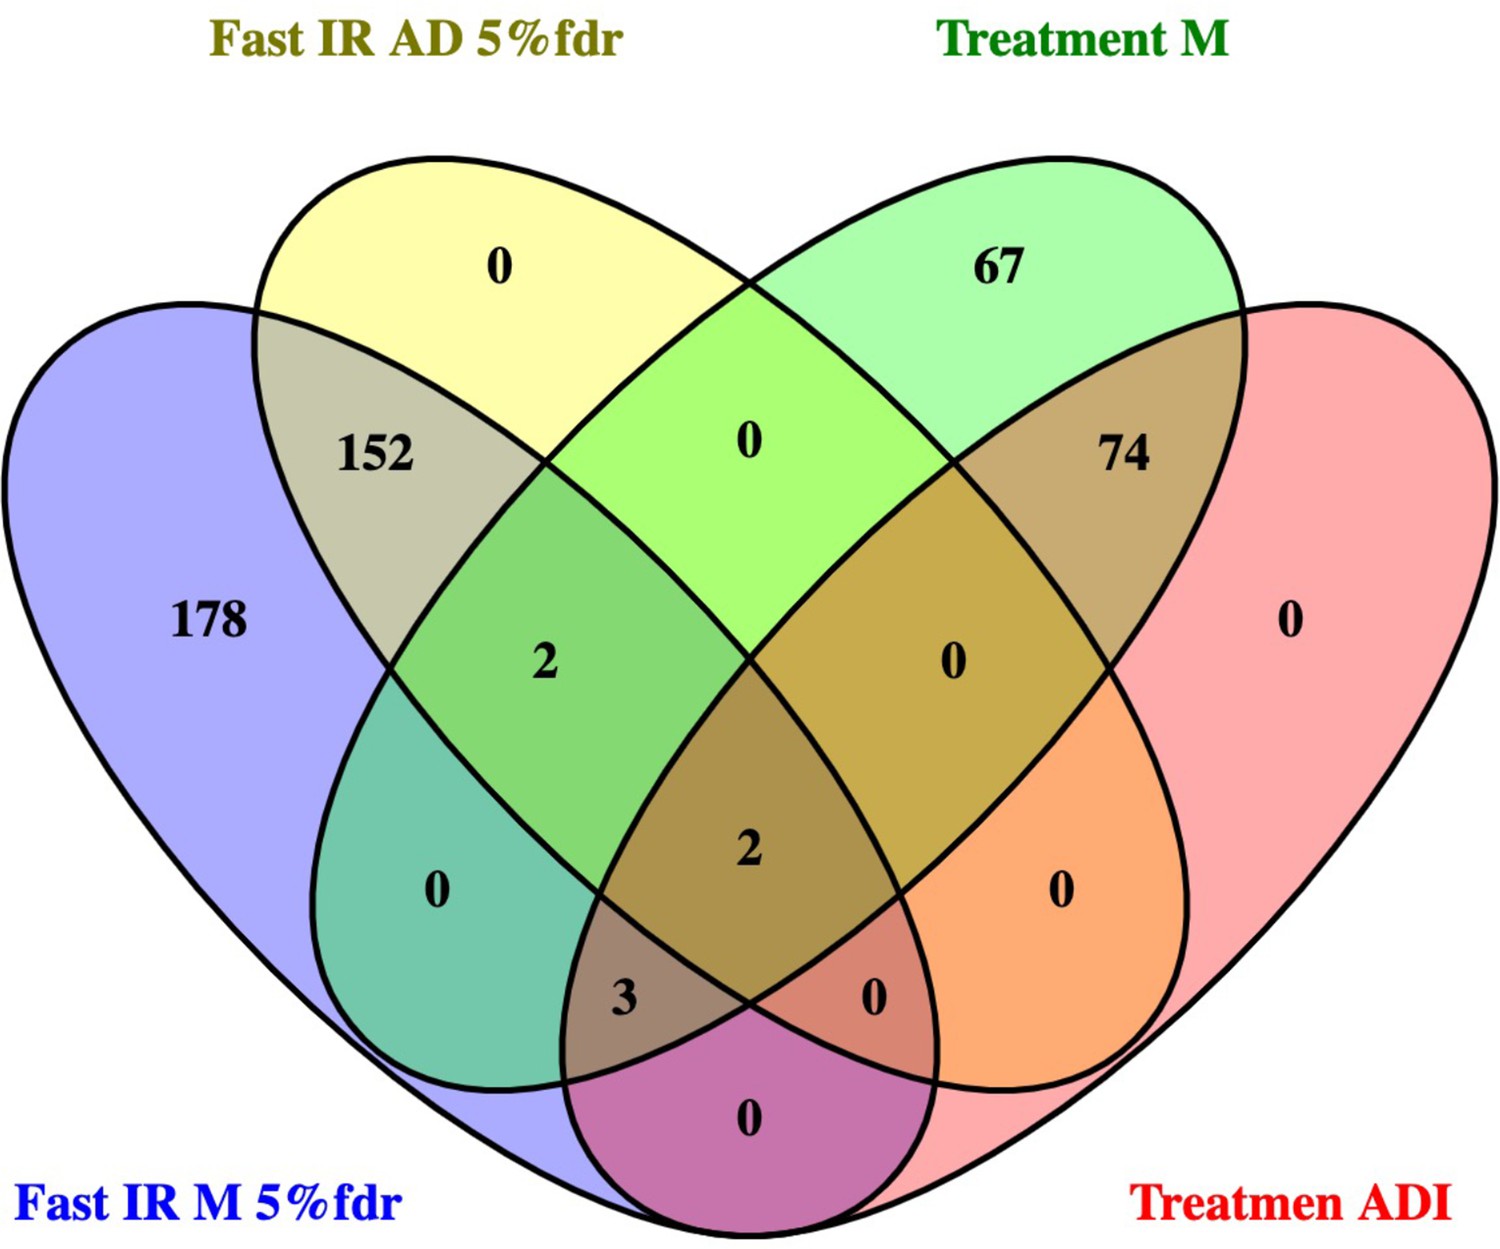
Appendix 1—figure 7
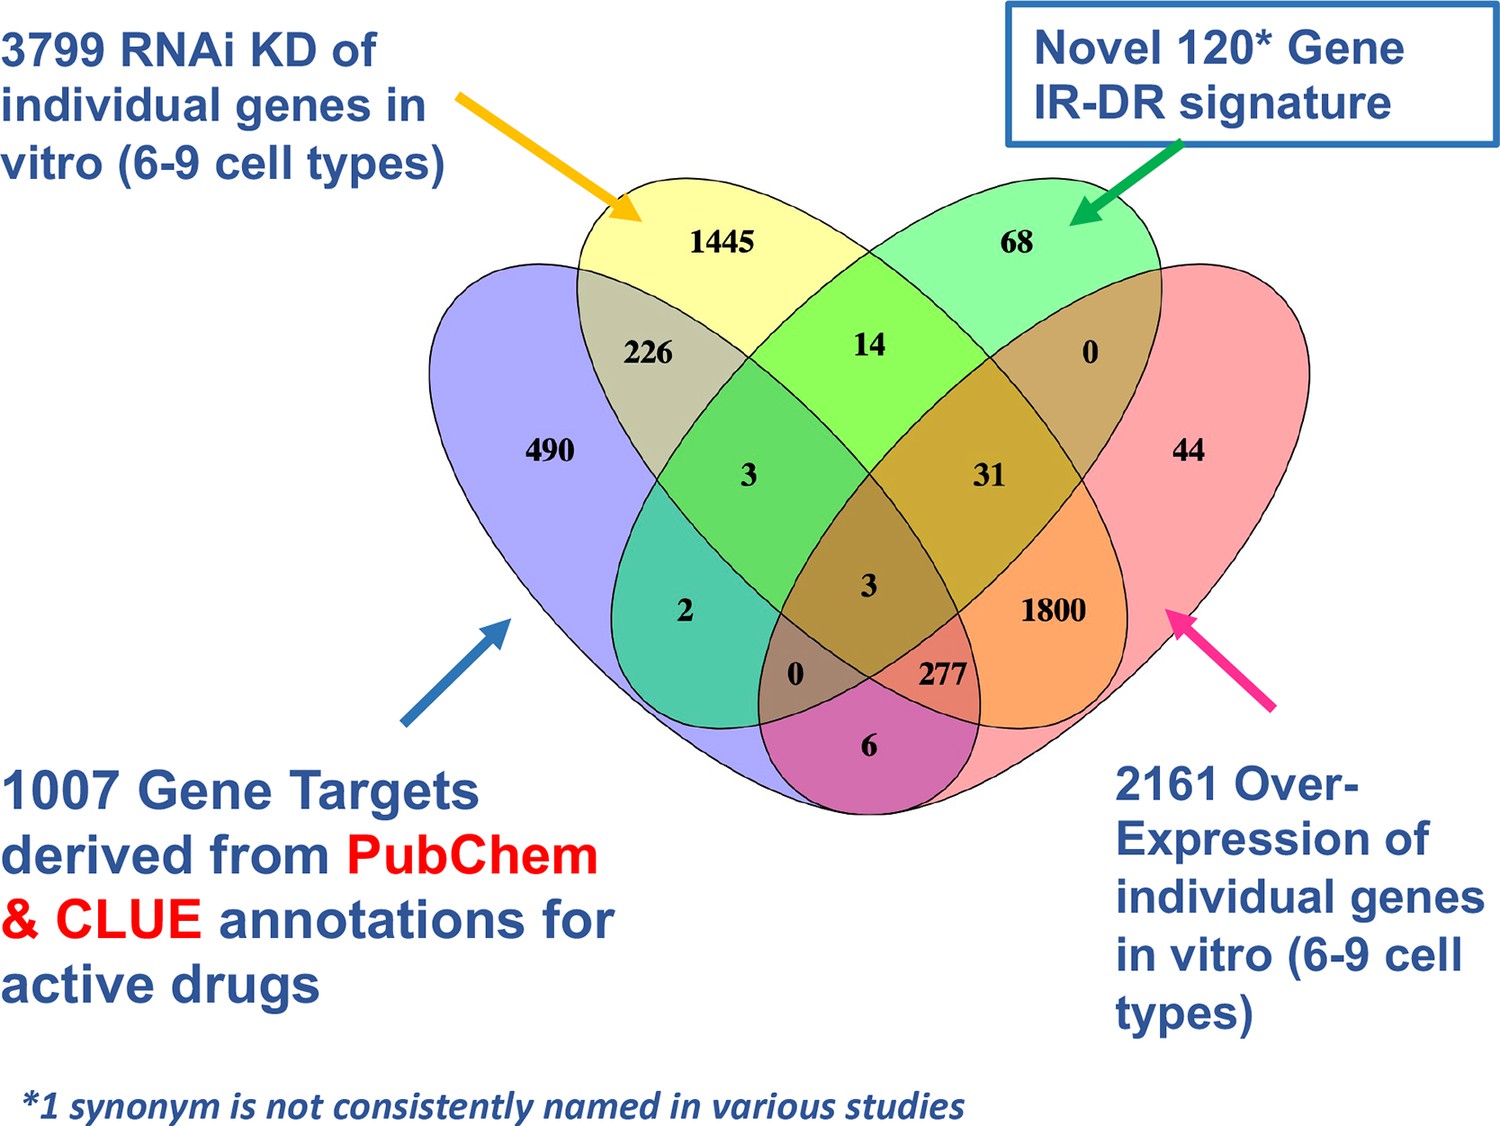
Venn diagram overlap of putative drug targets.
Comparison of drug signature, estimated protein targets of active drugs and knock-down (KD) and overexpression (OE) resources in CLUE that could be cross-compared with the insulin resistance-drug repurposing (IR-DR) signature.
Appendix 1—figure 8
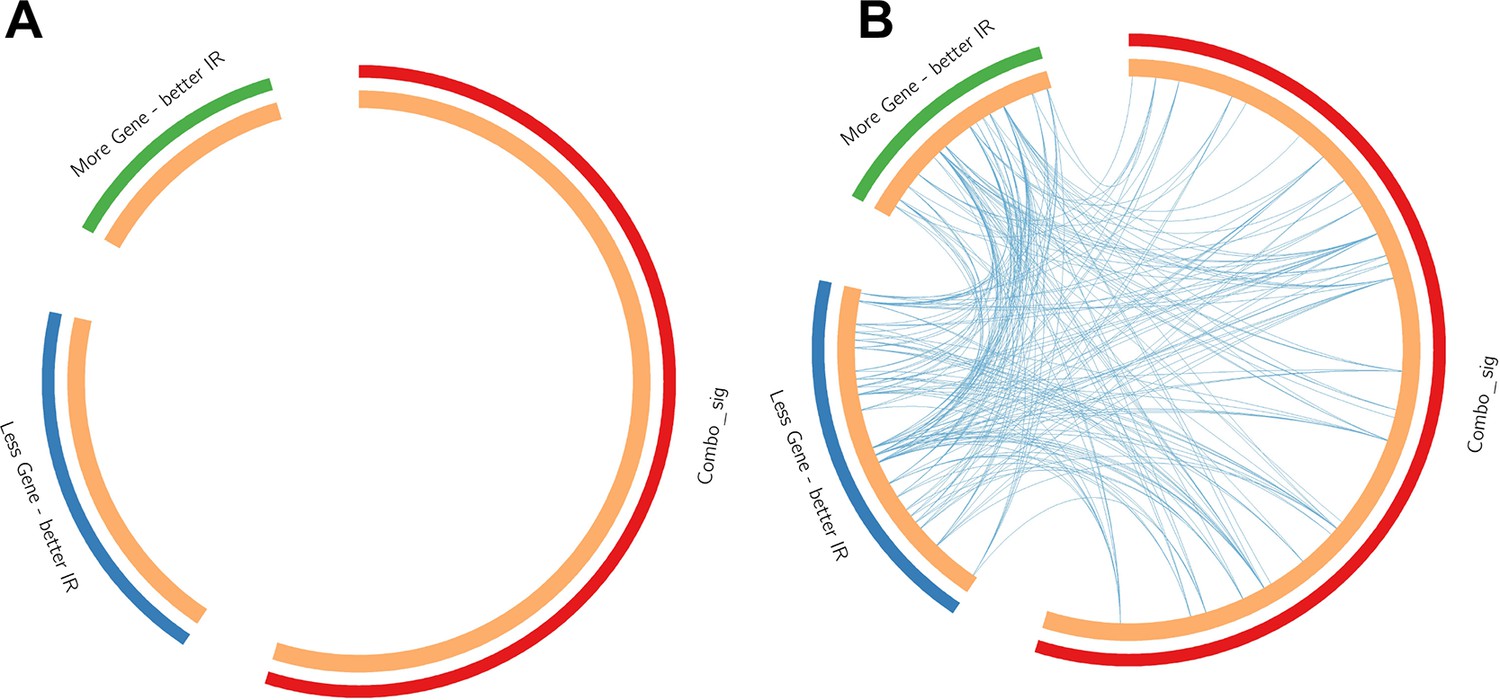
Contrast between gene list and pathway-level connections.
Comparison of insulin resistance-drug repurposing (IR-DR) drug signature genes with 73 knock-down/overexpression (KD/OE) validated proteins from the positively acting IR-DR drug list. This demonstrates that while (A) no individual validated protein targets were in the drug repurposing signature, many belonged to pathways that contained the known drug targets (B). Blue lines connect common pathways.
Appendix 1—figure 9
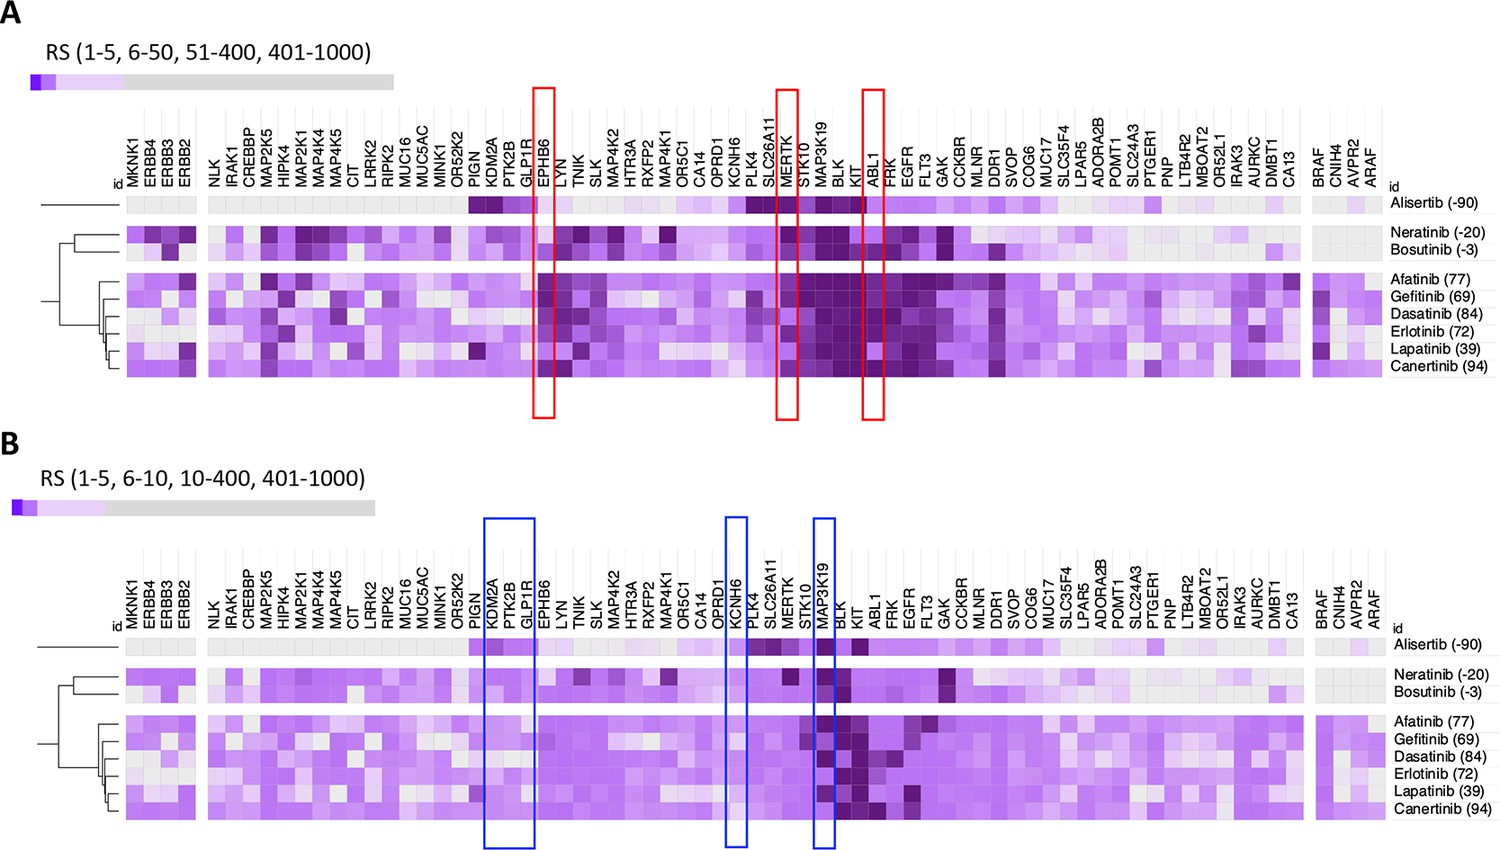
DeepPurpose-based target protein predictions.
(A) Identification of predicted positive mediators of a positive insulin resistance-drug repurposing (IR-DR) score agrees with the pharmacological analysis. (B) Identification of predicted negatively acting proteins, diminishing the strength of a positive IR-DR score, or cancelling out any positive activity, agrees with and extends the known pharmacology.
Appendix 1—figure 10
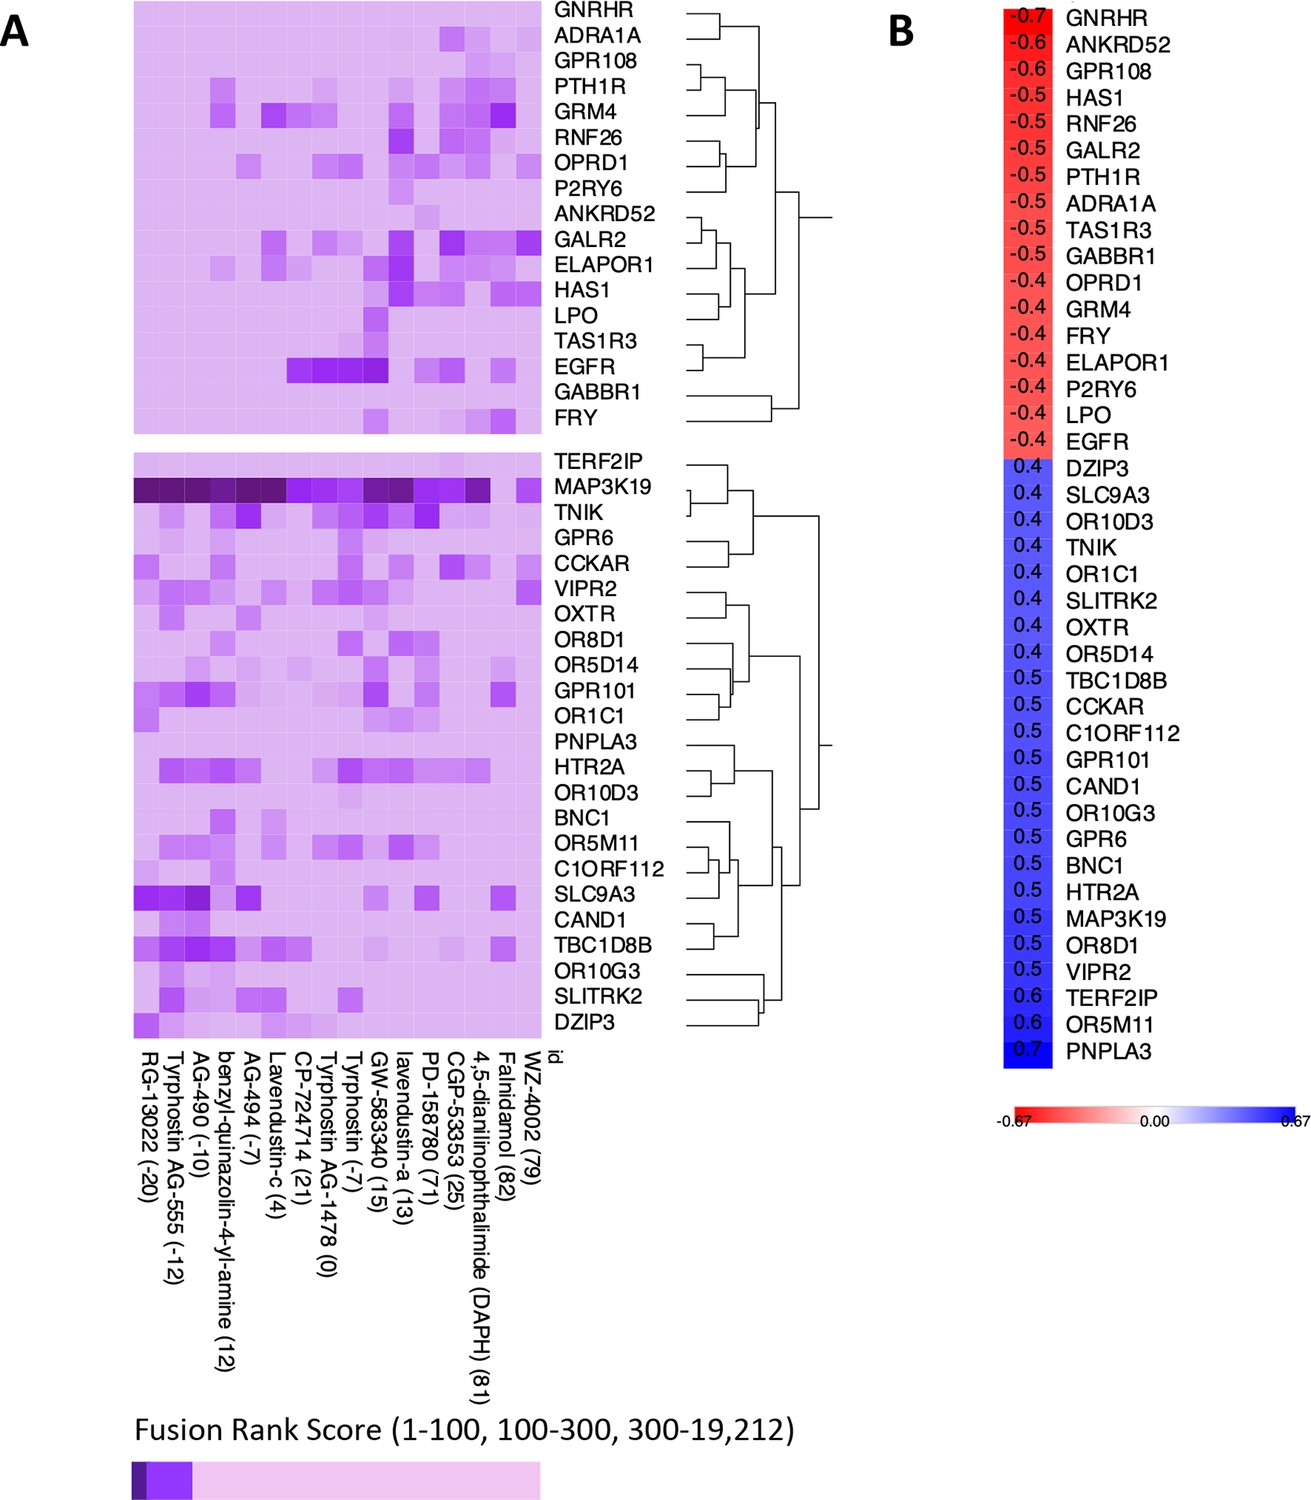
Exploratory analysis of predicted protein target affinity.
(A) Drugs that positively or negatively associate with the insulin resistance-drug repurposing (IR-DR) score applied to compounds with limited or no existing pharmacological data (other than for epidermal growth factor receptor [EGFR]). (B) Correlation between fusion rank score and IR-DR assay score for individual protein targets. For example, the more potent the predicted action was against MAP3K19 (smaller value) the poorer the IR-DR score was.
Appendix 1—figure 11
Transcripts related to HOMA2-IR, independent of donor chronological age, in muscle and adipose tissue.
Primary analysis relied on identifying RNA that tracked with HOMA2-IR in muscle as this tissue represented the largest number of independent data sets – for both fasting tissue status and response to lifestyle intervention. Thereafter the candidates identified in muscle were examined in adipose tissue. The statistical ‘significance’ of the relationship (e.g. FDR < 5%), the magnitude and direction of the linear relationship (correlation coefficient) all informed the final selection of marker genes. As can be observed, in this analysis, the fasting HOMA2-IR genes and the treatment response HOMA2-IR genes represent a largely independent pool of genes (only VCL, GSTO1, SEC31B, FERMT2, OGFOD3, CENPV and NDUFAF5 were common to both states).
Tables
Table 1
Examples of the major drug classes producing a positive insulin resistance-drug repurposing (IR-DR) score and associated literature evidencing efficacy.
In vivo refers to evidence for in vivo validation of the drug and/or its target proteins.
| Pathway | Example drug | Biology narrative | In vivo | Example literature |
|---|---|---|---|---|
| ATPase/cardiac glycoside | Proscillaridin, digoxin | Heart failure drug; possibly mimicking the action of metformin on mitochondria in vitro; senolytic. | No | Fürstenwerth, 2012; Triana-Martínez et al., 2019 |
| Calcium channel | Nifedipine | Restores autophagy, improves glucose tolerance and insulin action. | Yes | Iwai et al., 2011; Koyama et al., 2002; Lee et al., 2019; Sheu et al., 1991 |
| Calcium/calmodulin signalling | NM-PP1 | Insulin signalling upstream of p38; restores ATF6-related autophagy; insulin resistance, diabetes and Alzheimer’s pathophysiology. | Yes | Alfazema et al., 2019; Ozcan et al., 2015; Ozcan et al., 2013; Yin et al., 2017 |
| Dopamine | L-741626 | Central and peripheral role in regulation of glucose tolerance – contradictory/paradoxical behavioural/hepatic agonist/antagonist activity. | Yes | Amamoto et al., 2006; Fontaine et al., 2020; Kellar and Craft, 2020; Park et al., 2007; Stoelzel et al., 2020 |
| Tyrosine kinase/ERBB receptor inhibitors | Canertinib, gefitinib, afatinib | Inhibition of EGFR, DDR1, ABL1 and related kinases produces a positive IR-DR score. Extensive data link EGFR and inhibitors of EGFR to insulin resistance and neurodegeneration. Pro-inflammatory signalling via iRHOM2 and MAP3K7; circulating biomarker of insulin resistance and hepatic metabolic disease. | Yes | Chen et al., 2019; Chiu et al., 2020; Fowler et al., 2020; Kyohara et al., 2020; Li et al., 2018b; Skurski et al., 2020; Vella et al., 2019; Wang et al., 2012; Wu et al., 2017 |
| Glucocorticoid/anti-inflammatory | Valdecoxib, Spectrum_001832 | Anti-inflammatory; various steroidal and non-steroidal anti-inflammatory drugs reduce IR in a variety of models of diabetes/obesity. Excess corticosteroids induce IR. | Yes | Chakraborti et al., 2010; Chan et al., 2018; Reading et al., 2013 |
| Glucosylceramide synthase | BRD-K88761633, AMP-DNM | Glycosphingolipid biosynthesis – inhibition treats insulin resistance and fatty liver disease. | Yes | Aerts et al., 2007; Herrera Moro Chao et al., 2019 |
| Heat-shock protein 90 | Luminespib | ATPase cycle and chaperone function – inhibition improves insulin sensitivity; Hsp90 activated in dementia. Role in INSR turnover and protein phosphatase 5 activation. | Yes | Imamura et al., 1998; Jing et al., 2018; Shelton et al., 2017; Yang et al., 2005 |
| MAPK/MEK/ERK inhibitors | PD-184352, PD-0325901, XMD-892 | Multiple roles in insulin signalling and metabolism; inhibitors target multiple kinases. | Yes | Ozaki et al., 2016; Sharma et al., 2014; Tarragó et al., 2018; Wauson et al., 2013 |
| mTOR related | AZD-8055, WYE-354, torin-2 | Inhibition of mTORC1 activity – including knock-down of RAPTOR – produces a strong positive IR-DR score. In multiple studies, mTOR inhibition reduces age-related metabolic dysfunction. | Yes | Howell et al., 2017; Jahng et al., 2019; Morita et al., 2013; Nie et al., 2018a; Norambuena et al., 2017; Zhan et al., 2019 |
| Nicotinamide phosphoribosyltransferase | CAY-10618 (GPP78) | NAMPT (or visfatin) inhibitor which attenuates atherosclerosis in the high-fat-induced insulin resistance model and is anti-inflammatory. | Yes | Li et al., 2016; Lockman et al., 2010; Travelli et al., 2017 |
| Phosphodiesterase 5A | MBCQ, sidenafil | PDE5A is negative regulator of insulin, aspects of ageing – potentially via miR-22-3p. | Yes | Blagosklonny, 2017; Fiore et al., 2018; Fiore et al., 2016; Liu et al., 2019 |
| Phosphoinositide 3-kinase | AZD-6482, PI-103, GDC-0941 | Multiple PI3K inhibitors produce strong positive IR-DR scores. In multiple studies PI3K varies with metabolic dysfunction; however, all kinase inhibitors target multiple related kinases, so specific target unclear. | No | Chiu et al., 2020; Copps et al., 2016; Wang et al., 2020; Zou et al., 2004 |
| RAF kinase | AZ-628, vemurafenib | RAF1 is increased in obesity-induced IR, inhibitors can block insulin/AKT1/MAPK signalling in a context-specific manner. AZ-628 also RIP3 inhibitor – anti-arthritis strategy. | No | MacLaren et al., 2008; Osrodek et al., 2020; Sun et al., 2016 |
-
EGFR, epidermal growth factor receptor.
Key resources table
| Reagent type (species) or resource | Designation | Source or reference | Identifiers | Additional information |
|---|---|---|---|---|
| Software, algorithm | R | https://www.r-project.org/ | 3.6.3 and 4.04 | |
| Software, algorithm | Python | https://www.python.org/ | D1306 | |
| Software, algorithm | DeepPurpose | https://github.com/kexinhuang12345/DeepPurpose.git; Huang et al., 2021 | 2020 | |
| Software, algorithm | Venny | https://bioinfogp.cnb.csic.es/tools/venny/ | 2.10 | |
| Software, algorithm | Metascape | http://metascape.org/gp/index.html#/main/step1 | 2020 | |
| Software, algorithm | CLUE | https://clue.io/ | March 2020 | |
| Software, algorithm | PubChem | https://pubchem.ncbi.nlm.nih.gov/ | December 2020 | |
| Software, algorithm | PubMed | https://pubmed.ncbi.nlm.nih.gov/ | December 2020 | |
| Software, algorithm | SMS | https://labsyspharm.shinyapps.io/smallmoleculesuite/ | December 2020 | |
| Software, algorithm | iLINCS | http://www.ilincs.org/ilincs/signatures/search/ | March 2020 | |
| Software, algorithm | Morpheus | https://clue.io/morpheus | 2021 | |
| Software, algorithm | Code | Source_code_file.docx | - | R/Python code used in project |
Additional files
-
Transparent reporting form
- https://cdn.elifesciences.org/articles/68832/elife-68832-transrepform1-v2.docx
-
Supplementary file 1
Supplementary Tables 1–10.
- https://cdn.elifesciences.org/articles/68832/elife-68832-supp1-v2.xlsx
-
Source code 1
Computational code used in the present study.
- https://cdn.elifesciences.org/articles/68832/elife-68832-supp2-v2.zip
Download links
A two-part list of links to download the article, or parts of the article, in various formats.
Downloads (link to download the article as PDF)
Open citations (links to open the citations from this article in various online reference manager services)
Cite this article (links to download the citations from this article in formats compatible with various reference manager tools)
A human-based multi-gene signature enables quantitative drug repurposing for metabolic disease
eLife 11:e68832.
https://doi.org/10.7554/eLife.68832


